Note: Descriptions are shown in the official language in which they were submitted.
CA 02224993 1997-11-28
W 096/388~7 PCTrUS96~'5B~l
R~;VI~:NUIS ACCT.JRACY METER HAVING POWER QUALITY MEASTJREMENT
AND h~-l~O~ 0~ MEASURING POWER QUALITY
Field Of The Invention
This invention relates to electricity meters
such as used by commercial, industrial, or residential
customers of power utility companies and, more
particularly, to a revenue accuracy meter having
various operational capabilities such as power quality
measurement and/or energy management.
Backqround Of The Invention
Utility power distribution generally starts
with generation of the power by a power generation
facility, i.e., power generator or power plant. The
power generator supplies power through step-up
subtransmission transformers to transmission lines. To
reduce power transportation losses, the step-up
transformers increase the voltage and reduce the
current. The actual transmission line voltage
conventionally depends on the distance between the
subtransmission transformers and the users or
customers. Distribution substation transformers reduce
the voltage from transmission line level generally to a
range of about 2-35 kilo-volts ("kV"). The primary
power distribution system delivers power to
distribution transformers that reduce the voltage still
further, i.e., about 120 V to 600 V.
For background purposes, and future reference
herein, an example of a power utility distribution
system as described above and understood by those
skilled in the art is illustrated in Figures lA and lB
of the drawings. Power utility companies, and
suppliers thereto, have developed systems to analyze
and manage power generated and power to be delivered to
the transmission lines in the primary power
distribution system, e.g., primarily through
supervisory control and data acquisiti~n ("SCADA").
These primary power distribution analyzing systems,
CA 02224993 1997-11-28
W O 96/38897
PCTrUS96/08881
however, are complex, expensive, and fail to adequately
analyze power that is delivered to the industrial,
commercial, or residential customer sites through the
secondary power distribution system.
Also, various systems and methods of metering
power which are known to those skilled in the art are
used by commercial, industrial, and residential
customers of power utility companies. These power
metering systems, however, generally only measure the
amount of power used by the customer and record the
usage for reading at a later time by the utility power
company supplying the power to the customer. A revenue
accuracy meter is an example of such a metering system
conventionally positioned at a customer site to receive
and measure the amount of power consumed by the
customer during predetermined time periods during a
day.
Conventionally, electric power is delivered
to industrial, commercial, and residential customers by
local or regional utility companies through the
secondary power distribution system to revenue accuracy
type electricity meters as an alternating current
("AC") voltage that approximates a sine wave over a
time period and normally flows through customer
premises as an AC current that also approximates a sine
wave over a time period. The term "alternating
waveform" generally describes any symmetrical wavefo~m,
including square, sawtooth, triangular, and sinusoidal
waves, whose polarity varies regularly with time. The
term "AC" (i.e., alternating current), however, almost
always means that the current is produced ~rom the
application of a sinusoidal voltage, i.e., AC voltage.
In an AC power distribution system, the
expected frequency of voltage or current, e.g., 50
Hertz ("Hz"), 60 Hz, or 400 Hz, is conventionally
referred to as the "fundamental" frequency, regardless
of the actual spectral amplitude peak. Integer
CA 02224993 1997-11-28
--3--
multiples of this ~undamental frequency are usually
referred to as harmonic frequencies, and spectral
amplitude peaks at frequencies below the fundamental
are often referred to as ~sub-harmonics,ll regardless of
their ratio relationship to the fundamental.
Various distribution system and environmental
factors, however, can distort the fundamental
frequency, i.e., harmonic distortion, can cause spikes,
surges, or sags, an~ can cause blackouts, brownouts, or
other distribution system problems that greatly affect
the quality of power received by the power customer at
its facility or residence.
These revenue accuracy metering systems have
been developed to provide improved technique~ for
accurately measuring the amount of power used by the
customer so that the customer is charged an appropriate
amount and so that the utility company receives
appropriate compensation for the power delivered and
used by the customer. Examples of such metering
systems may be seen in U.S. Patent No. 5,300,924 by
McEachern et al. titled "Harmonic Measuring Instrument
For AC Power Systems With A Time-Based Threshold Means"
and U.S. Patent No. 5,307,009 by McEachern et al.
titled "Harmonic-Ad.justed Watt-Hour Meter." An article
by P. Corti et al, entitled "New Low Cost Technologies
for Monitoring Power Quality in Substations and
Industrial Sites", Proceedings of the 13th
International Conference on Electricity Distribution,
Brussels, Belgium, May 8-11 (1995), also discusses the
evolution of electricity measurement instruments and
outlines the requirements for multifunctional
electronic meters having bi-directional communication
channels between distributor and user. These
communications channels purportedly make it possible to
integrate the classic tariff calculations for billing
purposes, the measurement of voltage characteristics
for quality of service reporting and the rational
REPLACEMENT PAGE
~ME~ DSH~
CA 02224993 1997-11-28
W 096/38897 PCTrUS96108881
For example, one competitive advantage that
some utility companies may have over their competitors
could be a higher quality of the power supplied to and
received by the customer during certain time periods.
One company may promote the fact that it has fewer
times during a month that power surges reached the
customer causing potential damage to computer systems
or the like at the customer site. Another company may
promote that it has fewer times during a month when the
voltage level delivered to the customer was not within
predetermined ranges which may be detrimental to
electromagnetic devices such as motors or relays.
Previous systems for measuring quality of power in
general, however, are expensive, are bulky, require
special set up and are not integrated into or with a
revenue accuracy meter. Without a revenue accuracy
metering system that measures the quality of the power
supplied to and received by the customer and a metering
system wherein a power generator and/or the power
customer has access to this information, however, these
comparisons cannot be readily made.
Obiects And Summary Of The Invention
It is therefore an object of the present
invention to provide a revenue accuracy meter capable
of measuring the quality and amount of power received
by a power customer from a power generator such as a
utility company.
It is another object of the present invention
to provide a revenue accuracy meter capable of
providing energy management information and control to
a power customer.
It is still another object of the present
invention to provide a revenue accuracy meter capable
of measuring the quality and amount of power received
by a power customer from a power generator such as a
utility company and capable of providing energy
management information and control to a power customer.
CA 02224993 1997-11-28
W 096/~8897 PCTAUS~ 881
It is yet another object of the present
invention to provide a revenue accuracy meter capable
of isolating data control functions in a secure manner
between a power generator and a power customer so that
the power customer is capable of transmitting and
receiving data from the revenue accuracy meter separate
from the power generator.
It is a further object of the present
invention to provide a revenue accuracy meter which
provides compatible data communication interaction with
a SCADA control center and various utility company
groups such as operations, finance, engineering,
customer service, and marketing.
The present invention advantageously provides
a revenue accuracy meter having the combination o~
means for determining the quality of the power received
by the power customer during predetermined time periods
and means for measuring the amount of power used by the
customer during predetermined time periods. This
information about the quality and amount of power, for
example, not only provides competitive in~ormation ~or
utility companies and customers thereof, but also
provides troubleshooting information for utility
companies and customers in areas of power distribution
such as through a secondary distribution system. This
information can enable a utility company or customer to
identify areas or specific sources of power quality
problems caused by other users or by other problems in
areas such as large industrial equipment causing signal
problems.
More particularly, these and other objects of
the present invention are provided by a revenue
accuracy meter for measuring the amount and quality of
power received by a power customer such as across
electrical power lines. The meter preferably has a
variation determiner preferably for determining
undesired variations in an electrical signal
CA 02224993 1997-11-28
W O 96/38897 PCT~US~6/08PPl
representative of power received by a power customer
during a plurality of predetermined time periods. A
power usage measurer is coupled in electrical
communication with the variation determiner for
measuring the power usage of a customer responsive to
an electrical signal representative of a customer load.
The meter further has a communications interface
coupled in electrical communication with the variation
determiner and the power usage measurer for
communication signals representative of the undesired
power variations and the power usage.
A revenue accuracy meter of the present
invention preferably further includes a plurality of
data communication ports and a receiver and a
transmitter each respectively positioned fcr receiving
and transmitting data through the plurality of data
communication ports. At least one of the plurality of
data communication ports preferably is arranged for
data communications with a power customer and at least
one of the plurality of data communication ports
preferably is arranged for data communications with a
power generator. An energy management controller
preferably is connected to the receiver and the
transmitter for controlling power usage responsive to
predetermined electrical command signals received from
the power customer through the power customer port.
A method of measuring quality of power is
also provided according to the present invention. This
method preferably includes determining frequency and
duration of undesired variations in an electrical
signal representative of power received by a power
customer across electrical power lines during a
plurality of predetermined time periods and
communicating a signal representative of the undesired
power variations to a power generator. The method
preferably further includes measuring power usage of a
power customer responsive to an electrical signal
CA 02224993 1997-11-28
W 096/38897 PCTAUS9f'~f~1
representative o~ a customer load and communicating a
signal representative of the amount of power used
responsive to a command signal received from a power
generator.
By providing power quality and power usage
measurement, as well as other bene~icial ~unctions such
as energy management control, in a revenue accuracy
meter, the present invention provides a compact and
relatively inexpensive solution to the above-mentioned
problems. By providing data communications
capabilities with a revenue accuracy meter of the
invention, power generators or other third parties also
can thereby monitor power quality situations at
specific customer sites, i.e., including problems in
the secondary power distribution system, remote from
the power generating stations or SCADA control
~acilities. For example, a revenue accuracy meter
according to the present invention can provide utility
power companies the capability to improve customer
service, troubleshoot or diagnose problems, quickly
identify emergency situations, and systematically
analyze information from specific customer sites.
Brief Descri~tion Of The Drawinqs
Some of the ob~ects and advantages of the
present invention having been stated, others will be
more fully understood from the detailed description
that follows and by reference to the accompanying
drawings in which:
Figures lA and lB schematically illustrate an
environmental view of a revenue accuracy meter having
power quality measurement according to the present
invention;
Figures 2A and 2B schematically illustrate a
revenue accuracy meter having power quality measurement
arranged in communication with a power generator and a
power customer according to the present invention;
~ CA 02224993 1997-11-28
Figure 3 schematically illustrates a revenue
accuracy meter having power quality measurement
arranged in communication with various data
communication links according to the present invention;
Figure 4A illustrates a revenue accuracy
meter having process controllers having power quality
measurement according to the present invention;
Figure 4B schematically illustrates a
reactive power measurer of a revenue accuracy meter
according to the present invention;
Figures 5A and SB schematically illustrate a
flow chart of a digital signal processor of a revenue
accuracy meter having power quality measurement
according to the present invention;
~ 15 Figure 6 schematically illustrates a power
quality measurement system in a digital signal
processor of a revenue accuracy meter according to the
present invention;
Figures 7A, 7B, and 7C schematically
illustrate a variation determiner of a power quality
measure~ent system in a digital signal processor of a
revenue accuracy meter according to the present
invention; and
Figures 8A and 8B schematically illustrate a
revenue accuracy meter having power quality measurement
and energy management according to a second embodiment
of the present invention.
Detailed Descri~tion
. The present invention will now be described
more fully hereinafter with reference to the
accompanying drawings in which preferred embodiments of
the invention are shown. This invention may, however,
be embodied in many different forms and should not be
construed as limited to the illustrated embodiments set
forth herein; rather, these embodiments are provided so
that this disclosure will be thorough and complete and
will fully convey the scope of the invention to those
REPLACEMENT PAGE
~ME~JD~D SlI~E~
CA 02224993 1997-11-28
skilled in the art. Like numbers refer to like
elements throughout.
As illustrated in the schematic environmental
view of Figures lA and lB, utility power distribution
20 generally starts with generation of the power by a
power generation facility 21, i.e., power generator or
power plant. The power generator 21 supplies power
through step-up subtransmission transformers 21b to
transmission stations 23. To reduce power
transportation losses, the step-up transformers 21b
increase the voltage and reduce the current. The
actual transmission line voltage conventionally depends
on the distance between the subtransmission
transformers 21b and the users or customers, i.e.,
commercial, industrial, or residential 41, 42.
Distribution substation trans~ormers 25, 26, 27 reduce
the voltage from transmission line level generally to a
range o~ about 2-35 kilo-volts (~kv~). The primary
power distribution system 31 delivers power to
distribution transformers 28, 28a that reduce the
voltage still further, i.e., about 120 V to 600 v.
Conventionally, power utility companies and
suppliers have developed systems to analyze and manage
power generated and power to be delivered to the
transmission lines in the primary power distribution
system 31, e.g., primarily through supervisory control
and data acquisition ("SCADA") at a remote operations
center 22 such as illustrated. These operation centers
22 generally communicate with the generation facilities
21 and the substations 24, 25 through conventional data
communication terminals 21a, 24a, 25a. Because
problems currently arise in the secondary power
distribution system 36, i.e., from the distribution
substation to the customers, with respect to analyzing
power that is delivered to the industrial, commercial,
or residential customer sites through the secondary
power distribution system 36, a revenue accuracy meter
40, or a plurality of revenue accuracy meters 40 is
REPLACEMENT PAGE
~M~~DED SHEET
' CA 02224993 1997-11-28
--10--
provided having power quality measurement according to
the present invention and pre~erably is positioned as
illustrated (Flgures lA-lB) in the secondary power
distribution system 36 to provide a remote terminal or
node in the overal]. 9ystem 20 for troubleshooting or
diagnosing problems, identifying emergency situations,
and systematically analyzing information ~rom speci~ic
customer sites.
Figures 2A, 2B, and 3 schematically
illustrate a revenue accuracy meter 40 having power
quality measurement arranged in communication with a
power generator 80 such as a utility power company and
a power customer 60 according to the present invention.
A revenue accuracy meter 40 according to the present
invention is an electricity meter or an alternating
current static watt-hour meter used for billing
functions, i.e., billing meter. These revenue power or
electricity meters preferably are solid state meters
that at least meet American National Standards
Institute ("ANSI") 12.16, International
Electrotechnical Commission ("IEC") 687/1036 standard,
similar improved or revised standards, or the like, as
understood by those skilled in the art. As
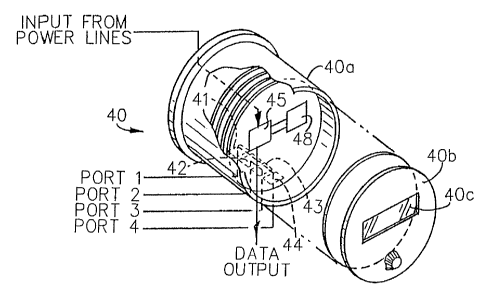
illustrated, the revenue accuracy meter 40 for
measuring the amount and quality of electrical power
received by a power customer 60 preferably has a
housing 40a and a communications interface which
preferably includes a plurality of data communication
ports 41, 42, 43, 44 positioned in the housing 40a
(also see Figures 3 and 4A).
Although four data communication ports 41,
42, 43, 44 are illustrated, a revenue accuracy meter 40
according to the present invention preferably has at
least two data communications ports. At least one of
the plurality of data communication ports 41, 42 ,43,
44 is arranged for data communications with a power
customer 60, e.g., a power customer port 41, and at
least one of the plurality of data communication ports
REPLACEMENT PAGE
~ME~JDED ~H~t
CA 02224993 1997-11-28
41, 42, 43, 44 is arranged for data communications with
a power generator, e.g., a power generator port 42, 43,
44.
The particular embodiment of the ports 41,
42, 43, 44 illustrated, however, advantageously
provides real time data communications with a plurality
o~ the various groups or departments of a utility
company 80 such as marketing 82, operations 83,
engineering 84, and/or billing/finance 85 (Figure 2B).
For example, power quality data may be utilized by the
customer service or the marketing group 82 receiving
data from a revenue accuracy meter 40 according to the
present invention by monitoring power outage,
sags/surges, and excessive harmonics. This information
can then be relayed, i.e., by sequential calls, to a
head o~~ice, key account representatives, and/or
cu,stomers 60. Power quality data may be utilized by
operations 83 to monitor voltage/current, KW/KVAR,
outages, and/or harmonics received by customers 60
through the meter 40 and to monitor trans~ormers, i.e.,
temperature, capacitors, and other control functions in
the power distribu~ion system 20.
The engineering group or department, for
example, may utilize the meter 40 and the data received
therefrom for moni~oring total harmonic distortion, for
capturing wave~orm data, ~or conducting spectral
analysis, as well as studying and analyzing outages and
sags/surges ~rom a diagnostic approach. The billing or
finance group 85, in turn, may conduct load or rate
research based upon information provided from the meter
40 about power quality and power usage. As understood
by those skilled in the art, the billing group 85 o~
the power generator 80, for example, can conduct TOU
metering, real-time pricing, transformer loss,
compensation, load profile, meter installation
integrity, meter wiring verification, load curtailment,
and/or various other functions. Also, these various
groups of the power generator 80 can also responsively
REPLACEMENT PAGE
~ME~DEDS~EET
CA 02224993 1997-11-28
interact with the substation controller 86 such as in
multi-drop meter application-s or to communicate with
remote terminal units ("RTUs"), printers, or the like.
Further, the power generator 80 can provide various
auxiliary inputs to the meter 40 such as transformer
oil temperaturç data, feeder subloads, redundant
metering data, status alarms, pressure data, and/or
other in~ormation as desired.
The customer, on the other hand, can receive
on-line data such as engineering units, energy cost,
subload data, alternate utility data, and other totals
or speci~ic information as needed. Preferably the
meter 40 also has customer programmed relay control
with security, utility alarming, demand prediction, and
energy management capabilities. Additionally, as also
illustrated in Figures 2A and 8A, a revenue accuracy
meter 40 according to the present invention ~urther has
an energy management controller 90 electrically
connected to the second receiver and the second
transmitter for controlling power usage responsive to
predetermined command signals received from the power
customer through the power customer port of the
communications interface. Likewise, the customer may
provide auxiliary inputs 62 to the meter 40 such as
alarms, status, production parameters, non-electrical
utility data, load curtailment data, subload data, as
well as other data as desired. The meter 40 may also
be monitored or utilized by the customer at a customer
central station 61 as illustrated. The data
communication ports also provide inter or intra-
customer communication, i.e., customer to utility or
other customer and communication within customer
~acility or locations.
REPLACEMENT PAGE
~U~NDE~S~E~t
CA 02224993 l997-ll-28
W 096/38897 PCT~US~'ngg~l
-13-
Either separate from the energy management
controller 90 or in con~unction therewith, a meter 40
according to the invention preferably further has an
access restricter 98 coupled in electrical
communication with the power generator port for
providing restricted access between the power customer
port and the power generator port. This security
access preferably is resident in one of the controllers
of the meter 40. This access restriction means or
access restricter 98 (see Figure 8B) preferably is
software programmed as understood by those skilled in
the art so that access is provided to either the power
customer or the power generator by a command signal
representative of a user password or a data access key.
This, in turn, provides a wall ~or security between
meter functions used by a customer 60 and meter
functions used by a power generator or other third
party 80.
Although, as understood by those skilled in
the art, the communication interface of a revenue
accuracy meter 40 may include any means for
communicating data to and from the meter 40, such as
using a probing device, an optical device, or a remote
device for interfacing with the meter 40, the
communications interface of a revenue accuracy meter 40
preferably includes one or more transceivers, e.g.,
universal asynchronous receiver/transmitter ("UART"),
positioned within the housing 40a of the meter 40 and
arranged to receive and transmit data signals through
3 0 the data communication ports 41, 42, 43, 44. According
to the invention, the communications interface
preferably includes at least one receiver positioned
for receiving an electrical signal representative of
voltage received across electrical power lines. The at
least one receiver is arranged for receiving electrical
signals through the power generator port. The at least
one receiver preferably also includes first and second
CA 02224993 1997-11-28
-14-
receivers and the at least one transmitter preferably
also includes first and second transmitters. The first
receiver is arranged ~or receiving electrical sig~als
through the power generator port 42, 43, 44, and the
second receiver is arranged for receiving electrical
signals through the power customer port 41.
t As best illustrated in Figure 3, the ports
for communicating with the power generator or utility
80 preferably are electrically connected to the
microprocessor or controllers 45, 48. These ports
preferably include an RS-232 interface port and/or a 20
milliampere ("mA") current loop 74, an optical port 73,
and two 71, 72 of either an internal modem, a direct
interface, a protocol converter, or an RS-485 port.
The internal modem is arranged for communicating with
utility customer or power customer auxiliary inputs and
outputs 62, 63. The direct interface ("I/F") is
arranged to connect to an external modem 51 which may
provide either additional or duplicative data to the
processors 45, 48. The protocol converter and the RS-
485 port are likewise arranged to provide data
communication to the operations center 22 as well as
the local area network ("LAN") of the utility company
or industrial consumer. The optical port 73 preferably
is arranged for data communication through a power
generator port to laptop computers or the like. The
current loop 74 provides secure data communication and,
preferably, is arranged for data communication with the
auxiliary inputs 81, 85 from the utility 80, such as an
encoder, printer, RTU, various software or hardware
tools, personal computer, remote data display, or the
like. The external modem 51, the SCADA 52, the LAN 53,
and the laptop computers 54 are connected in electrical
communication with the desired group 82, 83, 84, 86 of
the utility or power genera~or 80 as illustrated.
REPLACEMENT PAGE
~ME~IO~D S~T
CA 02224993 1997-11-28
W O 96/38897 PCTAUS9G~ B
Figures 4A-8B further schematically
illustrate a revenue accuracy meter 40 having power
quality measurement according to the present invention.
Figure 4A schematically illustrates the process
controllers, i.e., a digital signal processor 45 and a
main meter processor 48, for a revenue accuracy meter
40 having power quality measurement 200 according to
the present invention receiving power or voltage input
such as across power lines. For example, once the
power quality is determined and the power usage is
measured, electrical signals, or other data retrieval
means, are transmitted from the meter 40 to a power
generator, a power consumer, or other party desiring
the data, i.e., preferably through data communication
ports 41-44. By providing the two processors 45, 48
within the housing 40a of the meter 40, the meter 40
e~fectively operates as a remote computer terminal or
node in the power distribution system 20 for providing
various types of operational capabilities within the
meter 40, i.e, power quality measurement 200, energy
management 90, customer central station 61 interaction.
Data or other lnformation may also be visually
communicated to a user or meter reader by a display 40c
preferably positioned along a front face 40b of the
housing 40a.
Preferably within the digital signal
processor 45, as best illustrated in Figures 5A-8B, the
revenue accuracy meter 40 of the invention has means
for determining the presence of undesired variations in
the electrical signal representative of power received
by a power customer 60 across electrical power lines or
the like such as spikes, surges, sags, or harmonic
distortion, as well as blackouts, brownouts, and other
distribution system problems, i.e., alarm conditions.
The variation determining means preferably is a
variation determiner, or other power quality measurer
200, as illustrated coupled in electrical communication
CA 02224993 1997-11-28
W O 96138897 PCT~US96/08881
with the receiver for-determining frequency, i.e., time
periods or time occurances, and duration of undesired
variations in the received voltage signal during a
plurality of predetermined time periods. These
undesired signal variations are preferably minimum or
maximum threshold variations and/or timing frequency
variations of the supplied signal.
As best illustrated in Figures 5A and 5B, an
electrical signal representative of power received by a
power customer is received by the meter 40. The power
preferably is received as an analog voltage signal, but
may also include an analog current signal as
illustrated. This analog signal is preferably
converted to a digital signal such as with an analog-
to-digital converter as understood by those skilled in
the art. As understood by those skilled in the art,
the meter 40 of the present invention would also be
applicable to single-phase, three-phase, or other
multi-phase electrical power signals. The meter 40~ 20 receives the electrical signal from the power lines and
the voltage and/or current signal is sampled 101, 111
and digitized. Time compensators 102, 112 compensate
for time skew in sampling due to multiplexing a single
analog-to-digital converter. These preferably are
short FIR or smoothing filters with non-symmetrical
coefficients to get the proper time skew with a
reasonably flat frequency response.
The compensated signals then are respectively
received by low pass filters 103, 113. The current
signal passes through a fixed high pass filter 114 and
the voltage signal passes through an adjustable high
pass filter 104. A calibration factor 115, 135 is then
respectively applied to the filtered signals and the
signal is applied to the power quality measurement
system 200 of the meter 40 according to the present
invention. As understood by those skilled in the art,
the power quality measurement system 200, as well as
CA 02224993 1997-11-28
-17-
portions of the energy management controller 90, of the
meter 40 preferably is in the form of software and/or
hardware resid~nt within or in electrical communication
with the digital signal processor 45 of the present
invention, and as further described and illustrated
with respect to Figures 6-8B.
The revenue accuracy meter 40 as best
illustrated in Figures 5A-5B and 8A-8B also in
combination with the power quality measurement system
200 has means ~or measuring power usage of a customer
load o~ a power customer. The power measuring means
.. preferably is a power usage measurer 145, which
preferably includes a load detector, arranged for
receiving an electrical signal representative o~ a
customer load and for measuring the power usage of a
customer responsive to the electrical load signal. A
memory 131 pre~erably is coupled in electrical
communication with the variation determiner and the
power usage measurer of the meter 40 for storing signal
representative o~ the undesired variations in the
~received voltage signal and the power usage. At least
one transmitter preferably is coupled in electrical
communication with the memory 131 for transmitting
signals representative of the undesired voltage signal
variations and the power usage to a power generator 80.
The at least one transmitter, and preferably more than
one if desired, is responsive to a predetermined
command signal received by the at least one receiver
such as from the power generator 80 or power customer
60.
Once the power quality measurement, i.e.,
frequency and duration of undesired variations, has
been determined and preferably stored in a memory
device 131, such as memory resident in the processor
45, the power usage is then pre~erably measured by
initiating start customer load detector 125, 145. As
understood by those skilled in the metering art, these
REPLACEMENT PAGE
~ME~DE~SH~
CA 02224993 l997-ll-28
-18-
detectors 125, 145 preferably assure that relatively
very small signals, i.e., due to leakage current,
register as zero usage. The signal then passes
through delay adjustments 126, 146 to lower the
sampling rate, i.e., decimation. The delay adjustments
preferably allow the normal power measurement process
to run at a slower rate and therefore use less o~ the
resources of the microprocessor or digital signal
processor. The signal passes to a system configuration
block 147 to allow for special meter types such as a 2-
1/2 wye meter.
- As illustrated in Figure 5B, the signal
~urther passes through a ~iltering con~iguration 162
(see also Figure 4B) preferably such as illustrated.
The current signal pre~erably is applied to a low pass
~ilter 103A. This ~ilter 103A produces a phase shi~t
that approaches 90 degrees lag as the frequency of the
amplitude signal increases. This filter 103A also
produces an amplitude response that decreases with
frequency, which i9 compensated by the two FIR filters
103s and 104A as illustrated. The output of the
voltage FIR filter 104A is then applied to a low pass
filter 104B. Because the VAR measurement preferably
may require a 90 degree lag of voltage relative to
current, as understood by those skilled in the art, and
the current is lagged by 90 degrees already, an
additional lag of 180 degrees is needed in the voltage.
A signal inversion by an inverter 104D preferably
supplies this lag. The output of multiplier 129 is
then VARs with errors due to 103A only approaching 90
degrees. Multiplier 128 produces an error correction
signal of the correct level and phase to correct the
errors when summed in summer block 148. The scalers
103C, 104C, and 104E preferably adjust signal levels so
that watts and VARs have the same scale factors in the
system 162. The outputs of multipliers 151, 154, 161,
and 192 are the amperes squared, watts, volts squared,
and neutral amps squared as measured by conventional
REP ~ CEMENT PAGE
~ME~ED SHEElr
' CA 02224993 1997-11-28
-19--
metering. Multipliers 172, 175 and 182 preferably have
their input 60 Hertz fundamental removed by ~ilters 171
and 181 90 that their outputs are the harmonic amperes
squared, harmonic watts and harmonic volts squared. As
illustrated by FIG. 5B, multiplier 192 also has as its
input the output of a 3-phase current summer 191.
These values or quantities are then integrated in
accumulators 152, 155, 163, 165, 173, 176, 183, 193,
197 and copied 153, 156 ,164, 166, 174, 177, 184, 194,
198 for transmitting through the communication ports.
In addition, the harmonic amperes ~or the three phases
are summed and multiplied (Blocks 195, 196) to generate
harmonic neutral current squared. The original signal
prior to the filter is also checked at block 158. The
zero cross signal from block 158 causes the accumulator
copies 153, 156 ,1~4, 166, 174, 177, 184, 194, 198 to
have an integer number of cycles such as for stable
short term readings.
Figure 6 illustrates a power quality
measurement system 200 of the invention illustrated in
the form of a variation determiner. The variation
determiner of a revenue accuracy meter 40 of the
invention preferably includes a scaler 210 coupled in
electrical communication to the receiver for scaling
the voltage signals. The scaled signal is then summed
211, and a voltage cycle time determiner 212 is coupled
in electrical communication with the scaler and/or
squarer 210, i.e., through the summer 211, for
determining voltage cycle time. The scaler 210
preferably scales the size of the signal to assure
against math overfl.ows. The scaler 210 also preferably
squares the signal so as to make the meter responsive
to root mean square ("RMS") voltage. Half-cycle timing
213 and waiting 219 periods are preferably for
synchronizing or zeroing the sum 215 of the timing of
the system 200. Accumulation preferably occurs for
one-half cycle, passes the result to an FIR filter 216,
then clears the accumulator, i.e., ~ = 0.
REP~ACEMENT PAGE
~ME~I[)ED SHEET
CA 02224993 1997-11-28
-20-
The multiple tap FIR filter 216, i.e.,
preferably 1-6 taps, is coupled in electrical
communication with the cycle time determiner 212 for
smoothing and/or filtering the voltage squared signal.
The number 216a and the coefficients 216b for the taps
are input into the FIR signal smoothing device 216. It
will also be understood that the electrical signals as
illustrated in Figures 6-7C of the power quality
measurement system 200 are illustrative for the voltage
signals, but under appropriate current signal
characterization parameters may also include the
current signals. The variation determiner also further
includes a voltage handler 230 which preferably has a
comparator 231 coupled in electrical communication with
the filter 216 for comparing voltage signals to a
predetermined voltage threshold value and a time period
determiner 241, i.e., duration, coupled in electrical
communication with the voltage comparator 231 for
determining the time period that the voltage signal is
above or below the predetermined voltage threshold
value.
As best illustrated in F~igures 7A, 7B, and
7C, the variation determiner further more particularly
has a variation determining means, primarily in
software or computer program code, having a flow path
as illustrated. The input 229 is received from the
smoothing filter 215 into the voltage handler 230 and
the output is to the start load detector 145. The
voltage handler 230 upon completion preferably passes
program control to the start load detect 145 but no
data flows between these processes. The voltage
handler 230 preferably then stores power quality data
in a reporting system buffer or memory 131 (see Figure
8B) for the data communications tasks, i.e., through
data communication ports 41-44 (see Figure 3).
Referring now to FIG. 7A, the inputted
voltage signal passes to decision block 231 which
compares the voltage level with a predetermined
REPLACEMENT PAGE
.
~ E~J~ E~
CA 02224993 l997-ll-28
-21-
threshold. If the voltage is too high or greater than
a high limit, then a determination is made on whether
the voltage is greater than the previous maximum 232.
I~ the voltage is not greater than the high limit, a
check is made to see if it is less than a low limit,
Block 241 (see, e.g., FIG. 7B). The maximum and
minimum threshold values preferably include a tripping
value so that the voltage value preferably has a low
maximum trigger value and a high minimum trigger value.
I~ the voltage is greater than the previous maximum,
then the voltage is set to new maximum value 233 and
- the high time is compared 234. If high time is less
than the maximum predetermined time threshold 236a,
then the high time is incremented upward 235a and a
check is made to see if the low time is in the range
between the minimum time and the maximum time, Block
237. If the low time is in the range, then the low
time is stored in the output block, Block 238a, the
minimum voltage is initialized, Block 239a, and the low
time is initialized, Block 239c. Otherwise, ~ust the
low time is initialized. I~ the high time is neither
less than nor greater than the maximum time (i.e., high
time = maximum time), which means a recordable voltage
surge event has just occurred, the high time is
incremented upward, Block 235b, the high time is stored
in the output block, Block 238b, and the maximum
voltage is initialized, Block 239b. Finally, if the
high time is greater than the maximum time, Block 236b,
indicating that a voltage surge event of predetermined
duration has already occurred, the program exits.
Referring now to FIG. 7B, in the event the
voltage is not greater than the high limit, Block 231,
a decision is made as to whether the voltage is less
than a predetermined low limit, Block 241. If no, the
voltage is within range and control is passed to Block
251. If yes, a decision i9 then made to determine
whether the voltage is less than the previous minimum,
Block 242. If yes, the value "min" is set to the value
REPLACEMENT PAGE
~ME~ SffE~
CA 02224993 1997-11-28
of the voltage, Block 243. As illustrated by Block
244, a comparison is then made between the low time and
the maximum time, Block 244, by determining whether the
low time is greater than the maximum time, Block 246a
~which means a recordable voltage sag event of
predetermined duration occurred during a prior cycle),
whether the low time is equal to the maximum time,
Blocks 246b, 245a (which means a recordable voltage sag
event has just occurred during the current cycle), or
whether the low time is less than the maximum time,
Block 246b (which means a recordable voltage sag event
- has yet to occur). As illustrated by Blocks 245a, 248a
and 249a, i~ a recordable voltage sag event has just
occurred, the low time is incremented and stored in the
output block and the minimum voltage is initialized,
be~ore exiting. However, as illustrated by Blocks
245b, 247, 248b, 249b and 249c, if a recordable voltage
sag event has not yet occurred, the low time is
incremented and then a check is made to see if the high
time is in the range between the minimum time and the
maximum time, Block 247. If the high time is in the
range, than the high time is stored in the output
block, Block 248b, the maximum voltage is initialized,
Block 249b, and the high time is initialized, Block
249c, before exiting. Otherwise, just the high time is
initialized before exiting.
Referring now to FIG. 7C, checks are made to
determine the high and low times (depending on whether
a voltage surge or sag has occurred, respectively) are
within the range between the minimum time and maximum
time, Blocks 251, 261. If yes, the respective high or
low times are stored in the output blocks, Blocks 252,
262 and then the respective voltages and times are
initialized, Blocks 253, 254, before exiting. If no,
the respective voltages and times are just initialized,
Blocks 253, 254, before exiting.
As described above, each of the voltage
minimum and maximum values preferably having a tripping
REPLACEMENT PAGE
~M~ û S~lEEt
CA 02224993 1997-11-28
-23-
value or range which sends the signals into the logic
flow paths best illustrated in Figures 7A, 7B, and 7C.
The tripping or range, i.e., hysteresis effect, allows
for an upper and low value before a high or low is
determined to be registered by the system as an
undesired voltage signal. Otherwise the value is
determined to be in a normal desired range.
As illustrated by FIGS. 7C and 8B, the
outputs are then transferred to the memory 131 or data
communication ports 41-44 as the measuring by the meter
40 continues. This signal variation information
provided by the voltage handler 230 of the meter 40
which reflects the ~uality of power not only provides
competitive information for utility companies and
customers thereof, but also provides troubleshooting
in~ormation ~or utility companies and customers in
areas of power distribution such as through a secondary
distribution system.
Figures 8A and 8B further illustrates a
revenue accuracy meter 40 having the combination of
power quality measurement 200, power usage measurement
145, and energy management according to the present
invention. As illustrated, the revenue accuracy meter
40 receives a signal from a temperature controller or
HVAC controller from a customer 60 into a transducer
91. A signal is responsively converted to an
electrical signal by the transducer 91 and compared to
temperature, or other energy system data, to desired
predetermined setti.ngs 92. This data is then analyzed
by an energy analyzer 95 preferably to analytical
calculate optimum desired settings based on power cost
or billing data 94 and/or to perform various load
curtailment functions. The analyzer 95 then
responsively communicates to a power customer's energy
system to adjust temperature or other energy system
settings 93 as illustrated.
Because the revenue accuracy meter 40
preferably includes a power quality measurer 200, the
REPLACEMENT PAGE
~ME~IGEDSH~~
~ CA 02224993 1997-11-28
., ~... ..'
-23/1-
energy management controller 90 of the meter 40 can
advantageous include real time information to the power
customer 60 about the quality of power received and how
this affects the customer's energy usage and control
capabilities. Additionally, this information can then
be used to adjust billing calculations or projected
energy usage costs related to the quantity o~ power
used and/or the quality of the power supplied from the
power generator 80. It will also be understood by
those skilled in the art that such a meter 40 according
to the invention may also include information related
to a third party or same party power generator such as
a large industrial company, i.e., cogeneration. The
security access restricter 9~ as illustrated and as
previous described can provide the customer 60 with
data or information related to energy management and/or
power quality separate from the power generator 80. It
will also be understood that this security access
restricter 98 may be provided by the power generator 80
to allow the customer 60 only limited access to data
from the revenue accuracy meter 40 according to the
present invention.
The energy management controller 90 also
preferably provides centralized data retrieval and
management from the energy analyzer 95 responsive to
predetermined command signals from a customer 60.
These functional capabilities preferably include
spreadsheet interface, basic reporting, record-keeping,
overall system control, enhanced user interfaces, and
other real-time access to energy utilization data for
statistical manipulation and graphic presentation to
the customer 60. These manipulation capabilities
preferably are software driven with computer programs
resident in a microprocessor or memory in communication
therewith, and preferably include kilowatt load curves
for day, week, and month, kilowatt duration curves,
kVA/kQ load curves, power factor curves, energy
REP ~ CEMENT PAGE
~MEtiDzDSHEE~
~ CA 02224993 1997-11-28
. ~
.
-23/2-
worksheets/ demand worksheets, excessive reactive
worksheets~ ~uel recovery, contract minimum demand,
rate worksheets. billing dates table, demand history
table, season demand multiplier table, and predictive
monitoring. The communication is pre~erably through a
modem or other data communication interface, i.e., data
communication ports 41-44, with the customer 60 as
understood by those skilled in the art.
Also, acco--~ding to the present invention as
described above and as further illustrated in Figures
1-3B, methods o~ measuring the quality o~ power
received by a power customer 60 are provided. The
REPLACEMENT PAGE
~ t~GEDS~E~T
CA 02224993 1997-11-28
W 096/38897 PCT~US9G108881
-24-
method preferably includes determining frequency and
duration of undesired variations in an electrical
signal representative of power received by a power
customer 60 across electrical power lines during a
plurality of predetermined time periods and
communicating a signal representative of the undesired
power variations to a power generator 80. The method
preferably further includes measuring power usage of a
power customer 60 responsive to an electrical signal
representative of a customer load and communicating a
signal representative of the amount of power used
responsive to a command signal received from a power
generator 80 or other entity.
Another method of measuring the quality of
power supplied across electrical power lines by a power
generator 80 is further provided by the present
invention. The method preferably includes receiving an
analog signal representative of voltage received across
electrical power lines and converting the received
analog signal to a digital signal representative of the
voltage. The frequency and duration of undesired
variations in the digital voltage signal during a
plurality of predetermined time periods are then
determined. The data representative of these undesired
variations are then stored and signals representative
of the frequency and duration variations are
transmitted to a power generator 80 responsive to a
predetermined command signal received from the power
generator 80. The step of determining frequency and
duration of undesired variations preferably includes
comparing a voltage signal to a predetermined voltage
threshold value and determining a time period that the
voltage signal is above or below the predetermined
voltage threshold value. Further, the methods
preferably also includes measuring power usage of a
power customer responsive to an electrical signal
representative of a customer load, and communicating a
" ~ .~, CA 02224993 1997-11-28~
+~ ~9 '.3~t~5:~ ,
,.,~
-25 -
signal repre~entative o~ the amc~unt of power used
re~pon~;ive to a co~n.~ sign~l recei~red ~rom a ~owe~
gene~r~tcr. The pcwer usase a~so may therl be co~trQll~.d
re~pon~i~e to prede'ce~n~ned command qignal6 ~ec~ived
~rorn a power c~lstomer.
By providin~ power qualit~ and pclwer usage
mea~3urernent, a~ well a~ ~the~ bene~ iclal ~unct ions such
as ener3y manayement control 9 0, in a re~renue accuracy
raeter, the ~neter 40, a~d associated methods, of the
pre~ent i~entlon pravi~e6 a compact and relatively
ine~?en~i~re sc~lution t:o problems as~;ociated with pr~ or
~.~
de:vices and 5y9terll~;. ~dditionally, the data
communic~ti~n~ capabilities o~ a revenue ~c~uracy meter
4Q o~ the in~ention enhasces a power generator'3
c~pa~ility to ~o~it~r pow~r quality ~ituatiQn~ at
spe~ific customer 3ite~, i.e., i~cluding problems in
the ~econdary po~er di~tri~u~ion sy~te~ 36, remote ~rom
the power generatins stat~ons 21 or SCA~A control
~acilitie~ 2~. The~e problems, for example, may
include harmonic distortion, ~pikes, eurges or sags,
blackout~, brownout~, or ~ther ~i~tribution ~y~tem
problems that ~re~tly a~ect the guality o~ po~er
received by the power cu~to~er 60 at lts
indu~strial/comm~cial ~acili~y 41 Gr residence 42.
In the d_awings and ~peci~ication, there ha~
l:~een di~:clo~ed typical pre~rred em~o~; m~rlt~ o~ a
re~enue accuracy meter 4C, and ass~ciated method~,
according ~o the invention and, although speci~ic term~
are employed, they are used in a deficriptive ~en~e only
and not ~o~ purpc~es o~ li~ltation. The inventi~n ha~
been described in con~ide~able detail with ~peci~ic
re~erence to these variou~ ill~trated e~bodiment~.
~he inve~tion is defi~ed ~y the feature~ o~ the
independe~t clai~ and pre~erred embodimenta o~ the
~nvention are de~ined in the dependent claim~.
REPL~CEMEN~ PAGE
JC~D S~tFFT