Note: Descriptions are shown in the official language in which they were submitted.
CA 02263226 1999-02-15
WO 98/07022 PCT/US97/15269
10 A DIGITAL IMAGING SYSTEM FOR ASSAYS IN
JELL PLATES, GELS AND BLOTS
Field of The Invention
The present invention relates generally to assay
analyzing systems and, more particularly, concerns a system and
method for creating digital images of randomly arranged
specimens (e. g. beads within gels, colonies within petri
dishes) or specimens arranged in regular arrays (e.g. wells in
plastic plates, dots spotted onto membranes). The invention
is capable of creating digital images and performing automated
analyses of specimens which emit very low levels of
fluorescence, chemiluminescence, or bioluminescence. More
particularly, the invention is designed for the analysis of
luminance arising from assays within well plates and gel media,
and on membranes, glass, microfabricated devices, or other
supports.
Background of The Invention
Types of Assays
Many chemical and molecular biological assays are
designed so that changes in the absorbance, transmission, or
emission of light reflect reactions within the specimen.
Therefore, instruments used to quantify these assays must detect
alterations in luminance.
Wells. Some assays are conducted within discrete
flasks or vials, while others are performed within plastic plates
fabricated to contain a number of regularly spaced wells. "Well
plate" assays are higher in throughput and lower in cost than
similar assays in discrete containers. Standard well plates
CA 02263226 1999-02-15
WO 98/07022 PCTIUS97/15269
2
contain 96 wells in an area of 8 x 12 cm. The trend is to higher
numbers of wells, within the same plate size. Today's highest
commercial density is 384 wells. Very high density arrays of
small wells (microwells, e.g. thousands/plate with a fill volume
of less than 1 ul/well) are under development, and will become
commercially available as microwell filling and detection
technologies mature.
Dot blots. Grids of small dots (reactive sites)
are placed onto flat support membranes or slips of treated glass.
A high density grid can contain many thousands of discrete dots.
Grid assays usually involve hybridization with synthetic
oligonucleotides, to look for genes containing specific
sequences, or to determine the degree to which a particular gene
is active. Applications include library screening, sequencing
by hybridization, diagnosis by hybridization, and studies of gene
expression. High density grids provide the potential for very
high throughput at low cost, if analyzing the grids can be made
simple and reliable. Therefore, considerable commercial
attention is directed at companies developing technology for
creating, detecting, and analyzing high density arrays of genomic
sequences.
Combinatorial assays. Some assays involve small
particles (typically beads coated with compounds) which act as
the reactive sites. There might be many thousands of beads, each
coated with a different compound (e.g. molecular variants of an
enzyme) from a combinatorial library. These beads are exposed
to a substance of interest (e.g. a cloned receptor) in wells, or
in a gel matrix. The beads which interact with the target
substance are identified by fluorescence emission or absorption
in the region around each bead. Beads which interact are
surrounded by faint areas of altered luminance. Very sensitive
detectors are required to identify the subtle alterations in
luminance around the beads that interact with the target.
Electrophoretic separations. A solubilized sample
is applied to a matrix, and an electrical potential is applied
across the matrix. Because proteins or nucleic acids with
different amino acid or nucleotide sequences each have a
characteristic electrostatic charge and molecular size,
CA 02263226 1999-02-15
WO 98/07022 PCT/US97/15269
3
components within the sample are separated by differences in the
movement velocities with which they respond to the potential.
The separated components are visualized using isotopic,
fluorescent, or luminescent labels. In many cases (e. g.
chemiluminescence), the luminance from the specimen is very dim.
Assays which occur within a regularly spaced array of
active sites (wells, dot blots within a grid) can be referred to
as fixed format assays. Assays which involve specimens that are
irregularly distributed within a gel or blot matrix can be termed
free format assays.
Fixed format assays are usually performed without
imaging. In contrast, free format assays require the use of
image analysis systems which can detect and quantify reactions
at any position within an image.
Instruments designed for fixed format assays generally
lack imaging capabilities, and have not been applied to free
formats. Similarly, very few imaging instruments designed for
free formats have been applied to wells, and other fixed format
targets.
Nonimaging Counting Systems
Nonimaging counting systems (liquid scintillation
counters, luminometers, fluorescence polarization instruments,
etc.) are essentially light meters. They use photomultipliers
(PMTs) or light sensing diodes to detect alterations in the
transmission or emission of light within wells. Like a light
meter, these systems integrate the light output from each well
into a single data point. They provide no information about
spatial variations within the well, nor do they allow for
variation in the packing density or positioning of active sites.
Each PMT reads one well at a time, and only a limited
number of PMTs can be built into a counting system (12 is the
maximum in existing counting systems) . Though the limited number
of PMTS means that a only few wells are read at a time, an array
of wells can be analyzed by moving the PMT detector assembly many
times.
The major advantages of nonimaging counting systems
are that they are a "push-button" technology (easy to use), and
CA 02263226 1999-02-15
WO 98107022 PCTIUS97/15269
4
that the technology is mature. Therefore, many such instruments
are commercially available, and their performance is well-
characterized.
The major disadvantages of counting systems are:
a. Limited flexibility- few instruments can cope with 384
wells, and higher density arrays of fluorescent or
luminescent specimens are out of the question.
b. Fixed format only- designed as well or vial readers,
and cannot read specimens in free format.
c. Slow with dim assays- although scanning a few wells at
a time can be very fast when light is plentiful, dim
assays require longer counting times at each position
within the scan. As there are many positions to be
scanned, this can decrease throughput.
In summary, non-imaging counting systems are inflexible and offer
limited throughput with some specimens.
Scanning Imagers
For flat specimens, an alternative to nonimaging counting is a
scanning imager. Scanning imagers, such as the Molecular
Dynamics (MD) Storm, MD FluorImager, or Hitachi FMBIO pass a
laser or other light beam over the specimen, to excite
fluorescence or reflectance in a point-by-point or line-by-line
fashion. Confocal optics can be used to minimize out of focus
fluorescence (e.g. the Biomedical Photometrics MACROscope), at
a sacrifice in speed and sensitivity. With all of these devices,
an image is constructed over time by accumulating the points or
lines in serial fashion.
Scanning imagers are usually applied to gels and blots, where
they offer convenient operation. A specimen is inserted and,
with minimal user interaction (there is no focusing, adjusting
of illumination, etc.), the scan proceeds and an image is
available. Like the nonimaging counting system, the scanning
imager is usually a push-button technology. This ease of use and
reasonably good performance has lead to an increasing acceptance
of scanning imagers in gel and blot analyses.
Scanning imagers have four major shortcomings:
CA 02263226 1999-02-15
WO 98/07022 PCT/US97/15269
a. Slow scanning. The beam and detector assembly must be
passed over the entire specimen, reading data at each
point in the scan. Scanning a small specimen could
easily take 5-10 minutes. A large specimen might take
5 ~ hour to scan. This slow scan limits throughput, and
complicates the quantification of assays that change
during the scan process.
b. Limited number of wavelengths. A limited number of
fluorescence excitation wavelengths is provided by the
optics. Therefore, only a limited number of assay
methods can be used.
c. Low sensitivity. Most scanning imagers exhibit lower
sensitivity than a state of the art area imager.
d. Not appropriate for Iuminescence. Scanning imagers
require a bright signal, resulting from the
application of a beam of light to the specimen.
Therefore, specimens emitting dim endogenous
luminescence (e.g, reactions involving luciferase or
luminol) cannot be imaged.
e. Not appropriate for wells. Only flat specimens can be
imaged. A limited number of confocal instruments can
perform optical sectioning and then reconstruct the
sections into a focused thick image.
Area Imaging
An area imaging system places the entire specimen onto
a detector plane at one time. There is no need to move PMTs or
to scan a laser, because the camera images the entire specimen
onto many small detector elements (usually CCDs), in parallel.
The parallel acquisition phase is followed by a reading out of
the entire image from the detector. Readout is a serial process,
but is relatively fast, with rates ranging from thousands to
millions of pixels/second.
Area imaging systems offer some very attractive
potential advantages.
a. Because the entire specimen is imaged at once, the
detection process can be very quick.
CA 02263226 1999-02-15
WO 98/07022 PCT/US97/15269
6
b. Given an appropriate illumination system, any excitation
wavelength can be applied.
c. Luminescence reactions (emitting light without incident
illumination) can be imaged, including both flash and
glow bioluminescence or chemiluminescence.
d. Free or fixed format specimens can be imaged.
Luminescence imaging is more easily implemented, in that
illumination does not have to be applied. However, most
luminescence reactions are quite dim, and this can make extreme
demands upon existing area imaging technology. The standard
strategy is to use sensitive, cooled scientific grade CCD cameras
for these types of specimens. However, in the absence of the
present invention, integrating cameras will fail to image many
luminescent specimens. Therefore, the present invention can
image specimens that other systems cannot.
Typical prior art systems apply area imaging to
luminescent assays on flat membranes and luminescent assays in
wells. Standard camera lenses are always used. The results of
well imaging are flawed, in that there is no correction for
parallax error.
There is more extensive prior art regarding use of area
imaging in fluorescence. Fluorescence microscopy (see Hrooker
et al. US Patent No. 5,332,905) and routine gel/blot imaging are
the most common applications. Prior art in microscopy has little
relevance, as no provision is made for imagine large specimen
areas.
The existing art relating to macro specimens is
dominated by low cost commercial systems for routine gel/blot
fluorescence. These systems can image large, bright areas using
standard integrating CCD cameras. However, they have major
disadvantages:
a. Limited to the wavelengths emi tied by gas discharge
lamps. Typically some combination of UVA, UVB, UVC,
and/or white light lamps is provided. Other wavelengths
cannot be obtained.
CA 02263226 1999-02-15
WO 98/07022 PCT/US97/15269
7
b. Wavelengths cannot be altered during an assay. If the
illumination must be changed during the assay (e.g. as
for calcium measurement with fura-2 ) , the devices cannot
be adapted.
c . Insensi ti ve to small a1 tera ti ons in fl uorescence .
Transillumination comes from directly below the specimen
into the detector optics. Therefore, even very good
filters fail to remove all of the direct illumination,
and this creates a high background of nonspecific
illumination. Small alterations in fluorescence
(typical of many assays) are lost within the nonspecific
background.
d. Inefficient cameras and lenses. A very few systems use
high-performance cameras. Even these few systems use
standard CCTV or photographic lenses, which limit their
application to bright specimens.
e. Parallax error precludes accurate we~1 imaging. As
fast, telecentric lenses have not been available, these
systems exhibit parallax error when imaging wells.
Novel features of the present invention minimize the
disadvantages of known macro fluorescence systems. These novel
features include:
a. Illumination wavelengths may be selected without regard
to the peaks) of a gas discharge lamp or laser.
b. Using a computer-controlled filter wheel or other
device, illumination may be altered during an assay,
c. Small alterations in fluorescence emission can be
detected. Because fluorescence illumination comes via
epi-illumination, or from a dorsal or lateral source,
direct excitation illumination does not enter the
optics. This renders the nonspecific background as low
as possible.
d. Very efficient camera and lens system allow use with dim
specimens.
e. Unique telecentric lens is both very fast, and removes
parallax error so well plate assays are accurate.
A primary advantage of the present invention is its
fast, telecentric lens, which can image an entire well plate at
CA 02263226 2005-O1-05
8
once, and which can provide efficient epi-illumination to
transparent or opaque specimens. Fiber optic coupling to the
specimen can be used instead of lens. coupling. For example, a
fiber optic lens has been used with an image intensified CCD
S camera run in photon counting mode for analyses of data in fixed
or free formats. This approach yields good sensitivity, but has
the foiiowing major disadvantages:
a. Although it is suggested that the system could be used
with fluorescent specimens, it would be limited to
20 specimens that are transilluminated, because there is na
place to insert an epi-illumination mechanism.
Therefore, the fiber lens system would have degraded
sensitivity, and could not be used with opaque
specimens. Many specimens are opaque (e. g. many well
15 plates, nylon membranes).
b. Well plates are 8 x 12 cm. Image forming fiber optics
of this size are very difficult and expensive to
construct. Therefore, the specimen would have to be
acquired as a number of small images, which would then
20 be reassembled to show the entire specimen.
This multiple acquisition would preclude use of the
device with assays which change over time.
An area imaging analysis system tLUANA~ is disclosed by
D. Neri et al. ("Multipurpose High Sensitivity Luminescence
25 Analyzer", Biotechniques 20:708-713, 199Ei), which uses a cooled
CCD, side-mounted fiber optic illuminator, and an excitation
filter wheel to achieve some functions similar to the present
invention (selection of wavelengths, area imaging). However,
LUANA uses a side-mounted fiber optic, which is widely used in
30 laboratory-built systems, and creates problems that are overcome
by the present invention. Specifically, use of a side-mounted
fiber'optic provides very uneven illumination, particularly when
used with wells. The epi- and transillumination systems of the
present invention provide even illumination of both flat
35 specimens and wells. Further, in LUANA, parallax would preclude
imaging of assays in wells.
Another system (Fluorescence Imaging Plate Reader -
FLIPF~ of NovelTech Inc., Ann Arbor MI) uses an area CCD to detect
*trademarks
CA 02263226 1999-02-15
WO 98/07022 PCT/US97/15269
9
fluorescence within 96 well plates. This device is a nonimaging
counting system, and uses the area CCD instead of multiple PMTS.
To achieve reasonable sensitivity, it runs in 96 well format and
bins all pixels within each well into a single value. The device
is not applicable to luminescence imaging, free format imaging,
or higher density well formulations and is very costly.
There is extensive prior art in the use of imaging to
detect assays incorporated within microfabricated devices (e. g.
"genosensors"). Some genosensors use scanning imagers, and
detect emitted light with a scanning photomultiplier. Others use
area CCDs to detect alterations at assay ,sites fabricated
directly onto the CCD, or onto a coverslip that can be placed on
the CCD. Genosensors have great potential when fixed targets are
defined. For example, a chip is fabricated that looks for a
specific sequence of genomic information, and this chip is used
to screen large numbers of blood samples. While highly efficient
for its designed sequence, the chip has to contain a great number
of active sites if it is to be useful for screening a variety of
sequences. Fabrication of chips with many thousands of sites is
costly and difficult. Therefore, the first generation of
genosensors will be applied to screening for very specific
sequences of nucleotides.
The inflexibility of the microfabricated device
contrasts with the present invention, which does not require
microfabrication of the assay substrate. Instead, the present
invention permits assays to be conducted in wells, membranes,
silicalized slides, or other environments. Almost any reaction
may be quantified. Thus, the present invention could be used as
an alternative technology to microfabrication. Because the
present invention is flexible, and allows almost any chemistry
to be assayed, it can be used for all phases of assay
development. These include prototyping, and mass screening. The
invention therefore provides an alternative to microfabrication,
when microfabrication is not feasible or cost-effective.
Each of the prior art references discussed above treats
some aspect of imaging assays. However, the prior art does not
address all of the major problems in imaging large specimens at
CA 02263226 2005-O1-05
low light levels. The major problems in low light, macro imaging
are:
a. very high detector sensitivity required;
b. flexible, monochromatic,illumination of large areas is
required;
c. parallax error must be avoided; and
d. more reliable procedures are needed to find and quantify
targets.
Obiects and summary of the invention
Broadly, it is an object of the present invention to
provide an imaging system for assays which overcomes the
shortcomings of prior art systems. It is specifically intended
to provide a complete system for the area imaging of assays in
wells and on membranes . Tt is specifically contemplated that the
invention provide a complete system for the area imaging of
chemiluminescent, fluorescent, chemifluorescent, bioluminescent,
or other nonisotopic hybridization assays, including high density
dot blot arrays.
It is another object of the invention to image
chemiluminescent, fluorescent, chemifluorescent, bioluminescent,
or other nonisotopic assays, including combinatorial assays, in
free format.
It is an object of the invention to provide software for
digital deconvolution of the fluorescence image data.
Application of the software decreases flare and out of focus
information.
It is also an object of the present invention to provide
a method and system for imaging assays which are flexible,
reliable and efficient in use, particularly with low level
emissions.
According to one aspect of the invention, there is provided a digital
imaging system for assays, the system including a lens subassembly and an
30 imaging subassembly disposed behind the lens subassembly for forming an
CA 02263226 2005-09-O1
10a
image of a specimen disposed in front of the lens subassembly, the lens
subassembly comprising:
a lens, including a front lens element and having an optical axis; and
a source of light disposed within said lens behind said front lens element and
constructed so as to direct light towards said front lens element and out of
said
lens, wherein said lens is free of a dichroic mirror, yet transmits excitation
light
from said source towards the specimen, and further transmits emission light
backwards from the specimen towards the imaging subassembly, free of said
excitation light.
According to another aspect of the invention, there is further
provided a lens subassembly for use in a digital imaging system for assays
including an imaging subassembly disposed behind the lens subassembly for
forming an image of a specimen disposed in front of the lens subassembly, the
lens subassembly comprising:
a telecentric macro lens, including a front lens element and having an optical
axis; and
a source of light disposed within said lens behind said front lens element and
constructed so as to direct light towards said front lens element and out of
said
lens, wherein said lens is free of a dichroic mirror, yet transmits excitation
light
from said source towards the specimen, and further transmits emission light
backwards from the specimen towards the imaging subassembly, free of said
excitation light.
According to another aspect of the invention, there is further
provided in a digital imaging system for assays, the system being of the type
including a lens subassembly and an imaging subassembly disposed behind the
lens subassembly for forming an image of a specimen disposed in front of the
lens subassembly, an illumination subassembly positioned forward of the
specimen, comprising:
a planar diffusing plate positioned forward of the specimen in close proximity
thereto; and
CA 02263226 2005-09-O1
10b
a plurality of optical fibers, each having a first end adapted to be connected
to a
source of light and a second end disposed forward of said diffusing plate and
oriented so that light emitted therefrom is substantially perpendicular to the
plane of the diffusing plate, the optical fibers being arranged so that the
spacing
therebetween is greater at the center of the diffusing plate than at its
periphery.
The present invention provides synergistic cpmbination
of detector, lens, imaging system, and illumination technologies
which makes it able to image the types of specimens previously
acquired With nonimaging counters and scanning imagers. In
Particular, it can be used with fixed or free formats, and with
wells or flat specimens. It is able to detect fluorescence,
luminescence, or transmission of light.
CA 02263226 1999-02-15
WO 98/07022 PCT/US97/15269
11
The features of the invention include that it detects
and quantifies large arrays of regularly spaced targets, that it
detects and quantifies targets that are not arranged in regular
arrays, and that it performs automated analyses of any number of
regularly spaced specimens, from small numbers of large wells to
large numbers of very small wells or dot blots.
It is another feature of the invention to provide an
area illumination system that: can deliver homogenous
monochromatic excitation to an entire well plate or similarly
sized specimen, using standard and low cost interference filters
to select the excitation wavelength; and can deliver varying
wavelengths of homogenous monochromatic excitation to an entire
well plate or similarly sized specimen, under computer control.
A system embodying the invention provides a lens
designed specifically for assays in the well plate format. This
lens is very efficient at transferring photons from the specimen
to the CCD array (is fast), preferably contains an epi
illumination system, and can be used with very dim specimens .
The lens is also telecentric. A telecentric lens has the
property that it peers directly into all points within a well
plate, and does not exhibit the parallax error that is
characteristic of standard lenses.
A preferred system provides a telecentric and fast lens
that generates an even field of epi-illumination, when required.
The lens is equipped with an internal fiber optic illumination
system, that does not require a dichroic mirror. Preferably, the
lens is constructed to accept an internal interference filter
used as a barrier filter. Light rays passing through the lens
are almost parallel when they strike the barrier filter, so that
the filter operates at its specified wavelength and bandwidth
tolerance.
It is a feature of the invention that it provides high
light gathering efficiency, whether used with a fast telecenric
lens, or standard photographic lenses.
A preferred system provides a CCD area ~~rray camera that
has high quantum efficiency (approximately 80%), and high
sensitivity (16 bit precision), so that most specimens can be
detected by integration without intensification. Preferably, the
CA 02263226 1999-02-15
WO 98/07022 PCT/US97/15269
12
system has an integrating, cooled CCD camera which has coupled
thereto an optional image intensifier. In an emLodiment intended
for extremely low light levels, incident illumination from the
specimen is amplified by the intensifier, and the amplified light
is accumulated onto the integrating camera over an integration
period. At the end of the integration period, the camera is read
out to a dedicated controller or imaging apparatus to reproduce
the light image. Multiple exposures may be used to increase the
dynamic range of the camera. A light-tight specimen chamber is
provided, to which all illumination and detection components may
be mounted, and which contains the specimens.
A system in accordance with the invention may
incorporate a translation stage (optional), that may be housed
within the light-tight chamber and used to move large specimens
(e.g. 22 x 22 cm membranes) past the optical system. The
invention controls the stage motion through software, and that
creates a single composite image from the multiple "tiles"
acquired with the translation stage.
Preferably, the invention provides software control that
corrects the shading, geometric distortion, defocus, and noise
errors inherent to the camera and lens system; and that removes
as much nonspecific fluorescence as possible, using multiple
images created with different excitation filters.
In particular, the invention provides software to
deconvolve images from a single focal plane, using optical
characteristics previously measured from the lens and detector
system. It should be appreciated that data from multiple focal
planes may also be deconvolved.
While the preferred embodiment of the invention uses a
high-precision, cooled CCD camera, if cost is a major factor, the
present invention could be constructed using lower cost
integrating cameras. In this case, shorter integration periods
can be achieved, with a reduction in image quality and ultimate
sensitivity.
Brief Description of The Drawincrs
Further objects, features and advantages of the
invention will be understood more completely from the following
CA 02263226 1999-02-15
WO 98/07022 PCT/US97/15269
13
detailed description of a presently preferred, but nonetheless
illustrative embodiment, with reference being had to the
accompanying drawings, in which:
Figure 1 is a schematic illustration of a system in
accordance with a first preferred embodiment (upright) of the
invention;
Figure 2 is a schematic illustration, in side view, of
the fast, telecentric lens;
Figure 3 is a detailed illustration of the optical and
mechanical components of the lens and the emission filter holder;
Figure 4 is a schematic diagram illustrating a second
embodiment of a system in accordance with the invention useful
for extreme low light applications, which has an intensifier
mounted between the lens and the CCD camera;
Figure 5 is a schematic illustration of the intensifier;
Figure 6 is a schematic illustration of the diffuse
illumination plate in side view, showing how discrete fiber
bundles from the main bundle are taken to locations within the
rectangular fiber holder;
Figure 7 is a schematic illustration of the diffuse
illumination plate in top view, showing how discrete fiber
bundles from the main bundle are taken to an array of channels
within the fiber holder;
Figure 8 is schematic diagram of the CCD camera;
Figure 9 is a flow chart illustrating the method
utilized for image acquisition and analysis in accordance with
the present invention; and
Figure 10 is a flow chart illustrating the method
utilized for locating targets in the process of Fig. 9.
Detailed Description of The Preferred Embodiments
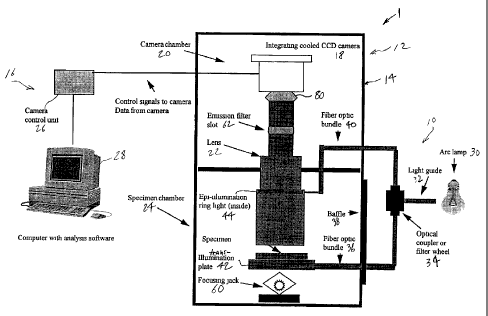
Turning now to the details of the drawings, Fig. 1 is a
schematic diagram illustrating a preferred embodiment of an
imaging system 1 in accordance with the present invention.
System 1 broadly comprises an illumination subsystem 10, an
imaging subsystem 12 provided in an housing 14, and a control
subsystem 16. The imaging subsystem 12 comprises a CCD camera
CA 02263226 1999-02-15
WO 98/07022 PCT/LTS97/15269
14
subsystem 18 housed within a camera chamber 20 of housing 14 and
a lens subassembly 22 extending between camera chamber 20 and a
specimen chamber 24. In operation, illumination subsystem 10
provides the necessary light energy to be applied to the specimen
within chamber 24. Light energy emitted by the specimen is
transmitted through lens subsystem 22 to camera 18, where an
image is formed and transmitted to the control subsystem 16 for
processing. Control subsystem 16 comprises a camera control unit
26, which is a conventional unit matched to the particular camera
18 and a computer 28 which is programmed to control unit 26 and
to receive data from camera 18, in order to achieve unique
control and processing in accordance with the present invention.
The light source for the illumination subsystem 10 is
preferably an arc lamp 30. Light from lamp 30 is conducted via
a liquid light guide 32 to the optical coupler or filter wheel
34. The liquid light guide 32 is advantageous in that it
transmits in the W range, and in that it acts to diffuse the
input illumination more than a fiber optic would do.
The optical coupler 34 contains a conventional filter
holder (not shown) for standard, one inch diameter interference
filters. In the preferred configuration, a computer controlled
filter wheel is used instead of the optical coupler. The filter
wheel can contain a number of filters, which can be rapidly
changed under computer direction.
A fiber optic bundle 36 carries illumination from the
optic coupler or filter wheel 34 to within the light-tight
specimen chamber 24. The bundle 36 passes through a baffle 38,
which allows it to move up and down during focusing of the
specimen holder. Alternatively, the fiber optic bundle 40 from
the epi-illumination ring light in lens 22 may be connected to
the optical coupler 34.
Three forms of illumination system are described, each
fed by a discrete fiber bundle. These are a transilluminating
plate (42), a ring light external to the lens (not shown), and
a ring light 44 internal to the lens (22) that performs epi-
illumination.
The transillumination plate is a rectangular chamber 50
(see Figures 6 and 7), within which the discrete fibers 52 from
CA 02263226 1999-02-15
WO 98/07022 PCT/US97/15269
bundle 51 are separated and rotated by 90 degrees so that they
point laterally, towards the specimen. The fibers 52 are
distributed within the chamber in such a way that they minimize
shading within the illumination pattern. To this end, a larger
5 number of fibers lie in the peripherally outward portions of the
chamber than lie at its center.
The rectangular chamber 50 contains a diffusing screen
54, and a quartz glass diffusing plate 56. These diffusing
elements take as their input the discrete points of light from
10 the fibers 52, and create a homogenous illumination over the
surface of the plate 56. The chamber 50 may also contain a dark
field stop, to allow light to enter the specimen from the side.
The external ring light consists of a ring of optical
fibers aligned with the axis of the lens, with a hole in the
15 center large enough to encircle the lens 22. The working
distance of the ring light is matched to the focus distance of
the lens 22.
The internal ring light 44 consists of a ring of optical
fibers, mounted within and axially aligned with the body of the
telecentric lens 22, and behind its front lens element. A
diffuser, polarizer, or other circular element may be placed at
the front of the fiber ring 44.
The specimen well plate is carried within a holder 58
(Figure 6) that is mounted to the fiber optic chamber 50. The
holder 58 grips the well plate at its edges. The bottom of the
holder 58 is empty, so as not to impede viewing of the wells .
The holder 58 is mounted to a jack, which moves it in the
vertical dimension. Hy adjusting the jack 60, the holder 58
moves relative to the lens 22 and the specimen is focused.
The lens 22 is a fast, telecentric lens. The lens
contains an emission filter slot 62, which accepts three inch
diameter interference filters for fluorescence imaging. It
contains an internal fiber optic ring light 44, positioned behind
the front lens element. The lens 22 is mounted to the camera
chamber by a flange 64 (see Fig. 2) at its middle. The back of
the lens proj ects into the camera chamber 20 , providing ready
access to the emission filter slot 62 without disturbing the
CA 02263226 1999-02-15
WO 98/07022 PCT/US97/15269
16
specimen. The front of the lens projects into the specimen
chamber 24.
The cooled CCD camera 18 is mounted directly to the
lens. Because the camera has its own chamber 20, there is no
need for concern regarding light leakage around the cooling,
power and data cables that exit the chamber to the camera control
unit.
All control, imaging, and analysis functions are
resident within the computer 28.
Illumination Subsystem
The standard technology for monochromatic area
illumination is to use gas discharge illuminators (e. g. UV light
boxes), which can deliver about 5000 uW/cmz of surface at the
emission peaks (usually mercury). The lamps are coated with a
filter that limits emission to a specific peak. Although fairly
bright, gas discharge lamps are limited in wavelength to the
peaks emitted by the excited gas within the lamp.
Other than gas discharge lamps, very few descriptions of
area illumination exist. The major problems are selection of
wavelength, and that direct entrance of the illuminating beam
into the collection optics degrades sensitivity. To avoid this,
light can be delivered from above, from the side, or via dark
field or refraction into the specimen. All of these techniques
have severe limitations. Side-mounted fiber optic illuminators
are uneven. They are also unsuited to wells or other non-flat
specimens, because light enters the specimen at an angle and
fails to penetrate deep targets. Refractive or dark field
illuminators require special optical components at the well
plate, and cannot be used with opaque specimens.
A more flexible area illumination system would use a
broad-band illumination source, and would allow any wavelength
of monochromatic illumination to be selected by precision filters
(usually interference filters). Filters are preferred, because
variable monochromators or low cost tunable lasers lack
sufficient light output when diffused over large areas.
Mercury or xenon arc lamps are often selected for
filter-based monochromatic excitation. The advantage of an arc
CA 02263226 1999-02-15
WO 98/07022 PCT/US97/15269
17
lamp is that its output can be made into a narrow beam that can
be passed through a small and readily available interference
filter, before being spread over the entire surface of the
specimen. Either a lens or fiber optic may be used to transmit
the monochromatic light from the filter to the specimen.
The present invention is much more flexible than any
previous device. It applies diffuse transillumination (through
the specimen), dorsal illumination (via ring light or other
source), or epi-illumination (through the lens) to the entire
surface of the specimen. Epi-illumination is preferred, because
it usually results in lower backgrounds, broader dynamic range,
and more linear fluorescence response under real-world
conditions. The ability to deliver large area monochromatic epi-
illumination is one critical factor that sets the present
invention apart from prior art.
The present invention addresses three main problems in
illumination delivery.
a. Filter availability - Close-tolerance filters (e.g. a
10 nm bandwidth filter), which are readily available
in small sizes, are not available for large areas of
illumination. This problem is overcome by use of
standard interference filters.
b. .Illumination delivery - Application of even,
monochromatic, and selectable illumination over an 8
x 12 cm area is a feature of the present invention.
An optical coupler or computer-controlled filter wheel
accepts standard interference filters, and is used to
select wavelengths. The optical coupler or wheel may
be attached to a specially designed fiber optic plate
for transillumination, to a fiber optic ring or panel
light for dorsal illumination, or to a fiber optic
illumination assembly within the lens, for epi-
illumination.
c. Intensity - The excitation illuminati~~n is spread over
a large area (typically 96 cm2). As intensity
decreases with the square of the illuminated area, the
resulting excitation intensity is very low indeed. In
many cases, emitted fluorescence will not be detected
CA 02263226 1999-02-15
WO 98/07022 PCT/US97/15269
18
with standard, scientific-grade cooled CCD cameras.
The very sensitive detector of the present invention
is capable of imaging the low levels of fluorescence
emitted from large specimens. For the most extreme
low light conditions, the present invention
incorporates an optional light amplification system
that may be inserted between the lens and the CCD
camera (see below).
Dens Subassembly
Figure 2 shows the general arrangement of illumination
and filter components within the telecentric lens 22. The lens
has mounted within it a fiber optic ring light 44, which projects
monochromatic illumination through the front lens element onto
the specimen (leftward in Fig. 2). The focus plane of the ring
light is at B, while the focus plane of the entire lens is in
front of that point, at A. Placing the focus of the ring light
at a point beyond the specimen minimizes specular reflections
from the specimen.
The emission filter slot 62 allows insertion of an
interference filter that removes excitation illumination from the
incoming rays, leaving only the fluorescence emitted by the
specimen.
Figure 3 shows best the optical components of the
telecentric, macro lens 22. The lens has 39 surfaces, and the
following characteristics:
Effective focal length 164.436 mm
Numerical aperture .443
Magnification 0.25
Note that light rays are almost parallel at the emission filter
slot 62. This allows the filter to operate at its specified
wavelength and bandwidth.
Although the present invention may be used with any
lens, the highest sensitivity is available from its specially
designed lens. This lens is fast, telecentric, and incorporates
the epi-illumination system appropriate to large specimen
formats .
CA 02263226 1999-02-15
WO 98/07022 PCT/US97/15269
19
Epi-illumination is a standard technology in
fluorescence microscopy, where small areas are illuminated. The
most efficient way to illuminate a small area is to place
dichroic beam splitter behind the objective. A dichroic beam
splitter or mirror is a partially reflective surface that
reflects one wavelength range, while allowing another wavelength
range to pass through.
On a microscope, illumination enters the dichroic mirror
from the side. The mirror is angled to reflect the excitation
light down through the objective toward the specimen.
Fluorescence emitted by the specimen (shifted up in wavelength
from excitation) is collected by the objective, which passes it
upwards towards the dichroic mirror. The dichroic mirror is
transparent to the emission wavelength, so that the light
proceeds through the dichroic to the detector plane. A different
dichroic is required for each excitation/emission wavelength.
There are major difficulties in applying the standard
form of dichroic-based epi-illumination system to macro imaging.
a. The dichroic mirror must be at least as large as the
objective it must fill. Camera lenses are much larger
than microscope objectives, and would need
correspondingly large dichroic mirrors. Dichroic
mirrors this large are not readily available.
b. In a fast macro lens, it is critical that the back lens
element be mounted as close as possible to the CCD. Any
increase in the distance between the rearmost lens and
the CCD markedly reduces the working f number and the
light-gathering efficiency. Therefore, there is no room
for a dichroic to be mounted behind the lens.
c. In a normal epi-illumination system, the dichroic
reflects excitation through the entire lens. For this
reason, transmission of excitation illumination is
highly subject to the optical characteristics of the
glasses used in the lens. Very costly (and difficult to
work) quartz glass optics are requi~~ed for W epi-
illumination. These W-transparent optics can be
constructed in the small sizes needed for a microscope
CA 02263226 1999-02-15
WO 98/07022 PCT/US97/15269
objective, but would be astronomically expensive in the
large sizes described for the present invention.
d. Dichroic beam splitters absorb light. Typically, they
are 80-90% efficient.
5 A unique property of the present invention is that no
dichroic is necessary. The telecentric lens is large, so there
is room to install an illumination assembly within its body. The
illuminator is mounted so that it shines directly at the front
lens element, from behind. This illuminates the specimen,
10 without any need of a reflective dichroic mirror. Any stray
excitation illumination that is reflected back through the lens
is removed by the emission barrier filter, located posterior to
the illumination source.
Further, the lens is designed so that only one of the
15 fifteen internal lens components resides in front of the internal
illuminator. This has the advantage that internal flare and
reflections are minimized. Of equal importance, only the front
lens needs to be transparent to W. A single UV- transparent lens
is costly, but not prohibitively so.
20 The front element of the lens is calculated so as to
focus the illumination source beyond the plane of the specimen.
The defocus of the illumination source at the specimen plane
minimizes reflections. As many well plates are constructed of
polished plastic, and tend to generate specular reflections, this
is an important feature.
The lens is highly efficient. The collection F/# of the
lens is 4.5. This implies a collection solid angle of 0.03891
sr, and a collection efficiency of 0.03891/4p - .3096%. The
expected transmission value is 0.85-0.90, giving an overall
collection efficiency of 0.263-0.279%. In comparison to an F/1.2
photographic lens, the expected improvement with the present lens
is about 340%.
The present lens is telecentric. A telecentric lens is
free of parallax error. Images of deep, narrow targets, made
with standard lenses, exhibit parallax error. Circular targets
at the center of the image are seen as true circles. However,
the lens peers into lateral targets at an angle. Therefore,
these lateral targets are seen as semilunar shapes. In many
CA 02263226 1999-02-15
WO 98/07022 PCT/L1S97/15269
21
cases, one cannot see the bottom of a well at all. A telecentric
lens collects parallel rays, over the entire area of a well
plate. Thus, it does not peer into any wells at an angle and is
free of parallax error.
A critical advantage of the present lens is that the
internal beam is collimated at a position appropriate to the
insertion of a barrier filter. That is, the lens is calculated
so that rays are nearly parallel, at a point about midway in the
lens barrel. The lens accepts an interference filter at this
point. The filter serves to remove excitation illumination, and
other nonspecific light. The collimated beam at this point is
critical, because interference filters must be mounted orthogonal
to the incoming illumination. If the incoming illumination is
at an angle, the filter exhibits alterations in the wavelengths
that it passes. In the present invention, light: rays are almost
parallel when they strike the filter, yielding the best possible
performance .
The telecentric lens has a fixed field of view (about
14.5 cm diameter, in this case) but, if larger specimens need to
be imaged, a motorized translation table may be mounted within
the Light-tight chamber. The translation table moves the
specimen relative to the lens, under computer control. After
each motion, a single "tile" is acquired. When the entire
specimen has been imaged, all the tiles are recomposed (by the
software) into a single large image, retaining telecentricity,
freedom from parallax error, and high resolution over its entire
surface .
~ctx'eme Low Fight Modification
Figure 4 shows a modification to system of Fig. 1,
addition of an optional intensifier 70 to provide an alternate
system useful for extreme low light imaging. In all other
respects the system is essentially identical to that of Fig. 1.
The intensifier 70 is mounted between the telecentric lens 22 and
the CCD camera 18.
Figure 5 shows best the intensifier 70 as being of the
GEN 3 type, and including a photosensitive cathode 72, a
microchannel plate (MCP) 74, a phosphor screen 76, and a vacuum
CA 02263226 1999-02-15
WO 98/07022 PCT/US97/15269
22
sealed body or enclosure 78. The fast, telecentric lens 22
(Figures 2,3) is placed in front of this assembly 70. At its
output, the lens is focused on an input window of the cathode 72
so as to transfer the specimen image thereto. The photosensitive
cathode 72 is selected to emit electrons in proportion to the
intensity of light falling upon it. The MCP 74 is positioned
within the vacuum sealed body 78 , between the cathode 72 , and the
phosphor screen 76 and coupled to the cathode 72 at each end.
The MCP 74 is provided with an array of small diameter MCP
channels, each of which is coated with gallium arsenide. The
electrons emitted from the cathode 72 are accelerated along the
MCP channels to the phosphor screen 76. As the electrons from
the cathode are accelerated along the small diameter channels,
they strike the coated channel walls to produce additional
electrons. As the multiplied electrons leave the MCP channels,
they strike the phosphor screen 76 and produce an intensified
image of the specimen on an output window. This image is coupled
to the CCD 84 element in the camera by a lens 80.
It has been found that the use of the Extended Blue GEN
3 image intensifier is advantageous over other types of
intensifiers in that the image provided on the output screen is
sharper, has less shading error, and has less noise than those
produced by GEN 1 and GEN 2 intensifiers. It is to be
appreciated, however, that as better intensifier technologies are
developed, they may be incorporated into the present system.
The integrating camera 18 is configu~ced so that the
highly amplified image generated on the output window 78 is
focused by the intermediate lens 80 onto the CCD element 84. To
image low light specimens, the CCD element 84 of camera 18
integrates for a period. During the integration period, photons
from the output window incident to the CCD element 84 are stored
as negative charges (the signal) in numerous discrete regions of
the CCD element 84. The amount of charge in each discrete region
of the CCD element 84 is accumulated as follow;..
CA 02263226 1999-02-15
WO 98/07022 PCT/US97/15269
23
Signal = Incident light x Quantum efficiency x
Integration time
The greater the relative intensity of tree incident light
coming from the intensifier 70, the greater the signal stored in
the corresponding region of the CCD element 84.
For the most extreme low light conditions, as with the
scintillation proximity assay, the present invention allows a
light amplifier to be inserted between the lens and the CCD
camera. In the preferred configuration, this light amplifier is
an image intensifier. Intensification, as for example, is
disclosed in U.S. Patent No. 5,204,533 to Simonet, involves the
coupling of an image intensifier to a CCD camera. The image
intensifier typically includes a photocathode, a phosphor screen,
and a microchannel plate (MCP) connected between the photocathode
and phosphor screen. Light amplification factors of up to about
90,000 are possible with this type of device.
With the intensifier inserted into the optical chain,
the present invention becomes an image intensified CCD (ICCD)
camera. In an ICCD camera, the image is created at three or four
planes. At each of these planes, there is some loss of quantum
efficiency. Therefore, the image intensifier is operated at high
gain to overcome signal losses within the optical chain. At very
high gain factors, noise and ionic feedback through the MCP
become so severe that further improvement of sensitivity is
impossible. Even when run at maximum gain, conventional image
intensified CCD cameras are not sensitive enough to image the
dimmest specimens.
Faced with a typical very dim specimen, most ICCD
cameras will. fail to produce an image, or will produce a very
poor image, in which the target will be difficult: to discriminate
from background, and the true range of target intensities will
not be rendered. In the worst cases, the target will be
indiscriminable from background.
Conventional image intensified CCD cameras use an
integration period equal to a single television frame. The short
integration period allows the intensifier to be used with
standard, low-cost video cameras, as for example, are used in the
television industry. In other cases, the inter.,ifier is gated,
CA 02263226 1999-02-15
WO 98/07022 PCT/US97/15269
24
to use very short integration periods (e.g. 1 cosec). The use of
gating allows the intensifier to be used in a photon counting
mode.
The present invention offers two methods by which
intensified light may be used. The preferred method involves
continuous integration of the output of the intensifier onto a
cooled CCD camera. This method is fast and efficient, but has
limited dynamic range. Cooling of the intensifier, or multiple
exposures for different times, may be used to improve the dynamic
range. A second method involves looking at shorter periods of
intensifier output, and photon counting. This method is much
slower, but has broad dynamic range. The present invention
allows either strategy to be selected, as warranted by the
specimen.
Prior art exists for the use of intensified CCD cameras
in well plate assay imaging. Martin and Bronstein (1994) and
Roda et al. (1996) discuss use of an intensified CCD camera for
the imaging of chemiluminescent specimens. Only bright specimens
can be seen. No provisions are made for imaging deep wells
without parallax error, or for applying monochromatic excitation
to the specimen.
U.S. Patent No. 4, 922, 092 (1990) to Rushbrooke et al.
discloses the use of an image intensified CCD camera which is
coupled to a special fibre optic lens. The fibre optic lens
consists of bundles which transmit light between an array of
wells and the input of the intensifier. While the invention
disclosed by Rushbrooke is free of parallax, and may be suitable
for standard 96 or 384 well plates, it would be incapable of
imaging the very high density well arrays addressed by the
present invention. Further, the invention disclosed by
Rushbrooke lacks illumination capabilities. It is also incapable
of imaging specimens in free format, because there is space
between the input bundles that is not addressed. By using lens
input, as opposed to fiber optics, the present invention allows
free format imaging.
In sum, the present embodiment of the invention allows
the use of an optional intensifier placed behind the lens, to
detect the most extreme low light specimens. When intensified,
CA 02263226 1999-02-15
WO 98/07022 PCT/US97/15269
the device can be run in continuous integration or photon
counting modes.
With the system shown in Figures 4 and 5, only the CCD
sensor is cooled. This is sufficient for most purposes. It is
5 to be appreciated however, that the intensifier photocathode 72
could also be cooled, thereby improving the signal to noise ratio
of the intensifier. Similarly, the entire photosensitive
apparatus (intensifier + CCD) can be cooled. However, cooling
the entire photosensitive apparatus has the disadvantage that the
10 efficiency of the phosphor on the fibre optic output window is
decreased.
Although a high quality, scientific grade CCD camera can
detect about 50 photoelectrons incident to the CCD (depending on
how we set reliability of detection), this is not an accurate
15 indication of performance in imaging luminescent specimens.
Real-world performance is complicated by the emission and
collection properties of the entire optical chain, as well as by
the performance of the CCD camera. ThereforE, we need to go
beyond the QE of the detector, and examine the transfer
20 efficiency of the entire system.
Three factors dominate the transfer efficiency
(photoelectrons generated / photons emitted) of the detector
system. These are the light collection efficiency of the lens,
the quantum efficiency of the CCD detector, and the lens
25 transmittance. We can calculate the number o~ photoelectrons
generated as follows:
Npe = T * ~a~,a * c . a . * Np,
where .
T is lens transmittance, about 85-90% for our lens
~ is quantum efficiency of the CCD detector, typically
about 35-40%, up to 80% in our case, and
c.e. is collection efficiency of lens, less than .1% for
fast photographic lenses, about 1.2% in our case.
In a typical scientific grade CCD camera system, using
the fastest available photographic lens (f1.2), and with a high
quality cooled detector, the CCD will generate 1 photoelectron
CA 02263226 1999-02-15
WO 98107022 PCT/US97115269
26
for about 5,000-10,000 photons generated from a point source in
the sample.
The lens of the present invention offers a collection
efficiency of about 0.271%. The efficiency of the CCD detector
is about double that of other CCDs. The result is that the
present invention has the theoretical ability to generate one
photoelectron for about 500-1000 photons generated from a point
source within the sample. This very high transfer efficiency
allows detection of specimens that cannot be imaged with prior
art systems.
In the alternate embodiment of the invention shown in
Figures 4 and 5, the system incorporates an extended blue type
of GEN 3 image intensifier. Other types of intensifiers,
although less preferred, may also be used. The three major types
of intensifier (GEN 1, GEN 2 and GEN 3) differ in the
organization of their components and in the materials of which
the components are constructed. In a GEN 1 intensifier,
illumination incident to a photocathode results in emissions at
a rate proportional to the intensity of the incident signal. The
electrons emitted from the photocathode are than accelerated
through a high potential electric field, and focused onto a
phosphor screen using electrostatic or proximity focusing. The
phosphor screen can be the input window to a video camera (as in
the silicon intensified target camera), or can be viewed
directly. GEN 1 intensifiers suffer from bothersome geometric
distortion, and have relatively low quantum efficiency (about
10%) .
The GEN 2 intensifiers, like the GEN 3, incorporate a
MCP into an image tube, between the cathode and an anode. The
GEN 2 intensifiers are smaller, lower in noise, and have higher
gain than the GEN 1 intensifiers. However their quantum
efficiency is fairly low (typically <20%), and they tend to
suffer from poor contrast transfer characteristics . In contrast,
the GEN 3 intensifier tube has a quantum efficiency of about 30%
or higher (needs less gain), and very high intrinsic contrast
transfer. With recent versions of the GEN 3, gain levels are
about equal to those of a GEN 2 (ultimate gain level available
is about 90,000). Therefore, a GEN 3 intensifier will tend to
CA 02263226 1999-02-15
WO 98/07022 PCT/US97/15269
27
yield better images than a GEN 2. Where necessary for reasons
of cost or specific design features, other forms of intensifier
could be used. Similarly devices with high intrinsic gain (such
as electron bombarded back-illuminated CCD sensors) could be used
in place of image intensifiers.
The CCD camera 18 of the present invention could use
integration periods locked to a gated power supply in the image
intensifier, with the result that the camera could be read out
at very short intervals. Using the gating and fast readout
feature, and with the intensifier run at highest gain or with a
multistage intensifier, the present invention can thereby be
operated as a conventional photon counting camera. Thus, the
present system can advantageously be used for both direct imaging
of faint specimens, or as a photon counting camera by changing
its mode of operation from integration to gating.
C~ Camera S~rstem
Figure 8 is a schematic representation of the CCD camera
18. The camera 18 includes a CCD element 84 positioned behind
a camera aperture. To reduce dark noise produced by electrons
within the CCD, the CCD element 84 is mounted to a heat sink 88,
which in turn is thermally coupled to a Peltier cooling element
and liquid circulation system for providing enhanced heat
dissipation. The lens is positioned over the aperture to focus
the image on the CCD element 84. The fast, telecentric lens 22
(Figures 2 and 3) is mounted directly to the camera body by
screws, after removing the photographic lens mount. Similarly,
the image intensifier 70 (when present) is mounted directly to
the camera body.
Area imaging systems use CCD arrays to form images.
Factors which influence the ability of CCD arrays to detect small
numbers of incoming photons include quantum efficiency, readout
noise, dark noise, and the small size of most imaging arrays
(e.g. 2.25 cm2) .
Quantum efficiency (QE) describes the ability of the
photodetector to convert incident photons into electron hole
pairs in the CCD. Consumer-grade CCDs typically exhibit QE of
about 12-15%. Standard, scientific grade cooled CCD cameras
CA 02263226 1999-02-15
WO 98/07022 PCT/US97/15269
28
exhibit QE of about 40%. A very limited number of thinned, back-
illuminated CCDs can achieve QE of as high as 80% at peak
detection wavelengths.
Readout noise originates in the output preamplifier of
the CCD, which measures the small changes in voltage produced
each time the charge content of one or more CCD elements is
transferred to it. Readout noise is directly related to the
readout rate, and is decreased by use of slow readout.
Dark noise is produced by thermally generated charges in
the CCD. By increasing the background level, dark noise
decreases dynamic range. The constant dark noise level can be
subtracted from the image, but dark noise also has a random noise
component which cannot be subtracted. This component adds to the
noise level of the detector. Dark noise is decreased by cooling
the CCD.
The size of the CCD element is related to its ability to
store photoelectrons (known as the well capacity; and, hence, its
dynamic range. The larger each CCD element in the array, the
larger the full well capacity and dynamic range of that element.
A broad dynamic range allows the detector to be used for longer
exposure times, without saturation, and this enhances the
detection of very small signals. Further, the signal to noise
performance of larger elements is inherently higher than that of
smaller elements. Most area imaging systems use relatively small
CCDs. This results in limited resolution for devices in which
the discrete CCD elements are large, and limited dynamic range
for devices in which the discrete CCD elements are small.
Devices with limited dynamic range cannot achieve 16 bit
precision, and must be used with relatively bright specimens
(e. g. fluorescence microscopy, UV gels, very bright
chemiluminescence).
The present invention incorporates a CC.~ system which is
designed to minimize all of the problems just described. The CCD
array is unusually large (6.25 cm2) and efficient (about 80%
quantum efficient) . The result is very high detector sensitivity
with broad dynamic range (true 16 bit). The preferred support
electronics include a high-precision digitizer, with minimal
CA 02263226 1999-02-15
WO 98/07022 PCT/US97/15269
29
readout noise. Preferably, the camera is cooled to minimize dark
noise.
An electro-mechanical shutter mechanism is additionally
provided within the camera, for limiting the exposure of the
image on the CCD element. Preferably the camera is a thinned,
back-illuminated 1024 x 1024 pixel black and white camera with
asynchronous reset capability, and high quantum efficiency. The
camera provides a 16-bit digital signal output via digitization
circuitry mounted within the camera control unit, and an
interface card mounted within the computer. Data from the CCD
are digitized by the camera control unit at the rate of 200,000
pixels/second, and transferred directly to the computer memory.
Following the integration period, the CCD camera accepts
a trigger pulse from the computer to initiate closure of the
electromechanical shutter. With the shutter closed, the image
is transferred from the CCD to the internal frame buffer of the
computer.
Although this camera could be used without cooling the
CCD element, extended periods of integration are achieved by
using a CCD camera with an integral cooling element. The
effectiveness of integration is limited by the degree of cooling.
With a non-refrigerated liquid cooling device, sensor
temperatures of about -50°C (below ambient) can be achieved. At
this temperature, dark noise accumulates at a rate of about 7-10
electrons/second. This type of cooling has the advantage of low
cost and easy implementation.
It is to be appreciated, however, that longer periods of
integration are possible if refrigerated liquid or cryogenic
cooling are employed.
Control Subsystem
The control subsystem 16 comprises, control unit 26 and
computer 28. Camera control unit is a computer controllable unit
provided by the manufacturer of camera 18 to control the camera.
Computer 28 is preferably a conventional computer running in the
Windows° environment and is programmed to achieve image
acquisition and analysis in accordance with the present
invention.
CA 02263226 1999-02-15
WO 98/07022 PCT/US97/15269
Camera-based imaging systems lack the sort of push-
button operation that is typical of counting or scanning systems .
Focusing the camera, adjusting exposure time, and so forth, can
all be inconvenient.
5 In fact, imaging is inherently more complex than
counting single targets within wells. Nonimaging counting
systems have a relatively easy task. They only need to control
the scanning process, control internal calibration, and create
a small array of data points representing each well. The
10 sequence of steps might be as follows.
a. Calibrate detector against internal standard.
b. Illuminate one well.
c. Position a PMT over the illuminated well.
d. Read well.
15 e. Transfer data to spreadsheet.
f. Illuminate next well and repeat.
An area imaging system has a much more difficult task.
Imaging a well plate might include the following requirements.
20 a. Provide adequate illumination over the entire plate.
b. Control a high performance camera.
c. Store geometric and density correction factors.
d. Image specimen.
e. Correct geometric and density variation.
25 f. If necessary, calibrate image to standards within the
specimen.
g. Locate each well and quantify intensity.
h. Transfer data to spreadsheet.
30 These tasks can only be performed if the imaging system
is equipped with software that performs functions b-h, above.
The present invention incorporates such software.
In particular, one aspect of the present invention is
software which corrects for nonspecific background fluorescence
by using two images. The first image is made with an excitation
filter that excites as little specific fluorescence as possible,
while exciting nonspecific fluorescence. The second image is
made with an excitation filter that excites specific fluorescence
CA 02263226 1999-02-15
WO 98/07022 PCT/fJS97/15269
31
as much as possible, and as little nonspecific fluorescence as
possible. An optimal specific fluorescence image is made by
subtracting the nonspecific image from the specific image.
Figure 9 is a flow chart illustrating the primary
process performed by computer 28 in controlling the system 1 and
acquiring data therefrom. After initiation of the process, an
image of the specimen is acquired at block 200 using camera 18.
Known processes exist for acquiring bias images of a specimen.
Such bias images take into account all significant distortions
and errors introduced by the system itself when an image is
taken. Utilizing one of the known methods, a bias image for the
specimen is acquired at step 202.
At Step 204, a non-specific image is acquired. This
image determines the contribution of non-specimen components,
such as the support substrate, to the image. This step is
indicated as optional, since it would only be performed in the
event that the specimen had to be illuminated in order to acquire
the specimen image, in which event some light would also be
reflected from non-specimen elements. On the other hand, if the
specimen were the source of the light for the image (as in
chemiluminescence), the non-specific image would not be acquired.
Similarly, the step at block 206 is optional, since it involves
obtaining a non-specific bias image.
At block 208, the specimen bias image is removed or
subtracted from the specimen image, and at block 210 the non
specific bias image is subtracted from the non-specific image.
This results in two images in which bias effects have been
compensated. At step 212, the compensated non-specific image is
removed from the compensated specimen image to produce a working
image in which the effects of the specimen are isolated. Those
skilled in the art will appreciate that if steps 204 and 206 were
not performed, steps 210 and 212 would also not be performed.
Following bias removal, various other corrections are
provided (e. g. for geometric warping originating in the lens),
using known processes.
At step 214, the operator inputs to the computer the
nominal "grid" spacing and "probe template". The grid spacing
is the nominal center-to-center spacing of specimen samples on
CA 02263226 1999-02-15
WO 98/07022 PCT/LTS97/15269
32
the substrate. The "probe template" is the nominal definition
of a single target (e. g. in terms of shape and area)
corresponding to one dot on a membrane, one well in a plate, or
similar target . Typically the probe template is a circular area,
and there is one probe template for each target in the specimen.
A grid is composed of a matrix containing one probe template for
each of the targets.
Optionally, the operator can also define an array of
"anchor points." The specimen may include an array of thousands
of potential samples. In some instances, a large proportion of
these will be populated, and in others relatively few will. In
those instances in which relatively few sample points are
populated, the specimen will include predefined "anchor" points
to aid the system locating the probe template positions. In
those instances in which a large proportion of the potential
sample sites are populated, the samples themselves provide a
sufficient population to position the probe templates, and anchor
points may be unnecessary.
At block 216, probe templates of the defined size with
the defined grid spacing are generated and superimposed over the
working specimen image. At this point, the operator can
optionally provide a manual adjustment to the superimposed grid
of probe templates, in order to bring them into general alignment
with the actual specimens. He could do so, for example, by
utilizing a mouse to shift the entire array then "grab specific
probe templates and center them over the appropriate targets on
the specimen. The operator might, for example, perform a general
alignment by centering the probe templates in the four corners
of the grid over the appropriate targets of the specimen.
Although not essential, this manual adjustment will speed and
simplify the processing done by computer 28.
At block 218, a process is performed, described in more
detail below, in order to determine more precise locations for
the probe templates relative to the actual location of potential
targets. At the outset of this process, at block 218, a
determination is made whether the targets or anchor points have
been adequately identified or defined. If targets have been
well-defined, control is transferred to block 222, where the
CA 02263226 1999-02-15
WO 98/07022 PCT/LJS97/15269
33
array of probe templates is aligned to the defined targets; if
not, but anchors have been well-defined, control is transferred
to block 220, where the array of probe templates is aligned to
the anchors; otherwise, control is transferred to block 224,
where the predefined grid spacing and probe template for the
array are utilized. It will be appreciated that, in some
instances, it may be desirable to align the array on anchors and
then on targets.
Once the probe templates and targets are aligned, the
measurements within the individual probe templates are decoded
to different conditions. For example, a probe may be capable of
assuming any of n conditions, and the process ef block 226 could
decode the sample at each probe to one of those conditions. The
actual process is performed on a statistical basis, and is best
understood from a simple example relating to resolving a binary
decision. However, those skilled in the art will appreciate that
the process could actually be applied to resolving a multiple
condition process. In the simplest case, the binary decision is
a "yes" or "no" decision, which could be related to the presence
or absence of a certain condition. In accordance with the
process at block 226, the actual levels at every probe of the
specimen are measured, a mean and standard deviation are
determined for the set of samples, and this results in a working
statistical distribution. The decoding of a "yes" or "no" could
then be done to any level of confidence selected by the operator.
The operator's selection of a level of confidence results in the
determination of a threshold level (e. g. based upon that level
being located a calculated number of standard deviations from the
mean on the distribution curve), and any signal above the
threshold level would be considered a "yes", while any signal
below the threshold level would be considered a "no."
At block 228, a process is performed to generate a
report of the array data, based upon the process performed at
block 226. It is contemplated that this may be any form of
report writing software which provides the operator a substantial
amount of flexibility in preparing reports of a desired format.
Once the reports are generated, the process ends.
CA 02263226 1999-02-15
WO 98/07022 PCT/US97/15269
34
Attached as Appendix A is a more detailed discussion of
the process of Fig. 9.
Figure 10 is a flow chart illustrating the process
performed in block 222 of Fig. 9.
After initiation of the process, image background and
noise are estimated at block 300. At block 302, a determination
is made whether a group alignment of the grid to the array of
targets is necessary. This could be done either visually by an
operator or by the system. The purpose of this test is to
determine whether the grid is aligned to the targets overall.
If done by the system, it would be performed by a conventional
procedure for testing alignment of two regular patterns of
shapes. If it is determined that adequate alignrnent of the group
exists, control is transferred to block 306.
At block 304, a group alignment is performed. The
purpose of this operation is to align the probe template grid
roughly with the respective targets. The alignment may be done
on the basis of the whole grid or part of the grid selected by
the operator. This alignment could be done by the process
discussed below with respect to block 306 for maximizing ID,
except that ID is maximized over the entire grid.
At block 306, a step-wise process is performed within
the area of each individual probe template to locate that point
which yields the maximum integrated density, ID, within the probe
template, given by the formula (1):
ID(x0, y0) = f D(x, y) W(x-x0, y-y0) dxdy (1)
S(x0,y0)
where: (x0,y0) is the center point of a probe template;
S{x0,y0) is the probe template area at (x0,y0);
D(x,y) is the density value (e.g. brighteners) at
(x,y); and
W(x,y) is a weighting function (e. g. a two
dimensional Gaussian function with its
maximum value at (0,0)).
CA 02263226 1999-02-15
WO 98/07022 PCT/US97/15269
This yields an "A location" for each probe template, which is
that location that provides the maximum value in formula (1).
The probe template location prior to block 306 will be referred
to as the "G location."
5 At block 308, a confidence weighting is performed
between the A location and G location, in order to arrive at the
final location of the center of each probe template. The
confidence weighting factor for each A location is a form of
signal-to-noise ratio. That is, the value of ID at each point
10 is proportional to the ratio between the ID value at that point
and the value determined at block 300 for that point. In effect
the weighting factors are utilized to determine the position of
the probe center along a straight line between the A and G
locations, with weighting determining how close the point is to
15 the A location.
Although the detailed description describes and
illustrates preferred embodiments of the present apparatus, the
invention is not so limited. Modifications and variations will
now appear to persons skilled in this art. For a definition of
20 the invention reference may be had to the appended claims.
Image
CA 02263226 1999-02-15
WO 98107022 PCT/US97/15269
37
Contents
Introdudioa ........... ....................................... .2
Imaging aad Lbrary Screening . . . . . . . . . . . . . . . . . . . . . . . . .
. . . . . . . , ~ . . . . . . . . . . . .
Studying Geae Expression . . . . . . . . . . . . . . . . . . . . . . . . . . .
. . . . . . . . . . . . . . . . . . . . . . . . . . . . 4
Details of the High Density Grid Software . . . . . . . . . . . . . . . . . .
. . . . . . . . . . . . . . . . . . . ' . 5
Segmentation . . . . . . . . . . . . . . . . . . . . . . . . . . . . . . . . .
. . . . . .
Manual Segmentation . . . . . . . . . . . . . . . . . . . . . . . . . . . . .
. . . . . . . . . . . . . . . . . . ~ ' . . . . . . . : 6
Automated Segmentation . . . . . . . . . . . . . . . . . . . . . . . . . . . .
. . . . . . . . . . . . . ' . . ' ,
Segmentation With Fixed Sampling Probes . . . . . . . . . . . . . . . . . . .
. . . . . . . . . . . . . ' . . ~ , 7
Constructing aad Aligning the Grid . . . . . . . . . . . . . . . . . . . . . .
. . . . . . . . . . . . . . . . . . ' . . . . . . . . 7
Fine Alignment . . . . . . . . . . . . . . . . . . . . . . . . . . . . . . . .
. . . . . . . . . . . . . . . . . . , _ ' ~ . . . . . . . 8
Anchors... ..........................................., '~......~8
Detail and Scraeniag'Modes . . . . . . . . . . . . . . . . . . . . . . . . . .
. . . . . . . . . . . , ~ . . . . . . . . . . 8
Detail mode - Gene expression . . . . . . . . . . . . . . . . . . . . . . . .
. . . . . . , ~ . . . . . . . . . . . . . .
Lbrary Scraeniug Mode . . . . . . . . . . . . . . . . . . . . . . . . . . . .
. . . . . . . . . ' . . . . . . . . . . . . . . . . : 8
S~mmacy of detail sad screening modes . . . . . . . . . . . . . . . . . . . .
. . . . . . . . . . . . . . . . . . . 9
Selecting Interesting Targets: Statistical Segmentation . . . . . . . . . . .
. . . . . . . . . . . . . . . . . . 9
Scr~niag.......... ....... .....................................'.9
Detail Mode and Gene Expression . . . . . . . . . . . . . . . . . . . . . . .
. . . . . . . . . . 10
Quic~kDryCommunication: The Elemental Display ' . . . . . . . . . . . . . . .
. . . . . . . . ' . . . . . . . . . . . . . 10
Effects of Background Variation . . . . . . . . . . . . . . . . . . . . . . .
. . . . . . . . . . . . . . . . . . 11
....................... 11
Summary: Features of The High Density Grid Study Type . . . . . . . . . . . .
. . . . . . . . . . . . . . . . . . . . . 12
References . . . . . . . . . . . . . . . . . . . . . . . . . . . . . . . . . .
. . . .. . . . . . . . . . . . . . . . . . . . .. . . . . . . 13
CA 02263226 1999-02-15
WO 98/07022 PCT/US97/15269
38
High Density l3rids
Introduction 1fi
rapid pace of innovation is moleadar biology, chemistry and robotics is
exerting a profound effect on biomedical
research in general, sad on phannaca~tical lead discovery in particular. As
some companies are quick to adopt
innovative technologies, pressures grow upon all competitors. Everyone wants
to find ways to decrease cost
s~ increase speed in the discovery a~ evaluation of potential therapeutic
targets. The result is the rapid growth
of a new area of pharmaceutical science - biomolecuhtr screening. Biomolecular
screening can be defmod as
the rapid and efficient laboratory testing of large numbers of compounds for
potential therapeutic efficacy.
The growth of screening is an inevitable consequence of innovations and new
understanding in combinatorial
chemistry, biological diversity, molecular genetics, sad other arena. For
example, combinatorial chemists can
start with a single compound fmm which hundreds of thousands of potentially
interesting compounds are
generated. All of these compounds, or a significant subset, must be tasted for
biological activity. Another
example lies in the discovery, detection and characterization of the
interaction between compounds and genes.
The demands of combinatorial chemistry, molecular genetics, and other
applications have lead to the
development of a specialized aspect of screening technology, high throughput
screening (HTS). I3TS is not
fundtu~tally different fmm the general definition of biomolecular screening.
We might consider it as a "hot
rod" form of screening, in which considerable expense emd effort are expended
to increase the rate at which
pounds are tasted. Optimized technologies is assay chemistry, detection
systems, automationlrobotics, and
bioinformatica all have roles to play is I3TS.
One way is which assay chemistry can be optimized for maximum efficiency is by
miniaturization of the assay
format. For example, moving from 96 to 384 wall plates increases the number of
assay sites per unit area. It
can be assumed that tech higher density microwell formats will soon appear.
Microwell assays will follow the
lead of other screening protocols in which microfabricatad devices or spotting
robots era used to provide very
dense arrays of DNA clones on solid auppoit media (e.g. Beattia et sl., 1995;
Bggara of al., 1994; Rhrapko et
al., 1989, 1991; Lure et al.,1994; Iipachutz et al., 1995; Msskoa and
Southern, 1992; Mason, Rampal and
Coasain, 1994; Pearaon and Tonucci, 1995; Peace et al., 1994; Saiki, Welsh,
levenson and Brlich, 1989;
Schena, Shalon, Davis and Brown, 1995; Southern, Maskos and Blder, 1992).
The ember of targets is a typical specimen is increasing rapidly. Today's
prototype microfabricatsd devices
incorporate about 1000 - 20,000 grid elem~ts (for a brief review, ax Southern,
199. Spotted assays routinely
achieve much higher densities. 1n our archives, we have images containing more
than 50,000 isotopically-
labeled cDNA dot blots hybridized on a membrane of about 20 x 20 cm. We have
seen much higher densities
achieved using nonisotopic methods, is which packing densities are not limited
by spread of emission from the
isotope. Aa the microplates, m~branes, or other media become more densely
populated with assay sites, the
resort is a high density of silos is a regularly spaced grid pattern. This is
usually referred to as a "high-density
~n
bT~h~'a' traditional methods for analyzing walls (generally photomultiplier-
based counters) are usually inadequate
for highda~sity grids. Counting devices, which must address each grid point
one after the other, are not able
to lasadle large strays of small sassy Bites. 1n contrast, a camera used
imaging system is well suited to both
high density grids, sad to specimens in free formats (those not in a regularly
spaced pattern). Examples of free
format specimens include combinatorial bead assays in dishes, cell based
assays in tissue cultures, sad colony
assays.
The intersection between imagtog a~ screening technologies is still in the
formative stages, and procedures are
only just becoming available. Innovations in microfabrication, in
nonfabricated arrays (e.g. membranes,
microwells), sad in detection technologies will combine with image analysis to
yield tools for new screening
paradigms in sequencing, diagaoais, sad binding.
Imaging Research Inc.
CA 02263226 1999-02-15
WO 98/07022 PCT/US97/15269
39
High Density Grids
Molecular genetics, or the study of genes at the level of the DNA molecule,
iavolvea isolation and
ctulracterization of the DNA ~odiog apxific genes. The moat basic purpose is
to relate the ganoma to diseases
or pathological processes. For example, most cascara result from noninheritad
genetic mutations (somatic
mutations) which result in abnormal cell function. If a specific gees is
usually altered in association with a
psrtiailer cancer, that ge~tic alteration might ba usable as a teat for the
cancer. Genetic engineering techniques
could also ba used to study the function of the gene and its encoded protein,
produce mesa quantities of rare
proteins and create animal modals of genetic disorders. Tha starting point for
all of this is the screening of
cDNA and gesomic libraries. Wa screen to simply identify clones that hybridize
to our probe, or we screen fa
identify clones that alter gene expression in response to some independent
variable (e.g. two cell lines).
The moat common application of DNA library screening is the identification and
isolation of clones
corresponding to a specific gene of interest. 1n order to isolate clones for a
specific gene, a probe for that gene
must be available. Tha DNA library is then screened for clones containing
sequences hybridizing with the
probe.
The first atop in isolating cloned DNA for a gene of interest is to spread the
i~ividual clones of a library into
a spatial pattern, with a discrete clone at each position in the pattern. The
clone placed at each position can be
a known entity as, for instance, when we have as ordered array of coamids, or
YAC or BAC clones. This
approach offers the advantage of eimultanoously cloning a gene and mapping it
to a chromosomal locaiioa.
Because such h'brari~ era often integrated with genetic maps, identifying a
gene's location may suggest possible
associations with genetic diseases which have boy mapped to the same area of
that chromosome. Alternatively,
the clones may constitute a non~rdered sampling (with redundancy and
overlapping) of a particular library.
Tha library of discrete clones is duplicated onto a solid-support, typically a
membrane filter. With prxiso
spotting robots, mire libraries can be spread out as high density grids on
just a few membranes. Because each
clone in a library may conkain only a portion of the gene of interest or a
particular gene may be underrepresented
within the library, tens or even hundreds of thousands of individual clones
need to be screened in order to have
good chance of finding positive (complementary) clones. The result is that a
labeled probe for a specific gene
will interact with only a few clones out of thousands of possible targets
To identify positive clones, wa hybridize the high~Ienaity grid of dot blots
with a labeled probe. Typically, the
probe is a small DNA fragment or a synthetic oligonucleotide with a known
sequence. Tha hybridization step
exploits the powerful aequeuc;e~pacific~ty and high affinity of complementary
nucleotide strands for each other.
Tha goal of the procedure is to determine whether the library on our membrane
contains a sequence
oamplan~ary to the lonown sequence in our probe. 1f it does, this hybridized
sequence can be harvested and
used to d~roct our attention to unknown parts of the geaome flanking the
smaller hybridized portion.
Visualizing the degree to which clones hybridize to the probe is one role of
the imaging system. Tha high
density grids are visualized by either by isotopic or nonisotopic imaging, For
isotopically labeled probes,
phosphor imaging plate technology provides the moat convenient and accurate
signal detection. Nonisotopic
detection may ba performed using a sensitive digital camera, and
chemilumineacent or fluorescent labels. We
recommend the use of our Tundra ultra-low light imaging system for this
purpose, Whatever our label, the
result is an image of a highdensity grid. Ia a typical screening study, this
image contains many thousands of
unlabeled points, and a few labeled ones. Analyzing the image to identify
positive bite is a second major
function of the imaging system.
Image analysis involves localization of the dote, quantification of
hybridization intensity, and parsing into
negatives and positive hits. Tho moat difficult aspect is dot localization.
Because screening a hbnuy usually
creates only a few visible spots in the image, it would appear easy to
localize the positive targets based on their
relative intensity. In this case, we would "eyeball" the image, and set a
density level (a threshold) that selects
only hits.
Imaging Research Inc.
CA 02263226 1999-02-15
WO 98/07022 PCT/US97/15269
high Density t3rids
Selection of hits based on density values is more appropriate for library
screening than for gene expression
studies (see below}, but remains a poor way to select hits for the following
reasons.
Variations in background sad label intensity usually lead to some uncertainty
in defining a single density
value for hits. Consider the case of a probe hybridizing to important clone
with weak but genuine homology
to the probe. This clone would appear as a faint spot, only somewhat more
intense than most of the
negatives. If the selection of positives was done with a simple density
cutoff, the spot might be miHaed.
A density criterion eliminates targets before quantification and evahiation.
Therefore, wo are detecting hits
on the basis of a subjective judgment rt looks darker or brighter), instead of
on the basis of quantitative
data. This type of procedure is difficult to validate and subject to bias.
1n contrnst, our software exploits the regular spacing of the grid to locate
and quantify all of the grid elements
prior to hit identification. This approach (a fixed sampling probe strategy)
uses specific "anchor" spots on the
filters, to provide spatial points of reference. Using these spots, the
soRwaro can identify the clone at each and
every grid element. The software also corrects for local background
variations, illumination differences, nad
other error sources.
With the grid elements localized sad corrected for background, the system
reads data from all the elements.
Every target is the grid is quantified and entered into a database for that
grid. Using the data, objective
statistical methods can be applied to identify positive hits. For example, we
could compare the intensities of all
the grid elements, and select those elements whose signal is more than 10
standard deviation units away from
all mean signal. The use of statistical methods assures that all positives,
even those which may not appear
visually distinct, are identified using objective criteria.
F'mally, the software provides a convenient graphic output that shows results
is an easily interpreted way, and
also provides full numerical data that can be exported to your data management
software.
The goal of gone expression studies is to find genes that are expressed
differentially across two or more
conditions. For example, we might compare expression of a given gene in
control cells from a diseased line,
and in the same type of cells exposed to a pharmaceutical agent. Traditional
methods for evahmting gene
expression are based on assaying the RNA levels of iodividuel genes
sequentially or a few at a time. In contrast,
the use of high~ensity grids allows the expression of thousands of genes can
be studied, simultaneously. The
key difference between library screening and gene expression is that we are
not looking for a few hits that
identify hybridization to a specific known sequence. Rather, we era avah~ating
the degree to which a large
number of genes are expressed.
Gene expression is investigated by hybridization of complex mixtures of probes
to cDNA libraries. . The library
is spotted in replicate, to generate two or more identical high~density grids.
Different probes are derived
iodependeafly, using RNA isolated from each condition in the study. Each RNA
sample is actually a complex
mixture of many different mRNA molecules, corresponding to the products of
different genes. The expression
level of an individual gene is reflxted in the number of mRNA molearlea~that
it contn'butes to this complex
mixture. The higher the expression, the more mRNA molecules in the mixture.
When the complex probes are generated (using reverse transcriptase),
radioactive or biotinylated nucleotides are
incorporated. Following hybridization, the activity of a particular gene is
proportional to the signal detected at
each spot on the high~ensity grid.
Unlike the library screening case, where only a few spots hybridize, most
spots will hybridize to the mixture
of RNAs used in studying gene expression. Consequently identifying the
position of all of the grid spots is not
Inuging Research Inc.
CA 02263226 1999-02-15
WO 98/07022 PCT/US97/15269
41
High Density l3rida
difficult. The imaging ayatarr uses information fmm the actual spot metriz to
align the sampling grid. The real
problem in studying gene exprataion is the sheer volume of the data. High-
density grids can contain tens of
thousands of spots acmss multiple membranes, and the expression value of each
spot moat be retained. It is
important that the image analysis software be designed to beadle such large
data sets, and compare these data
sots between conditions. Our software does include these capabilities.
The issue of comparing oxpmeaioa across conditions is non-trivial. Each grid
will differ from the others in the
absohrte intensity of signal, so we cam~ot simply compare signal strength
acmsa specimens. Our software offers
a number of methods by which irrelevant inter-membrane variation can be
minimized, For example, we can
define internal standards (a particular gene, or the mesa expression level of
all genes) within each grid. After
normalizing values to as internal standard, intensity values can be compared
between grids. Another strategy
is to compare difference scores betwxn conditions, using the diatnbution of
differences to localize bite. The
difference acorn diatrrbution is free of the influence of general intensity
difFereacea between membranes, and
has some other beneficial statistical properties, Using those, and other
methods inchrded in our software, we
can perform various types of poet-hoc data analyses to arrive at the best
method for comparing gene ezpresaion.
The results of a large gene expression study constitute a massive data set.
Therefore, it is important that data
management functions summarize sad manipulate this data set. Our elemental
display fimctiona create easily
understood graphics drat aummariza the r~aults of complez ezpression studios.
Our data export functions create
matrices that can be imported directl into your corporate data etnrcturea.
2. Details of the High Density Grid Software
Three main tasks moat be accomplished before a high density grid can be
analyzed.
1. Identify each grid element (which we will refer to as a target) so that its
location in the matrix
is known. The identification must allow for some variability in creating the
grid.
2. Quantify dem~ty (reflecting hybridization intensity) at each target. This
may rrquire calibration
to density standards, and/or soma form of background correction.
3. Select targets of iater~est. Once the target densities have been
quantified, we can report each and
every target, to analyze gene expression across specimens. As an alternative,
we can just select
a limited number targets of interest (often called hits) from the large array.
The first step is the atralyais is always target identification. The process
of discriminating targets from
background is known as segmentation, and can be performed manually or
automatically.
The simplest form of segmentation is to define each target, one at a time.
This is done by moving the mouse
to place a circle over each target. With each click of the mouse, the
intensity and position of the target are
shown.
In a typical library acre, them are large areas of clear substrate with only a
few, highly visible, dots iadicaking
hits. Clicking on the obvious dots (to generate their location codes) might
seam to be an acceptable detection
method. However, manual segmentation is not practical, even with clearly
visible bite. The pmblam lies in
assigning bite to their proper locations is the grid. Assigning any dot to its
correct position involves first
detecting and aligning all the dots. Of course, you could click oa all of the
dots, manually, but this would be
Imaging Research Inc.
CA 02263226 1999-02-15
WO 98/07022 PCT/US97115269
42
High Density Grids
very timaorn~suming. hnagine trying to identify 1000 targets, and consider
that many labs are hoping to reach
100,000 or more targets in the near future.
A~~tomated Segrmantation
Automated segmentation.finds targets without manual guidance. The quality of
your system's automated
segmentation functions is critical to its success. If automated segmentation
is implemented correctly, it can
provide a rapid and convenient way to identify and analyze many thousands of
targets. If implemented
incorrectly, automated segmentation generates many false positives and false
negatives, that will require
extensive post-scan editing. At worst, poor automated segmentation will yield
spurious data.
The standard method for automated segmentation is to asaiga a specific density
range to targets. This process
is rnferred to as threshokling. Pixels that lie within the density range are
classified as targets. Pixels which do
not lie within this range are classified as background.
A simple density threshold is the best choice if targets are of variable size
and shape, and/or do not occupy fixed
locations within an image. For example, an e~Ision~oated tissue section
labeled with an isotopic in situ probe
contains targets (dark grains) that lie anywhere within the image. We could
process the image to make the
grains maximally visible, set a density threshold (e.g. 50 gray levels), e~
then detect any pixels darker than this
threshold as grains.
With grids, in contn~.st, targets era of a fixed size and are regularly
arranged (Figure 1). We can take advantage
of this regular arrangement, to make segmentation more accurate end efficient.
1n fact, a density threshold is
rarely enough in grid imaging. It is defeated by variable local backgrounds
(e.g. different densities at top left
and bottom right), and by uncertainty in defining the level of intensity that
discriminates a target. Our
experience is that density thresholding is a highly subjective and tricky task
is moat forms of grid analysis.
Flgure 1: Spatially variably targets and grid targiu. The targets in the image
at left vary in size, arid are
spaced irregularly. They would be detuxed by setting a d~rrsity threshold. The
targets in the image at right are
organized as a grid. Thry are detected by placing a fried probe over each
target loeatio».
~o ~~ o0 00 oe
00 ~~ ~0 00 ~~
,ar ~ ~ oo ~~ ~o o~ ~o
~~ oo s~ ~o 00
o ~o ~o eo ~~ 00
~~ 00 00 ~0 00
~ ~0 00 00 00 0~
~~ oo ~0 00 ~o
~ 00 0~ 00 00 ~o
00 ~o 0o m~ o0
Fortunately, grids can be analyzed quite objectively, and much more
efficiently than irregular targets. We know
the spacing, number, and diameter of the targets, so there is no need to use
density differences as the only tool
in target identification. Instead, AIS/MCID use a feed sampling probe
strategy.
lmeging Reaarch lnc.
CA 02263226 1999-02-15
WO 98/07022 43 PCT/US97/15269
High Density Grids
Ia using feed probes, the giid definition dicbcts the seg~mantation pmcesa.
Fined sampling probes are placed
(automatically) over each locetioa in the grid. The difficulty with this is
that real spocimens are rarely perfectly
spaced. We will find that spotting robots wander, manifolds vary, or some
other factor has lead to variations
is the grid. Therefore, segmentation with the fined probe strategy requires
two steps. First, the grid is
propagated to its ideal locations using dot locations from the grid
definition. Thon, the system applies some
rather sophisticated algorithms to perform automatic aiigoment of the grid
with the acWal targets (Figure 2).
Figure 2: A high density grid containing 1536 discrete dot bbts. At left, we
see the image without sampling
probes. The image at right shows the sampling probes in place over each of the
dot blots. We placed the
probes, and aligned them with the dots, automatically.
There am a number of advantages to using the fixed sampling probe method, as
opposed to scanning for targets
that exceed a density threshold.
1. We detect and quantify every target, including those that contain data ai
background or nesr-
background levels.
2. Detecting every target allows ua to use objective statistical procedures
('instead of subjective
density thresholds) to define hits.
3. We can follow a given target acmss any number of experimental conditions,
including those that
do not activate the target in an obvious way. This is particularly important
in gene expression
studies.
Imaging Research Inc.
CA 02263226 1999-02-15
WO 98/07022 PCT/US97/15269
44
High Density Grids
The grid is constructed using spacing parameters (distances between dots and
between groups of dots) entered
at the keyboani. With the spacing defined, the origin of the grid is indicated
and the entire grid then grows out
from the origin.
a is likely that some of the grid sampling probes will not lie directly over
their assigned targets. To overcome
this problem, automatic alignment can be performed. During this process, a
fuzzy logic algorithm places each
discrete grid element over the location that best fits the actual image data.
If further alignment is required, any
grid element or group of elements can be dragged into position using the
mouse.
Not all specimens have visible dots which can be used for fine alignment. In
library screening, it is common
to have a very large grid with only a few dots visible. 1n this case, that the
fine alignment algorithms lack data
to work with unless known reference points ace placed onto the grid. These
reference points, known as anchors,
contain an obvious target and are used to guide the automated alignment. For
example, our spotting robot
creates a grid containing 6144 discrete dots. We could place easily detected
amounts of label into dots at the
four corners, and at a few mode strategic locations. Whey we create the grid,
AIS/MCID will perform automatic
alignment, using the anchor points as references.
Detail and Screenings Modes
In detail mode, values are obtained for each and every target within the grid.
Detail mode gives a complete
description of the targets, and allows direct comparisons between up to four
grids. However, the data tables
often contain many thousands of raumbag, a~i this can slow your system down.
1n general, there is no problem
dealing with a few arrays of 5,000 dots each. However, managing very large
numbers of dots (e.g. 30,000 or
more) can limit thnougbput. Scanning the grid is not the major problem.
Rather, just recalculating a data table
containing 50,000 numbers takes some time. If data maaagemeat is proving to be
too slow, consider using
screening mode.
Detail mode is most useful in gene expression studies, and in some cases of
screening by hybridization. Both
these applications involve more than simple discriminations between obvious
hits and background. Therefore,
it is useful to have knowledge of how every point in the grid is reacting.
Screening mode analyzes one grid at a time, and displays only the bite from
that grid. Use scrxning mode to
screen unlmowns against large libraries, when only a small proportion of the
grid elements contain label.
Imaging Research Inc.
CA 02263226 1999-02-15
WO 98/07022 PCT/US97/15269
high Density arias
Screening uses a similar logical structure to detail mode. That is, all of the
data are scanned and quantified prior
to statistical segmentation. The difference is that we want to identify a few
labeled bite from a relatively clean
spa~amen. Data from the unlabeled grid positions need not be reported, as they
just slow down system response.
After screening eegm~tation, the misses are discarded and only the hits are
retained. Because only the hits are
displayed in the data tables, data management is much faster.
The difference between the d~sil a~ screening modes lies in what happens after
the grids have been quantified.
Detail mode reports each target value, so that you can perfonn exploratory
data analysis post hoc. In contrast,
screening mode reports only valid hits. It sets a cutoff point in the
distnbution of targets (e.g. 5 standard
deviations above the mean) to select a limited number of hits for further
attention. Only those targets that lie
beyond the cutoff point are shown in the data lists.
Selecting Interesting Tara~ts- Statistical Segmentation
In both the detail and screening modes, an initial segmentation step uses feed
sampling probes sad automated
alignment to generate data from each and every target is the grid. Once the
targets have been segmented sad
their densities or volumes quantified, various procadurea nre used to select
targets of interest.
We use the tenn statistical segmentation to descnbe the process by which we
select a limited number of hits
from the entire population (screening mode), or track the most important
differences in gene expression from
one specimen to another (detail mode). We can define statistical segmentation
as the application of statistical
reasoning to the automated def~tion of targtts.
Consider an experiment in which we screen a cDNA library with probes from
three cell lines. These library
is spotted on thcix identical membranes (20K pmbea/m~braae), a~ one cell line
is applied to each membrane.
Following the hybridi?ation p~uC,ea, we examine auteradiographa of the three
membranes and determine that
all the cell lines show intense hybridization with two of the clones in the
library. However, the third cell line
(line C) also appears to hybridize (somewhat less intensely) with an
additional clone (Figure 3). It is possible
that line C is different them the other two, but how are we to know?
Imaging Reaearcfi lnc.
CA 02263226 1999-02-15
WO 98/07022 PCT/US97/15269
46
High Density l3rids
'' G
..
a
~gut't 3: ~natially variable targets and
grid targets. Tile targets in the image at
left vary in size, and are spactd
irregularly. They would be detected by
setting a density threshold. TIu targets
in the image at right are organized as a
grid They are detected by placing a
fised probe over each target location.
Figure 3: Screening a cDNA library with probes from three cell lines. All
three cell lines hybridize to two
of the clones. Cell line C appears to hybridize to a third clone. To
detenmirtt whether this is a real e"~'ect,
we need to compare the iruensity of hybridization at the third clone, across
a!1 three membranes.
Several factors could affect our decision about the third clone in line C.
1. The third clone may hybridize intensely to line C, but also hybridizes less
intensely to cell lines
A and B.
2. The third clone hybridizes exclusively to line C, but the hybridization
signal is weak.
Imaging Reaeacvh Inc.
CA 02263226 1999-02-15
WO 98/07022 PCT/US97/15269
47
High Density Grids
3. The pmperation may.contain any number of ambiguous spots that complicate
interpretation of the
third clone.
1n these cases, we might not have a simple, black-white discrimination.
Rather, we need to make a judgment
call regarding the third clone. Is the signal intense enough to be considered
a hit, or not? Simply setting a
density threshold that "looks good" is rather arbitrary.
To help you make an objective decision, the system finds and calculates
intensities for all of the targets. The
data include those targets that are at background intensity, those that era
somewhat above background but still
faint, and the more intense probe-clone interactions which are obvious to our
eyes.
Once we have the complete data set, we can apply variance-based statistical
procedures to determine the
probability that each observed int~sity is a hit. A variance-based
discrimination differs from a simple threshold
in that it doesn't just detect bite on the basis of density. Rather, it
compares the density of each target to the
distn'bution characteristics of all the targets. Hits are those targets which
are moat unlike the others. The logic
is that a target that is very different from the rest is probably one that
should be investigated, This type of
varianco-based threshold is both easily validated (using atatistica), and
easily applied.
Statistical segmentation is useful in tracking gene expression. In these
studies, we are usually comparing the
intensity of a given chono-probe interaction across multiple grids.
lateresting interactions are those which are
enhanced or inhibited by an experimental manipulation (e.g. applying a
potential pharmaceutical compound).
The steps in analyzing this type of study by statistical segmentation are as
follows.
1. Quantify the level of gene expression by measuring densities in all the
targets, across a number
of specimens. Each specimen corresponds to a different condition in the
experiment.
2. Calculate difference scores for every pair of targets. Now, we have a
diatnbution of differences
for each target clone, across all conditions of the experiment.
3. Cahcuhate the mean and the SD of the diatnbution of difference scores.
4. The statistical se8menration step. Select targets showing difference scores
tying some number of
SD units above or below the mean. These targets could be classified as bite.
Being a vsriance-
based discrimination, this proasa of hit selection is fma of inter-grid
differences in overall density.
5. Display the targets in a graphic format, called an elemental display (see
below).
Statistical segmentation is the application of statistical reasoning to the
analysis of grid data. Its advantages are
that it provides objective criteria for discriminating targets, and that it
allows ua to compare data across
specimens. Thin latter advantage is present because variance-based analyses
minimize the influences of
irrelevant iatluencea on our analyses (e.g, processing effects, exposure
times).
In sum, etoal segmentation is an objadive gcocodure for extracting valid hits
from large bodies of grid data.
Major advantages of statistical segmentation are that:
a) we can document the enact criteria used to classify bite;
b) we can minimize the effects of extraneous processing variables, to simplify
comparison across
grids.
Imaging Rese~roh Inc.
CA 02263226 1999-02-15
WO 98/07022 PCT/US97/15269
48
High Density Grids
Grid analysis can produce a lot of numerical data points. These data can be
presented in any way you see fit.
For example, export the data matrix to Excel, rank by hybridization intensity,
and use the ranked data table to
communicate your results.
Another option is to create an elemserual display. Thin is a graphic image
which uses various ways to flag a
limited number of interesting targets. In a screening study, for example,
instruct the elemental display to flag
any dots lying more than six SD units above the mean dot density. The
elemental display directs your attention
to the most relevant data points from the thousands produced in a typical run
(Figure 4).
Of course, with a clean membrane and a binary label (on or off), the elemental
display may sot be required.
We can just look at the original image to see which dots are hits. However,
the elemental display becomes very
useful when the specimen is not clean, or if there is a gradation of label
intensities. In these cases, our eyes tend
to be uncertain and it is easier to let the computer show the hits in color-
coded and easily appreciated form.
The elemental display is pertiarlarly useful in detail mode, when comparing
across two or more specimens. The
mean target intensity, background level, and other factors will tend to vary
from grid to grid. Therefore, it is
difficult to make visual judgments about the relative intensity of a
particular grid point across specimens. 1n
contrast, the elemental display clearly shows alterations across grids. Any
outcome of statistical segmentation
can be summarired by a single elemental display (Figure 5).
Any form of segmentation will be affected by background. Ideally, the level of
background will be both low
and constant. Low background improves sensitivity. Constant background
simplifies target detection.
Unfordrnately, backgrounds are rarely low and constant. Therefore, AIS/MC1D
have a variety of background
corrections available.
None No background correction.
Selected dots Certain dote (e.g. top left of each primary) are specified to
contain background.
Surrounding pixels The system looks at the outer boundary of each dot, and
calculates a background for that dot from these surrounding
pixels.
User selections You define one or more arms of the specimen which are used for
background correction.
Image processing Soma of the image processing functions are very effective in
removing background that varies from point to point is the image.
There are weaknesses with all of the correction methods just descn'bed. The
best option is to minimize
backeround variation in the oricinal specimen.
Summary: Features ojThe Hlgh Density Grid Study Type 1
Large grids analyzed qttickly and automatically
Any number of targets can lie within a grid. Any medium can be used as a
matrix for the grid (e.g. membranes,
gels, microtiter plates).
2. Automatic propagation, alignment, and background correction.
The grid is created (propagated), automatically, using apacinga entered by the
user. Following propagation, the
grid is automatically aligned to the best data locations within the image and
background is removed.
Inuging Research Inc.
CA 02263226 1999-02-15
WO 98/07022 PCT/US97/15269
49
High Density Grids
3. Detail and Sc~uing Modes
On every scan, all the grid elements era read. However, we can choose to
retain and display all of the daka, or
only rheas data which nre defined as hits. Keeping all of the data allows vary
extensive post hoc aaalyses.
Keeping only the hits caa save time.
4. Statistical segmentation
Hits are defmod, automatically, by locating them within the distn'bution of
all grid elements. This procedure
is objective and easily documented.
5. Compare targets across specimens
Statistical segmentation n>aumizes the of prooesaing factors, and allows
comparison across specimens.
For example, we can look for increases or decreases in hybridization
intensity, across one control sad three
experimental membranes, each containing 5,000 dot blots.
6. Elemental displays
These simplified graphic displays can show one or more arrays of dots reduced
to a few color-coded hits.
Imaging Research Inc.
CA 02263226 1999-02-15
WO 98/07022 PCT/US97/15269
High Density Grids
Referettees
Eggers, M., Hogan, M., Reich, R.K., Lea>lure, J., E6rlich, D., HolIis, M., et
al., A microchip for quantitative
detection of molecules utilizing hm>,inescent and radioisotope reporter
groups, Biotechniques 17:516-
525 (1994).
Khrapko, K.R., Lysov, Y.P., Khorlin, A.A., Ivanov, LB., Yerahov, G.M.,
Vasilenko, S.K., Florentiev, V.L.
and Mirrabeldzov, A.D. A method for DNA sequencing by hybridization with
oiigonucleotide matrix,
DNA Sequence - Journal of DNA Sequencing and Mapping 1:375-388 (1991).
Lamture, J.B., Beattie, K.L., Burke, B.E., Eggera, M.D., Ehrlich, DJ., Fowler,
R., Hopis, M.A., Kosicki,
B.B., Reich, R.K., Smith, S.R., Varma, R.S. and Hogan, M.E. Direct detection
of nucleic acid
hybridization on the surface of a charge coupled device, Nucleic Acids
Research 22:2121-2125 1994.
Iipschutz, R.J., Morris, D., Chee, M., Hubbell, E., Kozsl, M.J., Shah, N.,
Shen, N., Yang, R. and Fodor,
S.P.A. Using oligonucleotide probe arrays to access genetic diversity,
BioTechniques 19:442-447
(1995).
Maskos, U. and Southern, E.M. Parallel analysis of oligodeozyn'bonucleotide
(oligonucleotide) interactions.
I. Analysis of factors influencing oligonucleotide duplez formation, Nucleic
Acids Research 20:1675-
1678 (1992).
Mason, R.S., Rampal, J.B. and Coassin, PJ. Biopolymer synthesis on
polypropylene supports. I.
Oligonuclaotides, Analytical Biochemistry 217:306-310 (1994).
Pearaon, D.H. and Tonucci, RJ. Nanochannel glass replica membranes, Science
270ai8-69 (1995.
Peace, A.C., Solas, D., Sullivan, EJ., Cronin, M.T., Holmes, C.P. and Fodor,
S.P.A. Light-generated
oligonucleotide arrays for rapid DNA sequence analysis, proceedings of tlu
National Academy of
Sciences USA, 91:5022-5026 (1994).
Saiki, R.K., Walsh, P.S., Levenson, C.H. and Erlich, H.A. Genetic analysis of
amplified DNA with
immobilized sequence-specific oligonucleotide probes, Proceedings of the
National Academy of
Sciences USA, 86:6230-6234 (1989).
Schena, M., Shalon, D., Davis, R.W. and Brown, P.O. t~uantitative monitoring
of gene expression patterns
with a complementary DNA micmarray, Science 270:467-470 (1995).
So~rtl~n, E.M. DNA cJupa: analyi~ng sequence by hybridizsLion to
oligonucleotidea on a large scale, Trends
in Genetics 12:110-115 (1996).
Southern, E.M., Maskos, U. and Elder, J.K. Analyzing and comparing nucleic
acid sequences by hybridization
to arrays of oligonucleotides: Evaluation using ezperimental models, Genonucs
13:1008-1017 (1992).
M:\1191\OCI07UBL06l9
11111$111$ RCiG4lC~ lilt.