Note: Descriptions are shown in the official language in which they were submitted.
CA 02360229 2004-04-02
1
METHOD FOR DIAGNOSING PROLIFERATION REGIONS AND DEVICE
FOR REALISING THE SAME
FIELD OF TECHNOLOGY
This invention relates to medicine and, more particularly, to contact-free
clinical
diagnostics of proliferation areas in biological tissues and their
localisation areas in vivo
in a live organism on the basis of endogenous porphyrin fluorescence.
BACKGROUND OF THE INVENTION
Both the known and the proposed proliferation area diagnostics methods are
based
on the ability of porphyrins to be localised selectively in proliferating
tissues (The Big
Medical Encyclopaedia, RU, Moscow, Sovetskaya Entsiklopedia Publishers,1983,
Volume
20, Page 349).
The known proliferation area diagnostics methods in oncology are the
introduction
of exogenous porphyrins to a patient (Photodynamic Therapy and Fluorescent
Diagnostics
of Malignant Tumours with the Use of Photogem Preparation, V.I. Chissov et
al.,
Khirurgiya (Surgery), No. 12, 1994, p. 3-6; Clinical Fluorescent Tumour
Diagnostics with
Photosensitinogen Photogem, V.I. Chisov et al. Khirurgia (Surgery), No.
5,1995, p. 37-41;
(see also references in those articles) or the introduction of the
preparations that stimulate
active generation of endogenous porphyrins in a patient's organism
(Pharmacokinetic of
Endogenous Porphyrins Induced by 5-Aminolevulinic Acid as Observed by Means of
Laser
Induced Fluorescence from Several Organs of Tumour-Bearing Mice, Ronald Sroka,
Reinhold Baugartner, Wolfgang Beyer, Liebwin Gossner, Tarek Sassy, Susanne
Stocker.,
BIOS'95, 4-10 February. 1995, SPIE Proc. Vol. 2387, pp. 22-29) and, after some
time,
sufficient for selective re-distribution of the introduced exogenous
porphyrins in tissues or
stimulation of the generation and re-distribution of endogenous porphyrins,
consecutive
irradiation of small segments of the surface of the tissue under
2
examination with the wave length which falls into the porphyrin fluorescence
excitation band, with the recording of the fluorescence band simultaneously to
that.
The main disadvantage of these diagnostics methods is their invasiveness, that
is, the need for the introduction to a patient of either exogenous porphyries
or the
substances which stimulate active generation of endogenous porphyries in the
organism. Increase in the content of porphyries in the organism results in all
negative
developments typical of porphyria, such as, porphyrin exchange disfunction,
including
significant increase in photosensitivity of the organism. In this connection
the given
methods cannot be used in primary diagnostic examination, particularly in case
of
1o public preventive monitoring of the population.
The disadvantages of the indicated diagnostics methods also include their low
performance caused first of all by quite a long period of time required for
the selective
re-distribution of the introduced exogenous porphyries in tissues or the
stimulation of
the generation and re-distribution of endogenous porphyries. Besides, the
indicated
methods record fluorescence bands which implies consecutive analysis of the
tissue
under examination from orie point to another. Apart from the optic properties
of the
tissue proper, the size of a point, that is the area of tissue being examined
at a given
time; is also determined by the apertures of the radiation which induces
fluorescence
and the optical fibres which receive the fluorescent response and the location
of their
front-sides in relation to the tissue under examination. This results in low
spatial
resolution and poor reproducibility of the measurement results for the given
methods.
If it is necessary to examine big areas of various organs, skin etc., the
probability of
"blanks", that is, the segments of the tissue under diagnostics that escape
examination,
is high. Besides, a disadvantage of the given methods is that it is difficult
to document
the location of proliferation areas and their localisation boundaries.
A known cancer identification method (Tumor detection in HpD-sensitized
mice with fluorescence lifetime imaging, R. Cubeddu, G. Canti, A. Pifferi, P.
Taroni,
and G. Valentini, SPIE Proc. Vol. 2972, pp. 148-153) is the introduction of an
exogenous derivative of hematoporphyrin and after some time, sufficient for
its
3o selective re-distribution in tissues, the exposure of the tissue under
examination to
CA 02360229 2001-07-17
3
short radiation pulses which induce fluorescence of the hematoporphyrin
derivative
with the wave length of 405 nm and the recording of the fluorescent image with
time
delay in relation to the generating radiation pulse so as to identify only the
fluorescent
response of the substance to be identified.
'The disadvantages of this method include its invasiveness caused by the need
for introducing exogenous fluorophore, as well as the complexity, high cost
and
relatively low resolution of the equipment required for producing the image
with a
millimicrosecond time delay in relation to the pulse of the radiation which
induces
fluorescence.
1o A known method of the diagnostics of affected tissues (Mechanisnns of ratio
fluorescence imaging of diseased tissue, Jianan Qu, Calum MacAulay, Stephen
Lam
and Branko Palcic, SPIE Proc. Vol. 2387, pp. 71- 79), is the irradiation of
the tissue
segment under examination inducing endogenous fluorophores fluorescence with
the
wave length of 442 nm and the recording of two fluorescent images of the same
tissue
segment at the wave lengths of 500 nm and 630 nm. Then the ratio between two
flubrescent images produced in the red and in the green wave length bands is
taken,
and the degree of effect on the tissue is determined by this ratio, if it
exceeds a certain
value.
The disadvantage of this method is relatively low sensitivity which dictates
the
2o need for using expensive cameras which brightness amplifiers. This is
caused first of
all by the fact that the blue radiation (442 nm) penetrates the tissue to
quite
insignificant depth and, respectively, can induce the fluorescence of only the
fluorophores located close to the surface. Thus, it is di~cult to carry out
the
diagnostics of defects under the surface. The optical properties of biological
tissues in
the blue (442 nm), green (500 nm) and red (630 nm) spectral bands are
different to a
significant extent and can vary from one patient to. another which results in
the need
for using special algorithms for processing diagnostic information. Besides,
railcar
with the wave length of 442 nm falls into the band which induces the
fluorescence of a
whole range of endogenous fluorophores, such as collagen, elastin, porphyries
and
3o their complexes with proteins, etc. Also, the concentration of porphyries
and their
CA 02360229 2001-07-17
CA 02360229 2001-07-17
4
fluorescing complexes with proteins is frequently significantly lower than the
concentration of other ffuorophores. The fluorescence bands of various
endogenous
ffuorophores are quite broad and partially overlap, therefore it is difficult
to
differentiate between them in case of their simultaneous excitation.
Fluorescence of
the fluorophores the concentration and distribution of which in tissues do not
provide
the required information regarding tissue condition is a confixsing noise
factor. which
distorts the informative signal.
A known method of detecting skin anomalies (Method of detecting anomalies
of the skin, more particularly melanomae, and apparatus for carrying out the
method,
Gerhard Martens, Erhard P. H. Gunzel, United States Patent J~ 5363854, Nov.
15,
1994) is as follows: a skin segment under examination is irradiated in the
ultraviolet
spectrum band; the fluorescent image is recorded, and then the same skin
segment is
exposed to visible light, and the reference image of the same skin segment is
recorded
as seen in the visible band. Then a third image is produced where the
brightness of
each point is equal to the ratio between the brightness values of the first
two images in
the corresponding points. Skin segment anomalies are determined by brightness
distribution in the third image.
The disadvantage of this method is its low sensitivity caused by the fact that
wide band ultraviolet radiation induces the fluorescence of virtually all the
ffuorophores existing in the tissue under examination. It is possible to
single out the
fluorescent signal of one type of fluorophores which contains diagnostic
information
is possible only if the concentration of the ffuorophores in question
significantly
exceeds that of other ffuorophores. In a general case, this in turn is
possible only in
case of artificial invasive increase in their concentration. Apart from that,
extremely
low depth of penetration of ultraviolet radiation into skin tissue can be
noted.
CA 02360229 2004-04-02
The proposed invention is aimed at increasing the precision, reliability and
sensitivity
of the diagnostics of proliferation areas in tissues in vivo, increasing the
speed of diagnostics
and eliminating the need for invasive intervention into the patient's
organism.
The indicated technical tasks are addressed as follows:
5 the tissue segment is evenly exposed to monochromatic radiation within the
wave length band
of 630 to 645 nm during the first period, and the fluorescent image of the
tissue segment under
examination is recorded in the spectral wave length band of 650 to 730 nm; the
choice of the
duration of the exposure and, respectively, the recording of the fluorescent
image is based on
the fluorescent signal intensity level and the dynamic range of the recording
device; if the
fluorescent signal intensity level equals the photon noise level or the
internal noise of the
recording device, recording is carried out in several cycles where the
duration of each of them
is determined with regard to the dynamic range value of the recording device,
and the number
of the cycles and, respectively, the total duration of the recording is
determined on the basis
of the required degree of statistical averaging of noise. The resulting
fluorescent image is
produced by way of averaging the brightness values of the corresponding points
of the image
for all recording cycles, determining the significant range of the brightness
values of the
averaged image and broadening this range by way of recalculation with regard
to the entire
dynamic range of the information display device.
The tissue segment under examination is evenly exposed to white light during
the
second period, and its reference colour image is recorded with the same angle
and scale as in
the case of recording the fluorescent image.
6
The areas where proliferation intensity changes in the tissue segments under
examination are determined by formal signs in the fluorescent image, and the
localisation areas are determined by comparing the fluorescent image with the
reference colour image with the use of the coordinate grid, reference points
applied
thereon or by way of overlaying the images.
Besides, two auxiliary fluorescent images are recorded additionally during a
diagnostic session with the use of the same equipment, in the same spectral
band, with
the same scale, wave length, density, power and duration of the exposure of
the
radiation inducing fluorescence as in the case of recording the fluorescent
image of
l0 the tissue under examination.
The first auxiliary fluorescent image, the fluorescent image of the test
object
which is, for example, a cassette with several compartments filled with a
stable
fluorophore solution with knoum concentrations which differ by a known number
of
times from one compartment to another; the fluorophore solution should have
the
spectral bands of excitation and fluorescence which are similar to those of
the
endoporphyrins to be identified and their fluorescing protein complexes in the
tissues
under examination, and have the absorption and scattering values in the
spectral bands
under consideration which are similar to the corresponding values of the
tissues under
examination.
2o The first auxiliary fluorescent image is used to monitor (check) the
diagnostic
process sensitivity for ensuring its authenticity throughout the service life
of the
diagnostic equipment. Besides, by comparing the brightness values of
particular
segments in the fluorescent image of the tissue under examinarion and the
first
auxiliary fluorescent, image (with the test object), the concentration of
endogenous
porphyries and their fluorescing complexes with proteins in the tissue under
examination is estimated.
The second auxiliary fluorescent image is the fluorescent image of the natural
proliferation area of the same patient (for example, the growth areas of an
unaffected
nail plate).
CA 02360229 2001-07-17
7
The second auxiliary fluorescent image is used to determine contrast between
the segments which correspond to actively proliferating tissue and are
adjacent to
poorly proliferating or non-proliferating tissue, as well as the brightness
gradient
between them. A similar procedure is applied to the fluorescent image of the
tissue
under examination, and the comparison is carried out between the contrast and
brightness gradient at the second auxiliary fluorescent image. The degree of
proliferation of the tissue under examination is estimated on the basis of the
comparison results. The brightness values which are averaged for the recording
period, as well as the brightness values averaged by the space which
corresponds to
the tissue segments in question are used for establishing contrast and
brightness
gradient in the fluorescent images.
Two more auxiliary monochrome images of the tissue under examination are
recorded additionally with the same angle and scale as in the case of
recording the
fluorescent image to study the tissues that contain segments with
(significantly)
different absorption and scattering values in the spectrum bands used: one
image (or
the third auxiliary image) is recorded at the wave length of the used source
of the
radiation inducing fluorescence with even exposure of the tissue under
earamination to
radiation from this source; another image (or the fourth auxiliary image) is
recorded in
the same spectral band where the fluorescent image is recorded, but with even
2o exposure of the tissue under examination to radiation from an additional
source in the
same spectral band (in the fluorescence band used).
A coordinate grid and reference points are also applied to the third and
fourth
monochrome auxiliary images, or provisions are made for the possibility of
overlaying
or combining with the fluorescent and colour reference images of the tissue
under
examination.
The third and fourth monochrome auxiliary images are used to assess optical
absorption and scattering values of the tissue segment under examination in
the
spectral bands that correspond to the selected bands of excitation and
fluorescence of
endogenous porphyries and their fluorescing complexes with proteins. The
location of
local changes in optical absorption and scattering values is determined by
comparing
CA 02360229 2001-07-17
CA 02360229 2004-04-02
8
the third and fourth monochrome auxiliary images with the fluorescent and
colour reference
images of tissue under examination with the use of the coordinate grid or
reference points
applied thereon or by overlaying them on each other.
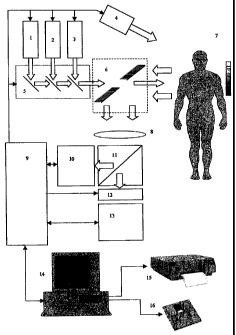
BRIEF DESCRIPTION OF THE DRAWINGS
FIG. 1 displays the block diagram of proliferation area diagnostics device:
1 - white light source for illuminating the surface of tissue under
examination when recording
the colour reference image;
2 - source of monochrome radiation in the wave length band of 650-730 nm for
illuminating
the tissue under examination when recording the fourth monochrome auxiliary
image;
3 - source of monochrome radiation inducing the fluorescence of endogenous
porphyrins and
their complexes with proteins in the wave length band of 630-645 nm;
4 - source of laboratory premises lighting in the visible spectrum band
without radiation in the
wave length band of above 650 nm;
5 - switching unit for radiation of sources 1, 2, 3 and making a collinear ray
configuration;
6 - a unit for collinear illumination of tissue under examination from sources
1, 2, 3 and
receiving reflected signals and the fluorescent signal;
7 - the object under examination and text object;
8 - lens;
9 - video, synchronisation and control signal processor;
10 - colour reference image recording unit;
CA 02360229 2004-04-02
9
11 - image splitting unit;
12 - radiation filtration unit;
13 - a unit for recording fluorescent images and auxiliary monochrome images
(auxiliary
monochrome images can also be recorded with the use of unit 10);
14 - a computer with graphical information display device;
- graphical data output and documenting device;
16 - data storage device
FIG. 2 displays the fluorescent image of the finger of a healthy person.
Intensive
fluorescence areas correspond to nail plate growth area, a natural intensive
proliferation area.
10 FIG. 3 displays the fluorescent image of a patient's back skin. The point
foci of
intensive fluorescence correspond to sebaceous gland location.
FIG. 4 displays the fluorescent image of a healing wound on a patient's hand.
Intensive
fluorescence areas correspond to tissue reparation area.
FIG. 5 displays the fluorescent image of a tumour area of patient T., 60 years
of age.
15 A continued tumour growth focus (1.7×l.5 cm) which cannot be
identified visually is
identified against the background of a slowly granulating wound developed as a
result of
malignant skin tumour dissection (metatypical cancer with the dimensions of 5
x 6 cm). The
data was confirmed by a morphologic study of the operation material produced
in a repeated
operation. The wound surface in the fluorescent image corresponds to the light-
grey
background (feebly marked fluorescence of slowly developing granulations).
There is a
segment with more express fluorescence in the bottom right wound quadrant;
this segment
fully corresponds to continued tumour growth area.
CA 02360229 2004-04-02
FIG. 6 displays the fluorescent image of the tumour area of patient C., 57
years of age.
The diagnosis is back skin solid structure basalioma. The fluorescent image
displays a bright
area of active tumour proliferation which infiltrates the surrounding skin in
peripheral areas
outside visually identifiable limits.
5 FIG. 7 displays the fluorescent image of the tumour area of patient M., 66
years of age.
The diagnosis is disintegrating right palm skin syringoepitelioma. Intensive
fluorescence areas
correspond to active tumour proliferation areas. Dark spots in the tumour
centre correspond
to necrosis segments.
DETAILED DESCRIPTION
10 In order to implement the claimed method, a proliferation area diagnostics
device is
proposed; the layout of the device is displayed at FIG. 1; the device
comprises a monochrome
source of the radiation inducing the fluorescence of endogenous porphyrins and
their
complexes with proteins 3, fluorescence image recording unit 13, reference
image recording
unit 10, a computer with graphic data printing, documenting and storage
devices 14, 15, 16.
The distinctive feature of this device is that the monochrome source of the
railcar inducing the
fluorescence of endogenous porphyrins and their complexes with proteins
operates within the
wave length band of 630-645 nm, the fluorescent image recording unit is
implemented in the
form of a monochrome CCD-camera with variable frame exposure time and
comprises
additionally a white light source for exposing the tissue surface under
examination when
recording the reference colour image l, a source of monochrome radiation
within the wave
length band of 650 to 730 nm for exposing the tissue under examination when
recording the
fourth monochrome auxiliary image 2, a source of lighting the laboratory
premises in the
visible spectrum band which does not radiate in the wave length band of above
650 nm 4, a
radiation switching unit for sources 1, 2, 3 and a unit for making a collinear
ray configuration
5, a unit of the collinear illumination of the tissue under examination from
sources l, 2, 3 and
receiving reflected signals and the fluorescent signal 6, image splitting unit
11, radiation
filtration unit 12, a processor for video signals, synchronisation and control
signals 9 linked
to a computer, the fluorescent image recording unit, the reference image
recording unit, the
unit for switching radiation sources and making a collinear ray configuration,
the radiation
filtration unit and radiation sources 1, 2, 3, 4.
CA 02360229 2004-04-02
11
The proposed device operates as follows
Radiation coming from source 3 through switching unit 5 and collinear
illumination
and receiving unit 6 evenly illuminates the tissue segment of object 7 under
examination. The
fluorescent response from the tissue segment of object 7 under examination is
processed
through collinear illumination and receiving unit 6 by lens 8 to be made an
image at the
receiving element of recording unit 13 through image splitting unit 11 and
radiation filtration
unit 12. The recording mode is input by the processor for video,
synchronisation and control
signals 9. The video signal comes from recording unit 13 to processor 9 which
processes the
recorded fluorescent image and transmits it to computer 14 and further to data
printing and
storage devices 15 and 16.
During the next period radiation coming from white light source 1 through
switching
unit 5 and collinear lighting and receiving unit 6 evenly illuminates the
tissue segment of
object 7 under examination. The light reflected from the tissue segment of
object 7 under
examination is processed through collinear illumination and receiving unit 6
by lens 8 to be
made an image at the receiving element of recording unit 10 through image
splitting unit 11.
The recording mode is input by video, synchronisation and control signal
processor 9. The
video signal comes from recording unit 10 to processor 9 where the recorded
reference image
in colour is processed, if necessary, and is transmitted to computer 14 and
further to data
printing and storage devices 15 and 16.
The third auxiliary monochrome image is recorded with even illumination of the
tissue
segment of object 7 under examination by radiation from source 3 through
switching unit 5
and collinear illumination and receiving unit 6. The light reflected from the
tissue segment of
object 7 under examination is processed through collinear illumination and
receiving unit 6
by lens 8 to be made an image at the receiving element of recording unit 10
through image
splitting unit 11 (or at recording unit 13 through image splitting unit 11 and
radiation filtration
unit 12; the filter is changed in this case upon a signal from processor 9).
The recording mode
is input by video, synchronisation and control signal processor 9. The video
signal goes from
recording unit 10 (or 13) to processor 9 where the recorded auxiliary image is
processed, if
CA 02360229 2004-04-02
12
necessary, and transmitted to computer 14 and further to data printing and
storage devices 15
and 16.
The fourth auxiliary monochrome image is recorded with even illumination of
the
tissue segment of object 7 by radiation from source 2, through switching unit
5 and collinear
illumination and receiving unit 6. The light reflected from the tissue segment
of obj ect 7 under
examination is processed through collinear illumination and receiving unit 6
by lens 8 to be
made an image at the receiving element of recording unit 10 through image
splitting unit 11
(or at recording unit 13 through image splitting unit 11 and radiation
filtration unit 12; the
filter is changed in this case upon a signal from processor 9). The recording
mode is input by
video, synchronisation and control signal processor 9. The video signal goes
from recording
unit 10 (or 13) to processor 9 where the recorded auxiliary image is
processed, if necessary,
and transmitted to computer 14 and further to data printing and storage
devices 15 and 16.
The first and second auxiliary fluorescent images are recorded in the same way
as the
fluorescent image of the tissue under examination (but with other recording
objects).
The object position should not change when recording the fluorescent, colour
reference, third and fourth auxiliary monochrome images.
The sequence of recording the fluorescent, colour reference, third and fourth
auxiliary
monochrome, first and second auxiliary fluorescent images can be different.
When looking for particular tissue segments (especially in case of endoscopic
examination) the device operates in the view mode with continuous display of
the colour and
(or) fluorescent tissue image on the monitor screen.
The software of video, synchronisation and control signal processor 9 and
computer
14 should support the operation of the claimed device with the use of the
claimed method.
CA 02360229 2004-04-02
13
Positive Effect as Compared with Previous Technology Level
The aforementioned technical tasks are resolved by the proposed method due
to the fact that, as compared with its. analogues described above, firstly, in
order to
induce fluorescence, it uses long wave radiation in the wave length band of
630 - 645
5 em which is within the fluorescence excitation band of only endogenous
porphyries
and their complexes with proteins and does not induce interfering fluorescence
of
other endogenous fluorophores. However, it is known that it is the relative
distribution of the concentration of endogenous porphyries and their complexes
with
proteins in tissue that can provide information regarding the degree of
proliferation of
to this or another tissue segment. Statistical processing of low level
fluorescent signal
allows to increase the real sensitivity of recording by averaging noise,
since, according
to classical statistics, the root-mean-square deviation of the number of
independent
events An is in proportion to the square root of the number of events n , the
relative
value of fluctuations is in inverse proportionality to ~n
en
n
All this allows to record the fluorescent images reflecting the relative
distribution of the natural concentrations of endogenous porphyries and their
complexes with proteins particularly in tissue and eliminates the need for
prelinunary
preparation of the patient, as well as the need for invasive intervention into
the
2o patient's organism, increases the precision and reliability of diagnostics.
Besides, it
eliminates the need for using expensive recording equipment with cooled
receivers,
brightness intensifiers etc. The diagnostic information can be easily
documented and
interpreted.
The use of the colour reference image of the tissue under examination
2s combined with the fluorescent image allows to precisely locate
proliferation areas and
makes the method more convenient in practical use.
The use of the first auxiliary fluorescent image of the test object allows to
monitor the process of diagnostics and achieve the consistency of recording
results,
CA 02360229 2004-04-02
14
monitor porphyrin exchange fluctuations in tissues and proliferal activity
fluctuations
in the patient's organism over a long period of time.
The use of the second auxiliary fluorescent image allows to compare the
degree of proliferation in the tissue under examination and the degree of
proliferation
in the healthy tissue of the same patient in the natural proliferation area.
This allows to
eliminate the effect of porphyrin exchange fluctuation factors on the results
of
diagnostics and the level of proliferative activity in the organism of a
particular
patient, that is, it allows to link the results of diagnostics to
peculiarities in the
organism of a particular patient.
to The use of the third and fourth auxiliary images of the tissue under
consideration allows to adjust the erect of local changes in optical
absorption and
scattering values of the tissue under examination in the spectral bands
concerned on
the fluorescent signal which increases the reliability of diagnostics.
The use of visible spectrum band without radiation in the wave length band of
over 650 nm in the laboratory premises lighting source (FIG. 1) eliminates the
need
for working in complete darkness for the staff; since the laboratory premises
should
be fully isolated from daylight (same as from other sources of interfering
radiation in
the wave length band which coincides with that in which fluorescent images are
recorded).
CA 02360229 2004-04-02
The white light source for illuminating tissue surface under examination when
recording
colour reference image 1 (FIG. 1 ) can be of any kind (including a pulse
source) with the colour
temperature required for normal colour reproduction of object 7 with colour
reference image
recording unit 10. Source 1 should provide for the possibility of control by
turning on/off and
5 (or) cutting off radiation at the output with the use of a shutter and, if
necessary, colour
adjustment by a control signal from video, synchronisation and control signal
processor 9. The
possibility of colour adjustment for the radiation of source 1 within a broad
spectrum band will
allow to carry out additional monitoring of various tissue defects by colour
index with the use
of the device. Source 1 should provide for even illumination intensity of the
object within the
10 field of view at the level required for normal operation of colour
reference image recording unit
10.
The source of monochrome radiation in the wave length band of 650-730 nm for
illuminating the tissue under examination when recording the fourth monochrome
auxiliary
image 2 (FIG. 1 ) can be implemented, for example, in the form of a
semiconductor laser or laser
15 block with the corresponding radiatiottwave length and a lens beam
generation system. Source
2 should be controlled by a control signal from video, synchronisation and
control signal
processor 9 and should provide for even illumination intensity of the object
within the field of
view at the level required for normal operation of recording unit 13 (or
recording unit 10).
Source of monochrome radiation inducing the fluorescence of endogenous
porphyrins
and their complexes with proteins 3 (FIG. 1 ) can be made, for example, in the
form of a He-Ne
laser (~.=632,8 nm) or a semiconductor laser (or laser block) with the length
wave within the
band of 630 to 645 nm. Source 3 should have a system of filtration of
radiation with the wave
length which exceeds 650 nm. The illumination intensity at the object within
the field of view
of the recording device operating in the wave length band of over 650 nm (that
is, in the spectral
sensitivity band of fluorescent image recording unit 13 determined by
radiation filtration unit
(12) supported by source 3 should be by approximately one order of magnitude
lower
CA 02360229 2001-07-17
16
that the fluorescent emittance level in the selected band of fluorescence of
the
patient's imact tissue with low proliferation degree. Source 3 should be
controlled by
a control signal coming from processor 9 and ensure even illumination
intensity o~ the
object located within the field of view of the device at the level of y--0,1
mVVt/cm2 (in
5 continuous operation mode). It is possible to use a pulse source
synchronised with
recording unit 13 with the use of the synchronisation signals coming from
processor
9.
The main requirement demanded of laboratory premises lighting source 4
(FIG. 1) is that the illumination intensity supported at the object located
within the
to field of view of the recording device in the wave length band of over 650
nm should
be approximately by one order of magnitude lower than the level of fluorescent
emittance in the selected band of fluorescence of the patient's intact tissue
with low
proliferation degree. It is also desirable to make provisions for shading the
area under
examination and the optical elements of the device from radiation coming from
source
i5 4. Source 4 should support the illumination intensity in the laboratory
premises which
is sufficient for comfortable work of the staff. Source 4 should be controlled
by a
control signal coming from processor 9. It is possible to provide the
operation mode
of source 4 where the sowce would be switched off when fluorescent images are
recorded by a signal coming from processor 9, or where its radiation would be
cut off
2o by a controlled light shutter.
Unit for switching the radiation of sources 1, 2, 3 and making a collinear ray
configuration 5 (FIG. 1) can be made, for example, in the form of three
controlled
mirrors each of which can enter the operating position and direct radiation
from the
corresponding source along the optical axis of the device upon a control
signal
25 coming from processor 9. It is also possible to provide for a collinear
configuration of
rays coming from radiation sources 1, 2, 3 with the use of fibre optical
directional
couplers. .In the case of making a device version for easily accessible
surface
proliferation areas (for example, on the skin), a shadow-free non-collinear
illumination
configuration can be used for illuminating the tissue segment under
examination with
3o the radiation coming from sources 1, 2, 3:
CA 02360229 2001-07-17
17
Unit for collinear illumination from sources l, 2, 3 of tissue under
examination
and receiving reflected signals and fluorescent signal 6 (FIG. 1 ) can be made
in the
form of a mirror located ax an angle to the optical axis of the device with a
hole in the
middle for letting through radiation from sources 1, 2, 3 illuminating the
object. The
signal reflected from the object and the fluorescent signal should be directed
by the
mirror to lens 8. Unit 6 can also comprise an optical system for generating a
radiation
spot from sources 1,2, 3. In the case of making a device version for
endocscopic
diagnostics, unit 6 should comprise an endoscopic channel matching optical
system.
Lens 8 (FIG. 1) should have the maximum transmission in the spectral wave
to length band of 650, to 730 nm, the maximum aperture ratio and the back
operating
segment sufficient for accommodating image splitting unit 11 and radiation
filtration
unit 12. The lens resolution should be not lower than that of the receiving
matrices of
recording units 10 and 13.
Video, synchronisation and control signal processor 9 (FIG. 1) should have a
broad dynamic range for digitising the images coming from the recording units,
support the processing of the produced images in accordance with the claimed
method, ensure consistent operation of all device units by generating the
corresponding control and synchronisation signals according to an input
algorithm and
support bi-directional data exchange with computer 14. The software of video,
2o synchronisation and control signal processor 9 and computer 14 should
support the
operation of the claimed device with the use of the claimed method.
Colour reference image recording unit 10 (FIG. 10) can be made in the form
of a colour CCD-camera operating both in the continuous (view mode) and frame
mode. The operation of the unit is controlled and synchronised with the use of
the
signals coming from processor 9
Image splitting unit 11 (FIG. 1) can be a beam sputter in the form of a light
splitting box with the splitting ratio of X1:10, with the smaller portion
being directed
to colour reference image unit 10, or a thin-pellicular (0. S mcm) beam
sputter without
a coating located at the angle of 45° to the optical axis and the
splitting ratio of X8:92
is
(pellicle beam sputter). If recording units 10 and 13 operate at different
Mmes, it is
possible to use a controlled 100% mirror with two operating conditions.
Radiation filtration unit 12 (FIG. 1) can be made in the form of an absorption
cut-off light filter as the simplest version; the transmission limits of this
filter will be
between the radiation wave length of source 3 and the spectral band centre of
the
produced endogenous porphyrin fluorescent response. The discrimination for the
indicated wave lengths should be >_105. For the device version where the third
auxiliary monochrome image is recorded with recording unit 13, this filter
should be
changed with a different filter which transmits radiation coming from source 3
upon a
to control signal coming from processor 9. In order to broaden the functional
capabilities, radiation filtration unit 12 can contain a range of various band
and cut-off
light filters changed automatically upon a control signal coming from
processor 9.
Fluorescent image and auxiliary monochrome image recording unit 13 (FIG.
1) can be made in the form of a monochrome CCD camera with adjustable frame
exposure time. The operation of the unit is controlled and synchronised with
the use
of the signals coming from processor 9. The number of the elements and the
size of
the receiving matrices of recording units 13 and 10 should be matched. If
source 3
operates in the pulse mode, recording unit 13 can additionally comprise a
strobed
electro-optial transducer with a photocathode with sensitivity in the wave
length band
of 650 to 730 nm.
Computer with graphical information display device I4 (FIG. 1), graphical
information output and documenting device 1 S and data storage device 16
should
support high quality display, documenting and storage of the produced
diagnostics
information. The software of video, synchronisation and control signal
processor 9
and computer 14 should support the operation of the claimed device with the
use of
the claimed method.
COMMERCIAL APPLICABILITY.
The device can be used first of all in ontological diagnostics as a method and
tool for
visualising the tumour growth areas that are frequently cannot be identified
visually
CA 02360229 2001-07-17
19
(see FIG. 5 - 7). The diagnostics is carried out with the use of non-invasive
and
contact-free techniques which require no preliminary preparation of the
patient. 104
patients staying at the N.A. Semashko Central Clinical Hospital No. 4 of tile
Russian
Federation Railway Ministry for examination and treatment of malignant tumours
have been examined with the use of the model of the claimed device and the
claimed
method at -the time of the application. The examination allowed in many cases
to
adjust the scope of the treatment, in particular, surgical intervention.
Besides, the proposed method and device can be used in surgery as a means of
monitoring past-operative tissue cicatrisation (see FIG. 4).
to The proposed method and device can also be used in cosmetology and
dermatology as a means of monitoring the condition of sebaceous glands (see
FIG. 3),
nail growth (see FIG. 2), etc.
CA 02360229 2001-07-17