Note: Descriptions are shown in the official language in which they were submitted.
CA 02447920 2003-11-19
WO 02/097706 PCT/US02/16770
METHOD AND APPARATUS FOR COMPUTER MODELING A JOINT
COPYRIGHT NOTICE
A portion of the disclosure of the patent document contains material that is
subject to
copyright protection. The copyright owner has no objection to the facsimile
reproduction
by anyone of the patent document of the patent disclosure, as it appears in
the Patent and
Trademark Office patent file or records, but otherwise reserves all copyright
rights
whatsoever.
CROSS-REFERENCE TO RELATED APPLICATION
The present invention is related to and claims priority to U.S. Provisional
Patent
Application Serial No. 60/293,533, filed on May 29, 2001, entitled "Method and
Apparatus
for Computer Modeling a Joint," which is incorporated herein by reference.
BACKGROUND OF THE INVENTION
The present invention relates generally to a computer model of a joint. More
specifically, the present invention relates to a computer model of a joint to
represent, for
example, rheumatoid arthritis, osteoporosis, osteoaxthritis or other
inflammatory diseases of
the j oint.
Synovial inflammation, rapid degradation of cartilage, and erosion of bone in
affected joints are characteristic of, for example, rheumatoid arthritis (RA).
Recent
evidence indicates that skeletal tissue degradation and inflammation are
regulated through
overlapping but not identical pathways in the rheumatoid joint and that
therapeutic effects
on these two aspects need not be correlated. Furthermore, considerable
uncertainty exists
about the relative contributions of the various biological processes of the
joint to the
pathogenesis of RA. Thus, a need exists for a better understanding of the
mechanisms
regulating joint inflammation and joint degradation. Such an understanding
would be
helpful for strategically designing therapies for protecting the joint.
Due to the complexity of the biological processes in the joint, mathematical
and
computer models can be used to help better understand the interactions between
the various
tissue compartments, cell types, mediators, and other factors involved in
joint disease and
healthy homeostasis. Several researchers have constructed simple models of the
mechanical
environment of the joint and compared the results to patterns of disease and
development in
cartilage and bone (Wynarsky & Greenwald, J. Biomecla., 16:241-251, 1983;
Pollatschek &
CA 02447920 2003-11-19
WO 02/097706 PCT/US02/16770
Nahir, J. Theo.. Biol., 143:497-505, 1990; Beaupre et al., J. Relaabil. Res.
Dev., 37:145-151,
2000; Shi et al., Acta Med. Okayama, 17:646-653, 1999). However, these models
are
focused on the mechanical aspects of the joint and do not explicitly include
the biological
processes related to cells in the synovial membrane and other joint
compartments. For
instance, in RA the cells of the synovial membrane are known to play a major
role in
driving the disease (Szekanecz & Koch, Curr. Rheumatol. Rep., 3:53-63, 2001).
Hence, a
need exists to develop a computer or mathematical model, which includes
multiple
compartments including the synovial membrane and the interactions of these
compartments,
to develop a better understanding of joint diseases.
SUMMARY OF THE INVENTION
Embodiments of the present invention relate to computer modeling of a joint.
For
example, one embodiment of the present invention relates to a computer model
of a human
joint afflicted with rheumatoid arthritis. The present invention also includes
a method for
developing an analytical model of an animal joint.
In one embodiment, the invention is a method for developing a computer model
of
an animal joint. The method comprises the steps of identifying data relating
to a biological
state of the joint; identifying biological processes related to the data,
these identified
biological processes defining at least one portion of the biological state of
the joint; and
combining the biological processes to form a simulation of the biological
state of the joint.
The biological state of the joint can be, for example, the state of a normal
joint or a diseased
joint. The joint diseases that can be modeled include rheumatoid arthritis,
osteoporosis,
reactive arthritis or osteoarthritis.
Another embodiment of the invention is a computer model of the biological
state of
an animal joint, comprising code to define the biological processes related to
the biological
state of the joint, and code to define the mathematical relationships related
to interactions
among biological variables associated with the biological processes. At least
two of the
biological processes are associated with the mathematical relationships. A
combination of
the code to define the biological processes and the code to define the
mathematical
relationships define a simulation of the biological state of the joint.
Yet another embodiment of the invention is a computer executable software code
comprising of code to define biological processes related to a biological
state of an animal
joint including code to define mathematical relations associated with a first
biological
process from the biological processes and associated with interactions among
biological
2
CA 02447920 2003-11-19
WO 02/097706 PCT/US02/16770
variables associated with the first biological process, and code to define
mathematical
relations associated with a second biological ,process from the biological
processes and
associated with interactions among biological variables associated with the
second
biological process, the biological processes being associated with the
biological state of the
animal joint.
Another embodiment of the invention is a computer model of an animal joint,
comprising a computer-readable memory storing codes and a processor coupled to
the
computer-readable memory, the processor configured to execute the codes. The
memory
comprises code to define biological processes related to the biological state
of the joint, and
code to define mathematical relationships related to interactions among
biological variables
associated with the biological processes. At least two biological processes
from the
biological processes are associated with the mathematical relationships. The
combination
of the code to define the biological processes and the code to define the
mathematical
relationships define a simulation of the biological state of the joint.
BRIEF DESCRIPTION OF THE DRAWINGS
FIG. 1 illustrates an example of an Effect Diagram, which shows some of the
modeled biological processes of the biological state of a joint affected with
R.A.
FIG. 2 illustrates an example of a Summary Diagram from the Effect Diagram of
FIG. 1.
FIG. 3 illustrates an example of a module diagram for one of the anatomical
elements shown in the Summary Diagram of FIG. 2.
FIG. 4 illustrates an alternative for a portion of the module diagram shown in
the
FIG. 3.
FIG. 5 illustrates an example of display screen having chart windows and a
browser
window, according to an embodiment of the present invention.
FIG. 6 shows an alternative summary diagram having a condensed functional view
and a compartmental view of RA, according to another embodiment of the present
invention.
FIG. 7 is a schematic representation of a computer system within which
software for
performing the methods of the invention may reside or be executed.
FIG. 8 shows an example of a module diagram for the T cell life cycle in the
synovium.
3
CA 02447920 2003-11-19
WO 02/097706 PCT/US02/16770
FIG. 9 depicts a flowchart for a method for developing a computer model of an
animal joint according to one embodiment of the invention.
FIG. 10 depicts a flowchart for a method for developing a computer model of a
joint
according to another embodiment of the invention.
DETAILED DESCRIPTION
Overview
Embodiments of the present invention relate to computer modeling of an animal
joint. The term "animal" as used herein includes humans. The term "joint" as
used herein
comprises the synovial tissue, synovial fluid, articular cartilage, bone
tissues, and their
cellular and extracellular composition, and the soluble mediators they
contain. The
computer model can represent the biological processes related to a joint.
Typically, the
model includes biological processes related to cartilage metabolism and cell
and mediator
turnover in a non-diseased joint. Also, the computer model can include the
representation
of a diseased joint. For example, the computer model can represent a joint
with rheumatoid
arthritis, osteoporosis, osteoarthritis, or other inflammatory diseases of the
joint. In
addition, the model can represent joints affected with other arthritic
conditions such as
monoarticular, oligoarticular, or polyarticular arfihritides of unknown
etiology.
Embodiments of the present invention can relate to the computer modeling of
rheumatoid arthritis (RA), such as for example, a knee joint afflicted with
RA. The
computer can also represent other joints, for example metacarpophalangeal and
hip joints.
The computer model can focus on the direct cytokine-mediated cellular
interactions within
the synovium and cartilage. Comparisons with clinical data can be used, for
example, in
fine-tuning the core components of the computer model.
In one embodiment, the computer model relates to, for example, diagnosed,
established, early R.A (synovial inflammation and hyperplasia, pannus
formation, early
stages of cartilage breakdown) in an adult patient with active progressive
disease. This
patient can be characterized by, for example, persistent synovial hyperplasia
and
inflammation as well as continuous degradation of the cartilage matrix. This
disease state
can be compared to healthy homeostasis where feasible and useful.
Alternatively, other
disease states and virtual patients can be represented in the model.
In one embodiment, the computer model can represent a single prototypical RA
joint. The exact location of this prototypical joint need not be specified. An
abstraction can
be obtained that is compatible with available data and best reflects the
overall disease
4
CA 02447920 2003-11-19
WO 02/097706 PCT/US02/16770
process. The main compartments contained in the computer model can represent
synovial
tissue and cartilage at the cartilage-pannus junction of this prototypical RA
joint.
In yet another embodiment, the computer model can be developed based on new
patient types and can be based on both additions of new components and
increased detail in
components already modeled. For example, the computer model can incorporate
biological
features such as regulated recruitment of T cells, different T cell
populations present in the
tissue, or additional complexity in the mediator network. In another
alternative
embodiment, the computer model can involve the addition of new components,
such as
angiogenesis, bone metabolism, B cells or neutrophils.
In one aspect of the invention, the computer executable software code
numerically
solves the mathematical equations of the model under various simulated
experimental
conditions. Furthermore, the computer executable software code can facilitate
visualization
and manipulation of the model equations and their associated parameters to
simulate
different patients subject to a variety of stimuli. See, e.g., U.S. Patent
6,07,739, entitled
"Managing objects and parameter values associated with the objects within a
simulation
model," the disclosure of which is incorporated herein by reference. Thus, the
computer
model can be used to rapidly test hypotheses and investigate potential drug
targets or
therapeutic strategies.
Mathematical Model
The mathematical model of the computer-executable software code represents the
dynamic biological processes related to the biological state of a joint. The
form of the
mathematical equations employed may include, for example partial differential
equations,
stochastic differential equations, differential algebraic equations,
difference equations,
cellular automata, coupled maps, equations of networks of Boolean or fuzzy
logical
networks, etc. In one embodiment, the mathematical equations used in the model
are
ordinary differential equations of the form:
dx/dt = f(x, p, t),
where x is an N dimensional vector whose elements represent the biological
variables of the
system (for example synovial macrophage number, tumor necrosis factor alpha
concentration, and cartilage collagen II concentration), t is time, dxldt is
the rate of change
of x, p is an M dimensional set of system parameters (for example baseline
macrophage
matrix metalloproteinase-1 (MMP-1) synthesis rate, T cell cycle time,
catalytic constant for
5
CA 02447920 2003-11-19
WO 02/097706 PCT/US02/16770
degradation of collagen II by MMP-1, and initial cartilage thickness), and f
is a function that
represents the complex interactions among biological variables.
The term "biological variables" refers to the extra-cellular or infra-cellular
constituents that make up a biological process. For example, the biological
variables can
include metabolites, DNA, RNA, proteins, enzymes, hormones, cells, organs,
tissues,
portions of cells, tissues, or organs, subcellular organelles, chemically
reactive molecules
like H+, superoxides, ATP, citric acid, protein albumin, as well as
combinations or
aggregate representations of these types of biological variables. In addition,
biological
variables can include therapeutic agents such as methotrexate, steroids, non-
steroidal anti-
inflammatory drugs, soluble TNF-alpha receptor, TNF-alpha antibody, and
interleukin-1
receptor antagonists.
The term "biological process" is used herein to mean an interaction or series
of
interactions between biological variables. Thus, the above function f
mathematically
represents the biological processes in the model. Biological processes can
include, for
example, macrophage activation, regulation of macrophage protein synthesis, T
cell
proliferation, and collagen II degradation. The term "biological process" can
also include a
process comprising of one or more therapeutic agents, for example the process
of binding a
therapeutic agent to a cellular mediator. Each biological variable of the
biological process
can be influenced, for example, by at least one other biological variable in
the biological
process by some biological mechanism, which need not be specified or even
understood.
The term "parameter" is used herein to mean a value that characterizes the
interaction between two or more biological variables. Examples of parameters
include
affinity constants, baseline synthesis of a mediator, ECSO value of
stimulation of a first
mediator by a second mediator, baseline macrophage matrix metalloproteinase-1
(MMP-I)
synthesis rate, T cell cycle time, catalytic constant for degradation of
collagen II by MMP-1,
and initial cartilage thickness.
The term "biological state" is used herein to mean the result of the
occurrence of a
series of biological processes. As the biological processes change relative to
each other, the
biological state also undergoes changes. One measurement of a biological
state, is the level
of activity of biologic variables, parameters, and/or processes at a specified
time and under
specified experimental or enviromnental conditions.
In one embodiment the biological state can be mathematically defined by the
values
of x and p at a given time. Once a biological state of the model is
mathematically specified,
6
CA 02447920 2003-11-19
WO 02/097706 PCT/US02/16770
numerical integration of the above equation using a computer determines, for
example, the
time evolution of the biological variables x(t) and hence the evolution of the
biological state
over time.
The term "simulation" is used herein to mean the numerical or analytical
integration
of a mathematical model. For example, simulation can mean the numerical
integration of
the mathematical model of the biological state defined by the above equation,
i.e., dx/dt =
f(x, p, t).
A biological state can include, for example, the state of an individual cell,
an organ,
a tissue, and/or a mufti-cellular organism. A biological state can also
include the state of a
mediator concentration in the plasma, interstitial fluid, intracellular fluid;
e.g., the states of
synovial inflammation and synovial hyperplasia are characterized by high
concentrations of
inflammatory mediators and large numbers of cells, respectively, in the
synovium. These
conditions can be imposed experimentally, or may be conditions present in a
patient type.
For example, a biological state of the cartilage can include the chondrocyte
concentration
for a patient with a certain age and disease duration. In another example, the
biological
states of the collection of synovial tissue mediators can include the state in
which a patient
with a certain disease undergoes a specific treatment.
The term "disease state" is used herein to mean a biological state where one
or more
biological processes axe related to the cause or the clinical signs of the
disease. For
example, a disease state can be the state of a diseased cell, a diseased
organ, a diseased
tissue, or a diseased mufti-cellulax organism. Such diseases can include, for
example,
diabetes, asthma, obesity, and rheumatoid arthritis. A diseased mufti-cellular
organism can
be, for example, an individual human patient, a specific group of human
patients, or the
general human population as a whole. A diseased state could also include, for
example, a
diseased protein or a diseased process, such as defects in matrix synthesis,
matrix
degradation, cell apoptosis, and cell signaling, which may occur in several
different organs.
The term "biological attribute" is used herein to mean biological
characteristics of a
biological state, including a disease state. For example, biological
attributes of a particular
disease state include clinical signs and diagnostic criteria associated with
the disease. The
biological attributes of a biological state, including a disease state, can be
measurements of
biological variables, parameters, and/or processes. For example, for the
disease state of
rheumatoid arthritis, the biological attributes can include measurements of
synovial
hyperplasia, markers of inflammation, or cartilage thickness.
7
CA 02447920 2003-11-19
WO 02/097706 PCT/US02/16770
The term "reference pattern" is used herein to mean a set of biological
attributes that
are measured in a normal or diseased biological system. For example, the
measurements
may be performed on blood samples, on biopsy samples, or cell cultures derived
from a
normal or diseased human or animal. Examples of diseased biological systems
include
cellular or animal models of rheumatoid arthritis, including a human
rheumatoid arthritis
patient.
Computer System
FIG. 7 shows a system block diagram of a computer system within which the
methods described above can operate via software code, according to an
embodiment of the
present invention. The computer system 700 includes a processor 702, a main
memory 703
and a static~memory 704, which are coupled by bus 706. The computer system 700
can
further include a video display unit 708 (e.g., a liquid crystal display
(I;CD) or cathode ray
tube (CRT)) on which a user interface can be displayed). The computer system
700 can
also include an alpha-numeric input device 710 (e.g., a keyboard), a cursor
control device
712 (e.g., a mouse), a disk drive unit 714, a signal generation device 716
(e.g., a speaker)
and a network interface device medium 718. The disk drive unit 714 includes a
computer-
readable medium 715 on which software 720 can be stored. The software can also
reside,
completely or partially, within the main memory 703 and/or within the
processor 702. The
software 720 can also be transmitted or received via the network interface
device 718.
The term "computer-readable medium" is used herein to include any medium which
is capable of storing or encoding a sequence of instructions for performing
the methods
described herein and can include, but not limited to, optical andlor magnetic
storage devices
and/or disks, and carrier wave signals.
The Computer Model
The computer model can begin with a representation of a normal biological
state, for
example, as represented by the biological state of a single prototypical knee
joint. A normal
biological state is modeled through a series of user-interface screens that
define the
elements, including biological variables and biological processes, of the
biological state
being modeled. These elements of the biological state have dynamic
relationships among
themselves. An Effect Diagram can illustrate the dynamic relationships among
the elements
of the biological state and can include a Summary Diagram.' This Summary
Diagram can
provide links to individual modules of the model; these modules, or functional
areas, when
8
CA 02447920 2003-11-19
WO 02/097706 PCT/US02/16770
grouped together, represent the large complex physiology of the biological
state being
modeled.
The modules model the relevant components of the biological state through the
use of
state and function nodes whose relations are defined through the use of
diagrammatic arrow
symbols. Thus, the complex and dynamic mathematical relationships for the
various
elements of the biological state are easily represented in a user-friendly
manner. In this
manner, a normal biological state can be represented.
Effect Diagram and Summary Diagram
FIG. 1 illustrates an example of an Effect Diagram, which shows some of the
modeled biological processes of the biological state of a joint affected with
RA. The Effect
Diagram is organized into modules, or functional areas, which when grouped
together
represent the large complex physiology of the biological state being modeled.
The Effect Diagram can include a Summary Diagram, as shown in the upper most
left portion of FIG. 1. In addition, the Effect Diagram can include the
modules for the
various biological processes of the biological state being modeled. From the
Effect
Diagram, a user can select any of these related user-interface screens by
selecting such a
screen from the Effect Diagram (e.g., by clicking a hyperlink to a related
user-interface
screen).
FIG. 2 illustrates an example of a Summary Diagram from the Effect Diagram of
FIG. 1. As shown in FIG. 2, the Summary Diagram can pxovide an overview of the
contents of the Effect Diagram and can contain nodes that link to modules in
the Effect
Diagram. These modules can be based on, for example, the anatomical elements
of the
biological state being modeled, such as chondrocytes, cytokines and other
soluble factors
and cartilage metabolism.
FIG. 3 illustrates an example of a module diagram for one of the anatomical
elements shown in the Summary Diagram of FIG. 2. More specifically, FIG. 3
illustrates a
module diagram for the cartilage metabolism. FIG. 4 illustrates an alternative
for a portion
of the module diagram shown in the FIG. 3. Pages A-1 through A-35 of Appendix
A list
additional examples of user-interface screens for other modules for anatomical
elements
shown in the Summary Diagram of FIG. 2. Appendix A depicts some of the modules
of
FIG. 1.
As FIG. 3 illustrates, the relevant biological variables and biological
processes for
the cartilage metabolism are represented through the use of state and function
nodes whose
9
CA 02447920 2003-11-19
WO 02/097706 PCT/US02/16770
relations are defined through the use of diagrammatic arrow symbols. Through
the use of
these state nodes, function nodes and arrows, the complex and dynamic
mathematical
relationships for the various elements of the physiologic system are easily
represented in a
user-friendly manner. In this manner, a biological state can be represented.
The nodes and
S arrows are discussed below in the context of the mathematical relationship
that underlie
these diagrammatic representations.
Mathematical Equations Encoded in the Effect Diagram
As mentioned above, the Effect Diagram is a visual representation of the model
equations. This section describes how the diagram encodes a set of ordinary
differential
equations. Note that although the discussion below regarding state and
function nodes
refers to biological variables for consistency, the discussion also relates to
variables of any
appropriate type and need not be limited to just biological variables.
State and Function Nodes
State and function nodes show the names of the variables they represent and
their
1 S location in the model. Their arrows and modifiers show their relation to
other nodes within
the model. State and function nodes also contain the parameters and equations
that are used
to compute the values or their variables in simulated experiments. In one
embodiment of
the computer model, the state and function nodes are represented according to
the method
described in IJ.S. Patent 6,0S1,029 and co-pending application 09/588,8SS,
both of which
are entitled "Method of generating a display for a dynamic simulation model
utilizing node
and link representations," and both of which are incorporated herein by
reference. Further
examples of state and function nodes are further discussed below.
State nodes, the single-border ovals in the Effect Diagram, represent
State Node
variables in the system the values of which are determined by the cumulative
2S effects of its inputs over time.
State node values are defined by differential equations. The predefined
parameters
for a state node include its initial value (So) and its status. State nodes
that have a half life
have the additional parameter of a half life (h) and are labeled with a half
life .~.~symbol.
Function nodes, the double-border ovals in the Effect Diagram,
Functian represent variables in the system the values of which, at any point
in time, are
Node
CA 02447920 2003-11-19
WO 02/097706 PCT/US02/16770
determined by inputs at that same point in time.
Function nodes are defined by algebraic functions of their inputs. The
predefined
parameters for a function node include its initial value (F~) and its status.
Setting the status of a node effects how the value of the node is determined.
The status
of a state or function node can be
~ Computed - the value is calculated as a result of its inputs
~ Specified-Locked - the value is held constant over time
~ Specified Data - the value varies with time according to predefined data
points.
State and function nodes can appear more than once in the Effect Diagram as
alias
nodes. Alias nodes are indicated by one or more dots, as in the state node
illustration above.
All nodes are also defined by their position, with respect to arrows and other
nodes, as being
either source nodes (S) or target nodes (T). Source nodes are located at the
tails of arrows,
and target nodes are located at the heads of arrows. Nodes can be active or
inactive. Active
nodes are white. Inactive nodes match the background color of the Effect
Diagram.
25
State Node Equations
The computational status of a state node can be Computed, Specified-Locked, or
Specified
Data.
State Node Computed ~~, sEa~aaa ~, f ar~a~uts~~ras v~rhen ~a = 0
dt = ~~, ~ ~' (t ) + s~a~aa ~, f arro~t~r~~aas when h > 0
~a
Where S is the node value, t is time, S(t) is the node value at time, t, and h
is the half life.
The three dots at the end of the equation indicate there are additional terms
in the equation
resulting from any effect arrows leading into it and by any conversion arrows
that lead out
of it. If h is equal to 0, then the half life calculation is not performed and
dSldt is determined
solely by the arrows attached to the node.
State Node Specified- Locked ,~(g) _ ,~d ' f~~. ~~~ t
State Node Specified Data S(t) is defined by specified data entered for the
state node.
State node values can be limited to a minimum value of zero and a maximum
value
of one. If limited at zero, S can never be less than zero and the value for S
is reset to zero if
11
CA 02447920 2003-11-19
WO 02/097706 PCT/US02/16770
it goes negative. Tf limited at one, S cannot be greater than one and is reset
to one if it
exceeds one.
Function Node Equations
Function node equations axe computed by evaluating the specified function of
the
values of the nodes with arrows pointing into the function node (arguments),
plus any obj ect
and Effect Diagram parameters used in the function expression. To view the
specified
function, click the Evaluation tab in the function node Object window.
The Effect Dia~Tam - Arrows
Arrows link source nodes to target nodes and represent the mathematical
relationship
between the nodes. Arrows can be labeled with circles that indicate the
activity of the arrow.
A key to the annotations in the circles is located in the upper left corner of
each module in
the Effect Diagram. If an arrowhead is solid, the effect is positive. If the
arrowhead is
hollow, the effect is negative.
Arrow Types
lEffect arrows, the thin arrows on the Effect Diagram, link source state or
function
nodes to target state nodes. Effect arrows cause changes to target nodes but
have no
effect on source nodes. They are labeled with circles that indicate the
activity of the arrow.
Conversion arrows, the thick arrows on the Effect Diagram, represent the way
the
contents of state nodes are converted into the contents of the attached state
nodes. They are
labeled with circles that indicate the activity of the arrow. The activity may
effect the source
node or the target node or both nodes. The conversion can go either way.
Argument arrows specify which nodes are input arguments for function nodes.
They
ado not contain parameters or equations and are not labeled with activity
circles.
Arrow Characteristics
Effect or conversion arrows can be constant, proportional, or interactive.
- (Arrows that are constant have a break in the arrow shaft. They are used
when the rate
of change of the target is independent of the values of the source and target
nodes.
12
CA 02447920 2003-11-19
WO 02/097706 PCT/US02/16770
Arrows that are proportional have solid, unbroken shafts and are used when the
rate
~of change is dependent on, or is a function of, the values of the source
node.
Arrows that are interactive have a loop from the activity circle to the target
node.
They indicate that the rate of change of the target is dependent on, or a
function of,
the value of both the source node and the target node.
Arrow Properties can be displayed in an Object window (not shown). The window
may
also include tabs for displaying Notes and Arguments associated with the
arrow. If Notes
are available in the Object window, the arrow is labeled with a red dot (~).
Arrow Eguations: Effect Arrows
Proportional Effect Arrow: The rate of change of target tracks source node
value.
_C~T _ C,~~(~)a +...
Where T is the target node, C is a coefficient, S is the source node, and a is
an exponent.
Constant Effect Arrow: The rate of change of the target is constant.
dT
-= K+...
Where T is the target node and K is a constant.
Interaction Effect Arrow: The rate of change of the target depends on both the
source node
and target node values.
r~~
Where T is the target node, S is the source node, and a and b are exponents.
This equation can vary depending on the operation selected in the Object
window. The operations available are S+T, S-T, S*T, TlS, and SlT.
AiTOw Equations: Conversion Arrows
Proportional Conversion Arrow: The rate of change of the target tracks the
value of source
node.
dT = C,; R ~ ~,,(~)~ +
dt
dt
Where T is the target node, S is the source node, C is a coefficient, R is a
conversion ratio, and a is an exponent.
13
CA 02447920 2003-11-19
WO 02/097706 PCT/US02/16770
Constant Conversion Arrow: The rates of change of target and source are
constant such
that an increase in target corresponds to a decrease in source.
r~T =K~R+
c~~
e~~ _
- -' +...
Where T is the target node, S is the source node, K is a constant, and R is a
conversion ratio.
Tnteraction Conversion Arrow: The rates of change of the target and source
depend on both
source and target node values such that an increase in target corresponds to a
decrease in
source.
c~'.'~ = R; C.~~(t,~ -T~t'~a ~+
c~'t 4,' .
c~~S' _ _~,~~,~'t~. _ T'(t~~ ~+
t
Where T is the target node, S is the source node, a and b are exponents, and
R is a conversion ratio. This equation can vary depending on the operation
selected in the Object window. The operations available are S+ T, S T, S*T,
T/S , and SlT.
The Effect Diagram - Modifiers
Modifiers indicate the effects nodes have on the arrows to which they are
connected.
The type of modification is qualitatively indicated by a symbol in the box.
For example, a
node can allow ~, block .~, regulate ~, inhibit ~, or stimulate ~an arrow
rate.
A key to the modifier annotations is located in the upper left corner of each
module.
Modifier Properties can be displayed in the Object Window. The window may also
include
tabs for displaying the notes, arguments, and specified data associated with
the modifier. If
notes are available in the Object window, the modifier is labeled with a red
dot (~).
rat M ~ f ' ar~ro~~rr~a +
Effect Arrow, Modifier Equation : ...
Where T is the target node, M is a multiplier constant, N is a normalization
constant, f() is a
function (either linear or specified by a transform curve), and arrowteYm is
an equation
fragment from the attached arrow.
14
CA 02447920 2003-11-19
WO 02/097706 PCT/US02/16770
Modifier Effect
By default, conversion arrow modifiers affect both the source and target arrow
terms.
However, in some cases, a unilateral, modifier is used. Such modifier will
affect either a
source arrow term or on target arrow term; it does not affect both arrow
terms.
Conversion arrow, Source Only Modifier Equation:
d~ ~4I ~ ,,~' ~r ' cxrra~w~er~aa + a~~asr at~as~aer~ ~rrou~ dermas
Conversion arrow, Target Only Modifier Equation:
' arro~.vtsr~aa + o~~asr c~~~ac~a~c~ arrc~~v te~r~ras
The equation for a source and target modifier uses both the Source Only
equation and the
Target Only equation.
When multiplicative and additive modifiers are combined, effect is given
precedence: For
example, if the following modifiers are on an arrow,
al,a2: Additive, Source and Target
ml,m2: Multiplicative, Source and Target
A1,A2: Additive, Target Only
M1,M2: Multiplicative, Target Only
then the rates are modified by
Target node: (a1+a2+Al+A2) * (ml*m2) * (M1*M2)
Source node: (a1+a2) * (ml *m2)
Embodiments of the Invention
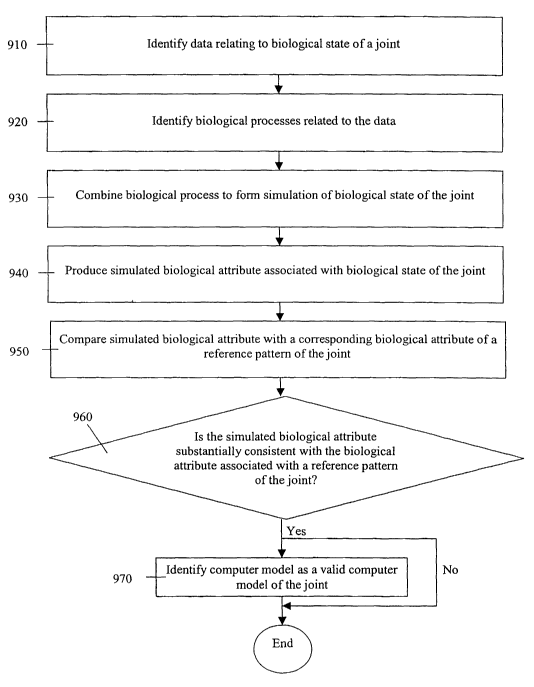
FIG. 9 depicts a flowchart for a method for developing a computer model of an
animal joint according to one embodiment of the invention. At step 910, data
relating to a
biological state of the joint is identified. At step 920, biological processes
related to the
data are identified. These biological processes define at least one portion of
the biological
state of the joint. At step 930, the biological processes are combined to form
a simulation of
the biological state of the joint.
The method for developing a computer model of an animal joint can further
comprise the optional steps of 940, 950, 960, and 970 for validating the
computer model, as
depicted in FIG. 9. In the validation process, at step 940 a simulated
biological attribute
associated with the biological state of the joint is produced. At step 950,
the simulated
biological attribute is compared with a corresponding biological attribute in
a reference
pattern of the joint. At steps 960 and 970, the validity of the computer model
is identified.
CA 02447920 2003-11-19
WO 02/097706 PCT/US02/16770
At step 960, it is determined whether the simulated biological attribute is
substantially
consistent with the biological attribute associated with the reference pattern
of the j oint. At
step 970, if the simulated biological attribute is substantially consistent
with the biological
attribute associated with the reference pattern of the joint the computer
model is identified
as a valid computer model of an animal joint.
FIG. 10 depicts a flowchart for a method for developing a computer model of a
joint
according to another embodiment of the invention. At step 1010, data relating
to a
biological state of the joint is identified. At step 1020, biological
processes related to the
data are identified. These biological processes define at least one portion of
the biological
state of the joint. At step 1030, a first mathematical relation among
biological variables
associated with a first biological process from the biological processes is
formed. At step
1040, a second mathematical relation among biological variables associated
with the first
biological process and a second biological process associated with the
biological processes
is formed. The biological state of the joint can be, for example, the state of
a normal joint
or a diseased joint.
Steps 1050, 1060, and 1070 can be optionally performed to produce a simulated
biological attribute that is substantially consistent with at least one
biological attribute
associated with a reference pattern of the joint. At conditional step 1050, a
determination is
made as to whether a simulated biological attribute or a series of simulated
biological
attributes is to be produced. If a simulated biological attribute is to be
produced, the process
continues to step 1060. At step 1060, a set of parametric changes in the first
mathematical
relation and the second mathematical relation is created. At step 1070, a
simulated
biological attribute based on at least one parametric change from the set of
parametric
changes is produced.
Steps 1080, 1090, 1100, 1110, and 1120 can be optionally performed to obtain a
representation of the chronological progression of a diseased joint, for
example from a
healthy state to a disease state. At step 1080, a determination is made as to
whether a
biological variable or a parameter is converted. If a biological variable is
to be converted
the process proceeds to steps 1110, and 1120. At step 1110, a first biological
variable is
converted into a converted biological variable the value of which changes over
time. This
first biological variable is associated with at least one from the first
mathematical relation
and the second mathematical relation formed in steps 1030 and 1040. At step
1120, a series
of simulated biological attributes are produced based on the converted
biological variable.
16
CA 02447920 2003-11-19
WO 02/097706 PCT/US02/16770
The series of simulated biological attributes are substantially consistent
with a
corresponding biological attribute associated with a reference pattern of the
joint. The
series of simulated biological attributes represent the chronological
progression of
corresponding biological attributes in the reference pattern of the joint. If
a parameter is to
be converted to obtain a series of simulated biological attributes, the
process proceeds to
steps 1090, and 1100. At step 1090, a parameter is converted into a converted
biological
variable the value of which changes over time. This parameter is associated
with at least
one from the first mathematical relation and the second mathematical relation
formed in
steps 1030 and 1040. At step 1100, a series of simulated biological attributes
are produced
based on the converted biological variable.
Another embodiment of the invention is a computer model of the biological
state of
an animal joint. The computer model comprises code to define biological
processes related
to the biological state of the joint; and code to def ne mathematical
relationships related to
interactions among biological variables associated with the biological
processes. At least
two biological processes from the biological processes are associated with the
mathematical
relationships. The combination of the code to define the biological processes
and the code
to define the mathematical relationships define a simulation of the biological
state of the
joint. The computer model can further comprise code to define two
compartments, wherein
one compartment includes biological processes related to synovial tissue and
the second
compartment includes biological processes related to cartilage tissue.
Further, the computer
model can include a code to define the interaction between these two
compartments.
Yet another embodiment of the invention is a computer executable software code
that comprises of code to define biological processes related to a biological
state of an
animal joint including code to define mathematical relations associated with
the biological
processes. The biological processes defined by the code are associated with
the biological
state of the animal joint.
The computer executable software code can further comprise code to define two
compartments, wherein one compartment includes biological processes related to
synovial
tissue and the second compartment includes biological processes related to
cartilage tissue.
Further, the computer executable software code can include a code to define
the interaction
between these two compartments.
Another embodiment of the invention is a method for developing a computer
model
of a diseased animal joint, comprising receiving user-selected indications to
define
17
CA 02447920 2003-11-19
WO 02/097706 PCT/US02/16770
biological processes, each biological process being based on data that relates
changes in
biological states to biological attributes of a diseased joint; producing a
simulated biological
attribute associated with at least one biological attribute of the diseased
joint based on the
combined biology processes; and assessing the validity of the computer model
based on a
comparison between the simulated biological attribute and a corresponding
biological
attribute associated with a reference pattern of the diseased joint.
Another embodiment of the invention is a computer model of an animal joint,
comprising a computer-readable memory storing codes and a processor coupled to
the
computer-readable memory, the processor configured to execute the codes. The
memory
comprises code to define biological processes related to the biological state
of the joint and
code to defne mathematical relationships related to interactions among
biological variables
associated with the biological processes. At least two biological processes
defined by the
code are associated with the mathematical relationships. The combination of
the codes
stored in the memory that define the biological processes and the code that
defines the
mathematical relationships define a simulation of the biological state of the
joint.
The present invention also includes a method for developing an analytical
model of
an animal joint. This method includes the steps of identifying data relating
to a biological
state of the joint; identifying biological processes related to the data, the
biological
processes defining at least one portion of the biological state of the joint;
and combining the
biological processes to form an analytical representation of the biological
state of the joint.
Tn one embodiment, in this analytical model, the analytical representation of
the biological
state of the joint can be implemerited without the assistance of a computer
system.
Example of a Model Component: T Cell Life Cycle
The following discussion provides an example of a process by which the modules
of the above-described computer model can be developed. As discussed above,
the various
elements of the biological state are represented by the components shown in
the Effect
Diagram. These components are denoted by state and function nodes, which
represent
mathematical relationships that define the elements of the biological state.
In general, these
mathematical relationships are developed with the aid of appropriate publicly
available
information on the relevant biological variables and biological processes. The
development
of the mathematical relationships underlying the module diagram for the T cell
life cycle in
the synovium will be discussed here as an example.
18
CA 02447920 2003-11-19
WO 02/097706 PCT/US02/16770
FIG. 8 shows an example of a module diagram for the T cell life cycle in the
synovium. Note that for illustration purposes, this module diagram is a
rearranged version
of the module diagram depicted on page A-31 in Appendix A.
As FIG. 8 illustrates the physiological components modeled for the life cycle
of the
synovial.T cells include: node 800, vascular volume in synovial tissue
reference volume;
node 802, circulating CD4+ cell density; node 804, T cell recruitment rate;
node 806, Th1
proliferation; node 808, T cell proliferation rate constant; node 810, viable
synovial CD4+ T
cells; node 812, Thl apoptosis; node 814, T cell apoptosis rate; and node 816,
apoptotic
CD4+ T cells.
In a joint affected by RA, CD4+ T cells accumulate in the synovium where they
interact with other cell types via soluble mediators and direct cell-cell
contact. These
interactions are shaped by the specific phenotype and number of the involved
CD4+ T cells.
FIG. 8 and the following description address only the calculation of the
number of Thl
(Type 1 helper T cells) CD4+ T cells in a synovial tissue reference volume.
The main
processes of T cell turnover modeled are T cell recruitment, proliferation,
apoptosis and
drainage (by the lymphatic system or synovial fluid). In the model, the
numerical balance
of these processes determines the number of viable synovial CD4+ T cells,
which modulate
the net T cell activity in other parts of the model. Some of these processes
and the role of T
cells are reviewed in Budd & Former, Kelley's Textbook ofRheumatology, Ruddy
et a1
eds., pp. 113-129, 2001.
FIG. 8 provides the graphical representation for the differential equations
used to
track the population of viable and apoptotic synovial CD4+ T cells. As these
differential
equations depend on calculations of the recruitment, proliferation, and
apoptosis rates, the
latter are described first, followed by the description of the differential
equations governing
the population dynamics.
The T cell recruitment rate, which specifies the net influx rate of CD4+ T
cells into
the synovial tissue reference volume, is determined from the density of
circulating CD4+ T
cells and the vascular volume in the synovial tissue reference volume as
follows:
T cell r~ecruitmerat rate = f~efer~eface rate * vascular volume * circulating
CD4+
density.
The mathematical relationships associated with the node 804 correspond to the
equation for
T cell recruitment rate above. The vascular volume is assumed to be
proportional to the
vascular surface area and therefore replaces the latter in the function
evaluation. The
19
CA 02447920 2003-11-19
WO 02/097706 PCT/US02/16770
parameter "reference rate" represents the fraction of circulating CD4+ T cells
recruited per
hour. The "reference rate" parameter subsumes effects including the modulation
of
recruitment by expression of endothelial adhesion molecules, T cell surface
molecules, and
chemotactic factors. The density of circulating CD4~ T cells can be estimated
to be
approximately 1.25x10⁶ cells/ml (Gallin, Harrison's Pf°iraciples
oflnternal Medicine,
Isselbacher et al. eds., Chapter 59, p.529, 1994; Taneway et al.,
ImnZUnoBiology, Appendix I,
p. 636, 2001). The vascular volume is determined elsewhere in the model from
the vascular
density (5% in one embodiment, see Gaffney et al., Aran. Rheum. Dis., 57:152-
157, 1998)
and the synovial tissue reference volume. In another embodiment, the value of
the
parameter reference rate could be computed dependent on the modeled expression
of
endothelial adhesion molecules, the modeled effects of chemotactic factors,
and other
processes. This has been done for the recruitment of macrophages in one
embodiment of
the invention.
The proliferation of T cells is determined from the fraction of cells entering
mitosis at
a specific moment, as determined elsewhere in the model and represented by the
node 806,
Thl proliferation. The T cell proliferation rate constant is then determined
by the function:
T cell proliferation rate constant = Thl proliferation * ln(2)lcycle time
where the parameter "cycle time" is the time population doubling time (in hrs)
assuming
that all cells are proliferating, and the node 806, Thl proliferation accounts
for the
proliferation of only a fraction of the cells. The mathematical relationships
associated with
the node 808 correspond to the equation for proliferation rate constant above.
The apoptosis of T cells is deternzined from the fraction of cells entering
the
apoptotic cascade at a given time, as determined elsewhere in the model and
represented by
the node 812, Thl apoptosis. The T cell apoptosis rate constant is then
determined by the
:function:
T cell apoptosis rate = Thl apoptosis * max rate for initiation of apoptosis
where the parameter "max rate for initiation of apoptosis" is the maximum rate
(1/hr) for
entry into apoptosis if all cells are coordinately triggered to apoptose, and
the node 812, Thl
apoptosis accounts for the apoptosis of only a fraction of the cells. The
mathematical
relationships associated with the node 814 correspond to the equation for
apoptosis rate
above.
The population of viable CD4+ T cells (TV) and apoptotic CD4+ T cells (Ta) is
determined using the values obtained from the evaluation of T cell recruitment
rate (r), T
CA 02447920 2003-11-19
WO 02/097706 PCT/US02/16770
cell proliferation rate corastant (p), and T cell apoptosis rate (a). The
viable cell population
is controlled by recruitment at the determined rate and proliferates at a rate
equivalent to the
population of viable cells and the proliferation rate constant. In turn, the
viable cells enter
apoptosis at a rate proportional to the population of viable cells and the
apoptosis rate
constant, and exit the synovium via drainage characterized by the half life
t~, as represented
by the differential equation:
dT"ldt=p *Tv -a *T,, -ln(2)lt~ *T"+r
The mathematical relationships associated with the node 810 correspond to the
equation for
dTV ldt above. The population of apoptotic T cells is controlled by the entry
of viable cells
into apoptosis at a rate proportional to the population of viable cells and
the apoptosis rate
constant, and is reduced by phagocytosis and degradation at a rate
characterized by decay
with a half life t~i2 as represented by the differential equation:
dTa ldt = a * T" - ln(2)ltli2 * Ta .
The mathematical relationships associated with the node 816 correspond to the
equation for
dTa ldt above. These equations then specify the population dynamics of viable
and
apoptotic T cells.
The values of the parameters used in the various functions within this module
were
determined so as to match experimental and clinical data and the guidelines
described
below. In the one embodiment, these guidelines are manifested as the following
constraints:
1. populations (T,,, Ta) are constant over time in the untreated reference
patient
(reference patient type definition),
2. the fraction of the T cell population that is apoptotic (Ta l( T,,+ T~)) is
Iess than 1%
(Firestein et al., J. Clin. Invest., 96:1631-1638, 1995; Ceponis,
Rheunzatology,
38:431-440, 1999; Salmon, J. Clin. Invest., 99:439-446, 1997),
3. the doubling time for viable T cells is less than or equal to 24 hours
(laboratory
knowledge),
4. the maximum time-constant for initiation of apoptosis is less than or equal
to 24
hours (laboratory knowledge), and
5. apoptotic cells are phagocytosed within 4-8 hours of entry into the
apoptotic
cascade.
In keeping with these constraints, in one embodiment, the parameters are set
as follows:
"reference rate" for recruitment = 0.4/hr, "cycle time" = 24 hours; "max rate
for initiation of
apoptosis" = 0.1 hrs 1 (90% initiation at 24 hours); half life for drainage of
viable cells (t~) _
21
CA 02447920 2003-11-19
WO 02/097706 PCT/US02/16770
672 hours (4 weeks); half life for disappearance of apoptotic cells (tl~z) = 6
hours. These
parameter values are not specifically reported in the public literature but
have been
determined to comply with constraints such as the ones above which in turn
emerge from
the public literature or clinical and laboratory experience. These parameter
values do not
necessarily have to uniquely satisfy the constraints, and can be changed in
alternate
embodiments with the same or different constraints, such as one describing a
patient with
increasing accumulation of synovial T cells over time or different apoptotic
fractions of T
cells.
As this example of the life cycle of synovial T cell model component generally
illustrates, the components of the Effect Diagram, denoted by state and
function nodes,
represent mathematical relationships that define the elements of the
biological state being
modeled. These mathematical relationships can be developed with the aid of
appropriate
publicly available information on the relevant biological variables and
biological processes.
In other words, the Effect Diagram indicates the type of mathematical
relationships that are
modeled within a given model component. The publicly available information can
then be
put into a form that matches the structure of the Effect Diagram. In this way,
the structure
of the model can be developed.
Simulation of Biological Attributes of a Diseased Joint
The model is equipped with a set of baseline parameters selected to represent
a
certain state of the joint. In one embodiment, the baseline parameters are
selected to
represent established R.A. The parameters of the model can be changed to
represent varying
manifestations of the same joint disease ranging from an absence of disease,
over mild
disease, to severe disease. The model can also be changed parametrically to
represent
different profiles of contributions of the involved biological process to the
disease. This can
be used to create and explore different virtual patient types for the same
disease or to create
and compare models of different diseases. For example, changing the
appropriate model
parameters such that macrophage apoptosis is reduced leads to a more severe
R.A patient
type.
The computer model can represent the pathogenesis in a diseased joint, i.e.
all or a
part of the chronological progression from a healthy to a diseased joint, as
well as the
chronological progression between disease states of different severity. For
example, one
means of including disease progression in the computer model can involve
replacing one or
more biological variables, formerly fixed at a particular value, with one or
more biological
22
CA 02447920 2003-11-19
WO 02/097706 PCT/US02/16770
variables that evolve over time and depend on some previously included or new
biological
processes. For instance, in one embodiment the number of dendritic cells in
the synovium
can be set at a fixed value, which represents their number for a specific
disease state.
Representing disease progression in this case may involve adding new processes
such as
dendritic cell influx, efflux and apoptosis, and letting the number of
dendritic cells change
relative to these processes. Another means of including disease progression
would be to
replace a parameter by a direct function of time, an algebraic function of
other biological
variables (i.e. a biological process), or via a dynamic systems equation such
as an ordinary
differential equation.
For example, in one embodiment the previously f xed parameters that specify
the
reactivity of .T cells to cartilage degradation fragments at a specific
disease state can be
replaced by a direct function of time or by a function of other biological
variables to
represent the potential role of the development of autoimmunity in the
pathogenesis of RA.
The depiction of progression of a diseased joint in the computer model can be
used to study,
IS for example, the pathogenesis of RA and approaches to cure the disease as
opposed to
achieve only temporary remission requiring ongoing treatment. Also,
pharmaceutical
treatments can be explored to prevent or reverse the progression of the
disease in the joint.
Numerical solution of the Mathematical Eguations and Outputs of the Computer
Model
Because the Effect Diagram defines a set of ordinary differential equations as
described above, once the initial values of the biological variables are
specified, along with
the values for the model parameters, the equations can be solved numerically
by a computer
using standard algorithms. See, fox example, William H. Press et al. Numerical
Recipes in
C: The Art of Scientific Computing, 2nd edition (January 1993) Cambridge Univ.
Press. As
illustrated above in the T cell life cycle example, equations can be derived,
initial conditions
can be obtained, and parameter values can be estimated from the public
literature.
Likewise, other initial conditions and parameter values can be estimated under
different
conditions and can be used to simulate the time evolution of the biological
state.
Note that parameters can also be used to specify stimuli and environmental
factors
as well as intrinsic biological properties. For example, model parameters can
be chosen to
simulate in vivo experimental protocols including administration of
therapeutic agents.
Furthermore, model parameters can be chosen to represent various environmental
changes
23
CA 02447920 2003-11-19
WO 02/097706 PCT/US02/16770
such as aging, nutrition, physical activity, exercise, stress, oxygenation,
and blood cellular
composition.
The time evolution of all biological variables in the model can be obtained,
for
example, as a result of the numerical simulation. Thus, the computer model can
provide, for
example, outputs including any biological variable or function of one or more
biological
variables. The outputs are useful for interpreting the results of simulations
performed using
the computer model. Because the computer model can be used to simulate
clinical
measurements (e.g. percent activated macrophages, percent apoptotic T cells
obtained from
synovial biopsies) and responses to treatment, the model outputs can be
compared directly
with the results of such experimental and clinical tests.
The model can be configured so as to compute many outputs, for example,
including: mediator concentrations in the synovium and cartilage including TNF-
alpha, IL-
1, IL-6, IFN-gamma, PGE-2, MMP-1, MMP-3; expression of endothelial adhesion
molecules including ICAM, VCAM and E-selectin; cell numbers including
macrophage, T
cell, fibrolast-Iike synoviocyte, and chondrocytes numbers; percentages of
apopotic or
activated cells; synovial tissue volume, cartilage thickness and cartilage
degradation rate;
matrix composition including collagen II and aggrecan concentration. The
outputs can also
be presented in several commonly used units.
Note that the computer model can simulate therapeutic treatments. For example,
a
therapy can be modeled in a static manner by modifying the parameter set of
the appropriate
cell types or mediators to represent the effect of the treatment on these cell
types or
mediators. Alternatively, therapeutic treatments can be modeled in a dynamic
manner by
allowing the user to specify the delivery of a treatment(s), for example, in a
time-varying
(and/or periodic) manner. To do this, the computer model can include
representations of
various therapeutic classes (e.g. soluble TNF-receptors and anti-TNF
antibodies, IL-1
receptor antagonists, steroids, non-steroidal anti-inflammatory drugs and
other disease-
modifying drugs including methotraxate) and how these therapeutic treatments
can interact
with the various cell types and mediators in a dynamic manner.
In sum, the computer model can enable a researcher, for example, to: (1)
simulate
the dynamics of a diseased joint, (2) visualize key biological processes and
the feedback
within and between these biological processes, (3) gain a better understanding
of the
pathophysiology of joint diseases, (4) explore and test hypotheses about
diseased joints and
normal joints, (5) identify and prioritize potential therapeutic targets, (6)
identify patient
24
CA 02447920 2003-11-19
WO 02/097706 PCT/US02/16770
types and their responses to various interventions, and (7) organize knowledge
and data that
relate to joint diseases.
Validation of the Computer Model
Typically, the computer model should behave similar to the biological state it
represents as closely as appropriate. Thus, the responses of the computer
model can be
validated against biological measurements and responses. The computer model
can be
validated, for example, with in vitro and iya vivo data obtained using
reference patterns of the
biological state being modeled. Thus, validation includes simulating the
behavior of a
certain cell type without input from other components of the model for
comparison with in
vitr°o data (e.g. with data on macrophage TNF-alpha synthesis in
response to certain
stimuli). Validation can further include simulation of the untreated
established RA patient
fox comparison with clinical measurements (e.g. histological markers of cells
in the
synovium, synovial fluid mediator concentrations). Validation also can include
simulating
the response of the model to treatment for comparison with measurements from
I S corresponding clinical trials (e.g. response of histological markers of
cells in the synovium,
synovial fluid mediator concentrations, degradation and erosion scores). For
instance, the
measurements taken in a trial for a TNF-alpha blocking therapy, which might
include data.
on the response of histological markers in the synovium, may be compared with
the
response of the appropriate biological variables in the model to a simulated
therapy protocol
representing the trial. The result of this comparison in combination with
known dynamic
constraints may confirm some part of the model or may point the user to a
change of a
mathematical relationship within the model, which improves the overall
fidelity of the
model.
Methods for validation of computer models axe described in co-pending
application
entitled "Developing, analyzing and validating a computer-based model," filed
on May 17,
2001, Application Number 601292,175. This application is herein incorporated
by reference
in its entirety.
Model Components and Behaviors
As discussed above, the computer model of a joint can include multiple
interrelated
components that each represents an element within the joint. In one embodiment
of the
computer model, biological processes related to cartilage metabolism, synovial
macrophages, macrophage trafficking, synovial fibroblasts, T cells and antigen
presentation
CA 02447920 2003-11-19
WO 02/097706 PCT/US02/16770
are included. One or more module diagrams for some of these components are
included in
Appendix A for reference. Some of these components are discussed in further
detail below.
In addition, the effect of standard therapeutic interventions on inflammation
and
cartilage degradation can be implemented in the computer model. Examples of
such
therapeutic interventions are also discussed below.
Compartmentalization
In one embodiment, the computer model of a joint represents two different
tissue
compartments, i.e., synovial tissue and cartilage tissue. These two
compartments are
capable of interacting with each other in various ways. One manner of
interaction is '
represented by the influx, from one compartment to the other, of soluble
mediators released
by the various cell types represented in each compartment. Another manner of
interaction
between the two compartments is the influx of breakdown products released from
cartilage
matrix into the synovial tissue, which can modulate cellular processes of
cells located in the
synovial tissue. .
However, the model need not necessarily be limited to these two compartments.
The model can be extended to include mathematical modeling of disease-relevant
processes
occurring at distal sites, such as other extra-articular tissues and whole
organs. Examples of
such extra-axticular compartments can include, but are not limited to bone,
bone-marrow,
thymus, blood, lymph nodes, spleen, GI-tract, and heart. In addition, the
model can also
include distinct articular sub-compartments and the cellular processes
involved in the
generation and regulation of such sub-compartments. Such specific sub-
compartments
include, but are not limited to vascular tissue, synovial fluid, ectopic lymph-
node structures,
sensory, and autonomic nerve fibers.
Cartilage Compartment
The cartilage compartment of the rr~odel can track cartilage metabolism and
cartilage
chondrocyte density through health, disease and treatment. In one embodiment,
the
cartilage compartment can be modeled as a homogeneous section of cartilage at
the
cartilage-pannus junction. The cartilage compartment can include biological
processes
related to the chondrocyte lifecycle, the chondrocyte mediator and matrix
synthesis, and
various processes involved in matrix synthesis and degradation. The computer
model can
represent the chondrocyte response to and production of factors affecting
cartilage
degradation, including cytokines such as IL-1, TNF-alpha, and IL-6; growth
factors such as
26
CA 02447920 2003-11-19
WO 02/097706 PCT/US02/16770
IGF, PDGF and TGF-beta; matrix components such as collagen II and aggrecan;
and
proteases such as MMP-1, MMP-3, and MMP-13. The resulting conditions can
determine
the net effect of the related processes on the cartilage matrix and the
corresponding
degradation rate. In one embodiment, the cartilage compartment is modeled such
that it is
influenced by mediator influx from the synovial compartment and in turn
influences the
synovial compartment through cartilage matrix components and the efflux of
mediators.
The chondrocyte lifecycle can be modeled by tracking densities of viable and
apoptotic chondrocytes as a function of chondrocyte proliferation and
chondrocyte
apoptosis. The chondrocyte mediator synthesis can be implemented separately
for each
protein as a function of viable chondrocyte density and modulation of protein
synthesis
including a baseline synthesis (potentially zero) as well as by stimulation
and inhibition by
mediators represented in the model. The decay of the synthesized mediators can
be
modeled through individual half lives of these mediators in the cartilage
compartment.
Interactions of mediators with each other can also be modeled. Interactions
that can be
modeled include binding of soluble TNF-receptor (p55 and p75) to TNF-alpha,
binding of
TIMP to proteinases and inhibition of IL-1 effects by IL-lRa. In summary,
chondrocyte
function is modeled by depicting the modulation by autocrine effects and
mediator influx
from other model compartments.
In one embodiment, the cartilage compartment of the model includes collagen
and
proteoglycan turnover in the cartilage matrix and uses collagen II and
aggrecan as the
corresponding, representative matrix components. The synthesis of these matrix
components by chondrocytes is implemented in this embodiment separately for
each protein
as a function of viable chondrocyte density, a baseline synthesis, as well as
stimulation and
inhibition by mediators represented in the model.
The processing of the matrix components and their incorporation into the
cartilage
matrix can also be modeled. For collagen II, the modeled processes can include
cleavage
and turnover of telopeptides, pericellular degradation, incorporation into the
cartilage
matrix, and degradation of incorporated collagen as a function of proteinase
concentrations.
For aggrecan, the modeled processes can include pericellular degradation of
free aggrecan,
deposition of pericellular aggrecan into the fibrillar matrix, lysis of
aggrecan out of the
fibrillar matrix, and turnover of the free globular Gl domain. The model can
track the
accelerating effect of aggrecan depletion on collagen II degradation, which
represents
27
CA 02447920 2003-11-19
WO 02/097706 PCT/US02/16770
increased perfusion by mediators, mechanical destabilization and increased
access of
proteinases to collagen fibrils.
Zonal patterns of cartilage degradation can also be modeled by tracking
collagen II
and aggrecan turnover in a superficial zone in direct contact with the
synovial tissue and an
unexposed deep zone located between the superficial cartilage zone and the
bone. Thus, the
differential effects of collagen II and aggrecan degradation can be modeled.
In one embodiment, the changing geometry of the joint during the cartilage
degradation process is modeled by a moving frame implementation in which
degradation of
cartilage implies that a specified-thickness superficial region of cartilage
moves deeper into
the cartilage. Thus, two model-defined regions of the cartilage are the
superficial zone,
which moves with the degradation and the thickness of which is constant, and
the deep
zone, which exhibits a reduction in thickness as the designated superficial
zone moves
deeper. In this embodiment, the volume and geometry of the superficial zone
remains
constant while degradation is taking place. The collagen degradation in the
frame
(superficial cartilage zone) determines at which rate the frame is shifted or
moved. As the
frame is moving and the thickness of the deep zone is reduced, the matrix
composition in
the frame is updated based on the collagen and proteoglycan concentration in
the deep zone.
The composition of the superficial zone is therefore dependent on both the
degradation
taking place in the superficial zone as well as the collagen and proteoglycan
concentration
in the deep zone.
The cartilage thickness at the margins of the cartilage in contact with the
synovium
as well as the cartilage thickness at a central location (representing
cartilage only in contact
with synovial fluid) can be modeled. The geometry and composition of the
cartilage model
can be modified to represent different joints such as metacarpalphalangeal or
hip joints.
A joint model including cartilage component can be used, for example, to
investigate how changes in cytokine and proteinase activity can lead to the
net degradation
of cartilage observed in RA. The cartilage component can enable a user to
explore the
influence of the synovial cytokine profzle on the cartilage metabolism and
thereby assess the
impact of, for example, cytokine-blocking therapies on cartilage degradation
in RA. The
user also can be able to evaluate the effect of selected anti-MMP and growth
factor
therapies.
28
CA 02447920 2003-11-19
WO 02/097706 PCT/US02/16770
Synovial Tissue Compartment
In the model, the synovial tissue compartment can comprise different cell
types. In
one embodiment, the cell types can include fibroblast-like synoviocytes (FLS),
macrophages, T lymphocytes, B lymphocytes, and dendritic cells. The changes in
net
density and in tissue volume of a particular cell type can be determined by
tracking over
time the total number of cells in a reference volume (a scaled equivalent of
the synovial
tissue volume). The net density and tissue volume can be used to determine
tissue growth
and retraction. In one embodiment, the initial tissue composition is
calculated as the.
homogeneous equivalent of the experimentally determined composition of
heterogeneous
synovial tissue: i.e., the cellular compositions and volumes of different
compartments in the
heterogeneous tissue are mathematically manipulated to represent a homogenous
tissue with
the equivalent average cellular composition and net volume. The net density
and volume of
the tissue can be used as indicators of synovial hyperplasia. In addition, the
vascularization
. of the tissue can be determined over time from specified vascular growth
characteristics.
In one embodiment, the population dynamics of each cell type is modeled by
including processes related to recruitment of cells from the vasculature,
influx from
nonvascular compartments, cell activation, contact-inhibited or nutrient-
limited
proliferation, efflux of cells into compartments not represented in the model,
and different
mechanisms of apoptosis. Each of these processes can be modulated by soluble
factors and
other synovial influences such as cell contact mediated regulation. The
processes related to
recruitment of cells from the vasculature can also incorporate the
contribution of endothelial
expression of adhesion molecules, chemokines/chemoattractants, and the degree
of tissue
vascularization.
The activation of specific cell types, for example macrophages and T cells,
may be
modeled. This activation can be modeled as resulting in distinct
subpopulations of cells at
: different activation levels. Activation can include biological processes
related to soluble
factor and cell contact mediated regulation, which determine conversion of
basally activated
cells to highly activated cells, each of which pools can be explicitly
represented. An
alternate means for representation of activation of cells, can involve the
calculation of the
activated fraction at each time point without division of the population into
separate
activated and unactivated pools. This fractional activation can be determined
by processes
related to antigen levels, the presence of antigen presenting cells, T cell
reactivity to
antigen, and further regulation by soluble and contact mediated influences.
29
CA 02447920 2003-11-19
WO 02/097706 PCT/US02/16770
The various cell types in the synovium synthesize soluble factors such as
cytokines,
chemokines, and proteinases in response to regulation by the synovial milieu.
The model
can include the regulation of synthetic activity in each cell type, which can
contribute to the
net soluble mediator levels in the synovial tissue. Regulation of synthesis of
each mediator
S by each cell type can be modeled explicitly. For specific cell types the
level of synthetic
activity can also be determined by the explicit modeling of activation
state/level. The decay
of the synthesized mediators can be modeled through individual half lives of
these
mediators in the cartilage compartment. Interactions of mediators with each
other can also
be modeled. These interactions can include binding of soluble TNF-receptor
(pSS and p7S)
to.TNF-alphas binding of TTMP to proteinases, and inhibition of IL-1 effects
by IL-lRa.
Cell contact mediated effects also contribute to regulation of cell population
dynamics (including cell activation) and synthetic activity. Cell contact
probabilities can be
modeled by representing regulated expression of cell. surface molecules
involved, the
prevalence of the different cell types in the tissue, and the likelihood of
colocalization in a
heterogeneous tissue.
Synovial Macrophages and Macroph~,e Trafficking
The macrophage component can represent the healthy and hypertrophic presence
of
macrophages in the synovium and their contributions to the inflammatory
process in a
diseased joint. The population of macrophages in an inflamed synovium can be
modeled by
representing processes related to macrophage recruitment and apoptosis in the
tissue. In
one embodiment, the computer model does not include macrophage proliferation
because it
contributes minimally to the accumulation of macrophages. The synovial
macrophage
population can be subdivided into different groups representing resting cells
and activated
cells. Activation can be calculated based on exposure to cytokines, growth
factors, and cell-
2S cell contact. The activation state can in turn determine the repertoire and
levels of key
cytokines and soluble factors secreted by macrophages.
The macrophage component can include the biological processes related to
synovial
macrophage population dynamics, including infiltration and apoptosis;
activation of
macrophages via exposure to soluble mediators; activation of macrophages via
cell-cell
contact; and production of cytokines and soluble factors by macrophages,
including pro-
inflammatory candidates (e.g., TNF-a,, IL-1) and anti-inflammatory candidates
(e.g., IL-10).
Inclusion of these processes can allow simulation of behaviors including
synovial
hyperplasia, the activation of macrophages by various stimuli, and the
resulting cytokine
CA 02447920 2003-11-19
WO 02/097706 PCT/US02/16770
and soluble factor production. A joint model including the macrophage
component can be
used for investigation of (1) changes in synovial hyperplasia and cytokine
milieu, resulting
from direct targeting of the macrophage population, and (2) effects of
cytokine blockade
and other therapies on macrophage activation and mediator production and,
ultimately,
synovial hyperplasia and cartilage degradation.
The macrophage trafficking component can represent the effect of synovial
cytokine
and chemoattractant concentrations on the recruitment of macrophages from the
circulation
into the synovium. This representation can enable a user to study the role of
macrophage
trafficking in synovial hyperplasia. In one embodiment, the computer model
includes only
a high-level representation of circulating monocytes. The regulation of
endothelial
adhesion molecules such as ICAM-1, VCAM-1, E-selectin, and P-selectin in
response to
cytokine stimulation can be represented explicitly. The computer model can
further include
the production of chemokines such as MCP-1 and MIP-1 oc by the relevant cell
types: In one
embodiment, the expression of integrins and chemokine receptors on circulating
monocytes
are not modeled explicitly. Instead, the effect of cytokines and
chemoattractants on
monocyte/macrophage trafficking rates can be assessed by assuming an implicit,
fixed
profile of integrins and chemokine receptors on circulating monocytes.
This macrophage trafficking component can include processes related to the
expression of endothelial adhesion molecules, production of chemokines by
appropriate cell
types, and effect of endothelial molecules and chemokines on monocyte
trafficking rates.
A user can target these processes by blocking the involved cytokines or
chemokines,
or by directly scaling monocyte/macrophage trafficking rates. Thus, the user
can evaluate
the effects of these strategies on reducing synovial hyperplasia and cartilage
degradation.
Synovial Fibroblasts
The synovial fibroblast (type B synoviocyte) component can represent the
turnover
of these cells and their interaction with synovial macrophages and cartilage
in normal or
diseased joints. The contribution of fibroblasts to synovial hyperplasia can
be the result of a
changing balance of proliferation and apoptosis rates, influenced by an
alteration in growth
factors and cytokines. The fibroblasts interact with synovial macrophages
through cell-cell
contact and their contribution and response to a common cytokine pool.
Fibroblasts also
have a direct effector function on cartilage through contribution of
proteinases and
cytokines to the pool of soluble factors in the cartilage.
31
CA 02447920 2003-11-19
WO 02/097706 PCT/US02/16770
The fibroblast component can include processes related to fibroblast
proliferation
and apoptosis, cell-cell interactions with macrophages, production of growth
factors and
cytokines, and proteinase synthesis.
The fibroblast component can enable a user to explore the pathological role of
synovial fibroblasts in maintenance and regulation of synovial inflammation
and
hyperplasia in a diseased joint. Another possible use is the assessment of the
impact of
therapies on fibroblast numbers and protein synthesis. Furthermore, the user
can quantify
the direct effect of fibroblast function on cartilage degradation.
T cells
T cells in the model may contribute to joint inflammation through their
response to
antigen and soluble factors, which in turn leads to activation of other
synovial cells. T cells
can be represented by a single phenotype, or separated into resting and
activated subsets.
The phenotype can primarily reflect CD4+ memory behavior, but can secrete both
pro- and
anti-inflammatory cytokines. Antigen presentation can influence T cell
activation states and
corresponding cytokine secretion. Population dynamics can be modeled using set
influx
and outflux rates, as well as proliferation and apoptosis rates that may be
modulated by
cytokines or therapies. The interaction of T cells with macrophages and
fibroblasts can be
modeled for through both intercellular contact and cytokine-mediated
communication.
This component can include processes related to T cell population dynamics
(constant influx/outflux; cytokine-regulated turnover), T cell secretion of
cytokines and
soluble factors, both pro-inflammatory (for example, IFN-y) and anti-
inflammatory (for
example, IL-10), T cell stimulation via reactivity to antigen presentation, T
cell stimulation
by cytokines and soluble factors, and T cell stimulation by cell-cell contact
with
macrophages and fibroblasts.
This component can simulate the T cell accumulation within the joint, the
extent of
activation of these cells, and their contribution to the cytokine milieu. A
potential
application of a joint model incorporating this component includes exploring
the
contribution of T cells to joint pathology by modulating their numbers and
response to
antigen. The user also can determine the outcome of altering population
dynamics (e.g.,
inducing T cell apoptosis), desensitizing T cells to antigen, blocking
specific cytokines, and
inhibiting contact-mediated intercellular communication.
32
CA 02447920 2003-11-19
WO 02/097706 PCT/US02/16770
Antigen Presentation
This component can represent at a lugh level the presentation of antigens to T
cells
by an antigen presenting cell pool that subsumes the specific roles played by
dendritic cells
(DCs), B cells, and macrophages. The population of antigen presenting cells
can reflect the
dynamics of macrophage numbers but can assume a fixed number of DCs and B
cells in the
synovium. In one embodiment of the computer model, recruitment and turnover of
DCs
and B cells are not explicitly modeled. A single antigen pool can be fed by
cartilage
autoantigen, generated during tissue destruction, and can include a constant
level of other
self or exogenous antigens.
This component can include processes related to determination of a net antigen
pool
consisting of cartilage degradation products and constant background antigen,
and
determination of a net antigen presentation efficiency and level.
This component can reproduce the presentation of antigen to T cells. The user
can
target this function by means such as modulating antigen uptake and
presentation efficacy,
and altering the relative contribution of each cell type to antigen
presentation.
Synovial-Cartilage Interactions
In one embodiment, the model includes the interaction between synovial and
cartilage compartments. In particular, the interaction can be modeled using
the following
two techniques: (1) representation of processes related to infiltration of
soluble factors from
synovial tissue to cartilage (and vice versa) and (2) representation of
processes related to
stimulation of synovial cell function by cartilage degradation products.
The first method involves the modeling of the flux of different molecules
between
the two compartments. This calculation includes equilibrium partitioning of
the molecules
between the compartments, and the redistribution by diffusion of the molecules
within a
given compartment. Thus, factors such as TL-13 produced only within the
synovium may
infiltrate the cartilage, and modulate synthetic and catabolic activity in the
cartilage.
The second method involves the stimulation of synovial cell function by
cartilage
degradation products including collagen-II and proteoglycan fragments.
Specifically, in this
method, processes related to stimulation of antigen-specific responses in T
cells by
collagen-II and proteoglycan fragments, chemoattraction of macrophages, and
activation of
macrophages are represented.
Other methods for representation of synovial-cartilage interactions include
the
representation of processes related to action of synovial cells and mediators
at the cartilage
33
CA 02447920 2003-11-19
WO 02/097706 PCT/US02/16770
surface, and transport of mediators from one compartment to another via.an
intermediate
compartment such as synovial fluid.
Therapies and Interventions
The effect of standard therapeutic interventions on inflammation and cartilage
degradation can be simulated in the computer model. These simulations can
allow, for
example, further calibration of the computer model. One method of implementing
a
therapeutic intervention is to change biological processes already in the
model, which are
directly or indirectly affected by the intervention. This change may involve
changing
existing parameters or biological variables, which are specifically added to
represent the
therapeutic intervention. For example a major effect of non-steroidal anti-
inflammatory
drugs (NSAIDs) may be implemented by changing parameters characterizing the
PGE-2
synthesis of the affected cell types in the model. Another method of
implementing a
therapeutic intervention is to implement one or more additional biological
processes
representing the effects of a therapeutic intervention. For instance, the
effect of exogenous
soluble TNF-alpha receptor may be represented by explicitly modeling the
binding process
of TNF-alpha to the exogenous receptor in the affected compartments. The
computer model
can focus, for example, on the local response to therapy and not on systemic
effects. In an
alternative embodiment, the computer model can focus on the local response to
the therapy
and the systemic effects.
FIG. 5 illustrates an example of a display screen having a PhysioLab~ Browser
window, chart windows and an experiment browser window, according to an
embodiment
of the present invention. The example of the display screen shown in FIG. 5
has two
windows each displaying a chart: a chart for synovial cell densities over time
(center low)
and a chart for key synovial mediator levels over time (lower right hand
corner).
FIG. 5 also includes an example of a browser window on the upper left-hand
side.
This experiment browser window allows a user to define, for example, virtual
patients,
calibration experiments, demonstration experiments, and tests for developers
and therapies.
These experiments and tests can be defined through the use of parameter sets
and value sets
where the user can modify the physiology of the joint with alternate values
indicative of
aspects of a diseased joint. In one embodiment of the computer model, a
parameter set is
based on the method described in U.S. Patent 6,069,629 entitled "Method of
providing
access to object parameters within a simulation model," which is incorporated
herein by
reference. The user can specify alternative value sets, for example, according
to the method
34
CA 02447920 2003-11-19
WO 02/097706 PCT/US02/16770
described in U.S. Patent 6.078,739, entitled "Managing objects and parameter
values
associated with the objects within a simulation model," which is incorporated
herein by
reference.
The inclusion of different therapies can allow investigation of the efficacy
of
combined therapies. The therapies described below define the current standard
of care for
R.A patients and can be addressed in the computer model.
The effects of NSAIDS can be represented. This family of therapies relies on
inhibition of cyclooxygenase production to reduce inflammation. In one
embodiment the
effect of NSAIDs can be modeled as a direct suppression of PGE-2 synthesis.
The effects of glucocorticoids can also be represented. Glucocorticoids are a
standard RA therapy with both positive and negative consequences on RA disease
progression. In modeling glucocorticoid therapy, the computer model can
reproduce the
following primary effects: alteration of PGE2 production, alteration of
mediator production,
reduction of inflammation, and reduction of cartilage degradation.
In another embodiment the effects of methotrexate are represented. The role of
the
standard RA and anti-cancer therapeutic agent methotrexate in targeting highly
proliferative
cells can be incorporated into the model. The following known effects of this
therapy can
be represented: modification of cellular proliferation and reduction of
cartilage degradation.
The effects of anti-TNF-oc and anti-IL-1 therapies can be represented. These
therapies can be implemented via mechanisms such as binding of active cytokine
to
therapeutic agents, reduction of effects of cytokines through competition from
receptor
antagonists, as well as reduction of concentration of active cytokines
equivalent to the
reduction of their effects by competing receptor antagonists. The computer
model can
represent, for instance, the following effects of therapies: changes in cell
numbers, adhesion
molecule expression, mediator concentrations, and rate of cartilage
degradation.
Testing of combinations of these therapies with each other or with traditional
therapies using the present invention should prove valuable. In addition, the
computer
model can allow explorations of other non-standard, investigational therapies.
In one
embodiment of the computer model, partial treatment of these therapies can be
included.
Certainty of the outcome of these therapies can be based on the quality of
available data.
Although the present invention has been discussed above in reference to
examples of
embodiments, other embodiments are possible. For example, although the summary
diagram discussed in reference to FIG. 2 illustrates one possible embodiment,
other
CA 02447920 2003-11-19
WO 02/097706 PCT/US02/16770
summary diagrams are possible that consider other aspects of the RA disease or
a healthy
joint. For example, FIG. 6 shows an alternative summary diagram having a
condensed
functional view and a compartmental view of RA, according to another
embodiment of the
present invention. As FIG. 6 shows, the summary diagram for RA can define
components
and their interrelations in addition to those shown in FIG. 2. These
components can be
considered from the perspective of cells as shown in the condensed functional
view, or from
a spatial representation as shown in the compartmental view.
While various embodiments of the invention have been described above, it
should be
understood that they have been presented by way of example only, and not
limitation.
Thus, the breadth and scope of the present invention should not be limited by
any of the
above-described embodiments, but should be defined only in accordance with the
following
claims and their equivalents.
The previous description of the embodiments is provided to enable any person
skilled in the art to make or use the invention. While the invention has been
particularly
shown and described with reference to embodiments thereof, it will be
understood by those
skilled in the axt that various changes in form and details may be made
therein without
departing from the spirit and scope of the invention.
For example, although a certain embodiment of a computer system is described
above, other embodiments are possible. Such computer system embodiments can
be, for
example, a networked or distributed computer system. In addition, certain
embodiments of
the invention may be practiced without the assistance of a computer system.
All references cited throughout the disclosure are incorporated herein by
reference in
their entireties for all purposes.
36
CA 02447920 2003-11-19
WO 02/097706 PCT/US02/16770
15
APPENDIX A
37
CA 02447920 2003-11-19
WO 02/097706 PCT/US02/16770
A-1
Summary Diagram
RA PAyslptab Overview
AbbftylaHOnsandClotiMy
FlltccDlagram Design anG Ufa
Asfpmpdons..andEYduslant
Char,glngPUaMtttr Valuef
' Db~tttProperde~/ Parameter DeOaldons
Paiigssfvns ~Svnovium
T Ctll
ura cyst
7 cep
Prateln
Synshasls
/' Cartilage
FndoNelial Mac ~ ~ Chondrocytt'
Cell-Cefl Mac Mac S oytal Cnrdlagt Chondra Cudlage
CpnPC[ Adh<tlan IttuultmeM LIfeCyde protein Mediators Medlatars Pr~ttin uft
clt Metabolism
Molecules Syhthesls Syntheses
F!S
Proceln
SMthtsis
Clinical Read-Outs
uftsc na nyvtrvlafla~ D flreaaon
Therapy
38
CA 02447920 2003-11-19
WO 02/097706 PCT/US02/16770
A-2
Therapies
Methotrexate and NSAID Effects
DeDUlarcs
D
Oetrcuts
F
llowt
H
Hall
L
n
I
lnrreases
L
Lraaa
M
Moves Methotrexate NSAID
P ffaaoniLS
'"'"rt' "~I~M
ralrcarano
CAanges5tare
Therepics . Hetllovaxate.Mert~ew Inaomtthadrl
(~ OvervleVl
eorecvaterAla, v"AVlal M
etfectonTCell
falrccranp
7herapits
(~ SAID
Antl
TNialpha
ynovlal M affect
effectonTeell o"
mac
PGE2
apoptotis synoN4
t6AID
OvialM t6AID
.
refferton effeCtaniLS
iL3lL-IRa
navi a AID fec
c l
gt
effect on ~
'D
on<honaro
iL5lL6 PGE2
sy"ovial tartllage
HTX MT%
cunlige carnMga
MTXeffect
an MMP-I
f:nnvrlnhtf117DDD
39
CA 02447920 2003-11-19
WO 02/097706 PCT/US02/16770
A-3
T1 1 a ra p ( ~ S $ytIOVIUITI 91ti a~orncela macaolrial Cartilage
Corticosteroids
. ReDUlares l;arucoshrolawe
D Oetieues
P !l Ws
H Hall(?e yn~sterol
fCP-2
I lntirases Inhlbtiltin
L LeaAs
M Haves
P HoAUCes Yti.sttrol
S ChsnDesSrarr synovlal ~Ci -.
InhIblUOn
m api (I) 9lucocorUCOla
NSAIDS and yn. sterol
MeNOtre%ate ICP-1
Inhlbltion
mermies t3>
Antl-7Ni-alpha
yn. ttvol
MCP-1
Inhi0ltltin
syntivlal Vti.st<rol
MIP-1 alpha
qtticticorUCOia
inhibition
yn.sterol
IL-0
inhibition
CDpyriAht~2002 EntelDa-Inc.
CA 02447920 2003-11-19
WO 02/097706 PCT/US02/16770
A-4
Therapies
Anti-TNF-alpha
. Regulates .sTNf-R(fNhUpbagipdlngOVerylew'
D Oeritues
F flows
H Hnl/l
1 Inrreases
L LesOs
M MpsYs
P GYOauces
Changet5rare
synovlU ~ synoNU ~
Theraples(Q H 1NF-Upha H TNF-alpha
cprdrosmroMt ....... O .......
xosTNF- ael.exo. n vIUTNF- and-TNF-a 7HF~al
Therapies i1) binainy/als- L TNF~RII bindin expoTTNF-RII H Ab binding L dU.
end-TNF-a and-TNF-a H
NSAIDS and b binding rat
adadonra rate c plexes bcomplex<
NeNOtrexate
synevlU .
synoviU
H exogeneobs H and-TNF-a
tTNF-RII Ab
2002 Entelos.
41
CA 02447920 2003-11-19
WO 02/097706 PCT/US02/16770
A-5
Chondrocytes
Llfe CyC~e Model Calculation
~hoPa.ot~a~,«r«aw,~~
ReDUlahs
D Oerreues
P !lorvs
M HaIFLfe
I Intrcues
L teaas
M Aloves
P RraCUtes
ChanyesStaft
Chondrocyte Density Data
for Comparison
qiwtar0ompvtson
," tMmomiisesajbp
,...». ..., ~..r... ,~.... »~.:'~COpytight02002 Entelos.lnu w~ '~ '"'' ... W .
._....~.. .... ...,... ... , ... . .. .. . .... .. ..,..
42
CA 02447920 2003-11-19
WO 02/097706 PCT/US02/16770
A-6
Chondrocytes
Protein Synthesis
. arDmarrr ~cno~eroc~rrPr,~m~nsyncnxarwrrwtw~~
D Orrrraser
F lkrvs
H HatF
1 /ntrruer
i ur.er
M Moves
P RvCUCer
s ChurDrrSr.rr
Hegulanvh of
ChonOrv.
Pruc svnm. (z)
Negulation of
Ch(InErv.
arot.smm. t3)
43
CA 02447920 2003-11-19
WO 02/097706 PCT/US02/16770
A-7
Chondrocytes
RegU~ation of Protein Syntheses (promotors) Other Factors (inhibitors)
Regulstioh of Ch6adro ytt,fhohlnSypthesfs QyerNGW '
Rtqvlrmrf
utsieroi
D Oetrcases
TCF-bem
F leaver
Ibhlbltipn
H Nah=Im
1 Mrrelses
L cemr
N Mosys N rar 7egt '
P npeura IL-s ondrppyt
s changrrsrarc TCF-beta
synNesls
Chpndro. N cartihge '
ProttinSynth. TCF-btta
°' (promotors) Cytokines (inhibitors) (Promotors) Chemokines
(inhibitors)
0.egulatigA of art #erol
Chpnaro. aK sterol a c sterol IGF-I
RotSynth.(9) IL-1 Inh bltion Inhibition
Inhibiddn
N cutilaAe ' effectNe
TNF-alpha cartiNAeIL-1
honargcyt . honarDM
honaroryt IL-8 tartllage tartllage ' ICF-1 cartilage ' N ;;~
. ..... IL-I IFN-gamma N N FCF-2 TCF-beta
N tutelage ' synthefls cutilagt ~ synthesis rynthesis
IFN-gamma H TNF-alpha
terol arc mrPl arc sterol
trrectlvt a a-s NcP-1 cN-aF
cutilagelL-I Inhlbltion Inhlbitlon InhlOltign
efrectlve
N cutilaDe' cutilagelL-i
1NF~alpha
pnarprvt ..~~~~~ andrppyt
N rartgagt ' NcP-1 pnarPCVt
TNF-alpha sL 6 efl<cWe syntAetls N cartilage ' CN-CSF cartilage ' N
°u
synUltsls 'TNF-alpha TCF-beta
.......
cartilapelL-I synthesis
cartilage '
N IFN-gamma N c'' laze '
art
sterol
IL-1
Ra
efltttiveInhibition
cartilagel4l
cutilaptondrocys
'
N IL-IRa
TNF-alpha
.ynmeals
N Ilag
'
ar
IFN
9.emm
44
CA 02447920 2003-11-19
WO 02/097706 PCT/US02/16770
A-8
~hondrocytes
Regulation thesis
of
Matrix
and
Proteinase
Syn
Ulares
- CRtnylwo~ or
Rr ennaroa>rte
vinl syntnea7s
o4.wlaw
D
D
OeW
eats
F
!lows
H
HavCne
1
/nneases
L
Cea6s
M
HasKs
P
HAUres
s
cnanvtrsnrc
choar. (promotors) (inhibitors)(promotors) (inhibitors)
ntHnsytn,
t!>
ReAAlaMan
f
tHealve
H
hOndr.
PrtSynth.(2) earUlageIL-I
art earUlege
steri
MMPI
IL-6
(promoters) eardlage'InhIbHn
(Inhibitors)
H TNF.Jpha cutga9eH t<rI
uts
,t
ut MTXeffettcarUlage MMP-13
sterol , on MMP-1'
ol.llla99rec cartlle9tnErocyt PDGF Inhlbl9n
tutilage
'
InhIElUOn H MMP-I 1410
~ FDF-2
/ synthesiscuUleDt
effective ' ...
l IL;10 H cuUla9e
carUla9eIL-1 H '
'
earUlage earUla9t FDF-2 honUrcyt
H ' ..... MMP-13rtla9t
IGF-1 H IL.6 x
79
eIle9enll ile9e synNesisIL-
eartllage 1
H
synthesis TGF-beta
TNF-alpha cartilage H H cuUla9e
.
'
H H PDDF TNF-alpha Ila
carUla9e e
'
TGF-beta
carUlage g
H
IFN-gamma TDF:beta
effecWe
art scttol art St<roi
°L11/agDrec earUlage ' H MMP-3
InhibiUOn v THF-alpha ' inhlbl(f0°
H cartllape cartllape
carUlage ~ NfecUVt TNF~UPha _IL-a/19
IGF-1 l arUlagelL-1 ....... onEr°cyt
MMP-3
a99rtean synthesis
synthesis
Ilage ~ ettettlvt Ilage
TGflbeta M~0.1 H cuUlag<IL-i IFNgamma H
cartilage
MIP-I alpha
),-'..
~ 2002 Entelos. Inc
CA 02447920 2003-11-19
WO 02/097706 PCT/US02/16770
A-9
Cartilage
Natural Inhibitor Interactions M"P~'Nlew MMP/TIMP Interactions
TWPQVeMeW, MMP(TIMPeiri9,Sn90veMhy
Regulates
D orataars
' "°'"' IL-1 /IL-1 Ra Interactions
H Half ZNe
I lnr'eases
L ZeaOs
N Moves IL-IRaImPhmentabo00veMew
P iYOOUtts
ChanDesStra
CuUlage H cutllagt
Cytoklnes 6 IL-1
Soluble Fattors
CarUlage H carUlaye ~ carUlagelL-1
logllaadoP IL.irsn
adtal
Iromg7 carHlaAe
CerUlaAe IL-iRa
Diffusion carUlage
Adlustmmis H exopenoos
IL-I R1
TNF-alpha/5oluble Receptor Interactions
~~sTNhR/TNF-alphaDlndidg fiveM
caNllagt
7NF-alpha
euUlagt
soluble
H carGlept
TNF-aiPha
cartilagecarUlagedtl.
cutllapt
NF-RllbihdinTNF-Rlibindin
L TNF-a(1NF-Rll
H
rate hate Complexes
-
tarUlaye
.
H soluble
TNF-RII
46
CA 02447920 2003-11-19
WO 02/097706 PCT/US02/16770
A-10
Cartilage
Matrix
Metabolism
. CarClageMaboIISmOVeMeW
RegWarcs
D
Oetrtues
G
i7ans
H H H
NallLT
I
Inneasts
L
tea0s
M tarNlage 'e araaea
Ifaves ~ graaea H
P ~
fYa0urtl
C-PrgPtpNae P collaAtrt
GanpesSrcrc Ilagen
P O O
aslayta cenc<Nmar.
collagenll~
OcHCellularL ollagenll
Ivsis
cglla9enll
cgLllNslsIvsls
i
rynNCSls
o
fr ee colla9< sls
g of
P _5 g t
Procglla9enll rollegenll [ Ila9enll
Incorpor
Ian
fibrils
gfn
a
arNlag
Nlchncff
D CarNlageThickneff
viable ormallxc cuNle9e tollagenll~PaturNt
. aggrecan aegra0atlon of
chanarocyrc CasplapeGtgradaNon
ptraHgn
atnsity aeple Nonra teH Raelbpiaphic
V progresilpP
D
copal
ST ceralage
refvalumtNICNS,ess
:;~E
e99o an avlnm
. c ran
a
P M n Ilegen can cts
frctaggrecan I 99 rt Vaaon
o Pbrlls Increase
aA9recan
rynMesls _
ggrecen
a lysls
frce
gg an ggrecan CIaomJnof UnitConversiOn
fra9 is fra9 Ts 9B
carNla9e carNla9e
atAraaaagn aeg a,ratc
~ 2002 Entelos. Inc.
47
CA 02447920 2003-11-19
WO 02/097706 PCT/US02/16770
A-11
IL-12 I synoNM rod. ate I
IL 12 synovial exogenous
Synovial Tissue H P~~ . H
proa.ratt ~ I PCE2~ zTNF-RI
Cytokines ~ So~ub~e FaCt01'S L17 I ~1~H H prod~ratn sTNfcRI I H
rpa.ratt 1 synoviH
. Reyulatts fiypDUlnITl McelatorModolntiVervIeW~~~"" prod rate
D Ortttnus H mac sTNF-RI
F !lpwr ,Catrel'aHO BipmulerjDlseaseAPtiViry sypovlal MCP-1 I
H Hall ~ IL-10 I . H F~ I
1 Inr~rarer nod raft IL IB rpE.ratt I sTNF~RI
L ttae svpovlal
M Movtt macl4l I MC0.1 proa.rate
FIS
P PrcOUtes ~ mac MCP-1 Tcell
pros. raft TNF-alpha
Chanyrs5ttrt I . H H Prod.rate sqgF-w
synovlH roa.ratt I
synovlal ' prod.rHc
fiTNaturH FLfi 1 IL-1 TNF-Hphs
Tell I
Inhlbihr 7L-1 TNF~sl0hn MIP-1 alpha ~ H ma
Interncdons prod.rnte rad.ratt rpd rate I synoNal c
H I MIP-1 alpha ' z eFrnte
Tcell FLS o
IL-2 I sypovial ~ mac H MIP-1 alpha I H
IL-2 IFN-gamma
rpe ram prpa.ratt
rod.ratt I synovlal ~ sTNF-RII 1 zynovinl
IPN-gamma sTNF-RII
I orpa.rHC
Tan ~ I
exogenous H. IFN-gamma ILaB Tcell
IL-4 I rod. rate rod. rate
sypovlal sTNF-RII
IL~4 _I H OrDa.rnt< H
T call I FLS synoviel
IL-a DM-CSF IL-8 I IL-B 3Vnovlalu .
roa.htt .J . Drpe.rate I
Im4~19 rod.ratt exopnpous I <xogin o s
sTNF~R11 sTNf-RII
exogenous ' j FLS I H Tcell ,
sypovlal ~ IL-B
IL-19 I CM-CfiF I H
tydovlal CM-CSf prpd.rnte Ynovinl .
~H~ rad.ratt ex Aep us 1 gaDnous
~~"'~t
I IL~19 I IL-IRa axsIL;I0.a
T «I1
IL-19 T cell ma mac
rod.ratt CM-C9F MMP~7 H
proa.ntt prpa.rHC I syn0Na1 ~ H
Ilnlng IhIRa
I MMP-1 roe.rH< I fynovlal
IL~6 exogenous MMP-1 IL-1Ra
roa.rntt TGF-beta prDa.htt FLS 1
I IL-IRn
roa, race
synpNal ~ H Y Hnl
IL~6 _I TCF-beta mac
IL-fi MMP-9 collagen II
proa.ratt proa.ratt
1 I protl,.ratt I sYnpvlnl . H fraqmencs
Tcell FLS IIBIn9 H
synovlal ~ FLS . I MMP-3
IL~6 TCF-Onta I .TCp-petn MMP-9 ~
rae.raft prodrate syp0He1
I oroa.raft FcF,2 ~
I
Tcell
exogenous iGOF-Onh expgenous H '~
IL-10 d.ratt TIMP-1 sYDONH
I ICF-1
H
aPOp.TCe zynoNal . H
prod raltt 1 sl1f1t1H ~ TGOF-beta TIMP~1 I IIRInp
d.ratt rpd.ratt TMP-1
I I ..
Tcell H
r1 a l htt PDCF I PDDFaI TINP-1
ro~~ ~rpa.rm _,
48
CA 02447920 2003-11-19
WO 02/097706 PCT/US02/16770
A-12
Cartilage
Cytokines
&
Soluble
Factors
ReDUIesrs
camlagt;dloblecaaPrHoaolt
D OerrrasefoutrHm. MCP- I lagt H
F nPm>
P-1
M
H Har-Irre roe. rate~
I jnrrtarrs
L LraCr
H MPVes lagn
P hTOdures MIP-1 alpha
H
s cn.rrgrrsrrrr
ardlage cu ilage H ondroc
Natur TNFalphn IL-3 I artllagt
Inhibitor ~ H
Inhractlons rod rate IL-D
hondrac7rt
IL-1 I cartilage
udlagt~ H
IL 1
mnntrarro~Prod.reh
fromST.. c~lag H
IFN-
am
a
m nonarb
Cunlagecartilage ~ - H O MMPI , cualagt
DiflusianIL 2 I ~ H
rod race MMP-1
Adjustments
ondroM c ilaga
C eai rtlln
I CM-CSF H ~
h
~ MMP-! ge
cartilage H I c
IL-4 H
MMP-3
v oe. rate
cartllegt
IL-4113
ndrocyt
IL113 H od rah 1 TCi~betnM d0.ah MP-Ig9
H I H
hoAdroc c ilege
TIMP-1 H '
ondrotyt I TIrHP 1
IL-6 I tartlMge Prod.rue .ui
roa.rah ~~ 6 H 'aZt ~ H
~'
cartilage
c nlage H c Rage .
IL-ID PDCF H s lublt
H
TN,F; RI
cartilage
.
o tPagn arocvt s melt
a'17 H L2 I cPGF2t TNf; RII
H ndroryc
c Hlege
IL-IRe IRn
I IL
H '"gl
rod. rah :
c Ilag ondroM
IL:IDt H raa'rah I cualaAe
~ H
ICF 1 x 0 H
IL IR
o- n ..
49
CA 02447920 2003-11-19
WO 02/097706 PCT/US02/16770
A-13
MMP-7
npx across
rlpx across
Cartilage ILIB
H C% H C% H
Infiltration of Factors from ST
tpRaw~ .
rynovlal ~ rClagt ~ cartilage
IL~1A ° ~ IL 18 Ilnln9 " ~ MMP-1
ReDUlatet MMF-I
D Otrxeatrt MeGiatorlnfiltrat(anfromSTintpCartIagtOVerview
r llows , F-alpha
H HaV LHe IL-1 ... MMP-3
flux across
1 /ncrtates flpxacrpss C fluxacrpss
L LeeCS H C% H H % H H C% H
M MosYt
P FPNxres _
S phanges9rale svnovlal ~ carblnge sv~vvlal ~ ° ~ rtllage ~ synpNal .
carHInAt
IL-1 ~ Q IL-1 TNF-alphn TNF-alpha lining ° ~ MMP-9
Cartrlage MMP-3
DMUSIOP
AGJvstments IL-2 N-gamma MMP-I3
l fltrxCac%rpis H H fluxCac%rDis ' H H OuxC%rpss H
Cartllagt H
Cytpklnes6
SolubleFactprs svnpvlal ~ ° ~ cW129e ~ IFN~y~lsls . ~ IiN6Dlagte HMP-19
4' MMPnl9
IL-2
nNlage Natur
InhibItOr
Innractrbns iL-4 TGF-ben
flux across Oux across sTNF-RI
H C% H H C% H flux across
H C% H
rynovlal _ carUlage novlel ~ ° ~ cerUlage silo a .
IL-4 ~ IL-9 Tfd-ben TCP-beta sv" Wp ~ luble
F ry F sTNF-RI
_ Fcr_z
IL 6 llux across tTllF-RII .
rlpx across D Rpx across
H C% H H % H H C% H
rynovinl ~ cartilage ~ fm MN cartilage .
synwlal ~ _ F cartlla9e ~ FCi-2
FCF-2 F soluble
IL-B O IL-B sTNr-RII
PDC! I
/ IL-ID IL~ Re
flux across
Ilux across p% flux across
H C% ~ H H H H C% H
rynovlal ~ ~ cILUIDt ~ synoNel
IL-10 PDCF ° O c PDCrt ~ synoNal ~ . IL-IRpa
IL-IRa
IL-13 CN-CSF exogenous
box across npx across IL-treflux
H C% H H ~ C% N H ostC% H
13 ~ cIL-13t M-CSr ~ cartilage ~ tynpNel . carHlagt .
F ° ~ GM-CBF txlL-(Raps ° ~ exiL (Raps
IL-17 TIMP-1
flux anass flux across
H C% H H C% H
rynoNel . caNlagt
ryL-i7al ~ ° ~ cartrla9e ~ lining ° O TIMP-1
IL-17 TIA1P-1
CA 02447920 2003-11-19
WO 02/097706 PCT/US02/16770
A-14
Cartilage
Diffusion Adjustments for Small Molecules
ceruiage oirtason palutm,~mt tivtr~tts,
Reyulatts
0 Decreases
s Moms
H Hall L'Pe
I ~ raues
L LtaAs
M Moves
P HaCUCts
3 ChanytsSRte
Cartilage
mnAo-asorl
framST
hohdrucyt
carelegt or e, to
Cytokines6
Soluble Patiors
PcEZ adlutae
ertllageNatura dHfusion lnttrfedel
Inhibkor aelustmen PGE2
Interactions
PG~2
,.. flexacrast
synoNal ~ cvdlage
-PGE2, ~ PGE2
InterfadJ
syngvial ~~,,L1~~ t _/ cardleAe
7L-8 ~O~ IL-8
nAx ettast
IP-1 alpha adlustee
aHrutloo loterfulal
~ Icw-At ' eelustmtn IP-I alPh
Icr I
MIP-1
n~xavost
H C% H
synoNal _ ~ cartllagt '
MIP-1 alpha MIP-1 alpha
cao..a~m a ~nng
51
CA 02447920 2003-11-19
WO 02/097706 PCT/US02/16770
A-IS
Synovial Tissue
Volume & Composition
. srvor mtx~a,:omposinonoo.rdiew_.
atnmrrts
D
Ottnases
F
!lows
H
HaJlAe
I
lnNtues
L
terdr
" and Cellul Vascular Volume & Densit
""'~'r Com
osition
ue V
lu
Ti
o y
P me
IYOOUresa
p
ss
ChanOtsSfrK
$Tinidel
Composidonb
Density IatNe total
vascolv $T 5T
$TCeIIDenslry r
mdnrdt volume relvalume
b
Fractions
y'avlalM ~novial vasculv
ffecton lar staler volumain
volume density $T refvol
52
CA 02447920 2003-11-19
WO 02/097706 PCT/US02/16770
A-16
Synovial Tissue
Initial Composition & Density Calculations
kepulattsSTInItIalantianCalculado~spv~rvjen
D
OeW
eeses
s
Glars
H
Hnll
L'ft
i
Inrreuet
L
CeaOs
M
Mover
P
hoCUtet
ChanDesSKK
STCeIIDenslry
&
frutlons
STVOlume6
ComoaslUOn
53
CA 02447920 2003-11-19
WO 02/097706 PCT/US02/16770
A-17
Synovial Tissue
Synovial Cell Densities & Fractions
. sisenoer,zmazsFrunonzwerview
utyurrrer
D
Detrenrer
F
llorvr
H
HaY-
1
Intreues
<
<,as
M
Noves
P
P
oEUCes
ChtnOtsSlrte
571n7tlal
comppsluona
Density
57YOlume6
Composltlon
'~ mabin zYnpmnl
FLS: N"~ a FLS N 61e
v1 ble FLS
lracHon GensIN lractlon
F~ ePPPtotlc synovinl
aPOPtoNC apoptoticFL: epoptoticFLS
lrnctlon
n
FIS
In ST Vnovlal
sYnovlelcell
s
refvpl Ft5
a.nzm~
atpzM,
T Cells:
54
CA 02447920 2003-11-19
WO 02/097706 PCT/US02/16770
A-18
J
Synovial Nonspecific Contact Active Mac/FLS Contact
TlSSU2
MacrpLS comas ,
Cell-Cell samovlal
Contact
syaovlel d co~~'en actMttamac
- ceps"y tt fracnn~
xrgwarcs
D ceti-CenConuttOVeMeW...Index c
oerreues ma
r
c
nc"' sur
ace
H mac
HnllLm cycaklnes maclfLS
Ilganon Ilganonlnaex
1 r~ ~ robabll per pL5
/nrreates '~1
L
L0s
M surface
Moves nah.mol. macrsLS sL5
P
HoAUres
' MaC/T Cell Contact colocallxanon IIgaHODlnatx
Chenyes5hte adjustment Derma
synovlal
Adhesion Tcell synovlel MaC[T<tIICOntatttabden I~-cell
molecules ca tatt
surface viable mec IDatx
cytoklnes hacnon
Thl-Ilke
DD40L+ . mec(TCeI
effectar I mac
acHvIN Th1 adhesion Ilganonlnaex
frecJlon robablllty T Ce I I /T Ce I J
erTh1 eel Co n tact
cDagL- m~ maclTCen Tnl aH
- . rcenFASU9an n
s 1 rolocanaaHan 9ganontnetx
cDAOLt II sur
. ract
Thl
rnl
rrarno~ ~ svpomal
s ~
rramv~ cDno aamsHn<D
vlabhTnt
rynovlal hacaon F
'
Thl-like vlablaThl 11 cell Tcell
Tcell hactlan contatt GAS celllTCe FAS
.
Index
effettor IIgaHOn IIgaHOnlnaex
surlace ~.
activity robnbll DerTII 'i.
cytoklnes '
~
Tctll
pA5L
eel
calacallaatlb
n I ti
FLS/T Cell Contact aatostmept o,atx
novlal
'
ay
cu-csr
su
ixce 'TCiI(~FLj rordac
CD40
'
N
synovlal ,~f
IGN-gamma Active Mac/Mac Contact
~N
MLC GAS IJg d
synPVlal
actlvattamac
ra
rramoa
tytoklnes mac
G~ maclmac IAS
synovlal
N 119 Hon Ilgaaonlnaex
TNp-alpha rpbabll Perms
w
d
i
effecWe ar
LS ate
l ma
r PAS-L marlmac
colacallzanon cell-cen
synov wNstmeP rontatt
al maex
su
ace
a-t
nah.mDL
H
svnovlnl
'
IiN-gamma
CA 02447920 2003-11-19
WO 02/097706 PCT/US02/16770
A-19
Synovial Tissue
Natural Inhibitor Interactions
Regulates
D OettNSes
F nrir IL-1 /IL-1 Ra Interactions
H HellLfe MMP TIMP Interactions
I lnrreases IL-IRatmPiemenattonOVeMhY MMPj'f(MPBtndInDOVerotew.,.
L Geadt
M Mover
P FYOAUCes
S ChanOesState synoviJ
H 1L-1
STMoYJnes& "' effecdve synwlJ . H
Soluble Factors H synoNJ ~ synovlal Ilnl~D
MMP-1
IL-IRa rDIJ IG-1
.. 5
synoNJ
s IL-IRa rynwial delayed ST Mp j'~TIMP-1
avlJ . H MMP-1(TIMP.1 MMP-1[TIMP-1 L
ekogeneaus Indlngrat
H IL-1Ra tomplexts blndl~A rate
H
rynovlJ .
II~I~D
TIMP-1
TNF-al ha Soluble Receptor Interactions
'sTNF-R(INF-JGhagtndYn4Mervtewl synoNJ . H
IInIng
MMP9
synoNal
H ~ rynovlJ delayed ST tynaNJ
TNF-Jpha
.... . ~ H M<PT9/TI 'P-1 MMP~9(TIMP-1 L MP-9[TIMP-1
p1 t blndln9ratt IndInDSat
s~a[sTNf~ tynovieldel. rynwial
dlng[dlssodn L TNS~Rlblndlnp T'NFna[TNF-RI H synoviJ . H
ca Plexes Ilnlng
TINF-I
M rynavlJ ~ synoviJ
sTNF-RI llnlnD
other NMPs
zynwinl deLSTother STOther
H btr MMPITIMP-1 L MMPYNMP~I
H rynoNJ ~ MMP[TIMP~I bindinDratt Indln9rat
TNS-Jpha
....... ~ ~ H
synovlJ .
F-a[sTNS~ synoviJdel. rynoviel IInInp
dlnD/dissocia L TNi~RIIbIndin TNP-a/1NF-RII H ' TI,NF;1
Complexes
H synovlJ
slNP~RII
U
56
CA 02447920 2003-11-19
WO 02/097706 PCT/US02/16770
A-20
Synovial Endothelium
Adhesion Molecule Expression
AGheslan Malac4le EzPrnsslan 4veevi<W
NlDU2tet
D Otrrldflt
F !lorvr
H Hnllllle
I lnneatet
L teaC ettaceve
M ~ vet H synavlal sY~ovfal H symoviel ~ H synavlN
P PrDAUret TNF-alPhn IL~I IL~10 IFN-gamma
CNanDltSntt
:-f
Adhesion Molecule
Normalized Expres
norme0zed with respect to!
Relative Expressior
relative to E-selealn In he
57
Image
CA 02447920 2003-11-19
WO 02/097706 PCT/US02/16770
A-22
Synovial Macrophages
Protein Synthesis
- ' Smo'~atMacGroteysyn~asisOVewim
FepuHrcr
D
Ortrearts
F
IMrvs
H
Hell
L!e
1
Jnaruer
~
truer
M
Maves
0
fYOCUCtr
ChanyesSrcte
RegulationTNF-alpha
of sy
Mai sls
PsotelnTNF
Sm
hesls
(n
Mac
Regulitlanto
of synthesis
Mac
Psotefn
Smthesls
(~
59
CA 02447920 2003-11-19
WO 02/097706 PCT/US02/16770
A-23
Synovial Macrophages
Re ulation of Protein (Promotors)lnterleukins
S 1'lth2SIS Other (inhibitors)h
(promotors) ck-in
ibitors (inhibitors)
rnxmya
a ReyuleNS MnctoppagaRegulatloflolFSOttIn9yMliesISOVeMew ~vWJ '
D Derrcases IL
1
_
F !laws H ryvIJ rsyn.RerolH synavial
H Ha(lLh , IL-6 IL-6
I lnneases IL-17 inhibition
L traet
M Naves ... , mac Yz.tterol
P PrPeuns synavialac YnovlalH sYWJ sTNF-RI
' _ TNi-RI
IL-6 IFN-gamma
3 Ch H IL-IB IL-4119rynthesis 7nhlbi0on
5ta
anges rynNesls
m
Regvlatlvnof (promotors) ,yPyl"
TNF-alpha (inhibitors) synoNal synbvlalH
MatRvtNO ' ' GM-CSF
H
6ynthesit(1) H H pGF1 .IL;10'
Thi
cell
Regulnlon of IIgatIOnInEex
H
synaHal
Nnc Rottln
~ synovlal
3ynNesis(3) H GN-CSF IL6
IFN-gamma y.zt I
amo0on H SynoNal
u-ID sn,r-wi
lPhibl6or
svB°wal ~ n
TcF-beta n tmamd ' .dmamal ' H ... ma
Trvi-Npna Tcr-nea "' '
H synoNal sTNi-RII synovlal
......
TNi-afPha mac IFN-gamma 149fI3
synthesis IL-10 ~ .. synthesis
ynovlal s~~IJ ~ synthesis yvoWJ ~
IL-4/13 H IL-17 IL-4(13
H sYn0Vld1 ~
cM-aF
sYnoNal'~ H ..~~,rnrlmalc synovlarms H ~ Thl«II
iovldl IL-10 IIgaBanlneex
~17 IFN-gam IlgaOOnInGez
~H~ Ynvvlal' Tnltrll.
61418~ Ilgatlonlnrlex
H 3ynaNJ '
erma IFN-gamma serol
(promotors) !L-1 (inhibitors) iL-IZ ryPwIJ -
IL-4113
InhIbIOOn
H zynPNN '
H sYnovial '
tY~ovtal ' '~i-Jnna _
H synavlal ~ IFN-gamma y°'I~=~rol IL~12 s ~ ~ J ~ H IL-6
TNF-Npha Inhlbi0on f syPthesis
H synoNa! ' ~ ...
' IL-17 mac yn.nesl
synovial '
_ sYnovlal ' n H IL-IRn s IL-IR
sypoNal synoNal ' H Tci beta IL-10 synthesis Inhibition
GM~C6F TGF-beta Thl cell
~~ "-/
Ilgatlon InGe%
ILaI
synoNal ' SyPthnsis synoNal H synovlal '
IL-2 IL-419 IL-17
arcernw< , Tnl «g .
gsaaoPlPerz
H sVnovIJ ' sVDOVIaI ' H IL-I
IL-17 IL-10 ac nstuol
,...... r Tnl cell . ....... ( IL-13 IL-10
synoNal
TNF-alPhn
CA 02447920 2003-11-19
WO 02/097706 PCT/US02/16770
A-24
(promotors) Other Mediators (inhibitors) J
~ Synovial Macrophages
H sVnovIN ~ t IISAID
TNF-alpha ff<ctogma
tlfeNVe
i Regulation of Protein Synthesis ry~nyl~
IL-1 I
- ReDUIatts MacrophapnRegulei7dnafHDainSyrltlpeslsWervievs' POE2
D Decreases mac
mhieltioo
H Hellw H IL-17 PCE2
I Intretses rynthesis
synpvlal -
L Ltads IL-4/13 > 1w
M Moves '
P rrpeDas (promotors) Chemokines (inhibitors) (promotors) Proteinases
(inhibitors) H T'a°Iw-bp~
CheDDesSptt
2egulatlonol ofap ptotie IL 10 ~~ H
Mac Prattin effective syn sterol a9 cytos synovlal
I
SynNesis(I) ryL_ial I hb~in ~MC~erll cells
Inhiblti4n
gepmationor rnl«g. mac . am.sprgl
MacPrapin ryhoviM ~ mac syn IN ~ Ilpntionindex MMP-I CM-CSF
SynNesis(2) H IL-10 MCP-i IL~4/19 4nNesis rynpviti ~ H Inhibhlon
syntheslz '~---~ TCP-bep
rynovlal ~ 3ynovlal
H TNP-alpha IL-4f19
~// ;
I ...... CM_CSF
MIP-Italpha H rynovlal ~ MHP-3 ~ MHP-3I effeNVe rynthesls sm~N
- IL-I7
inhibition synthesis Inhibition synovlai IL ID H ~;~
....... IL-I J
rynovial ~ H ryn vlal H
IPN-gamma 7GF~beta
~~I~ n.sttrpl
.. H IL-70 ~T1MP-7
effective mac mac Inhlbltian
rynovlJ NIP-1 alpha IL-4113 ~ TIMP~I H s ovial
IL-1 synthesis ....... synthesis Vp
H rynavial ~ sVnovial ~ H TGF~b
IL-17 IL-0 H sPGE2a~ p o
TGF-b h
rynoNal ~ H
IL-10 I hlbitl n
synovlal
TGF-bep
H synavial ryn.sterol
~
PDGF
IL-2 mac Inhibltiah
PDCF
rynNesis
~
H synpvlal synoviM
~ H
:::g
TCF-bep IPN-gamma
ttro7
IPN IPN
gamma g mn
rynthesisInhIbItioD
.
61
CA 02447920 2003-11-19
WO 02/097706 PCT/US02/16770
A-25
Synovial Macrophages
Recruitment
~~YteRecruitrr~ertOVrrvtevr
_ atponrrr
o arararer
c gars
H HarlW
I 4rrreares
i ~raa
M Iloves
P WoOUrrs
S CAmprs5latt
62
CA 02447920 2003-11-19
WO 02/097706 PCT/US02/16770
A-26
Synovial Fibroblasts
Life Cycle
NrDUlares TLSLIRCycIeOV<rJirw.,
D Oetirssrs
G llonf
H HaH:LlR
1 Inrrrates
L LraUs
M hover
P FroCUtes
s cn>narssrarc
63
CA 02447920 2003-11-19
WO 02/097706 PCT/US02/16770
A-27
Synovial Fibroblasts
Protein Synth esis
Fe9ularcs ~ SyrnovialFLSProte7DSynthesnzWerhar
D Oetrcarrs
F flats
H Nalf tile
I Inareuer
L LeaAr
M Mover
P ProCUCer
ChanDerStat
Regulation of
FISPW rein
Synthesis (1)
Regulation of
FLS Roteln
synmesH (~
Regulation of
FLS Frozeln
Synthesis (3)
Inc.
64
CA 02447920 2003-11-19
WO 02/097706 PCT/US02/16770
A-28
Synovial Fibrobiasts
Regulation of Protein Synthesis
- Regulates Promoters Inhibitors
o aerreares ~FLSftepuladonafPtouinSyndfesisOvesvieiv
F l7ons
H Half L'le
I lnneues
L Leadr «fecWe ryn.sterol
M Mpves rynwi« ~ IL-Ilta
P YYadures IL-1 \InhIbMpn
s cbangtasratt promoters Inhibitors Promoters Inhibitors
H synpvl« ~ synoN«
Synth s'sn TNF-alpha TGF-beta H
«fectrve ..... ......
Re9vlatlPnpf rynovi« synpvl« ~ F~ synpv(«
FISProteln IL-I H PDGF IL-IRa FGF-2 H Vn.sterpl
6ynthesis(ny FLS syn.sterpl synthesis TGF-bm
Inhlbroon
IL-1 IL-1
Regulatipnpf Thicell synthesis Inhlbidpn synavl« ~ .Vnovi«M
iLSHpteln Ilgadon)ndex H IFN-gamma fleccon
Synthesis( PerFLS FISIL-IRa
FLS
H rynpW« ~ Tci-beu
rynwlel ' TGF-beta
rynthesls
IL-9119
sVn.sterpl
tffecdve sTNF-PI
synoNal H rynwl ~ InhIDidpn
IL-1 ppcF
",
H synpvlPl
TNF-alpha effective
FLS
zVnoViel sTNF-PI
synPVial ~ H
beta
T6F
~ sYn.sterol
:
IL 1 rynthtsls
SynpNN IL-6
IL-17 Inhlbltlpnrynwi
IL-4119
FLS ~ ynovIeIM
synpNal
~
IL-6 effectpn
PGE2
ryntheslsFLSlL-6
VoW sYn.sterpl
s
IL H s7NF-RII
4119 IL-10 ~
, synwlal
Inhlbidpn
mac H
Ilgadpnindex TNF-nlphn
per FLS
elfettive FIS
l H
l
h9adp sYnPVlal sTNF-RII
nin TGiabeu
dex
IL-1 rynthesis
per FLS
synoN
IL-4/13
CA 02447920 2003-11-19
WO 02/097706 PCT/US02/16770
A-29
Synovial
Fibroblasts
Regulation
of
Protein
Synthesis
- FtSProhlrlSynthes/sOVervieW.
Fegufarcs
0
Otrteases
F
lloos
H
Nalf
)~
I
fnneaser
L
Gtaer
M
,slaves
P
Produces
Promoters Inhibitors Promoters Inhibitors
cnaaytrsrart
FL9
hbmin
SynNesit
Regulation effecUVe
of n.sterol
yn.s4ro1
sLShoctln synaVlal MCRI
H IL-1
FGE2
~
9ynMeslS Inhibltlan
(I)
~a,dy
'
Inhibition
rycovlal
lNF.eIPha N
IL-10 synoHal
H
Regulatlonal
.
'..
'
hpylH If N-gamma
M
FL9
Hot<In
9ymhesisf9) .....
eHecWC
effactbn
rynbvlal F ~
F~ ~
.
Ft5
PGE2
IL-1
'~
~~ H sYnbvlal MCP-1
TN\ /
synNesls rynthesls
~AIp ~/
~
rynovidl
P~GF
ffett
on
fI1
c
PGE2
synovial
~
H N IL-4
ml
u9
.
syhovlI
Ilgauoniodea
er synovial
FLS
IL
4119
IL-2
synavlal
synovlal
1NC-aloha IFN-gamma
'
ettecWe
synoviI
IL-1
~ synoNM
IL-B
~ tYmhasltIL-10
synovlal
PCE2
synovlal~
Thi cell IL-An9
. //
fnnvtlnhtN7~RR~
66
CA 02447920 2003-11-19
WO 02/097706 PCT/US02/16770
A-30
Synovial
Fibroblasts
Regulation
of
Protein
Synthesis
FISproalnSYnc,esiauvervlew
-
Repulercr
D
peatases
F
llows
H
Ham-G!!e
1
Increases
1.
Gtae
M
MovesPromoters Inhibitors
P
~De~rar
GanDerSrcrc
FLSProttln
SYnthesls
sterol
n
'
.
MMP-1 PromotersInh(bitors
RtgbIaUDnof
Inhlbldon
Protein
SVnNesls(I) rynovlal ~
H H
sYnovlal PGR
~
1Ni-alpha
1'..
Regblat)on .'
of v
Proem ry
ercttWe
SYnthesls(2) novlal
sYnovlal
F~
IL.t IL.9G13 H synovlal
MMP-t
rynMesls IL-6
'..
,
synOVlal rynovlal ~
~ H
H IPN;gamma .
IL-17 rynovlal
H
0, Stool
TGC-beta
TIMP-1
..~
~1 InhIbItlan
cell rynoylal
IIgatIOnInCex H tAectNe
TGF-beta
erFLi rynovlal
IL-I
H synavial F~
~ sY~oJJ H
FGi.2 TIMP-1
rynthesls
yn.srcrol
MMP-3 rynovlal
lnhIbR IOn IL-9113
rynovlal
H
synovlJ synovlal ~ IL-I7
~
H H
TNF-alpha PGE2
i~
...... .......
MMP3 synoNal
ertectlve Ny H
synthesis IL-10
synovlal ryno
a-I rL-<fls
Inc.
67
CA 02447920 2003-11-19
WO 02/097706 PCT/US02/16770
A-31
T Cells
Life Cycle
-rrty~rrcr 'rTcenurecvdtovenedul
D OrW euet
F !larvs
H Halllllt
1 /nrrear<r
L CeaOs
M Naves
P FroJUres
Changts5mm
TCR
snmmanaA
rcm
Aahmnon
68
CA 02447920 2003-11-19
WO 02/097706 PCT/US02/16770
A-32
T Cells
Protein Synthesis
gtggnhs PTCCI~Wua~nSYtnheslfWtrrA
D Dtrrrasrs
~ !lons
H Hall Lre
I muratrr
~ trae
M Aloves IraNOh
R fi-aCurrs Th1-Ilke
Chagg<sSrare cells
Rtguladon of
7Cell Rottln
SynNetls
namoc
Th2-Ilk
Tri-like
69
CA 02447920 2003-11-19
WO 02/097706 PCT/US02/16770
A-33
T
Cells
Regulation
of
Protein
Synthesis
Promotors Inhibitors
ReDWarer
~
D TC<112egdladonp(%oitlO,SynsheslsOVert~ew
Oerveuer
F
tfowr
H
HalfGrYe
I
t
nrveases
L P
GeaCsI ; N
h l1 mrml
b
M romotors yv :oa
mprrri w a
itors m;
n
p
gpeur YmheslaI nlbidoD
s
cnawDarsnn
T
cm
prpm
zm.
sterol
a-9
synmesls
Inhlbhlpn
Tcell
ryn~V
'
H
IL-2 Tcellyn.nerol
IL-10
smMesls TNS-alphaTNF-alpha
smthesisinhibldon
Tcell
.
m.sterpl
IL-4 T sy0.sierol
IL-4 cell -
smdaesls tM-CSFtM-C9F
Inhibhipn
smNesisInhibldpn
rcm
.
rm.sxral
146
IL-6
smthesls
Inhibhion , T
1I
H mN~ TtF-beta
TCF:bew sVnthtsis
sVn.steroi
TtF-beta
appp.T<eInhibldpn
Tcell TtF-beta
.
m.
sterol
IL-a synNesls
IL-D
synthesis
Inhibhlon
H
synbvlal
IL-4
rceN
m.sarpl N synpvlal TcellY2steroi
1410 ~
IL-10
TNF-alpha sTNF-PJsTNF-iil
r
symhesis
omodan
~
~
~
H synthesisIhhlbltlon
smovlal .......
IL-2
Tceii
m.sterpl
IL-19
IL-19 ~
synthesis synpvial
Inhlbhlpn H
TNF-alpha
H SVnpvlal TII
_ ..... .
_
IL sTNF-Rlll
4
T ; synthesisyn.sterp
cell 1l
m
rol
IL17 TNF-ft
Inhiblban
Is j.
inhlbttlo0
CA 02447920 2003-11-19
WO 02/097706 PCT/US02/16770
A-34
T Cells
TCR stimulation
. ReyWarcs TCftSdmulailaDOUervItW
D Drrrtarrr
P flows
H NallLN
I lnaearrr
L Ltadt
M Alavts
P FroJUter
CAanyes5nrc
TG
urt c
ra
Actlva
copyngnt!'r coot toreros. me
71
CA 02447920 2003-11-19
WO 02/097706 PCT/US02/16770
A-35
15
25
T Cells
Activation
Reqularcs P
D Otrrcases
L !lorvs
H HaH LIe
1 Nettuts
L GtaCs
M Noves
P Produces
S Cbarfyts5hrc
TCell
Llfe Cycle
TCR
snmmanoo
72