Note: Descriptions are shown in the official language in which they were submitted.
CA 02508590 2005-06-03
WO 2004/052196 PCT/IL2003/001025
SYSTEM FOR DETERMINING ENDOTHELIAL DEPENDENT
VASOACTIVITY
FIELD AND BACKGROUND OF THE INVENTION
The present invention relates to measuring endothelial dependent vasoactivity
and, more particularly, to a non-invasive method and system for determining
endothelial dependent vasoactivity.
Hemodynamics is a subchapter of cardiovascular physiology, which deals with
the forces the heart has to develop in order to circulate blood throughout the
1o cardiovascular system. To a physician, these forces are manifested as blood
pressure
and blood flow paired values measured simultaneously at different points of
the
cardiovascular system.
The flow of blood through the vasculature has a pulsatile nature. When the
heart contracts, part ofthe blood contained within the left ventricle is
squeezed into the
aorta from which the blood flows into the entire cardiovascular system. Since
blood is
an incompressible fluid, when it is squeezed into the vasculature, which
exhibits a
resistance to blood flow, blood pressure is generated. During ventricular
contraction
the arterial blood pressure increases to its highest, the systolic level. When
the left
ventricle is refilled with oxygenated blood from the lungs during the
relaxation phase
of the cardiac cycle (the diastole), and the ventricle is disconnected from
the
vasculature by the aortic valve, the pressure in the vasculature decreases to
its lowest
level.
The amount of blood which is pumped with each heartbeat, also known as the
stroke volume, normalized by body surface area is known as the Stroke Index
(SI).
The mean value of blood pressure is called the Mean Arterial Pressure (MAP).
The
values of SI and MAP are a result of modulation by several hemodynamic
modulators:
(i) intravascular volume, (ii) inotropy, (iii) Starling effect and (iv)
vasoactivity.
Intravascular volume is the amount of fluid circulating in the vasculature.
This
modulator can be affected, for example, by dehydration, diuresis,
venoconstriction of
3o the spleen, volume overload due to heart or kidney failure and the like.
Inotropy is the ability of the cardiac muscle to contract. Myocytes are the
only
muscle cells which are able to vary the strength of contraction. Inotropy can
be
affected by exercise, stress and pharmaceutical agents, which increase the
strength of
CA 02508590 2005-06-03
WO 2004/052196 PCT/IL2003/001025
2
myocardial contractions, or by cardiac diseases such as heart failure, which
is
expressed by decrease of the strength of contractions. The myocardial
contractility is
controlled by positive and negative inotropes which instantaneously affect the
level of
inotropic state. Changes in inotropy alter the rate of force and pressure
development
by the ventricle.
The heart has the intrinsic capability of increasing its force of contraction
when
preload is increased. The preload is related to the sarcomere length via the
well
known Starling law.
Vasoactivity referrers to the ability of blood vessels to expand and contract.
l0 Through vasoactivity the body controls the flow of blood through individual
organs,
accommodate the variation in blood flow and regulate arterial pressure.
The endothelium-dependent relaxation of blood vessels is due to the release of
potent non-proslanoid vasodilator substances by the endothelium (the inner
most
cellular layer of the blood vessel) surrounding the blood vessel. The
endothelium-
derived relaxing factor is believed to be nitric oxide (NO), which is released
by
different stimuli substances produced during platelet aggregation. The
endothelial
action of thrombin and platelet products is crucial for the protective role
played by the
normal endothelium against unwanted coagulation. Therefore, local platelet
aggregation, with the associated release of serotonin arid ADP, together with
the
production of thrombin, leads to a major local release of NO. The NO diffuses
towards the underlying vascular smooth muscle, induces its relaxation and thus
contributes to the dilatation of the artery. The release of NO to the blood
vessel also
inhibits platelet adhesion at the endothelium blood interface, exerts a major
feedback
on platelet aggregation, thereby eliminates the imminent danger of vascular
occlusion.
In addition, the endothelial barrier prevents the platelet derived
vasoconstrictor
substances from reaching the smooth muscle. NO can also be released by other
stimuli like flow mediated vasoactivity and increased sympathetic activity
(alpha
receptor stimulation).
It is recognized that dysfunction of endothelial dependent vasoactivity, also
known as endothelial dysfunction, is an early event in the pathogenesis of
cardiovascular disease. Endothelial dysfunction and coronary artery disease
are also
linked to over-weight, obesity, hypertension, hypercholesterolemia,
hyperlipidemia,
diabetes mellitus, cigarette smoking and homocysteine. In addition, the
vascular
CA 02508590 2005-06-03
WO 2004/052196 PCT/IL2003/001025
3
endothelium plays a fundamental role in several processes related to
thrombosis.
Impaired endothelium function may also promote the development of
atherosclerosis
through its effects on vaso-regulation, platelet and monocyte adhesion.
Several studies have demonstrated that elevated concentration of total
cholesterol and low density lipoprotein cholesterol are associated with
impaired
endothelial function, independent of the presence of coronary heart disease
[Robert A.
Vogel, "Coronary risk factors, Endothelial function, and atherosclerosis: A
review,"
Clin. Cardiol 1997, 20:426-432; Robert A. Vogel et al., "Changes in flow-
mediated
brachial artery vasoactivity with lowering of desirable cholesterol levels in
healthy
to middle aged men," The American journal of cardiology 1996, 77; I~ensuke
Egashira et
al., "Reduction in serum cholesterol with pravastatin improves endothelium
dependent
coronary vasomotion in patients with hypercholesterolemia," Circulation 1994,
89 No
6]. In addition, decreased concentrations of high-density lipoprotein
cholesterol and
an elevated ratio of total to high-density lipoprotein cholesterol have also
been
associated with endothelial dysfunction.
Cigarette smoking profoundly impairs endothelial function [Robert W. stadler
et al., "Measurment of the time course of peripheral vasoactivity: results in
cigarette
smokers," Atherosclerosis 1998 138:197-205; David S. Celermajer et al.,
"Cigarette
smoking is associated with dose-related and potentially reversible impairment
of
endothelium-dependent dilation in healthy young adults," Circulation 1993, 88,
No 5
part 1 ]. Endothelial function is reduced in both active and passive smokers
in a dose
dependent manner. Smoking cessation is associated with improvement in
endothelial
function.
Endothelial dysfunction increases in men over the age of about 40 and in
women after the age of about 55, whether or not other coronary risk factors
are
present. The specific cause of the decrease in endothelial function with age
is yet
unknown. Estrogen appears to be a major factor associated with gender
differences in
age-related endothelial function.
Other factors which affect endothelial function include hypertension
[Perticone
F, et al., "Prognostic significance of endothelial dysfunction in hypertensive
patients,"
Circulation 2001, 104:191-196], diabetes [Cosentino F et al., "Endothelial
dysfunction
in diabetes mellitus," J Cardiovasc Pharmacol, 1998, 32:54-61; Cosentino F et
al.,
"High glucose causes upregulation of Cyclooxygenase-2 and alters prostanoid
profile
CA 02508590 2005-06-03
WO 2004/052196 PCT/IL2003/001025
4
in human endothelial cells. Role of protein kinase C and reactive oxygen
species,"
Circulation 2003, 107:1017-1023], diet and physical exercise [Brendle D et
al.,
"Effects of exercise rehabilitation on endothelial reactivity in older
patients with
peripheral arterial disease," Am J Cardiol 2001, 87:324-329].
The full range of different diseases associated with endothelial dysfunction,
the
nature of endothelial abnormalities and the effects of potential treatments on
vasoactivity are yet to be determined. Nevertheless, the measurement of
arterial
endothelium function is of utmost importance for the purpose of diagnosing
endothelial dysfunction related diseases at early stage, for example for
diagnostic
to assessment of atherosclerothic disease in the pre-stenotic stages
[Vanhoutte. P.M.,
"Endothelial dysfunction and atherosclerosis," Eur Heart J, 1997:18 (sup E)
E19-E29;
Robert A. Vogel, 1997 ibid; Mary C. Corretti et al., "Guidelines for the
ultrasound
assessment of endothelial-dependent flow-mediated vasodilatation of the
brachial
Artery," JACC 2002, 39:257-65; Widlansky ME, Gokee N, Keaney JF Jr, Vita JA,
J,
"The clinical implications of endothelial dysfunction," J Am Coll Cardiol
2003,
42:1149-60].
Normal release of NO prevents and/or attenuates arteriosclerosis as well as
other major factors such as thrombosis [Robinson Joannides et al., "Nitric
oxide is
responsible for flow-dependent dilatation of human peripheral conduit arteries
in
2o vivo," Circ. 1995, 91:1311-12; Ian B. Wilkson et al., "Nitric oxide
regulates local
arterial distensibility in-vivo," Circ. 2002, 105:213-217].
Many studies have demonstrated that endothelial dysfunction in coronary
arteries is concomitant with impaired endothelial brachial, radial and the
carotid
dysfunction [Corretti et al., 2002 ibid; Tod J. Anderson et al., "Close
relation of
endothelial function in the human coronary and peripheral circulations," JACC
1995,
26:1235-41; David S. Celermajer et al., "Endothelium-dependent dilation in the
systemic arteries of asymptomatic subjects relates to coronary risk factors
and their
interaction," JACC 1994, 24:1468-74; Sorensen ICE et al., "Atherosclerosis in
the
human brachial artery," JACC 1997, 29:318-22]. In addition, it was found that
coronary artery disease is related to atherosclerothic disease in the aorta
and the
carotid artery [Khoury Z et al., "Relation of coronary artery disease to
atherosclerothic
disease in the aorta, carotid, and femoral arteries evaluated by ultrasound,"
Am J
Cardiol 1997, 80:1429-1433].
CA 02508590 2005-06-03
WO 2004/052196 PCT/IL2003/001025
Assessment of endothelium dependent vasoreactivity (EDV) in coronary
arteries may be performed by measurements of changes in peripheral arterial
diameter
due to pharmacological or mechanical stimuli.
One method for measuring the inner diameter of a blood vessel is by an
5 intravascular ultrasound device having an intravascular catheter and an
ultrasound
transducer array mounted thereon. The intravascular catheter is inserted
directly into
the artery of interest to thereby determine its inner diameter.
Such a device is highly invasive, expensive and requires costly additional
technical expertise to operate.
l0 Another known device for measuring the intravascular diameter of a blood
vessel has an elongated flexible sheath and a catheter which is longer than
the sheath.
The sheath has an outer diameter which is less than the intravascular
diameter. The
catheter proximal end extends outwardly from the proximal end of the sheath
and
includes a measuring scale directly proportional to a position of a sensor
extending
from the catheter. When the sheath is inserted into the blood vessel and the
catheter is
moved inwardly relative to the sheath, the intravascular diameter can be read
directly
from the measuring scale.
This device, however, although simple and not expensive, is still highly
invasive and lacks the necessary accuracy for the purpose of determining
vasoactivity.
2o Also known in the art are non-invasive methods for the measurement of
arterial
diameter by high resolution non-invasive ultra-sound systems. In one such
method the
physician operates an ultrasound transducer to obtain appropriate ultrasound
images of
the brachial artery for measuring artery diameter thereof. This method,
however, is
time consuming, and requires a highly trained physician or technician to hold
the
transducer stably during the measurement.
In another such method, an automatic measurement system having a robot am ..
manipulating ultrasound imaging probe is used. The system automatically
navigates
the ultrasound imaging probe to an appropriate position and measure changes in
diameter of brachial artery with improved reproducibility compared with manual
measurement.
This procedure, however, is very costly, requiring highly practiced personnel
and equipment, and thereby lacks the ability to become a standard clinical
procedure
in the assessment of endothelial dysfunction in large high-risk populations.
CA 02508590 2005-06-03
WO 2004/052196 PCT/IL2003/001025
6
The autonomic nervous system (ANS) plays a cardinal role in the control of
cardiovascular function. Heart rate, heart excitability and contractility are
under the
constant influence of the parasympathetic-sympathetic balance. Parasympathetic
nerves and sympathetic fibers innervate the sino-atrial node; the
parasympathetic
influence is inhibitory while the sympathetic influence is excitatory. The
parasympathetic fibers to the SA node are driven by inhibitory and excitatory
inputs
from peripheral receptors (baroreceptors, chemoreceptors, cardiac, pulmonary
and
airway receptors). Behavioral adaptive influence of the heart rate at the
sinus node is
mediated by supramedullary inputs to the cardiovagal neurons. The origin of
the
1o sympathetic innervation of the heart is located at the T2-TS segment of the
spinal cord
and the preganglioni~~fibei-s synapse in the cervical ganglia.
Normal cardiac function is regulated by the complex balance of the
sympathetic and parasympathetic outflows to the heart. This balance is also
responsible for the susceptibility to arrhythmias: while vagal activity has a
protective
role, sympathetic activity lowers the threshold to ventricular fibrillation.
Normal heart
function, heart rate included, is modulated by the fluctuations in the
sympathetic and
parasympathetic flow to the heart. These fluctuations induce beat-to-beat
variability in
heart rate and arterial pressure. Hence, the analysis of the instantaneous
fluctuations in
cardiovascular variables supplies valuable information on the autonomic
control in an
2o intact organism.
Over the past two decades, analysis of electrocardiogram (ECG) signals in
general and Heart-Rate-Variability (HRV) in particular, have been used to
quantify the
behavior of the ANS [Malik et al., "Guidelines. Heart rate Variability," Eur
Heart J
1996, 17:354-381]. It was found that about 5 minutes recording of HRV are
sufficient
for detecting possible existence of coronary artery disease [Parati et al.,
"Spectral
analysis of blood pressure and heart rate variability in evaluating
cardiovascular
regulation. A critical appraisal," Hypertension 1995, 25(6):1276-86; Hayano J
et al.,
"Decreased magnitude of heart rate spectral components in coronary artery
disease and
its relation to angiographic severity," Circulation 1990, 81 (4):1217-24].
There is thus a widely recognized need for, and it would be highly
advantageous to have, a simple, cost effective, non-invasive method and system
for
determining endothelial abnormal function.
CA 02508590 2005-06-03
WO 2004/052196 PCT/IL2003/001025
7
SUMMARY OF THE INVENTION
According to one aspect of the present invention there is provided a method of
determining endothelial dependent vasoactivity of a subject, the method
comprising:
recording pressure-related signals of a plurality of locations adjacent to at
least one
s blood vessel; extracting at least one parameter from the pressure-related
signals; and
using the at least one parameter to determine a change of at least one
characteristic of
the at least one blood vessel, the change being representative of endothelial
functioning; thereby determining the endothelial dependent vasoactivity of the
subject.
According to further features in preferred embodiments of the invention
described below, the method further comprising determining an autonomic
nervous
system activity of the subject.
According to still further features in the described preferred embodiments the
determining of the autonomic nervous system activity is by heart rate
variability
analysis of the pressure-related signals.
According to still further features in the described preferred embodiments the
determining of the autonomic nervous system activity comprises recording
electrocardiogram signals of a chest of the subject and performing heart rate
variability
analysis of the electrocardiogram signals, thereby determining the autonomic
nervous
system activity.
According to still further features in the described preferred embodiments the
method further comprises determining a pre-ejection period and valve-artery
period.
According to still further features in the described preferred embodiments the
valve of the valve-artery period is an aortic valve and the artery of the
valve-artery
period is a carotid artery.
According to still further features in the described preferred embodiments the
determination of the pre-ejection period and the valve-artery period,
comprises
determining an elapsed time between peaks of the electrocardiogram signals and
peaks
of the pressure-related signals.
According to still further features in the described preferred embodiments the
peaks of the electrocardiogram signals comprise QRS peaks.
According to still further features in the described preferred embodiments the
method further comprising stimulating the at least one blood vessel.
According to still further features in the described preferred embodiments the
CA 02508590 2005-06-03
WO 2004/052196 PCT/IL2003/001025
8
stimulating of the at least one blood vessel is effected by a procedure
selected from the
group consisting of a mechanical stimulation, a thermal stimulation a chemical
stimulation, an electrical stimulation a mental stress stimulation and a
physical
exercise stimulation.
According to still further features in the described preferred embodiments the
stimulating of the at least one blood vessel is by applying external pressure
on the at
least one blood vessel.
According to still further features in the described preferred embodiments the
stimulating of the at least one blood vessel is by reducing a temperature of
the at least
to one blood vessel.
According to still further features in the described preferred embodiments the
method further comprising correlating the endothelial functioning and the
autonomic
nervous system activity, so as to obtain a correlation function, and using the
correlation function to at least preliminarily determine the endothelial
dependent
vasoactivity of the subject.
According to still further features in the described preferred embodiments the
recording of the pressure-related signals is by piezoelectric ceramic
elements.
According to still further features in the described preferred embodiments the
recording of the pressure-related signals is by a membrane-based sensor.
According to still further features in the described preferred embodiments an
electrate microphonethe membrane-based sensor is an electrate microphone.
According to still further features in the described preferred embodiments the
extracting of the at least one parameter comprises: (a) scanning pressure-
related
signals recorded of a first location and detecting a first peak; (b) scanning
pressure-
related signals recorded of a second location and detecting a second peak
corresponding to the first peak; (c) measuring an elapsed time between the
first peak
and the second peak; and (d) repeating the steps (a)-(c) at least once.
According to another aspect of the present invention there is provided a
system
for deterrnining endothelial dependent vasoactivity of a subject, the system
3o comprising: an arrangement of sensors for recording pressure-related
signals of a
plurality of locations adjacent to at least one blood vessel; a processing
unit operable
to receive, record and .process the pressure-related signals; the processing
unit being
designed and programmed to extract at least one parameter from the pressure-
related
CA 02508590 2005-06-03
WO 2004/052196 PCT/IL2003/001025
9
signals, and to use the at least one parameter to determine a change of at
least one
characteristic of the at least one blood vessel, the change being
representative of
endothelial functioning.
According to further features in preferred .embodiments of the invention
described below, the system further comprising electronic-calculation
functionality for
determining an autonomic nervous system activity of the subject.
According to still further features in the described preferred embodiments the
processing unit is operable to calculate heart rate variability from the
pressure-related
signals thereby to determine the autonomic nervous system activity.
1o According to still further features in the described preferred embodiments
the
system further comprising at least one electrocardiogram lead designed
connectable to
a chest of the subject.
According to still further features in the described preferred embodiments the
processing unit is operable to calculate heart rate variability from
electrocardiogram
signals sensed by the at least one electrocardiogram lead, thereby to
determine the
autonomic nervous system activity.
According to still further features in the described preferred embodiments the
system further comprising a spectral analyzer for analyzing the at least one
parameter
and obtaining a frequency decomposition of the at least one parameter, the
frequency
2o decomposition being representative of the endothelial dependent
vasoactivity of the
subj ect.
According to still further features in the described preferred embodiments the
system further comprising a mechanism for stimulating the at least one blood
vessel.
According to still further features in the described preferred embodiments the
mechanism for stimulating the at least one blood vessel is selected from the
group
consisting of a mechanical mechanism, a thermal mechanism, an electrical
mechanism
and a mechanism for generating mental stress.
According to still further features in the described preferred embodiments the
mechanism is operable to apply external pressure on the at least one blood
vessel.
3o According to still further features in the described preferred embodiments
the
mechanism comprises a sphingomanometer.
According to still further features in the described preferred embodiments the
mechanism is operable to reduce a temperature of the at least one blood
vessel.
CA 02508590 2005-06-03
WO 2004/052196 PCT/IL2003/001025
According to still further features in the described preferred embodiments the
mechanism is a bath or a cuff of fluid, the fluid being at a predetermined
temperature.
According to still further features in the described preferred embodiments the
sensors are piezoelectric ceramic elements.
5 According to still further features in the described preferred embodiments
the
sensors membrane-based are sensors.
According to still further features in the described preferred embodiments the
sensors are electrate microphones.
According to still further features in the described preferred embodiments the
1 o method further comprising obtaining a frequency decomposition of the at
least one
parameter, and using the frequency decomposition for determining the
endothelial
dependent vasoactivity of the subject.
According to still further features in the described preferred embodiments the
at least one parameter is selected from the group consisting of an amplitude
of the
pressure-related signals, a width of the pressure-related signals and an
elapsed time
between two peaks of the pressure-related signals.
According to still further features in the described preferred embodiments the
method further comprising obtaining a frequency decomposition of the
amplitude, and
using the frequency decomposition for determining the endothelial dependent
vasoactivity of the subject.
According to still further features in the described preferred embodiments the
method further comprising obtaining a frequency decomposition of the width,
and
using the frequency decomposition for determining the endothelial dependent
vasoactivity of the subject.
2s According to still further features in the described preferred embodiments
the
method further comprising obtaining a frequency decomposition of the elapsed
time,
and using the frequency decomposition for determining the endothelial
dependent
vasoactivity of the subject.
According to still further features in the described preferred embodiments the
at least one characteristic of the at least one blood vessel is selected from
the group
consisting of a radius of the at least one blood vessel and an elastic modulus
of the at
least one blood vessel.
According to yet another aspect of the present invention there is provided a
CA 02508590 2005-06-03
WO 2004/052196 PCT/IL2003/001025
11
method of determining endothelial dependent vasoactivity of a subject, the
method
comprising: (a) applying a first stimulus to at least one blood vessel; (b)
measuring a
pulse wave velocity in the at least one blood vessel; (c) determining an
autonomic
nervous system activity of the subject; (d) correlating the pulse wave
velocity and the
autonomic nervous system activity, so as to obtain a correlation function
having an
index; and (e) if the index has a predetermined value then: (i) applying a
second
stimulus on the at least one blood vessel; and (ii) repeating steps (b)-(c);
thereby
determining the endothelial dependent vasoactivity of the subject.
According to further features in preferred embodiments of the invention
i o described below, step (e) further comprises applying the second stimulus
on at least
one additional blood vessel and repeating the steps (b)-(c) for the at least
one
additional blood vessel.
According to still further features in the described preferred embodiments the
first and the second stimuli are each independently selected from the group
consisting
group consisting of a mechanical stimulus, a thermal stimulus, a chemical
stimulus, an
electrical stimulus, a mental stress stimulus and a physical exercise
stimulus.
According to still further features in the described preferred embodiments the
stimulus comprises external pressure.
According to still further features in the described preferred embodiments the
2o stimulus comprises temperature reduction.
According to still further features in the described preferred embodiments the
measuring a pulse wave velocity is by recording pressure-related signals using
piezoelectric ceramic elements.
According to still further features in the described preferred embodiments the
?5 wherein the measuring a pulse wave velocity is by recording pressure-
related signals
using a membrane-based sensor.
According to still further features in the described preferred embodiments the
at least one blood vessel is selected from the group consisting of a brachial
artery, a
radial artery and a carotid artery.
The present invention successfully addresses the shortcomings of the presently
known configurations by providing a method and system for assessing
endothelial
dependent vasoactivity enjoying properties far exceeding prior art
technologies.
CA 02508590 2005-06-03
WO 2004/052196 PCT/IL2003/001025
12
Unless otherwise defined, all technical and scientific terms used herein have
the same meaning as commonly understood by one of ordinary skill in the art to
which
this invention belongs. Although methods and materials similar or equivalent
to those
described herein can be used in the practice or testing of the present
invention, suitable
methods and materials are described below. In case of conflict, the patent
specification, including definitions, will control. In addition, the
materials, methods,
and examples are illustrative only and not intended to be limiting.
Implementation of the method and system of the present invention involves
performing or completing selected tasks or steps manually, automatically, or a
i o combination thereof. Moreover, according to actual instrumentation and
equipment of
preferred embodiment' of the method and system of the present invention,
several
selected steps could be implemented by hardware or by software on any
operating
system of any firmware or a combination thereof. For example, as hardware,
selected
steps of the invention could be implemented as a chip or a circuit. As
software,
selected steps of the invention could be implemented as a plurality of
software
instructions being executed by a computer using any suitable operating system.
In any
case, selected steps of the method and system of the invention could be
described as
being performed by a data processor, such as a computing platform for
executing a
plurality of instructions.
BRIEF DESCRIPTION OF THE DRAWINGS
The invention is herein described, by way of example only, with reference to
the accompanying drawings. With specific reference now to the drawings in
detail, it
is stressed that the particulars shown are by way of example and for purposes
of
illustrative discussion of the preferred embodiments of the present invention
only, and
are presented in the cause of providing what is believed to be the most useful
and
readily understood description of the principles and conceptual aspects of the
invention. In this regard, no attempt is made to show structural details of
the invention
in more detail than is necessary for a fundamental understanding of the
invention, the
3o description taken with the drawings making apparent to those skilled in the
art how the
several forms of the invention may be embodied in practice.
In the drawings:
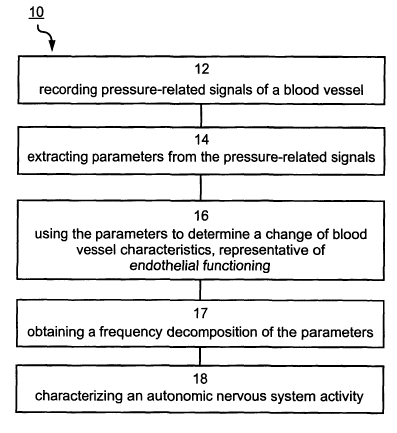
FIG. 1 is a flowchart diagram of a non-invasive method of determining
CA 02508590 2005-06-03
WO 2004/052196 PCT/IL2003/001025
13
endothelial dependent vasoactivity, according to a preferred embodiment of the
present invention;
FIG. 2 shows theoretical estimations of relative changes in the elapsed time
between two peaks of pressure-related signals, as a function of changes in
arterial
radius, assuming an approximately constant Young modulus;
FIG. 3 is a flowchart diagram of another method of determining endothelial
dependent vasoactivity of a subject, according to a preferred embodiment of
the
present invention;
FIG. 4 is a schematic illustration of a system for determining endothelial
to dependent vasoactivity of the subject, according to a preferred embodiment
of the
present invention;
FIG. 5 is a schematic illustration of a transducer for sensing and
transmitting
the pressure-related signals, according to a preferred embodiment of the
present
invention;
FIG. 6 shows a transducer's response to an input signal of about 1 Hz;
FIG. 7 is a flowchart diagram of a data analysis procedure, according to a
preferred embodiment of the present invention;
FIGs. 8a-c are representative graphical outputs of the procedure of Figure 7;
FIGs. 9a-a shows output of a comparative examination, which included a
combined stimuli protocol, according to a preferred embodiment of the present
invention;
FIGS. l0a-c show relative changes in the elapsed time, standard deviation and
heart rate variability, of one subject examined in a thermal stimulus test,
according to a
preferred embodiment of the present invention;
FIGs. 11 a-b show the effect of lying posture on the elapsed time and the
measurement of endothelium dependent vasoreactivity during treatment with
nitroglycerin;
FIGS. 12a-c show the elapsed time (Figure 12a), standard deviation (Figure
12b) and amplitude (Figure 12c) during supine position of a subject, who has
been
3o diagnosed by US measurements as having normal endothelial function;
FIGs. 13a-c show the elapsed time (Figure 13a), standard deviation (Figure
13b) and amplitude (Figure 13c) during sitting position of a subject who has
been
diagnosed by US measurements as having normal endothelial function.
CA 02508590 2005-06-03
WO 2004/052196 PCT/IL2003/001025
14
FIGs. 14a-c show the elapsed time (Figure 15a), standard deviation (Figure
15b) and amplitude (Figure 15c) during sitting position of another subject who
has
been diagnosed by US measurements as having normal endothelial function;
FIGS. 15a-c show the elapsed time (Figure 14a), standard deviation (Figure
14b) and amplitude (Figure 14c) during sitting position of a subject who has
been
diagnosed by US measurements as having abnormal endothelial function;
FIGS. 16a-c show the elapsed time (Figure 16a), standard deviation (Figure
16b) and amplitude (Figure 16c) after a chemical stimulus using nitroglycerin
and
during supine position of a subject who has been diagnosed by US measurements
as
to having normal endothelial function;
FIGS. 17a-h show results of heart rate variability analysis of a subject
having
normal autonomic nervous system activity and endothelial dysfunction (17a,
17c, 17e
and 17g) and a subject having abnormal autonomic nervous system activity and
normal brachial endothelial function (17b, 17d, 17f and 17h); and
FIGs. 18a-c show changes of two elapsed time parameters (Figure 18a), three
amplitude parameters (Figure I8b) and heart rate (Figure 18c), during a cold
pressure
test.
DESCRIPTION OF THE PREFERRED EMBODIMENTS
2o The present invention is of a non-invasive method and system for
determining
endothelial dependent vasoactivity which can be used in early stage diagnosis
of
endothelial dysfunction related diseases. Suecificallv. the present invention
pan hP
used to screen and diagnose large population and to differentiate between
subjects
being in different stages and combinations of endothelial and coronary artery
dysfunction. For example, the present invention can be used to diagnose
pathogenesis
of cardiovascular disease, atherosclerosis and the like.
The principles and operation of a method and system for determining
endothelial dependent vasoactivity of a subject according to the present
invention may
be better understood with reference to the drawings and accompanying
descriptions.
3o Before explaining at least one embodiment of the invention in detail, it is
to be
understood that the invention is not limited in its application to the details
of
construction and the arrangement of the components set forth in the following
description or illustrated in the drawings. The invention is capable of other
CA 02508590 2005-06-03
WO 2004/052196 PCT/IL2003/001025
embodiments or of being practiced or carried out in various ways. Also, it is
to be
understood that the phraseology and terminology employed herein is for the
purpose
of description and should not be regarded as limiting.
A pulsatile flow of fluid through an elastic conduit is accompanied by
elevated
5 friction and normal forces between the conduit and the fluid. Such flow is
characterized by dominant peripheral energy propagation, i.e., along the wall
of the
elastic conduit. The speed of a pressure pulse propagating through the conduit
is
determined by the elastic and geometric properties of the conduit's ,wall as
well as by
the physical properties of the fluid.
to In an artery, the velocity of the pressure pulse generated by ventricular
ejection
can be calculated using Moens-I~orteweg model, according to which the square
of the
pulse wave velocity, c, equals the area of the artery divided by the density
of the blood
and the mechanical compliance of the artery. The mechanical compliance,
defined as
the derivative of the cross-sectional area with respect to the pressure, is,
to a good
i s approximation 2Rl(E h), where, R is the radius of the artery, h is the
thickness of the
artery's wall and E is its Young modulus. The pulse wave velocity is therefore
given
by the following equation, commonly known as the Moens-Korteweg equation:
_ E h (EQ. 1 )
2 R'
P
where ,~ is the density of the blood.
2o The present invention exploits the relation between the pulse wave velocity
and the geometrical and elastic properties of the arterial wall for the
purpose of
determining vasoactivity.
Referring now to the drawings, Figure 1 is a flowchart diagram of a non-
invasive method 10 of delei-mining endothelial dependent vasoactivity of a
subject,
according to one aspect of the present invention.
In a first step of method 10, designated by Block 12, pressure-related signals
are recorded of several locations adjacent to one or more blood vessels. The
pressure-
related signals are typically electrical signals, which are recorded, e.g.,
using
piezoelectric ceramic elements or membrane-based sensors, such as, but not
limited to,
3o electrate microphones. As further detailed and exemplified hereinunder and
in the
Examples section that follows, these pressure-related signals are related to
the pulse
CA 02508590 2005-06-03
WO 2004/052196 PCT/IL2003/001025
16
wave velocity of the blood, hence can be used to characterize the geometrical
and
elastic properties of the arterial wall.
In a second step of method 10, designated by Block 14, at least one parameter
is extracted from the pressure-related signals. Representative examples of
extracted
parameters include, without limitation, amplitude of the signals, width
thereof and/or
elapsed time between peaks of two pressure-related signals.
The amplitude parameter is preferably defined as the height of the signal
above
a predetermined zero-level.
The width parameter is preferably defined as the distance between two points
l0 of equal height or two inflection points on the same signal.
The elapsed time parameter is preferably defined as the elapsed time between
two peaks of signals recorded of two different locations, either two locations
near the
same blood vessels or near different blood vessels. The elapsed time parameter
is
directly related to the pulse wave velocity. More specifically, knowing the
transit
time, t, of the pulse wave between two locations and its traveling distance,
L, one can
calculate the pulse wave velocity, by division (Llt) or differentiation
(dLldt).
Any of the above parameters may be extracted from the signals by any
appropriate method known in the art, such as, but not limited to, correlation
method,
peak detection, mathematical fitting (e.g., polynomial fitting), frequency
2o decomposition (e.g., Fourier transform), data folding and the like.
According to a
preferred embodiment of the present invention the extraction is performed a
plurality
of times, so as to obtain, for each type of parameter, a plurality of values
which may
then be averaged.
In a third step of method 10, designated by Block 16, the parameters) are used
to determine a change of one or more blood vessel characteristics, e.g.,
geometrical or
elastic properties thereof. Such a change characterizes endothelial function
of the
blood vessel.
For example, due to collagen fiber recruitment in the arterial wall which is
increased during the dilatation stage of the artery, the elapsed time
parameter is
3o sensitive to arterial radius changes at the initial stage of arterial
dilatation, and the
amplitude parameter is sensitive to arterial radius changes at relatively
large arterial
dilatation. Thus; a judicious use of the elapsed time parameter and the
amplitude
parameter allows an accurate and reliable measurement of changes in the
arterial
CA 02508590 2005-06-03
WO 2004/052196 PCT/IL2003/001025
radius at a wide range of values.
17
Although radius changes are the favored blood vessel characteristics in the
according to the presently preferred embodiment of the invention, other blood
vessel
characteristics, e.g., elastic modulus are not excluded.
For small radii, the elastic modulus of the blood vessel is, to a good
approximation, a constant quantity. On the other hand, for large radii the
elastic
module becomes radius-dependent [Armentano R.L et al., "Arterial wall
mechanics in
conscious dogs - assessment of viscous, internal, and elastic moduli to
characterize
aortic wall behavior," Circulation Research 1995, 76:468-78], and can be
determined
to using the elapsed time parameter.
Generally, the radius, thickness and elasticity of the blood vessel are
interrelated by the following equation, directly derived from Equation l,
above:
cz Ez hzRo
co = Eo IZORz ~ (EQ. 2)
where the subscripts "0" and "2" represent values at different states (i.e.,
relaxation and
contraction) of the blood vessel. A consequence of Equation 2 is that as the
artery's
radius increase the pulse wave velocity decreases. In terms of elapsed time, a
decrease
in the pulse wave velocity is manifested as an increment of the elapsed time
between
two peaks of the signals.
Figure 2 shows theoretical estimations of the relative changes in the elapsed
2o time as a function of changes in arterial radius, assuming an approximately
constant
Young modulus. The different lines in Figure 2 correspond to different
effective
blood flow distances, L. The calculations were performed using typical initial
radius
and elasticity modulus, taken from the literature.
It will be therefore appreciated that the measurement of the above parameters
is related to the geometrical and elastic properties of the blood vessel,
hence allows the
determination of the endothelial dependent vasoactivity.
NO is known to have a buffering influence on arterial pressure variability. An
acute change of arterial pressure alters shear stress, thus modifying NO
generation and
release. Subsequent vasodilatation or vasoconstriction occurs in response to
the
3o varying NO levels, which in turn readjust vascular resistance to reduce
arterial
pressure variability. NO acts rapidly: it diffuses out of the endothelium to
the
subjacent vascular smooth muscle cells, where it causes vaso-relaxation within
CA 02508590 2005-06-03
WO 2004/052196 PCT/IL2003/001025
18
seconds. Thus, NO can affect the regulation of blood pressure more rapidly
than the
arterial baroreflex. [Persson PB., "Spectral analysis of cardiovascular time
series,"
Am J Physiol, 273:81201-81210, 1997]. For example, it has been found in rats
that
after NO inhibition, the power in the range of above 0.2 Hz increases
significantly,
indicating that NO buffers blood pressure variability at these frequencies
[Nafz B et
al., "Endogenous nitric oxide buffers blood pressure variability between 0.2
and 0.6
Hz in the conscious rat," Am J Physiol 272:H632-H637,1997J.
In addition, in mice, restoration of NO function improved blood pressure and
heart rate variability (Pelat M. et czl., "Rosuvastatin decreases caveolin-1
and improves
l0 nitric oxide-dependent heart rate and blood pressure variability in
apolipoprotein E-/
mice in vivo," Circulation 107:2480-2486,2003).
Hence, the above parameters can be further analyzed for the purpose of
obtaining other observables sensitive to the above physiological mechanism.
Many
analysis procedures are contemplated by the present invention, including,
without
limitation, spectral analysis, modulation analysis and the like.
Referring again to Figure 1, according to a preferred embodiment of the
present invention, the method further comprises an optional step, designated
in Figure
1 by Block 17, in which a frequency decomposition is obtained from one or more
of
the parameters, e.g., by performing spectral analysis. The obtained frequency
decomposition can be used for determining the endothelial dependent
vasoactivity of
the subject. For example, endothelial dysfunction can be determined when the
frequency decomposition includes higher power in the high frequency range,
e.g.,
above about 0.15 Hz. Alternatively, endothelial dysfunction can be diagnosed
when a
decrease in power in lower frequency ranges (e.g., below about 0.12 Hz, below
about
0.08 Hz, or below 0.06 Hz). For subjects having endothelial dysfunction, such
increment of power in the high frequency range can be followed by increased
variability of the elapsed time and the amplitude parameters.
While reducing the present invention to practice it has been uncovered that
the
above procedure may be improved by an additional step, designated by Block 18,
in
3o which an autonomic nervous system activity of the subject is characterized.
Heart rate
changes, commonly referred to as heart rate variability, are known to be a
direct
consequence of alterations in the activity of autonomic nervous system. Hence,
according to a preferred embodiment of the present invention, the autonomic
nervous
CA 02508590 2005-06-03
WO 2004/052196 PCT/IL2003/001025
19
system characterization is done by heart rate variability analysis.
Heart rate variability may be determined in more than one way. Hence, in one
embodiment, the heart rate variability is determined from the pressure-related
signals.
For example, the pressure-related signals can be divided into segments,
preferably
equally distributed, where in each segment the mean heart rate is calculated
by
subtraction of subsequent peak times. The heart rate variability is then
defined as the
standard deviation of the heart rate in each segment. Typical duration for
each
segment, according to a preferred embodiment of the present invention, is
between 5
seconds and 15 seconds, inclusive.
1 o In another embodiment, heart rate variability is obtained by a different
measurement, which may be, for example, electrocardiogram measurement or any
other procedure for recording electrical signals of the chest of the subject.
A known
device for determining heart rate variability is a Holter monitor, which is a
recorder for
a continuous, typically twenty-four hour, electrocardiographic recording of
the heart
rate.
Many methods are known in the art for determining heart rate variability from
the electrocardiogram signal. For example, heart rate variability may be
determined
by extracting a series of cardiac R-R intervals from the electrocardiogram
signals.
Electrocardiogram signals include, intef° alia, the so-called P waves,
T waves and QRS
2o complexes, which QRS complexes include Q waves, R-waves and S waves. An R-R
interval is the elapsed time between two successive R-waves of the
electrocardiogram
signals. Two known definitions exist for the R peak: (i) the highest (absolute
value)
peak in the QRS complex; and (ii) the first positive peak in the QRS complex.
It
should be understood, that, in all the embodiments detailed herein, any of the
above
definitions may be used when extracting the cardiac R-R intervals. The
procedure of
extracting cardiac R-R intervals from the electrocardiogram signals is well
known in
the art and can be executed, either manually or automatically, e.g., by a data
processor
which, in one embodiment, can be associated with the medical apparatus which
provides the signals.
3o Once, extracted, the cardiac R-R intervals are analyzed for the purpose of
determining the heart rate variability. This can be done, for example, by
obtaining a
frequency decomposition of the cardiac R-R intervals (e.g., Fourier-Transform,
wavelet transform, autoregressive methods , maximal entropy and the like), or
by any
CA 02508590 2005-06-03
WO 2004/052196 PCT/IL2003/001025
other algorithm for analyzing a sequential database.
Typically, heart rate variability analysis includes the calculations of
several
characterizing parameters, such as, but not limited to, standard deviation of
normal-to-
normal beats (SDNN), low-frequency power (LF), high-frequency power (HF), a
very-
5 low-frequency power and any combination (e.g., ratio) of these parameters.
SDNN equals the square root of the total power of the spectral analysis and
indicates parasympathetic activity. In coronary artery disease patients,. for
example,
where there is a reduced parasympathetic activity, the SDNN is small.
The very-low, low- and high-frequency ranges of the frequency decomposition
to are associated with different physiological mechanisms. The very-low
frequency
range, which typically peaks at about 0.04 Hz, is mainly associated with
thermoregulation, the low frequency range, which typically peaks at about 0.12
Hz,
relates to the baro-receptors reflex and the high frequency range, which
typically peaks
at about 0.3 Hz relates to the respiratory cycle.
15 Thus, the LF parameter indicates both parasympathetic and sympathetic
activity, the HF parameter reflects parasympathetic activity and the LF/HF
ratio is
typically used as an index of sympatho-vagal balance. When the heart function
is
reduced due to coronary occlusion, a reduced vagal activity is the first to be
attenuated. Therefore the vagal activity can serve as an index for
characterizing
2o impairment in coronary arteries.
According to a preferred embodiment of the present invention the heart rate
variability analysis is performed over short time intervals, typically from
about
3 minutes to 5 about minutes, during the baseline of endothelial function, so
as to
obtain a sufficient indication of possible impairment in autonomic nervous
system
activity and the blood vessel function.
As used herein the term "about" refers to ~ 10 %.
The endothelial function of blood vessels is affected, as stated, by NO
release,
which is attributed to local platelet aggregation, production of thrombin and
release of
serotonin and ADP. The response of the blood vessel when exposed to specific
3o conditions and stimuli can serve as an indicator for rate of NO release. To
this end
see, Vita JA et al., "Patients with evidence of coronary endothelial
dysfunction as
assessed by acetylcholine infusion demonstrate marked increase in sensitivity
to
constrictor effects of catecholamines,", Circulation 1992, 85:1390-1397;
Deanfield JE
CA 02508590 2005-06-03
WO 2004/052196 PCT/IL2003/001025
21
et al., "Silent myocardial ischemia due to mental stress," Lancet 1984, 2:1001-
1005;
Gage JE et al., "Vasoconstriction of stenotic coronary arteries during dynamic
exercise
in patients with classic angina pectoris: Reversibility by nitroglycerin,"
Circulation
1986, 73:865-876; Gordon JB . et al., "Atherosclerosis and endothelial
function
influence the coronary response to exercise," J Clin Invest 1989, 83:1946-
1952; Nabel
EG et al., "Dilation of normal and constriction of atherosclerothic coronary
arteries
caused by cold pressor test," Circulation 1988, 77:43-52; Zeiher AM et al.,
"Coronary
vasomotion in response to sympathetic stimulation in humans: Importance of the
functional integrity of the endothelium," JACC 1989, 14:1181-90; Anderson EA
et al.,
"Flow-mediated and reflex changes in large peripheral artery tone in humans,"
Circulation 1989, 79:93-100; and Corretti MC et al., "Correlation of cold
pressure and
flow-mediated brachial artery diameter responses with the presence of coronary
artery
disease," Am J Cardiol 1995, 75:783-787.
Hence, increased flow (hyperemia) and arterial diameter, which indirectly
indicate normal release of nitric oxide and endothelial function, appear after
a short
occlusion (several minutes) and reopening of an artery.
Stimuli for myocardial ischemia such as exercise and exposure to cold are
associated with adrenergic stimulation and increased circulating
catecholamines. Such
stimuli have been associated with absolute decrease in myocardial perfusion
and
2o epicardial constriction in patients with early and advanced coronary
atherosclerosis.
The dilation of normal and the constricted sclerotic coronary arteries with a
sympathetic stimulus (e.g., cold pressure testing), mirrors the response to
the
endothelium-dependent dilator acetylcholine. Such stimuli can cause
constriction in
large peripheral artery, even beyond the constriction caused by distal
circulatory arrest.
Thus, both peripheral and coronary arteries having reduced endothelial
function are
associated with increased sensitivity to constrictor effects of
catecholamines.
Hence, according to a preferred embodiment of the present invention method
10 further comprises an optional step in which the blood vessel is stimulated,
prior to
the above measurements. It will be appreciated that a proper stimulus to the
blood
3o vessel can significantly enhance the accuracy of the measurement. For
example, by
determining the blood vessel characteristics after a stimulus which, in normal
blood
vessel, increases NO release, the physician or the nurse may gain information
about
the level of response of the blood vessel to that specific stimulus.
CA 02508590 2005-06-03
WO 2004/052196 PCT/IL2003/001025
22
Many types of stimuli are contemplated, provided that these stimuli generate a
detectable response of the blood vessel in terms of vasoactivity.
Representative
examples include, without limitation, mechanical stimuli, thermal stimuli,
chemical
stimuli, electrical stimuli and the like.
Mechanical stimulus may be, for example, an external pressure applied on the
blood vessel, e.g., using a sphingomanometer, so as to temporarily occlude the
blood
flow therein. As stated, the response of a normal blood vessel to such
occlusion is
increased release of NO and endothelial function, which can be detected by
measurement of the blood vessel characteristics and/or heart rate variability
as further
1o detailed hereinabove. Thermal stimulus may be, for example, a dramatic
temperature
decrease, typically to about 5-10 degrees centigrade which induces
vasoconstriction.
A chemical stimulus is preferably non invasive and may be a vasoactive agent,
capable
of altering the physiologic state of the blood vessel. A representative
example of a
chemical stimulus is nitroglycerin.
The type of stimulus or stimuli which is used preferably depends on (i) the
blood vessel under determination, (ii) the overall medical condition of the
subject and
(iii) the probability that the subject is suffering from endothelial
dysfunction. Other
selection rules for the type of stimuli are also contemplated.
A representative example of a determination protocol is illustrated in the
2o flowchart diagram of Figure 3. Hence, the determination protocol preferably
include
two phases, in which in a first phase, designated by Blocks 22-23, the blood
vessel
characteristics and the heart rate variability are determined under a first
stimulus,
thereby obtaining a preliminary diagnosis. The preliminary diagnosis can be
characterized, e.g., using a correlation function which correlates between the
different
?5 measurements. More specifically, the first phase of the determination
protocol, allows
to preliminary determine of both the level of endothelial dependent
vasoactivity, and
the level of autonomic nervous system activity. Based on the results of the
first phase,
a preliminary characterization of the probability that the subject is
suffering from
endothelial dysfunction can be obtained, using a two-valued index (Tl, A),
where "V"
3o stands for the level of endothelial dependent vasoactivity and "A" stands
for the level
autonomic nervous system activity. Depending on the two-valued index of the
subject, the physician or the nurse can decide whether to finish the protocol
(Block 24)
or to perform an additional determination phase (Block 26), under other types
of
CA 02508590 2005-06-03
WO 2004/052196 PCT/IL2003/001025
23
stimuli and/or at different locations on the subject's body. The additional
determination phase is then preferably used for obtaining a final diagnosis
(Block 28).
As a representative example, suppose that the first phase of the determination
protocol is performed, under a mechanical stimulus, on the brachial and radial
arteries
s of the subject, and that after the first phase it is possible to
differentiate (i) whether the
subject has a normal or an abnormal endothelial dependent vasoactivity, and
(ii)
whether the subject has a normal or an abnormal autonomic nervous system
activity.
Then, the respective two-valued index can have one of four combinations:
( T~ "normal", A="normal"), ( Y "abnormal", A="normal"), ( Tl "normal",
1o A="abnormal") and (h"abnormal", A="abnormal"). One ordinarily skilled in
the art
will appreciate that the first combination and the fourth combination
characterize,
respectively subjects having the lowest and highest probabilities of suffering
from
endothelial dysfunction.
Subjects which are characterized by a combination other than (Y "normal",
15 A="normal") preferably undergo an additional phase of the determination
protocol,
which may be, for example, a thermal phase (e.g., a cold pressure test) where
a
thermal stimulus is applied to the brachial, radial and/or carotid arteries of
the
subj ects.
According to a preferred embodiment of the present invention the thermal
2o phase of the determination protocol can also comprise a continuous
measurement of
heart rate variability (e.g., using one ore more electrocardiogram leads)
simultaneously
with the pressure-related signals recording. Typically, this phase is
performed in a
temperature-controlled room, where the subject is exposed to a sequence of
different
temperatures during the examination. For example, the subject may be exposed
to an
25 alternating sequence of predetermined periods in which an exposure to a low
temperature period is followed by a recovery period in which the subject the
temperature is increased to a normal value. Typical temperature ranges are 0-
15 °C
for low temperature periods and 22-27 °C for recovery periods. The
exposure to
different temperatures may be done by any thermal mechanism capable of
maintaining
3o a substantially constant temperature for a predetermined period of time.
Representative examples include, without limitations, a bath of liquid being
in the
desired temperature, and a thermal device 'being in the desired temperature
and capable
of surrounding an external organ of the subject. Such a thermal device may be
in a
CA 02508590 2005-06-03
WO 2004/052196 PCT/IL2003/001025
24
form of a cuff containing fluid.
As will be appreciated by one ordinarily skilled in the art, many of the above
parameters can be extracted during the thermal phase. For example one elapsed
time
parameter, referred to herein as T1, may be extracted from the pulse transit
time
between the brachial and radial arteries. An additional elapsed time parameter
referred
to herein as T2, is preferably extracted by measuring the transit time between
peaks of
the QRS complexes detected by the electrocardiogram lead and peaks of the
pressure-
related signals recorded of the carotid.
T2 is the sum of two physiological periods: (i) the pre-ejection period, which
is
1o the time needed for the electrical activity of the heart to cause the iso-
volumic
contraction that leads to the opening of the aortic valve; and (ii) the valve-
carotid
period, which is the time needed for a pulse wave to move from the aortic
valve to the
measured location on the carotid. These two physiological periods are
concomitantly
shortened during the exposure to low temperatures. Normally, when the
temperature
starts to increase (e.g., during the recovery period of the above mention
alternating
sequence), the shortening of the pre-ejection period continues [Mezzacappa ES,
et al.,
"Vagal Rebound and recovery from psychological stress," Psychosom Med 2002,
63:650-657] while the aortic-valve-carotid period begins to prolong. Thus, a
comparison between the values of TZ at different times can be used to
characterize the
2o endothelial activity.
More specifically, if during the recovery period, T2 restores its typical
baseline
value the subject is diagnosed as having normal endothelial activity, because
the
increment of the valve-carotid period compensates the shortening of the pre-
ejection
period, which, as stated continues during recovery.
According to a preferred embodiment of the present invention the pulse wave
amplitude is obtained from the same three arteries sites, i.e., brachial,
radial and
carotid arteries.
There are many advantages to this determination protocol. First, as the
thermal
stimulus is less comfortable to the subject, it is only performed on those
subjects who
3o are more likely to suffer from endothelial dysfunction.
Second, the second phase includes also measurements on the carotid thereby
significantly increases the accuracy of the results. As will be appreciated,
the carotid
cannot be mechanically occluded, even for a short duration, without risking
the
CA 02508590 2005-06-03
WO 2004/052196 PCT/IL2003/001025
subject. Thus the second phase preferably includes thermal stimulus so as to
allow the
measurement to be performed on the carotid.
Third, it is recognized that cold pressure vasoactivity, measured in brachial
artery, correlates more closely with the presence of coronary artery disease
than flow
s mediated vasoactivity. Thus, the use of thermal stimulus on the brachial
artery serves
for further validation of the preliminary results.
Forth, although atherosclerosis in brachial arteries is significantly
correlated
with coronary artery disease, a stronger correlation was found to
atherosclerosis in the
carotid. The determination of the autonomic nervous system activity, in all
three
to arteries serves as an additional validation which thereby increases the
overall
accuracy. The combination of two channels, in which in a first channel
pressure
related signals are being analyzed for determining blood vessel
characteristics, and in a
second channel electrocardiogram signals are being analyzed to determine heart
rate
variability, contributes to increased interpretation accuracy of abnormal
results
1 s obtained from both channels.
According to another aspect of the present invention, there is provided a
system 30 for determining endothelial dependent vasoactivity of the subject.
The
system may be used for executing selected steps of method 10.
Referring now again to the drawings, Figure 4 is a schematic illustration of
2o system 30 which, in its basic configuration comprises an arrangement of
sensors 32 for
recording the pressure-related signals. According to a preferred embodiment of
the
present invention sensors 32 can be piezoelectric ceramic elements or membrane
based sensors, such as, but not limited to, electrate microphones. In use,
sensors 32
are preferably positioned on several locations adjacent to one or more blood
vessel.
2s System 30 further comprises a processing unit 34 which receives, records
and
processes the pressure-related signals, sensed by sensors 32. In addition unit
34 is
programmed to extract parameters) from the pressure-related signals, and to
use the
parameters) for the purpose of determining a change of blood vessel
characteristics
and/or autonomic nervous system activity, as further detailed hereinabove.
According to a preferred embodiment of the present invention system 30 may
further comprise a mechanism 36 for stimulating the blood vessel. Mechanism 36
is
preferably capable of stimulating the blood vessel in any of the above types
stimuli,
hence can be a mechanical, thermal, electrical mechanism or chemical
mechanism.
CA 02508590 2005-06-03
WO 2004/052196 PCT/IL2003/001025
26
Additionally, mechanism 36 can be a mechanism for generating mental stress or
a
device for allowing the subject to perform physical exercise. For example, for
mechanical stimulus, mechanism 36 can comprise a sphingomanometer, for thermal
stimulus mechanism 36 can be realized as a low temperature room or a bath of
cold
s fluid, for electrical stimulus mechanism 36 can comprise electrodes, for
chemical
stimulus mechanism 36 may be a vasoactive agent, and the like.
As stated, the present invention also contemplates the determination of an
autonomic nervous system activity, e.g., by heart rate variability analysis.
Thus,
according to a preferred embodiment of the present invention system 30 further
comprising one or more electrocardiogram leads 38 being for sensing electrical
signals
of the chest of the subject. In this embodiment, processing unit 34 (or an
additional
processing unit) calculates heart rate variability from the electrocardiogram
signals
sensed leads 28, as further detailed hereinabove.
As further demonstrated in the Example section that follows, the present
invention provides cost effective system and method. A typical examination
period
for an individual subject is relatively short (from about 5 minutes to about
30 minutes)
and can be executed by paramedical staff, without the supervision of
specialist medical
staff. Preferably, the examination results are automatically analyzed, hence
quickly
providing general practitioners, cardiologists or internal medicine
specialists with
accurate and reliable information. The present invention can be routinely used
for
screening and diagnosis of large population and to differentiate between
subjects in
different stages and combinations of endothelial and coronary artery
dysfunction.
It is expected that during the life of this patent many relevant technologies
for
recording signals near blood vessels will be developed and the scope of the
term
pressure-related signals is intended to include all such new technologies a
pYiori.
Additional objects, advantages, and novel features of the present invention
will
become apparent to one ordinarily skilled in the art upon examination of the
following
examples, which are not intended to be limiting. Additionally, each of the
various
embodiments and aspects of the present invention as delineated hereinabove and
as
claimed in the claims section below finds experimental support in the
following
examples.
CA 02508590 2005-06-03
WO 2004/052196 PCT/IL2003/001025
27
EXAMPLES
Reference is now made to the following examples, which together with the
above descriptions, illustrate the invention in a non limiting fashion.
EXAMPLE 1
First Prototype Syste~a
A first prototype system has been designed and constructed. The system
included (i) transducers and an amplifier, designed and assembled for the
research; (ii)
a processing unit (desktop computer, Pentium IV); (iii) an A/D sampling card,
to purchased from National Instruments DAQ NI-488.2; (iv) data acquisition
software,
purchased from National InstrumentsTM Labview S.l.lTM, custom designed; and
(v)
data analysis software, purchased from MatlabTM, custom designed.
Figure 5 is a schematic illustration of a transducer 50. Transducer 50
included
an electrate microphone 56 and a stethoscope 51. Transducer 50 was capable of
is detecting small movements of the subject's skin generated by the blood
pulse wave
passing thereunder. Microphone 56 was connected to stethoscope 51 by a short
conduit 58, allowing a communication between a membrane 52 of stethoscope 51
and
a membrane 54 of microphone 56. In use, a blood pulse wave passing under the
skin
generates vibrations in membrane 52, which are transmitted by conduit 58 to
2o membrane 54, thus creating an electrical signal in microphone 56.
Figure 6 shows the response of the transducer 50 to an input signal of
approximately 1 Hz, obtained by physically oscillating the microphones. Note
that
although in its origin a typical stethoscope is designed to detect frequencies
above
20 Hz, in practice the sensitivity range of transducer 50 is larger.
Specifically,
25 transducer 50 is capable of sensing low frequencies oscillatory motion.
The sampling rate of the data acquisition software was chosen to be 1000 Hz.
This sampling rate .provided the necessary precision for calculating the
elapsed time
between two successive pulses. Other sampling frequencies were tested and
found
less effective (higher frequencies demanded more memory and improvement in
30 accuracy was negligible).
Figure 7 .is a detailed flowchart diagram of the data analysis procedure.
Hence,
the raw data, as recorded using the transducers from two locations of the
subject's
body was loaded from the data acquisition software and filtered by a low pass
filter
CA 02508590 2005-06-03
WO 2004/052196 PCT/IL2003/001025
28
(15 Hz). The data was in a form of a plurality of 10 seconds segments. Each
segment
was scanned for its peaks.
Peaks were defined by a zero derivative and were accepted for calculation if
the following conditions were met: (i) the value of the peak was above a
predetermined threshold, selected to be 70 % of the average maximum value; and
(ii)
the time interval between the peak and its former peak (of the same location)
was more
than 0.25 seconds.
Using a correlation method, the elapsed time between two appropriate peaks
from two different locations of the body was measured. Mean value and the
standard
to deviation of the elapsed time was calculated, so as to eliminate
unreasonable results
(originated from noise, movement of the subject, erroneous calculation etc.).
The
standard deviation acceptance range was about 10 %. This process was repeated
for
all the peaks of all the segments.
The accepted peaks were used for calculating heart rate, heart rate
variability
and standard deviation (respectively designated in Figure 7 by HR, HRV and
SD).
The heart rate was defined as the time between successive peaks of the same
location.
The heart rate variability was obtained by calculating the standard deviation
of the
heart rate in each segment. The heart rate variability was averaged over all
the
accepted segments and a standard deviation of the heart rate variability was
obtained.
A graphical output of the results was produced in the final step.
Figures 8a-c are representative graphical output of the procedure. Figure 8a
shows the relative change in elapsed time between the two transducers in %
designated
PWT (pulse-wave time parameter), as a function of time in minutes. Each point
represents an average of approximately 10 seconds. The average value of PWT
during
the first three minutes of baseline is presented numerically; the dotted line
represents
the relative average value of baseline.
Figure 8b shows the percentage of the standard deviation of PWT calculated
for the points represented in Figure 8a. High standard deviation during
baseline
represents movements of the subject or a noisy recording.
Figure 8c shows the heart rate as a function of time. Each point represents an
average of approximately 10 seconds. Numerical values of heart rate are
presented
(designated HR in Figure 8c).
CA 02508590 2005-06-03
WO 2004/052196 PCT/IL2003/001025
29
EXAMPLE 2
Iyz T~ivo Measurements Usirzg the First Prototype Systerrz
In vivo tests were performed on 21 volunteers, using the first prototype
system
of Example 1. Two transducers were connected to the subject under examination.
A
first transducer was connected to the radial artery at the wrist, and a second
transducer
was connected to the brachial artery about 5-10 cm above the elbow on the
proximal
side of the arm. The transducers were fastened with a cuff inflated to a
pressure of 20
mmHg, so as to improve that signal to noise ratio, and to prevent partial
occlusion of
the vessel. An additional cuff, purchased from Hokanson, US, was positioned
above
1o the first cuff, for the purpose of implementing ischemia (mechanical
stimulus).
Mechanical Stimulus
Subjects were tested at different hours of the day without fasting. Each
subject
was in a sitting posture in a temperature-controlled room (18 °C - 24
°C). The
examination of each subject included: (i) three minutes of baseline recording
(without
stimulus); (ii) three minutes of induced ischemia in the brachial artery
(using the
additional cuff); and (iii) five minutes of recording during recovery
subsequently to
cuff release.
Thermal Stimulus
Vasoconstriction was induced by submerging the right hand in cold water
(8 °C), during continuous recording from the left hand in a sitting
position. The
subjects also underwent relaxation periods in which the right hand was in
water at
room temperature (21 °C).
The examination of each subject included: (i) a few minutes in water in room
temperature; (ii) three minutes of baseline recording (room temperature);
(iii) one
minute of vasoconstriction (cold water); (iv) three minutes of room
temperature; (v)
two minutes of vasoconstriction; (vi) at least three minutes of recovery in
room
temperature.
Combined Stimuli
Several factors, such as temperature, food, drugs, physical exercise before
3o examination and sympathetic stimuli, can affect vasomotor activity. In the
above
tests, it has been observed, that in some cases, examined individuals who were
supposed to be with normal endothelium dependent vasoreactivity had different
CA 02508590 2005-06-03
WO 2004/052196 PCT/IL2003/001025
responses to reactive hyperemia at subsequent examinations. It was also found
that
these changes were in correlation with the elapsed time parameter measured in
baseline. When the elapsed time parameter during baseline was relatively high
(above
40-42 ms) the subject's response to reactive hyperemia was weak or completely
5 absent. When the elapsed time parameter during baseline was lower (20-40 ms)
the
subjects' response to reactive hyperemia was normal. This implied that there
is a
"physiological window" in which the system produces the most reliable results.
Hence, the following standard procedure was developed to increase the
probability that examinations were performed within the "physiological
window": (i)
to subjects were examined after fasting for 6-8 hours; (ii) the examination
was performed
in a quiet temperature controlled room ( 18 °C - 20 °C); (ii)
after three minute
recording the subject was disconnected from the transducers, walked moderately
for
two minutes and returned to a sitting position, so as to enhance sympathetic
activity,
reduce the elapsed time parameter and induce relaxation; (v) two subsequent
15 examinations under mechanical stimulus as described above, with a 10-minute
rest
between the examinations to allow full recovery of the artery.
Under this protocol, an impaired endothelial function has been diagnosed only
in cases where both examinations showed abnormal endothelium dependent
vasoreactivity.
20 Comparative Study
The results obtained by the first prototype system of Example 1 were compared
to results obtained using a high-resolution ultrasonography device (HP sonos
5500).
Each subject underwent a first examination using the ultrasonography device
and a
second examination using the prototype system, with 30 minutes rest between
the
25 tests. All subjects were examined after fasting for 8 hours without smoking
or coffee.
The ultrasonography examination of each subject included: (i) three minutes
baseline recordings; (ii) three minutes of brachial artery occlusion; and
(iii) ten
minutes of recovery with continuous recording.
For each subject, 4 artery diameters, designated D~-D4, were calculated off
line
3o from the ultrasound images: D~, calculated during baseline phase, 1 minute
from start;
DZ, calculated during baseline phase, 2 minutes from start; D3, calculated
during cuff
phase, 1 minute after deflation. and D4. calculated during .cuff phase 1.5
minutes after
deflation.
CA 02508590 2005-06-03
WO 2004/052196 PCT/IL2003/001025
31
The baseline diameter is defined as the average between D, and D2 and the
absolute diameter change is defined as the subtraction of D4 from the baseline
diameter. Specifically:
baseline = D' 2 DZ (EQ. 3)
FMD% =100 ~ D4 baseline (EQ. 4)
baseline
where FMD is abbreviation for Flow Mediated Dilatation. Typical FMD
measurements are from about -6.2 % to about +31.8 %. Abnormal FMD was defined
when the FMD value was below +6 %.
The prototype system examination of each subject included the combined
stimuli protocol as further detailed above. The output of this examination is
shown in
Figures 9a-e. Figures 9a-b show examples of the output obtained for
individuals with
abnormal endothelial activity, Figures 9c-d show examples of the output
obtained for
individuals with normal endothelial activity, and Figure 9e is an example of
an output
in which the elapsed time decreases while the arterial diameter is increasing
as a result
of nitroglycerin intake in a lying posture. Each Figure shows PWT, the
percentage of
the standard deviation of PWT and the heart rate as a function of time, as
further
explained hereinabove (see description of Figures 8a-c).
Further details of the output presented in Figures 9a-a is summarized in Table
1, below.
Table 1
Type of Maximum change Response
in
PWT after cuff duration,
release T, EDV function
response ~%, after cuff
release
None 0(PW~ ~ 0 -------- Abnormal
Weak 0(PWT) < 10 T < 2 min Abnormal
Normal 10 < 0(PWT) < 2 < T < 4 Normal
20
Strong 4(PW~ > 20 T > 4 Normal
Negativ a below- baseline --------- ---------
CA 02508590 2005-06-03
WO 2004/052196 PCT/IL2003/001025
Results
32
Tables 2-3, below show the results obtained in the mechanical stimulus
examination, where Table 2 shows the results obtained for low risk subjects
and Table
3 shows the results obtained for high risk subjects.
s
Table 2
Risk
Factors
~y ~, ~ ~ o d
Y o ~ ~ a. PWT
at
o ~ ~ ~
co
n ~ ~ ~ baseline
o. o
ms
1 M 39 + - - - - - 30 Strong N
2 F 19.5 - - - - - - 42 Normal N
3 F 32 - - - - - - 51 Normal N
4 M 26 + - - - - - 32 Normal N
F 42 + - - - - - 21-33 Normal N
6 F 71 - + - - - - 55 None AN
7 F 50 - - + - - - 58 Strong N
80 F 24 - - + - - - 20 Strong N
9 F 28 - - - - - - 52 Weak N
F 26 - - - - - - 44 Weak (-) AN
m=mormai; Hm=Abnormal; (-)=Negativa
~ had a continuous trembling in hands
0 smokes 5 cigarettes a day.
to
Table 3
Risk
Factors
7~
n, PWT ~ ~ Clinical
" ~ Wi d [ ,. ~
~ x ~. ~ msj ~ comments
a.
o. o
CA 02508590 2005-06-03
WO 2004/052196 PCT/IL2003/001025
~z
Regulates
1 M 56 + + - - - - 33 Normal N cholesterol
with
simovil
2 F 54 - + + - - - 48 None AN
Takes
3 F 52 - - + + - - 53 None AN medication
for
H er-tension
4 M 59 + + + - - - 27 None AN Smokes 10
ci arettes
a da
M 49 + + + + - - 59 None AN
Receives
6 M 65 + + - - + - 40 None AN medication
for
cholesterol
7 F 54 - + + - - - 65 None AN
8 M 54 + + + - - - 48 None AN
9 M 63 + + - - - - 28 NegativeAN CAD, orifice
F 53 - + + - - - 26 NegativeAN
11 F 50 - I + I + I 27 Weak N
I I I I I I I (
tv-lVUrIIldl; H1V=ADnOrmal
The results of Tables 2-3 are summarized in Table 4, below:
Table 4
Normal Abnormal
Populationage n
EDV EDV
High risk55.3 11 2/11~~~18% 9 82%
Low risk 37 10 8/10 80% 2 20%
5
(
1
)
p
<
0.002
high
Vs
low
risk
group
The average age of the groups with normal endothelium dependent
vasoreactivity was 36.7 ~ 12.5 years and with abnormal endothelium dependent
vasoreactivity was the 54.5 ~ 11.5 (p<0.01). The average elapsed time of
baseline was
10 37.2 ~ 12.7 ms for the normal group and 44.8 ~ 13.3 ms for the abnormal
group
(p=0.1 ).
CA 02508590 2005-06-03
WO 2004/052196 PCT/IL2003/001025
34
Figures l0a-c show relative changes in the elapsed time, standard deviation
and heart rate variability, of one subject examined in the thermal stimulus
test.
During the first three minutes, the elapsed time was measured and the average
was calculated (the dotted line in Figure l0a). When the right hand was
submerged in
cold water for 1 minute the elapsed time (measured on left hand) decreased
almost
linearly until it reached its lowest value (~70 %). Heart rate increased
substantially
when the right hand was submerged in the cold water (Figure lOc). When the
right
hand was pulled out of the cold water and submerged in room temperature water,
the
elapsed time increases almost linearly until the initial elapsed time value
reached
to (recovery). When the right hand was submerged again for 2 minutes in the
cold water,
the elapsed time decreased to a minimum of ~60 % from the initial baseline and
heart
rate was increased. Again, when right hand was pulled out of cold water and
placed in
room temperature water, the elapsed time raised again but did not reach
initial baseline
level until the examination has terminated.
Table 5 below shows the results of relative change in elapsed time for 6
subjects exposed to cold water.
Table 5
~ 1-minute recovery t2~ 2-minutet3~recover
No Baseline Baseline
submergence:time submer ence:time
100% 100% g Y
PWT relative(minutes) PWT relative(minutes)
to baseline to baseline
1 100% 70% 1 100% 40% 2
2 100% 70% 4 100% 40% above
6
3 100% 85% 2 100% 20% 3
4 100% 80% 1 100% 30% above
6
5 100% 80% 1 100% 25% 2.5
6 100% 75% 1.5 100% 25% 1.5
Av. 100% 76.6 6.0 1.75 100% 30 8.3 3.5
% 1.2 % 2.0
~ i ~ pw.~~ i netween control and 1 mW ute submergence.
(2) p<2.SE-6 between control and 2 minutes submergence.
(3) p<0.05 between recovery time of 1 Vs 2 minutes submergence.
CA 02508590 2005-06-03
WO 2004/052196 PCT/IL2003/001025
As can be seen from Table 5, a decline in elapsed time was found when the
subject's hand was submerged in cold water. It can be seen that the change in
the 2
minutes submergence relative to the 1 minute submergence is larger and
recovery time
is longer.
5 Figures 11 a-b show the effect of posture on the elapsed time and the
measurement of endothelium dependent vasoreactivity. Two individuals were
examined with nitroglycerin while they were postured in a lying position for
comparison with the ultrasonography examination. In these two examinations,
the
prototype system indicated abnormal response while the ultrasonography
examination
io indicated normal response of increased hyperemia to nitroglycerine intake.
In order to look for a possible explanation to the different responses between
ultrasonography examination and the prototype system, three other individuals
were
examined in two different postures, sitting and lying, at the same
circumstances. The
results are summarized in Table 6, below.
Table 6
Subject PosturePWT at baseline TYhe of
[ms]
res onse
Lying 40 Negative
1
_____.._.._._._..__._..._..._._.._..._________._.__.._.__.._______.._._____..._
_..
..
.
Sitting26 __._.._..__._....__..__.._._.....
Normal
Lying 4~ Negative
2 _.__...._._._._.__..____._...._.__....___~______....__._.._.__._.
.
... ___._~_..__..._-____
Sitting_ Normal
3 ~
Lying 45 Negative
3
....__...._.._...._.._.._.......____.___._.._..__._...._____....___._._.__.._..
...
._._._
__
__.._..____..._..___._._....._._
Sitting41 Normal
As can be seen from Table 6, in these cases the response was negative for
lying
and normal for sitting. For the three individuals that where examined in both
postures,
2o the average elapsed time during baseline was higher in the examinations
performed in
a lying posture than in sitting posture. The results obtained may imply that
above a
certain threshold of the elapsed time during baseline, the ability of the
prototype
system to perform a reliable measurement decreases. This possibility was
further
examined in the combined stimuli examination.
CA 02508590 2005-06-03
WO 2004/052196 PCT/IL2003/001025
36
Table 7, below, summarizes the results obtained in the standard protocol
development.
Table 7
Examination Examination EDV
Age a b
&
No PWT Type of PWT at Type of functionin
Gen. at
response baseline response g
baseline
1 34 F 42 Abnormal 39 Normal Normal
2 55 F 21 Normal 18 Normal Normal
3 23 M 17 Normal 16 Normal Normal
4 23 M 26 Normal 27 Normal Normal
39 M 29 Normal 21 Normal Normal
6 57 M 45 Abnormal 37 Abnormal Abnormal
7 46 F 24 Normal 23 Abnormal Normal
8 36 F 33 Normal 34 Normal Normal
9 28 M 44 Abnormal 51 Abnormal Abnormal
5
It can be seen that only in one out of 9 cases the results differ. In
addition, it
was found in the 4 cases where the elapsed time was relatively long (>40 ms)
during
baseline (in examinations a or b), results were abnormal while with shorter
elapsed
time (<40 ms) it appeared only in 2/ 14 cases.
to Table 8 below shows the effect of a moderate walking on PWT. The obtained
results indicate that short and moderate effort of walking shorten elapsed
time
(p<0.05).
Table 8
PWT
No. before walking~~~ after walkingReduction
[ms] jms] in
PWT [%]
1 37.5 34.4 8.26
2 45.4 32.7 27.9
3 46.3 35.1 24.1
52.2 41.3 20.88
CA 02508590 2005-06-03
WO 2004/052196 PCT/IL2003/001025
'~ 7
46.5 38.22 17.8
Aver
45.85.3 36.33.4 19.78
ae
( 1 ) p<U.US between values obtained before and after walking
A Comparison between the ultrasonography examination and the prototype
system examination is shown in table 9, below.
Table 9
US
Change Prototype
system
Age
&
Examination Examination
in vessel a b
EDV
gender t'~EDV
diameter~nctioningPWT Type PWT Type
at of at of
baselineresponsebaselineresponse
functioning
1 57 3.6% Abnormal 29 Abnormal47 Abnormal
M
Abnormal
2 56 3.5% Abnormal 31 Abnormal33 Abnormal
F
Abnormal
3 53 27.3% Normal 24 Normal 23 Normal
F
Normal
4 42 7.8% Normal 42 Abnormal41 Abnormal
M
Abnormal
5 57 1.8% Abnormal 29 Abnormal31 Abnormal
M
Abnormal
6 57 14.2% Normal 33 Normal 41 Abnormal
M
Normal
7 52 19.1 Normal 33 Normal 28 Normal
M %
Normal
8 39 8.3% Normal 29 Normal 21 Normal
M
Normal
9 57 2.7% Abnormal 20 Abnormal15 AbnormalAbnormal
F
41 9.8% Normal 25 Normal 24 Abnormal
M
Normal
I 29 4.6% Abnormal 46 Abnormal35 AbnormalAbnormal
1 M
i ) p~u.u~ a ~ vs. the prototype system
AS shown, in 10 out of 11 subjects, the ultrasonography examination and the
1o prototype system examination had similar results (p<0.02). In the case of
subject 4,
where results were contrary, the ultrasonography examination indicated a FMD
of
7.8 %, which is 1.8 % above the borderline of 6 %.
CA 02508590 2005-06-03
WO 2004/052196 PCT/IL2003/001025
38
Discussion
In the mechanical stimulus examination, two groups were examined. In one
group (n=10) subjects had one risk factor at the most for endothelial
dysfunction, in
the second group (n=11) subjects had at least two risk factors for endothelial
dysfunction. The results obtained indicated that in the group with a maximum
of one
risk factor, 8 out of 10 subjects had normal endothelial function and in the
group
where subjects had at least two risk factors only 2 out of 11 subjects had
normal
functioning endothelium (p<0.002). The average age in the group that had
abnormal
endothelium dependent vasoreactivity was found to be significantly higher than
the
to group that was found to have normal endothelium dependent vasoreactivity
(p<0.01).
In the thermal stimulus examination the elapsed time parameter, PWT, was
recorded from the left hand continuously in all individuals examined (n=6).
PWT
values decreased substantially relatively to baseline (p<0.001 ) and heart
rate increased
when the right hand was submerged in the cold water (30%-40% decrease in PWT)
for
a period of 1 minute, When the right hand was submerged for a period of 2
minutes
the decrease in PWT relative to the 100% baseline was significantly larger
(p<2.SE-6)
(60%-80% decrease in PWT). There was also a significant difference (p<0.05)
between the recovery times after the hand was pulled out of the cold water.
The high significant difference (in spite of the small size groups) between
2o control and exposure to cold water is in accordance with the prediction
that
measurement in the direction of vasoconstriction is a sensitive measurement,
in
agreement with the Moens-Korteweg equation.
Unexpectedly, results obtained by the prototype system in the lying position
and the ultrasonography device were not compatible. Endothelium dependent
vasoreactivity function was examined in two different postures (sitting and
lying).
The results show discrepancies between the data obtained in a sitting posture
and that
obtained in a lying posture. These findings indicate that there is an
additional physical
factor that results in a dependence of PWT on posture. In many cases high
value of
PWT during baseline was followed by relatively low changes of PWT due to
reactive
3o hyperemia. This type of result is associated with the mechanical properties
of the
arterial wall.
To this end a "physiological window" has been defined in which the system
has an appropriate mode of operation. It was assumed that in cases where the
initial
CA 02508590 2005-06-03
WO 2004/052196 PCT/IL2003/001025
39
PWT value was relatively high (>40ms), the initial radius before relaxation
was also
relatively wide. This may explain that the results obtained in a lying
position with
relatively large initial radius were based on measurements carned out, beyond
the
"physiological window," Compared to this, cases in which the initial PWT value
was
relatively low, as in most examinations performed in a sitting position, it is
assumed
that the examination was performed within the "physiological window".
Statistical
analysis of the data show that the average PWT during baseline is
significantly higher
in cases where subjects were found to have abnormal endothelium dependent
vasoreactivity compared to cases where subjects were found to have normal
endothelium dependent vasoreactivity.
The combined stimuli examination showed that a moderate walk for about 2
minutes before the examination, which causes a moderate elevation and alpha
sympathetic activity, led to vasoconstriction and PWT reduction, hence allowed
the
examination to be conduct within the "physiological window". Intensifying the
physical activity (running or jumping) before examination causes an opposite
effect in
which probably beta receptors are also active causing vasodilatation. In such
a case it
reduces the probability that the examination will be conducted within the
"physiological window."
A comparison between results obtained by the prototype system and
ultrasonography was carried out on a study group of 11 subjects. In 10 out of
the 11
subjects the diagnoses determined by both the prototype system and the
ultrasonography were compatible (p<0.015). In one case the US examination
indicated a slightly higher value than the borderline increase in brachial
diameter
(7.8°f° vs. 6%) while the prototype system indicated "no
response" in the first
examination and a "weak response" in the second examination. In 5 of the cases
both
devices indicated abnormal endothelium dependent vasoreactivity and in the 5
other
cases both devices indicated normal endothelium dependent vasoreactivity.
EJ~AMPLE 3
A Secoyzd Pf~ototype System
A second prototype system has been designed and constructed. The system
included: (i) a -custom designed data logger; (ii) a brachial, radial and
carotid
transducers, all being operative at low frequencies and based on piezoelectric
ceramic
CA 02508590 2005-06-03
WO 2004/052196 PCT/IL2003/001025
elements; (iii) an electrocardiogram chest electrode; (iv) a standard personal
computer;
and (v) data analysis software (see Example 1).
The custom designed data logger included an amplifier, a four-channel A/D
card connected to the computer via a USB cable and a small LCD monitor.
5 The brachial transducer was a coin shaped transducer, about 2 cm in
diameter,
attached to a dual compartment sphyngmanometric cuff, so as to allow both
arterial
occlusion (mechanical stimulus) and attachment of the transducer with a
constant and
controlled force. The dual compartment sphyngmanometric cuff included two
separate air compartments: a low pressure compartment (~20 mmHg) for applying
10 force on the brachial transducer thus coupling the transducer to the skin
with a
controlled force; and a high pressure compartment (up to 300 mmHg) for
applying the
mechanical stimulus on the artery. The high-pressure compartment facilitates
quick
release of pressure.
The radial and carotid transducers were pencil shaped transducers with
15 attached to stabilizing devices facilitating constant applied force for
applanation
tonometry, where the radial transducer was attached to a wrist stabilizing
device and
the carotid transducer was attached to a neck stabilizing device.
EXAMPLE 4
20 Iaz Vivo MeasuYezzzeuts Usizzg the Secozzd Prototype System
In vivo tests were performed on 22 volunteers, using the second prototype
system of Example 2.
Mechanical stimulus
The brachial and the radial transducers were connected to the subject under
25 examination, as further detailed in Example 2. For each subject, two
parameters were
obtained, the elapsed time parameter, PWT, and the amplitude parameter, PWA
(pulse
wave amplitude). The examination of each subject also included examination
using
the ultrasonography device (see further details in Example 2, above).
Figures 12a-c show the elapsed time (Figure 12a), standard deviation (Figure
30 12b) and amplitude (Figure 12c) during supine position of a subject who has
been
diagnosed by US measurements as having normal endothelial function. The
brachial
artery was occluded for three minutes. After reopening of the occlusion (6
min)
elapsed time showed only minor change while the amplitude showed dramatic
CA 02508590 2005-06-03
WO 2004/052196 PCT/IL2003/001025
41
changes. The value of PWT was relatively long, about 45 ms.
Figures 13a-c show the elapsed time (Figure 13a), standard deviation (Figure
13b) and amplitude (Figure 13c) during sitting position of a subject who has
been
diagnosed by US measurements as having normal endothelial function. The
brachial
artery was occluded for three minutes. As shown, in this case the elapsed time
was
increased and almost no change in the amplitude. The value of PWT was
relatively
small, about 15 ms, indicating that the initial diameter of the artery was
relatively
small.
Figures 14a-c show the elapsed time (Figure 15a), standard deviation (Figure
to 15b) and amplitude (Figure 15c) during sitting position of another subject
who has
been diagnosed by US measurements as having normal endothelial function. The
value of PWT was small, about 33 ms, indicating that the measurement was
initiated
within the "physiological window." With the increment of the artery's radius,
a non-
linear region, characterized by a non-linear amplitude increment, was
observed.
Figures 15a-c show the elapsed time (Figure 14a), standard de~-iation (Figure
14b) and amplitude (Figure 14c) during sitting position of a subject who has
been
diagnosed by US measurements as having abnormal endothelial function. As
shown,
in this case no change was observed in the elapsed time or in the amplitude,
indicating
abnormal endothelial function. The value of PWT was short, about 24 ms,
indicating
that the measurement was carried out within the above mentioned "physiological
window."
Chemical stimulus
The effect of a chemical stimulus was tested on three subjects pretreated by
with nitroglycerin.
Figures 16a-c show the elapsed time (Figure 16a), standard deviation (Figure
16b) and amplitude (Figure 16c) after the nitroglycerin treatment and during
supine
position of a subject who has been diagnosed by US measurements as having
normal
endothelial function. As shown, in this case the elapsed time was reduced and
the
amplitude was increased. The value of PWT was relatively large, about 45 ms,
3o indicating that the initial diameter of the artery was relatively wide.
Table 10, below, summarize the results for all subjects under examination:
CA 02508590 2005-06-03
WO 2004/052196 PCT/IL2003/001025
42
Table 10
US Second
Prototype
System
PWT PWA PWT and PWA
Normal Response 14 9 S. 14
Abnormal Response 5 6 6 6
(*}
Border zone results3 0 2 2
Total ~ ~ 15 ~ 13 ~ 22
22
(*) In both PWT and PWA parameters.
Spearman correlation, r=0.93, p<0.001.
Discussion
In this example, in addition to the elapsed time parameter, the amplitude
parameter was included in analysis procedure. As stated in the discussion of
Example
2, the measurement of endothelial function was based on the change of elapsed
time
parameter thereby requiring the measurement to be carried out within the
to "physiological window," where the initial radius of the artery diameter is
sufficiently
small. Under such conditions, the elasticity module of the artery's wall is,
to a good
approximation, constant causing a linear dependence of the pulse wave velocity
on the
inverse of the radius (the pulse wave velocity decreased as the arterial
radius is
increased).
With the addition of pulse wave amplitude to the analysis, sensitivity to
changes in artery diameter even beyond the "physiological window" was found.
The
amplitude parameter was increased for relatively large radius, indicating the
participation of collagen in the change. At the same time, no change was
observed in
elapsed time parameter. On the other hand, no change in the amplitude
parameter was
observed when the initial radius size was considered to be within the
"physiological
window."
EJ~AANIPLE 5
Measuring Heart Rate l~az~iability Usizzg Electt~ocaz~diog~azn Leads
Heart rate variability analysis was carried out in 12 of the subjects who had
undergone examination for the endothelial dysfunction measurement of Example
4. In
10 subjects heart rate variability analysis indicated normal autonomic nervous
system
CA 02508590 2005-06-03
WO 2004/052196 PCT/IL2003/001025
43
activity and therefore possible normal coronary function. The analysis is
based on
3 min recording using electrocardiogram lead II of the chest of the subjects,
during
baseline (before application of the mechanical stimulus).
The results are presented in Figures 17a-h.
Figures 17a, 17c, 17e, and 17g show heart rate variability analysis of a
subject
with normal heart rate variability activity and endothelial dysfunction.
Figures 17b,
17d, 17f, and 17h show heart rate variability analysis of a subject with
abnormal
activity but with normal brachial endothelial function. Endothelial function
or
dysfunction are not shown in Figures 17a-h.
Figures 17a-b show beat-to-beat analysis, referred to hereinafter as B2B
analysis. For the subjects with the differences between subjects with normal
and
abnormal heart rate variability activity are manifested by the value of SDNN,
which is
in the normal range in Figure 17a and significantly lower in Figure 17b. As
stated, a
reduced value of SDNN reflects a reduced parasympathetic activity. In
addition, high
fluctuations between beats are shown in Figure 17a, compared to Figure 17b.
Figures 17c-d show the power spectrum densities. The normal HF peak
around 0.3 Hz shown for the normal subject (Figure 17c) is absent from Figure
17d,
hence indicates abnormal heart rate variability. In addition, HF value is
relatively high
in Figure 17c compared to Figure 17d, LFIHF is low in Figure 17c compared to
Figure
2o 17d, hence also supporting the abnormal heart rate variability diagnosis of
the subject
of Figure 17d.
Figures 17e-f show Fast Fourier Transform analysis of the RRI series. Again,
a clear peak shown around 0.3 Hz in Figure 17e, is almost completely absent in
Figure
17f.
Figures 17g-h show relative incidence, as a function of B2B (measured in ms).
A relatively wide histogram of time intervals between beats is presented in
Figure 17g,
compared to the narrow histogram shown in Figure 17h, indicating normal heart
rate
variability for the subject of Figure 17g and abnormal heart rate variability
for the
subject of Figure 17h.
CA 02508590 2005-06-03
WO 2004/052196 PCT/IL2003/001025
44
EXAMPLE 6
Cold Pf~essu~e Test
In this study, a cold pressure test was performed on nine young subjects, 24-
35
years of age (30.8 + 3.8 years) having no known risk factors for coronary
heart disease
hence assumed to have normal endothelial function.
Four channels were connected: electrocardiogram lead II, connected to the
chest, and three transducers, connected to the brachial, radial and carotid
arteries.
Sample rate for all the channels was 1000 Hz. The examination was performed in
a
temperature-controlled room (22 °C). Blood pressure was measured with
an
automated sph 'igo-r-manometer before the recording.
The recording protocol included the following periods of thermal stimuli:
3 minutes at room temperature, 4 minutes at 25 °C, 2 minutes at 5
°C and 10 minutes
at 25 °C. Each stimulus was applied by a bath containing water in the
respective
temperature, in which the subjects placed the right wrist.
For each subject, the following parameters were extracted: T~ (brachial-radial
transit time), T2 (QRS-carotid transit time), three amplitude parameters (one
for each
artery and heart rate.
Figures 18a-c show the results of the examination, where transitions between
the steps of the protocols are designated by dashed vertical lines at t = 3, 7
and 9
minutes.
Figure 18a shows changes of the two elapsed time parameters T~ (blue line)
and TZ (red line), measured in ms. As shown, both TI and TZ restore and
continue to
increase above their original (baseline) values during recovery, indicating
normal
endothelial function, as further detailed hereinabove.
Figure 18b shows changes of all three amplitudes, measured as percentage of
the baseline value. A decrement in all amplitudes is observed during the low
temperature period (7 < t < 9 min). As shown the decrement in the amplitude of
the
pulse measured of the carotid artery is less pronounced than the decrement in
the
amplitudes measured of the brachial and radial arteries. During recovery, all
amplitudes exhibit an increment, where the increment in the amplitude of the
pulse
measured of the carotid artery is more pronounced, and reaches a value of
about 50
above baseline. The increments in the amplitudes of the pulse measured of the
CA 02508590 2005-06-03
WO 2004/052196 PCT/IL2003/001025
brachial and radial arteries are less pronounced and reach about 10-20 % below
baseline.
Figure 18c shows the heart rate, measured in bits/min. A clear peak was
observed during the low temperature period (7 < t < 9 min), indicating
increased
5 sympathetic activity. A minor heart rate increment was also observed during
the first
transition (from room temperature to 25 °C). As shown in Figure 18c the
heart rate
resorted its baseline value during the second recovery period (9 < t < 19
min).
It is appreciated that certain features of the invention, which are, for
clarity,
10 described in the context of separate embodiments, may also be provided in
combination in a single embodiment. Conversely, various features of the
invention,
which are, for brevity, described in the context of a single embodiment, may
also be
provided separately or in any suitable subcombination.
15 Although the invention has been described in conjunction with specific
embodiments thereof, it is evident that many alternatives, modifications and
variations
will be apparent to those skilled in the art. Accordingly, it is intended to
embrace all
such alternatives, modifications and variations that fall within the spirit
and broad
scope of the appended claims. All publications, patents and patent
applications
2o mentioned in this specification are herein incorporated in their entirety
by reference
into the specification, to the same extent as if each individual publication,
patent or
patent application was specifically and individually indicated to be
incorporated herein
by reference. In addition, citation or identification of any reference in this
application
shall not be construed as an admission that such reference is available as
prior art to
25 the present invention.