Note: Descriptions are shown in the official language in which they were submitted.
CA 02675227 2016-05-16
ANALYTE TESTING METHOD AND SYSTEM
Background
[0001] Glucose monitoring is a fact of everyday life for diabetic
individuals. The
accuracy of such monitoring can significantly affect the health and ultimately
the quality of life of the person with diabetes. Generally, a diabetic patient
measures blood glucose levels several times a day to monitor and control
blood sugar levels. Failure to test blood glucose levels accurately and on a
regular basis can result in serious diabetes-related complications, including
cardiovascular disease, kidney disease, nerve damage and blindness. There are
a number of electronic devices currently available which enable an individual
to test the glucose level in a small sample of blood. One such glucose meter
is
the OneTouch0 ProfilcTM glucose meter, a product which is manufactured by
LifeScan.
[0002] In addition to glucose monitoring, diabetic individuals often have
to maintain
tight control over their lifestyle, so that they are not adversely affected
by, for
example, irregular food consumption or exercise. In addition, a physician
dealing with a particular diabetic individual requires detailed information on
the lifestyle of the individual to provide effective treatment or modification
of
treatment for controlling diabetes. Currently, one of the ways of monitoring
the lifestyle of an individual with diabetes has been for the individual to
keep a
paper logbook of their lifestyle. Another way is for an individual to simply
rely on remembering f'acts about their lifestyle and then relay these details
to
their physician on each visit.
[0003] The aforementioned methods of recording lifestyle information are
inherently
difficult, time consuming, and possibly inaccurate. Paper logbooks are not
necessarily always carried by an individual and may not be accurately
1
CA 02675227 2016-05-16
completed when required. Such paper logbooks are small and it is therefore
difficult to enter detailed information requiring detailed descriptors of
lifestyle
events. Furthermore, an individual may often forget key facts about their
lifestyle when questioned by a physician who has to manually review and
interpret information from a hand-written notebook. There is no analysis
provided by the paper logbook to distil or separate the component information.
Also, there are no graphical reductions or summary of the information. Entry
of data into a secondary data storage system, such as a database or other
electronic system, requires a laborious transcription of information,
including
lifestyle data, into this secondary data storage. Difficulty of data
recordation
encourages retrospective entry of pertinent information that results in
inaccurate and incomplete records.
[0004] Moreover, a diabetic individual often has to keep a plurality of
devices on
their person for diagnosis and treatment, for example both glucose level
monitoring equipment and medication. Hence, having to carry paper records of
their lifestyle is an added unwanted burden and entry of data therein is very
time consuming.
[0005] There currently exist a number of portable electronic devices that
can measure
glucose levels in an individual and store the levels for recalling or
uploading to
another computer for analysis. One such device is the AccuCheckTM
CompleteTM System from Roche Diagnostics, which provides limited
functionality for storing lifestyle data. However, the AccuCheckTM
CompleteTM System only permits a limited selection of lifestyle variables to
be
stored in a tneter. There is a no intelligent feedback from values previously
entered into the meter and the user interface is unintuitive for an infrequent
user of the meter.
2
CA 02675227 2016-05-16
Summary of the Disclosure
100061 Applicants have recognized a need for an electronic device for
logging and
analyzing lifestyle data, which does not increase the number of devices an
individual has to keep on their person. Such device must be also more
intuitive
and easier to use than other devices, thereby encouraging an individual to
record information related to their lifestyle. Lifestyle data should be taken
to
mean any quantifiable information, which might affect or represent an
individual's physical condition. Examples of lifestyle data are food
consumption, physical exertion (e.g. exercise), medication intake and health
checks performed on the individual.
100071 In view of the foregoing and in accordance with one aspect, there is
provided a
method of operating an analyte measurement device having a display, user
interface, processor, memory and user interface buttons, the method can be
achieved by measuring an analyte with the analyte measurement device;
displaying a value representative of the analyte; presenting one of a
plurality
of predetermined flags; querying a user to select the predetermined flag to
associate the flag with the value; and pressing only one of the user interface
buttons once to store the predetermined flag with the value in the memory of
the device.
[00081 In one embodiment, there is provided a method of operating an
analyte
measurement device having a display, user interface, processor, memory and
user interface buttons, the method comprising: measuring an analyte with the
analyte measurement device; displaying a value representative of the analyte;
automatically displaying by the analyte measurement device one of a plurality
of predetermined flags that includes a before meal flag, an after meal flag, a
fasting flag, or a blank flag depending on when the measuring step is taken
during a day by the analyte measurement device, including a fasting flag being
set as a default flag whenever a measurement is taken in an early morning
3
CA 02675227 2016-05-16
period as determined by an internal clock of the measurement device and
further including before meal or after meal flag set as a default flag near
meal
times as determined by the internal clock of the measurement device; querying
a user to select the one predetermined flag shown on the display by the
displaying step to associate the one predetermined flag with the value; and
pressing only one of the user interface buttons once to store the one
predetermined flag with the value of the analyte in the memory of the device.
[0009] The user interface buttons may include an up button, a down button,
and an
OK button; the plurality of predetermined flags may include a before meal
flag, an after meal flag, a fasting flag, or a blank flag; the querying can
include
pressing a user interface button to select another of the plurality of
predetermined flags; the querying may include always querying a user
whenever a measuring step has been completed; the querying may include
querying a user whenever a measuring step indicates that an analyte value is
outside a predetermined range; the pressing may include storing in memory the
date and time at the completion of the measuring step along with the selected
flag.
[0010] In one variation, the measuring may include inserting a test strip
into a strip
port provided by the measurement device; and depositing a blood sample on a
testing portion of the test strip without entering a calibration parameter for
the
test strip.
[0011] In another variation, the measuring may include inserting a test
strip into a
strip port provided by the measurement device; inputting a calibration
parameter for the test strip via the user interface buttons of the device; and
depositing a blood sample on a testing portion of the test strip; the
inserting
may include turning on the measurement device when the strip is fully inserted
into the strip port.
4
CA 02675227 2016-05-16
[0012] In an embodiment, the plurality of predetermined flags comprise a
comment
title, a plurality of comments, comment page number, no comment, not enough
food, too much food, mild exercise, strenuous exercise, medication, stress,
illness, hypoglycemic state, menses, vacation, and combinations thereof; and
in another variation, a plurality of menus is displayed. In one variation, one
of
a plurality of menus may include a prompt for last result, all results,
averages,
and settings.
[0013] In an embodiment, a plurality of menus comprises a prompt for all
results
average, meal averages, and fasting averages.
[0014] In an embodiment, displaying comprises exhibiting a message of a
value less
than a predetermined value.
[0015] In an embodiment, displaying comprises exhibiting a message of a
value
higher than a predetermined value.
[0016] In an embodiment, pressing comprises storing the predetermined flag
with the
message.
[0017] In yet another embodiment, a glucose measurement device is provided
that
may include a glucose measurement unit, display, processor and memory. The
measurement unit is configured to provide signals indicative of glucose
amount in a fluid sample. The processor is coupled to the display, glucose
measurement unit, memory and user interface buttons so that, upon receipt of
signals representing a glucose amount in a fluid sample from the measurement
unit, the display exhibits one of a plurality of predetermined flags and the
user
interface buttons are operable to associate the one predetermined flag with
the
glucose amount in the memory with only one of the user interface buttons.
[0018] In view of the foregoing and in accordance with another aspect,
there is
provided a method of operating an analyte measurement device having a
display, user interface, processor, memory and user interface buttons, the
CA 02675227 2016-05-16
method can be achieved by measuring an analyte with the analyte
measurement device; displaying a value representative of the analyte; querying
a user to select a predetermined flag to associate the predetermined flag with
the value whenever the measuring is completed; ignoring activation of any of
the user interface buttons except for a selected button; and associating the
value with the predetermined flag upon activation of the selected button in
the
memory of the device.
[0019] In an embodiment, querying comprises repetitively flashing on the
display an
icon representative of the selected user interface buttons to prompt a
selection
of such user interface button.
[0019A] In one embodiment, there is provided a method of operating an analyte
measurement device having a display, user interface, processor, memory and
user interface buttons, the method comprising: measuring an analyte with the
analyte measurement device; displaying a value representative of the analyte;
presenting a default flag from a plurality of predetermined flags depending on
when the measuring step is taken at various time periods in a day, the
presenting including displaying a fasting flag as a default flag whenever a
measurement is taken in an early morning period as determined by an internal
clock of the measurement device and further displaying before meal or after
meal flag set as a default flag near meal times as determined by the internal
clock of the measurement device; querying a user to select the default flag to
associate the default flag with the value; and pressing only one of the user
interface buttons once to store the default flag with the value of the analyte
in
the memory of the device.
[0020] These and other embodiments, features and advantages will become
apparent
to those skilled in the art when taken with reference to the following more
detailed description of the invention in conjunction with the accompanying
drawings that are first briefly described.
Brief Description of the Figures
5a
CA 02675227 2009-08-11
[0021] The accompanying drawings, which are incorporated herein and
constitute part of this specification, illustrate presently preferred
embodiments of the invention, and, together with the general description
given above and the detailed description given below, serve to explain
features
of the invention (wherein like numerals represent like elements), of which:
[0022] Figure 1 is an exemplary plan view of an analyte measurement
device,
according to an embodiment.
[0023] Figure 2 is an exemplary block diagram illustrating the principal
internal components of an analyte measurement device, according to an
embodiment.
[0024] Figure 3 is an exemplary flow chart illustrating a method of
operating
an analyte measurement device, according to an embodiment.
[0025] Figure 4 is an exemplary flow chart illustrating a method of
operating
an analyte measurement device when only a single user interface button on
the analyte measurement device is active, according to an embodiment.
[0026] Figure 5 is an exemplary flow chart illustrating a method of
operating
an analyte measurement device where a user is queried when an analyte
value is outside a predetermined range, according to an embodiment.
[0027] Figure 6 is an exemplary flow chart illustrating a method of
operating
an analyte measurement device where a predetermined flag, an analyte value,
and the date and time of a measurement are stored in the memory of the
analyte measurement device, according to an embodiment.
[0028] Figure 7 is an exemplary flow chart illustrating a method of
operating
an analyte measurement device after inserting a test strip into a strip port
in
the analyte measurement device, according to an embodiment.
[0029] Figure 8 is an exemplary flow chart illustrating a method of
operating
an analyte measurement device after inserting a test strip into a strip port
in
the analyte measurement device and either entering or confirming calibration
parameters of the test strip, according to an embodiment.
6
CA 02675227 2009-08-11
[00301 Figure 9 is an exemplary flow chart illustrating a method of
operating
an analyte measurement device after inserting a test strip into a strip port
in
the analyte measurement device thereby turning the analyte measurement
device on, according to an embodiment.
[00311 Figure 10 is an exemplary flow chart illustrating an alternative
method
of operating an analyte measurement device where all but one user interface
buttons are ignored
[0032] Figure 11 is an exemplary flow chart illustrating a method of
operating
an analyte measurement device and actions taken by the analyte
measurement device, according to an embodiment.
[00331 Figure 12 illustrates a series of user interface screens used in a
method
of operating an analyte measurement device, according to an embodiment.
[00341 Figure 13 illustrates various navigation paths for the selection of
various predetermined flags.
[0035] Figures 14A-14D illustrate various user interface screens that can
be
used to display respective warning messages instead of a numerical value for
a blood glucose measurement along with a flag that can be associated with the
warning message.
[00361 Figures 15A-151 illustrate various user interface screens to provide
additional statistical information regarding blood glucose measurements.
Detailed Description of the Figures
[00371 The following detailed description should be read with reference to
the
drawings, in which like elements in different drawings are identically
numbered. The drawings, which are not necessarily to scale, depict selected
embodiments and are not intended to limit the scope of the invention. The
detailed description illustrates by way of example, not by way of limitation,
the principles of the invention. This description will clearly enable one
skilled
in the art to make and use the invention, and describes several embodiments,
7
CA 02675227 2009-08-11
adaptations, variations, alternatives and uses of the invention, including
what
is presently believed to be the best mode of carrying out the invention.
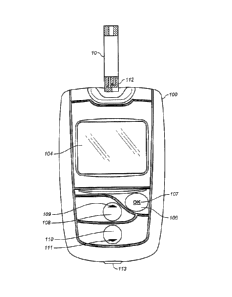
[0038] Figure 1 illustrates an analyte measurement device 100, for testing
glucose levels in the blood of an individual. Analyte measurement device 100
may include user interface buttons (106, 108, 110) for entry of data,
navigation of menus, and execution of commands. Data can include values
representative of analyte concentration, and/or information, which are related
to the everyday lifestyle of an individual. Information, which is related to
the
everyday lifestyle, can include food intake, medication use, the occurrence of
health check-ups and general health condition and exercise levels of an
individual. Analyte measurement device 100 also may include display 104.
Display 104 can be used to report measured glucose levels, and to facilitate
entry of lifestyle related information.
[0039] Analyte measurement device 100 may include first user interface
button 106, second user interface button 108, and third user interface button
110. User interface buttons 106, 108, and 110 facilitate entry and analysis of
data stored in the testing device, enabling a user to navigate through the
user
interface displayed on display 104. User interface buttons 106, 108, and 110
include first marking 107, second marking 109, and third marking 111, which
help in correlating user interface buttons to characters on display 104.
[0040] Analyte measurement device 100 can be turned on by inserting a test
strip 10 into data port 113, by pressing and briefly holding first user
interface
button 106, or when data traffic is detected across data port 113. Analyte
measurement device 100 can be switched off by removing the test strip 10,
pressing and briefly holding first user interface button 106, navigating to
and
selecting a meter off option from a main menu screen, or by not pressing any
buttons for a predetermined time. Display 104 can optionally include a
backlight.
[0041] Data port 113 accepts a suitable connector attached to a connecting
lead, thereby allowing analyte measurement device 100 to be linked to an
8
-
CA 02675227 2009-08-11
external device such as a personal computer. Data port 113 can be any port
that allows for transmission of data (serial or parallel) such as, for
example,
serial or parallel port in wired or wireless form. A personal computer,
running
appropriate software, allows entry and modification of set-up information
(e.g.
the current time, date, and language), and can perform analysis of data
collected by analyte measurement device 100. In addition, the personal
computer may be able to perform advanced analysis functions, and/or
transmit data to other computers (i.e. over the internet) for improved
diagnosis and treatment. Connecting analyte measurement device 100 with a
local or remote computer facilitates improved treatment by health care
providers.
[0042] Referring to Figure 2, an exemplary internal layout of analyte
measurement device 100 is shown. Analyte measurement device 100 may
include a processor 200, which in some embodiments described and illustrated
herein is a 32-bit RISC microcontroller. In other embodiments described and
illustrated herein, processor 200 is selected preferably from the MSP 430
family of ultra-low power microcontrollers manufactured by Texas
Instruments of Dallas, Texas. The processor can be bi-directionally connected
via I/O ports 214 to memory 202, which in some embodiments described and
illustrated herein is an EEPROM. Also connected to processor 200 via I/O
ports 214 are the data port 113, the user interface buttons 106, 108, and 110,
and a display driver 236. Data port 113 can be connected to processor 200,
thereby enabling transfer of data between memory 202 and an external
device, such as a personal computer. User interface buttons 106, 108, and 110
are directly connected to processor 200. Processor 200 controls display 104
via
display driver 236.
[0043] In embodiments described and illustrated herein, analyte measurement
device 100 may include an Application Specific Integrated Circuit (ASIC) 204,
providing electronic circuitry used in measurements of glucose level in blood
that has been applied to a test strip 10 inserted into strip port 112. Analog
9
CA 02675227 2009-08-11
voltages can pass to and from ASIC 204 by way of analog interface 205.
Analog signals from analog interface 205 can be converted to digital signals
by
AJD converter 216. Port 112, ASIC 204 and Analog Interface 205 constitute
= exemplarily an analyte measurement unit 206 that provides data regarding
analyte from a biological fluid sample deposited on strip 10. Processor 200
further comprises core 208, ROM 210 (containing computer code), RAM 212,
and clock 218. In one embodiment, the processor 200 is configured (or
programmed) to disable all of the user interface buttons except for a single
button upon a display of an analyte value by the display unit such as, for
example, during a time period after an analyte measurement. Where desired,
the processor 200 is configured (or programmed) to ignore any input from all
of the user interface buttons except for a single button upon a display of an
analyte value by the display unit.
[00441 Figure 3 is an exemplary flow chart illustrating a method of
operating
an analyte measurement device. Method 300 comprises steps 302, 304, 305,
306, and 308. In step 302, an analyte measuring device measures an analyte.
In step 304, the analyte measuring device displays a value representative of
the analyte. In step 305, the analyte measuring device presents one of a
plurality of predetermined flags. In step 306, the analyte measuring device
queries the user to select a predetermined flag to associate with the
displayed
value. In step 308, a single user interface button is pressed once, causing
the
predetermined flag and the displayed value to be stored in the memory of the
analyte measurement device. In any embodiment described and illustrated
herein, the analyte measurement device may include a display, a user
interface, a processor, a memory and user interface buttons. In any
embodiments described and illustrated herein, querying may include
repetitively flashing on the display an icon representative of one of the user
interface buttons to prompt a selection of such user interface button. In any
embodiment described and illustrated herein, the icon may be selected from a
CA 02675227 2009-08-11
group consisting of a first triangle and a second triangle having a smaller
area
than the first triangle.
[0045] Figure 4 is an exemplary flow chart illustrating a method of
operating
an analyte measurement device when only a single user interface button on
the analyte measurement device is active. Method 400 comprises steps 402,
404, 406, 408, and 410. In step 402, an analyte measuring device measures an
analyte. In step 404, the analyte measuring device displays a value
representative of the analyte. In step 406, the analyte measuring device
queries the user to select a flag to associate with the displayed value. In
step
408, the analyte measuring device deactivates all but a single user interface
button. In step 410, the active user interface button is pressed once, causing
the flag and the displayed value to be stored in the memory of the analyte
measurement device. In any embodiment described and illustrated herein,
user interface buttons may include an "up" button, a "down" button, and an
"enter" or "OK" button. In any embodiment described and illustrated herein,
user selectable flags may include a before meal flag, an after meal flag, a
fasting flag, or a blank flag. In any embodiment described and illustrated
herein, queries may be used whenever a measuring step has been completed.
[0046] Figure 5 is an exemplary flow chart illustrating a method of
operating
an analyte measurement device where a user is queried when an analyte
value is outside a predetermined range. Method 500 comprises steps 502, 504,
505, 506, and 508. In step 502, an analyte measuring device measures an
analyte. In step 504, the analyte measuring device displays a value
representative of the analyte. In step 505, the analyte measuring device
presents one of a plurality of predetermined flags. In step 506, the analyte
measuring device queries the user to select a predetermined flag to associate
with the displayed value when the displayed value is outside a predetermined
range. In step 508, a single user interface button is pressed once, causing
the
predetermined flag and the displayed value to be stored in the memory of the
analyte measurement device.
11
CA 02675227 2009-08-11
[0047] Figure 6 is an exemplary flow chart illustrating a method of
operating
an analyte measurement device where a predetermined flag, an analyte value,
and the date and time of a measurement are stored in the memory of the
analyte measurement device. Method 600 may include steps 602, 604, 605,
606, and 608. In step 602, an analyte measuring device measures an analyte.
In step 604, the analyte measuring device displays a value representative of
the analyte. In step 605, the analyte measuring device presents one of a
plurality of predetermined flags. In step 606, the analyte measuring device
queries the user to select a predetermined flag to associate with the
displayed
value. In step 608, a single user interface button is pressed once, causing
the
predetermined flag, the displayed value, and the date and time at the
completion of the measurement to be stored in the memory of the analyte
measurement device. In any embodiment described and illustrated herein, the
analyte measuring device may include a glucose meter.
[0048] Figure 7 is an exemplary flow chart illustrating a method of
operating
an analyte measurement device after inserting a test strip 10 into a strip
port
113 in the analyte measurement device. Method 700 may include steps 702,
704, 706, 707, 708, and 710. In step 702, a test strip 10 is inserted into a
strip
port in an analyte measurement device. In step 704, blood is applied to a test
portion (the portion distal from the strip port 112) of the test strip 10
without
entering or confirming calibration parameters of the test strip 10. In step
706,
the analyte measuring device displays a value representative of the analyte.
In step 707, the analyte measuring device presents one of a plurality of
predetermined flags. In step 708, the analyte measuring device queries the
user to select a predetermined flag to associate with the displayed value. In
step 710, a single user interface button is pressed once, causing the
predetermined flag and the displayed value to be stored in the memory of the
analyte measurement device. In any embodiment described and illustrated
herein, measuring may include: inserting a test strip 10 into a strip port in
the
analyte measurement device, then depositing a sample of blood on a testing
12
CA 02675227 2009-08-11
portion of the test strip 10 without entering a calibration parameter for the
test strip 10.
[00491 Figure 8 is an exemplary flow chart illustrating a method of
operating
an analyte measurement device after inserting a test strip 10 into a strip
port
in the analyte measurement device and either entering or confirming
calibration parameters of the test strip 10. Method 800 may include steps 802,
804, 806, 807, 808, and 810. In step 802, a test strip 10 is inserted into a
strip
port in an analyte measurement device. In step 804, blood is applied to a test
portion of the test strip 10 after entering or confirming calibration
parameters
of the test strip 10. In step 806, the analyte measuring device displays a
value
representative of the analyte. In step 807, the analyte measuring device
presents one of a plurality of predetermined flags. In step 808, the analyte
measuring device queries the user to select a predetermined flag to associate
with the displayed value. In step 810, a single user interface button is
pressed
once, causing the predetermined flag and the displayed value to be stored in
the memory of the analyte measurement device. In any embodiment described
and illustrated herein, measuring may include: inserting a test strip 10 into
a
strip port in the measurement device; inputting a calibration parameter for
the test strip 10 via the user interface buttons of the device; and depositing
a
blood sample on a testing portion of the test strip 10.
[00501 Figure 9 is an exemplary flow chart illustrating a method of
operating
an analyte measurement device after inserting a test strip 10 into a strip
port
in the analyte measurement device thereby turning the analyte measurement
device on. Method 900 may include steps 902, 904, 906, 907, 908, and 910. In
step 902, a test strip 10 is inserted into a strip port in an analyte
measurement device, thereby turning it on. In step 904, blood is applied to a
test portion of the test strip 10 without entering or confirming calibration
parameters of the test strip 10. In step 906, the analyte measuring device
displays a value representative of the analyte. In step 907, the analyte
measuring device presents one of a plurality of predetermined flags. In step
13
_
CA 02675227 2009-08-11
=
908, the analyte measuring device queries the user to select a predetermined
flag to associate with the displayed value. In step 910, a single user
interface
button is pressed once, causing the predetermined flag and the displayed
value to be stored in the memory of the analyte measurement device. In any
embodiment described and illustrated herein, inserting may include turning
on the measurement device when the strip is fully inserted into the strip
port.
In any embodiment described and illustrated herein, one of a plurality of user
selectable predetermined flags may be selected from a group consisting
essentially of at least one of a comment title, a plurality of comments,
comment page number, no comment, not enough food, too much food, mild
exercise, strenuous exercise, medication, stress, illness, hypoglycemic state,
menses, vacation, and combinations thereof. In any embodiment described and
illustrated herein, a plurality of menus may be displayed. In any embodiment
described and illustrated herein, one of a plurality of menus may include a
prompt for last result, all results, result average, and set up. In any
embodiment described and illustrated herein, a plurality of menus may
include a display of a prompt for all results average, before meal average,
after meal average.
[0051] In an alternative embodiment, certain keys on the meter can
be
disabled or ignored to ensure simplicity in the operation of the device. For
example, in Figure 10, all but one user interface buttons are ignored. Method
1000 may include steps 1002, 1004, 1006, 1008, and 1010. In step 1002, an
analyte measuring device measures an analyte. In step 1004, the analyte
measuring device displays a value representative of the analyte. In step 1006,
the analyte measuring device queries the user to select a flag to associate
with
the displayed value whenever measuring is completed. In step 1008, the
analyte measuring device ignores activation of all but a single user interface
button. In step 1010, the single non-ignored user interface button is pressed
once, causing the flag and the displayed value to be stored in the memory of
the analyte measurement device.
14
_
CA 02675227 2009-08-11
[0052] Figure 11 is an exemplary flow chart illustrating a method of
operating
an analyte measurement device and actions taken by the analyte
measurement device. Method 1100 may include steps 1102, 1104, 1106, 1108,
1110, 1112, 1114, 1116,1118, and 1120. In step 1102, a user inserts a test
strip 10 into a strip port in an analyte measurement device. In step 1104, the
analyte measuring device turns on. In step 1106, the analyte measuring
device displays an LCD check screen. In step 1108, the analyte measuring
device displays a sample application prompt. In step 1110, the user applies
sample to the test strip 10. In step 1112, the analyte measuring device
displays a series of countdown screens. In step 1114, the analyte measuring
device displays a value representative of the analyte and queries the user to
select one of a plurality of predetermined flags to associate with the
displayed
value. In step 1116, the user selects a predetermined flag, causing the
predetermined flag and the displayed value to be stored in the memory of the
analyte measurement device. In step 1118, the analyte measurement device
displays a predetermined flag confirmation. In step 1120, the analyte
measurement device turns off after a predetermined time, without interaction
from the user.
[0053] Figure 12 illustrates a series of user interface screens displayed
during
a method of operating an analyte measurement device. Method 1200 may
include screens 1202, 1204, 1206, 1208, 1210, 1212, 1214, 1216A, 1216B,
1216C, 1216D, 1220A, 12208, 1220C, and 1220D. In screens 1202 and 1204,
the user is prompted to apply sample to a test strip 10 that has been inserted
into a strip port in an analyte measurement device. In screen 1202 an icon
symbolizing a drop of blood is displayed, while in screen 1204 there is no
icon
symbolizing a drop of blood. Screens 1202 and 1204 are alternated, creating
the impression of a blinking drop of blood. Once sample is applied to the test
strip 10, screens 1206, 1208, 1210, 1212, and 1214 are displayed, in
succession. Screens 1206 through 1214 provide a countdown to result that is
approximately 5 seconds in duration. In screens 1216A through 1216D, the
,S16 e tea
CA 02675227 2009-08-11
analyte measuring device displays a value representative of the analyte and
queries the user to select one of a plurality of predetermined flags to
associate
with the displayed value. A user can alternate between screens 1216A through
1216D by pressing a user interface button, such as the up button or the down
button. Screen 1216A may include after meal flag 1215A, screen 1216B may
include fasting flag 1215B, screen 1216C may include before meal flag 1215C,
and screen 12160 may include blank flag 1215D. Any one of flags 1215A
through 1215D can be selected by pressing a user interface button (such as,
for example, an OK button) while the flag is displayed. Once a flag is
selected,
one of screens 1220A through 1220D is displayed. Screen 1220A is displayed
when after meal flag 1215A is selected, screen 1220B is displayed when
fasting flag 1215B is selected, screen 1220C is displayed when before meal
flag
1215C is selected, and screen 1220D is displayed when blank flag 12150 is
selected. Screens 1220A through 1220C include confirmation icons 1221A
through 1221C, indicating that the corresponding flag has been selected. In
any embodiments described and illustrated herein, querying may include
repetitively flashing on the display an icon representative of a single user
interface button to prompt selection of the single user interface button.
[0054] Referring to Figure 13, the flags can be selected by using the up
and
down keys of the meter. Alternatively, the various flags can be automatically
displayed for selection as a default flag depending on when a blood glucose
measurement is taken during various time periods in a day. For example, in
one embodiment, a "fasting" flag can be set as a default flag automatically
whenever a measurement is taken in the early morning period as determined
by the internal clock of the meter 100. A "before meal" flag can be the
default
flag displayed upon the measurement around certain time periods near meal
times. Likewise, an "after meal" flag can be set to be displayed as a default
flag for selection by the user whenever a measurement is taken at certain
times of the day.
16
_ _ _
CA 02675227 2009-08-11
[00551 Referring to Figures 14A and 14B, where a measurement exceeds a
certain range, a warning message can be displayed and a flag can be
associated with such warning message. For example, in Figure 14A, where
the measurement exceeds a certain preset value for a test strip, a warning
message of "High Glucose" is displayed. An appropriate flag can be
automatically displayed or selected manually by the user as described above.
In the example of Figure 14A, an "After Meal" flag is displayed and a query in
the form of a question mark is presented to the user. In Figure 14B, a
"fasting" flag can be displayed with a query for the selection of the flag to
be
associated with the measurement. Figures 14C and 14D illustrate a warning
message with examples of the flags that can be associated with a low glucose
value. As noted earlier, the time at which such measurement was taken along
with the flag selected can be stored in memory for later retrieval by the user
or a health care provider for later analysis.
[00561 Referring to Figures 15A-151, various screens can be accessed by the
users or health care provider to provide statistical data utilized in the
treatment of diabetes. As shown in Figure 15A, a main menu screen allows a
user to access various statistical data regarding the blood glucose
measurement stored on the meter 100 along with various flags associated
therewith, the time, date, year, and any other data useful in the treatment of
diabetes.
[0057] For example, the meter can be configured to display the following
screens in the main menu: "Last Result"; "All Results"; "Averages"; and
"Settings." Where the "Last Result" screen is selected, the meter allows for
accessing of the latest result stored in the meter; a selection of "All
Results"
screen allow for all glucose measurement results stored on the meter to be
provided for a complete record to the user, shown here in Figure 15B where
display screen size permitting, four or more results can be displayed at one
time; the average of blood glucose data associated with a specific flag can
also
be obtained with selection of the "Averages" screen.
17
_
_
CA 02675227 2009-08-11
[0058] Referring to Figure 150, an "All Results Average" menu can be
selected
to provide, for example, an average of all blood glucose results stored in the
meter. Alternatively, the screen can be configured to provide for a median
value of the blood glucose value from all of the results stored in the meter
instead of an average. Where this screen is highlighted and selected in
Figure 150, a screen, shown in Figure 15D is displayed showing various
averages by different categories such as, for example, within the last 7, 14,
or
30 days and the average (or median) of the blood glucose value within each
time period (e.g., date time year) and whether such value was before ("BFR")
or after ("AFT") a meal. Where there are not enough data to display the
average in the various time periods, the display will shown, as in Figure 15E,
dashed lines indicating insufficient data.
[0059] Referring to Figure150 where the "Meal Averages" screen is
selected,
the display is configured to display, as shown here in Figure 15F of the meal
averages (or median) of the measured glucose value by different time periods
and whether the average was before or after a meal. Again, where there is
insufficient data, the screen will display dashed lines indicating the same in
Figure 15G.
[0060] The fasting average of blood glucose measured can also be
obtained by
selecting the "Fasting Average" screen in Figure 150 by the user, which would
then be shown in Figure 15H in various time periods. As before, the meter
can display the median instead of average glucose value. Where there is
insufficient data, the display will indicate the same by a series of dashed
lines
as shown in Figure 151.
[0061] In conclusion, the testing device and methods described and
illustrated
herein significantly reduce obstacles associated with maintaining an accurate
record of an individual's blood glucose testing and lifestyle. The various
embodiments of the present invention is believed to promote frequent
monitoring for diabetic individuals by providing a simple, efficient way of
recording not only blood glucose levels, but other information which is likely
to
18
_ _
CA 02675227 2016-05-16
affect an individual's prognosis. By logging glucose and lifestyle information
in
the manner described herein, the testing device and methods described and
illustrated herein provide an effective record keeping system.
[0062] Where methods and steps described above indicate certain events
occurring
in certain order, those of ordinary skill in the art will recognize that the
ordering
of certain steps may be modified and that such modifications are in accordance
with the variations of the invention. Additionally, certain of the steps may
be
performed concurrently in a parallel process when possible, as well as
performed
sequentially as described above.
[00631 The scope of the claims may be given the broadest interpretation
consistent
with the description as a whole.
19