Note: Descriptions are shown in the official language in which they were submitted.
CA 02738178 2011-03-23
WO 2010/034119 PCT/CA2009/001356
TOUCH-INPUT SYSTEM CALIBRATION
Field of the Invention
[0001] The present invention relates generally to interactive input systems
and
in particular, to a method for calibrating an interactive input system and an
interactive
input system executing the calibration method.
Background of the Invention
[0002] Interactive input systems that allow users to inject input (eg. digital
ink, mouse events etc.) into an application program using an active pointer
(eg. a
pointer that emits light, sound or other signal), a passive pointer (eg. a
finger, cylinder
or other suitable object) or other suitable input device such as for example,
a mouse or
trackball, are known. These interactive input systems include but are not
limited to:
touch systems comprising touch panels employing analog resistive or machine
vision
technology to register pointer input such as those disclosed in U.S. Patent
Nos.
5,448,263; 6,141,000; 6,337,681; 6,747,636; 6,803,906; 7,232,986; 7,236,162;
and
7,274,356 assigned to SMART Technologies ULC of Calgary, Alberta, Canada,
assignee of the subject application, the contents of which are incorporated by
reference; touch systems comprising touch panels employing electromagnetic,
capacitive, acoustic or other technologies to register pointer input; tablet
personal
computers (PCs); laptop PCs; personal digital assistants (PDAs); and other
similar
devices.
[0003] Multi-touch interactive input systems that receive and process input
from multiple pointers using machine vision are also known. One such type of
multi-
touch interactive input system exploits the well-known optical phenomenon of
frustrated total internal reflection (FTIR). According to the general
principles of
FTIR, the total internal reflection (TIR) of light traveling through an
optical
waveguide is frustrated when an object such as a pointer touches the waveguide
surface, due to a change in the index of refraction of the waveguide, causing
some
light to escape from the touch point. In a multi-touch interactive input
system, the
machine vision system captures images including the point(s) of escaped light,
and
processes the images to identify the position of the pointers on the waveguide
surface
based on the point(s) of escaped light for use as input to application
programs. One
CA 02738178 2011-03-23
WO 2010/034119 PCT/CA2009/001356
-2-
example of an FTIR multi-touch interactive input system is disclosed in United
States
Patent Application Publication No. 2008/0029691 to Han.
[00041 In order to accurately register the location of touch points detected
in
the captured images with corresponding points on the display surface such that
a
user's touch points correspond to expected positions on the display surface, a
calibration method is performed. Typically during calibration, a known
calibration
image is projected onto the display surface. The projected image is captured,
and
features are extracted from the captured image. The locations of the extracted
features in the captured image are determined, and a mapping between the
determined
locations and the locations of the features in the known calibration image is
performed. Based on the mapping of the feature locations, a general
transformation
between any point on the display surface and the captured image is defined
thereby to
complete the calibration. Based on the calibration, any touch point detected
in a
captured image may be transformed from camera coordinates to display
coordinates.
[00051 FTIR systems display visible light images on a display surface, while
detecting touches using infrared light. IR light is generally filtered from
the displayed
images in order to reduce interference with touch detection. However, when
performing calibration, an infrared image of a filtered, visible light
calibration image
captured using the infrared imaging device has a very low signal-to-noise
ratio. As a
result, feature extraction from the calibration image is extremely
challenging.
[00061 It is therefore an object of an aspect of the following to provide a
novel
method for calibrating an interactive input system, and an interactive input
system
executing the calibration method.
Summary of the Invention
[00071 Accordingly, in one aspect there is provided a method of calibrating an
interactive input system, comprising:
receiving images of a calibration video presented on a touch panel of
the interactive input system;
creating a calibration image based on the received images;
locating features in the calibration image; and
CA 02738178 2011-03-23
WO 2010/034119 PCT/CA2009/001356
-3-
determining a transformation between the touch panel and the received
images based on the located features and corresponding features in the
calibration
video.
[0008] According to another aspect, there is provided an interactive input
system comprising a touch panel and processing structure executing a
calibration
method, said calibration method determining a transformation between the touch
panel and an imaging plane based on known features in a calibration video
presented
on the touch panel and features located in a calibration image created based
on
received images of the presented calibration video.
[0009] According to another aspect, there is provided a computer readable
medium embodying a computer program for calibrating an interactive input
device,
the computer program comprising:
computer program code receiving images of a calibration video
presented on a touch panel of the interactive input system;
computer program code creating a calibration image based on the
received images;
computer program code locating features in the calibration image; and
computer program code determining a transformation between the
touch panel and the received images based on the located features and
corresponding
features in the presented calibration video.
[00010] According to yet another aspect, there is provided a method for
determining one or more touch points in a captured image of a touch panel in
an
interactive input system, comprising:
creating a similarity image based on the captured image and an image
of the touch panel without any touch points;
creating a thresholded image by thresholding the similarity image
based on an adaptive threshold;
identifying one or more touch points as areas in the thresholded image;
and
refining the bounds of the one or more touch points based on pixel
intensities in corresponding areas in the similarity image.
CA 02738178 2011-03-23
WO 2010/034119 PCT/CA2009/001356
-4-
[00011] According to yet another aspect, there is provided an interactive
input
system comprising a touch panel and processing structure executing a touch
point
determination method, said touch point determination method determining one or
more touch points in a captured image of the touch panel as areas identified
in a
thresholded similarity image refined using pixel intensities in corresponding
areas in
the similarity image.
[00012] According to still yet another aspect, there is provided a computer
readable medium embodying a computer program for determining one or more touch
points in a captured image of a touch panel in an interactive input system,
the
computer program comprising:
computer program code creating a similarity image based on the
captured image and an image of the touch panel without any touch points;
computer program code creating a thresholded image by thresholding
the similarity image based on an adaptive threshold;
computer program code identifying one or more touch points as areas
in the thresholded image; and
computer program code refining the bounds of the one or more touch
points based on pixel intensities in corresponding areas in the similarity
image.
Brief Description of the Drawings
[00013] Embodiments will now be described more fully with reference to the
accompanying drawings in which:
[00014] Figure 1 is a perspective view of an interactive input system;
[00015] Figure 2a is a side sectional view of the interactive input system of
Figure 1;
[00016] Figure 2b is a sectional view of a table top and touch panel forming
part of the interactive input system of Figure 1;
[00017] Figure 2c is a sectional view of the touch panel of 2b, having been
contacted by a pointer;
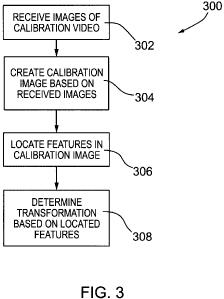
[00018] Figure 3 is a flowchart showing calibration steps undertaken to
identify
a transformation between the display surface and the image plane;
CA 02738178 2011-03-23
WO 2010/034119 PCT/CA2009/001356
-5-
[00019] Figure 4 is a flowchart showing image processing steps undertaken to
identify touch points in captured images;
[00020] Figure 5 is a single image of a calibration video captured by an
imaging device;
[00021] Figure 6 is a graph showing the various pixel intensities at a
selected
location in captured images of the calibration video;
[00022] Figures 7a to 7d are images showing the effects of anisotropic
diffusion for smoothing a mean difference image while preserving edges to
remove
noise;
[00023] Figure 8 is a diagram illustrating the radial lens distortion of the
lens of
an imaging device;
[000241 Figure 9 is a distortion-corrected image of the edge-preserved
difference image;
[00025] Figure 10 is an edge image based on the distortion-corrected image;
[00026] Figure 11 is a diagram illustrating the mapping of a line in an image
plane to a point in the Radon plane;
[00027] Figure 12 is an image of the Radon transform of the edge image;
[00028] Figure 13 is an image showing the lines identified as peaks in the
Radon transform image overlaid on the distortion-corrected image to show the
correspondence with the checkerboard pattern;
[00029] Figure 14 is an image showing the intersection points of the lines
identified in Figure 13;
[00030] Figure 15 is a diagram illustrating the mapping of a point in the
image
plane to a point in the display plane;
[00031] Figure 16 is a diagram showing the fit of the transformation between
the intersection points in the image plane and known intersection points in
the display
plane;
[00032] Figures 17a to 17d are images processed during determining touch
points in a received input image; and
[00033] Figure 18 is a graph showing the pixel intensity selected for adaptive
thresholding during image processing for determining touch points in a
received input
image.
CA 02738178 2011-03-23
WO 2010/034119 PCT/CA2009/001356
-6-
Detailed Description of the Embodiments
[00034] Turning now to Figure 1, a perspective diagram of an interactive input
system in the form of a touch table is shown and is generally identified by
reference
numeral 10. Touch table 10 comprises a table top 12 mounted atop a cabinet 16.
In
this embodiment, cabinet 16 sits atop wheels, castors or the like 18 that
enable the
touch table 10 to be easily moved from place to place as requested. Integrated
into
table top 12 is a coordinate input device in the form of a frustrated total
internal
reflection (FTIR) based touch panel 14 that enables detection and tracking of
one or
more pointers 11, such as fingers, pens, hands, cylinders, or other objects,
applied
thereto.
[00035] Cabinet 16 supports the table top 12 and touch panel 14, and houses
processing structure 20 (see Figure 2) executing a host application and one or
more
application programs. Image data generated by the processing structure 20 is
displayed on the touch panel 14 allowing a user to interact with the displayed
image
via pointer contacts on the display surface 15 of the touch panel 14. The
processing
structure 20 interprets pointer contacts as input to the running application
program
and updates the image data accordingly so that the image displayed on the
display
surface 15 reflects the pointer activity. In this manner, the touch panel 14
and
processing structure 20 allow pointer interactions with the touch panel 14 to
be
recorded as handwriting or drawing or used to control execution of the
application
program.
[00036] Processing structure 20 in this embodiment is a general purpose
computing device in the form of a computer. The computer comprises for
example, a
processing unit, system memory (volatile and/or non-volatile memory), other
non-
removable or removable memory (a hard disk drive, RAM, ROM, EEPROM, CD-
ROM, DVD, flash memory etc.) and a system bus coupling the various computer
components to the processing unit.
[00037] During execution of the host software application/operating system run
by the processing structure 20, a graphical user interface comprising a canvas
page or
palette (i.e. a background), upon which graphic widgets are displayed, is
displayed on
CA 02738178 2011-03-23
WO 2010/034119 PCT/CA2009/001356
-7-
the display surface of the touch panel 14. In this embodiment, the graphical
user
interface enables freeform or handwritten ink objects and other objects to be
input and
manipulated via pointer interaction with the display surface 15 of the touch
panel 14.
[00038] The cabinet 16 also houses a horizontally-oriented projector 22, an
infrared (IR) filter 24, and mirrors 26, 28 and 30. An imaging device 32 in
the form
of an infrared-detecting camera is mounted on a bracket 33 adjacent mirror 28.
The
system of mirrors 26, 28 and 30 functions to "fold" the images projected by
projector
22 within cabinet 16 along the light path without unduly sacrificing image
size. The
overall touch table 10 dimensions can thereby be made compact.
[00039] The imaging device 32 is aimed at mirror 30 and thus sees a reflection
of the display surface 15 in order to mitigate the appearance of hotspot noise
in
captured images that typically must be dealt with in systems having imaging
devices
that are directed at the display surface itself. Imaging device 32 is
positioned within
the cabinet 16 by the bracket 33 so that it does not interfere with the light
path of the
projected image.
[00040] During operation of the touch table 10, processing structure 20
outputs
video data to projector 22 which, in turn, projects images through the IR
filter 24 onto
the first mirror 26. The projected images, now with IR light having been
substantially
filtered out, are reflected by the first mirror 26 onto the second mirror 28.
Second
mirror 28 in turn reflects the images to the third mirror 30. The third mirror
30
reflects the projected video images onto the display (bottom) surface of the
touch
panel 14. The video images projected on the bottom surface of the touch panel
14 are
viewable through the touch panel 14 from above. The system of three mirrors
26, 28,
30 configured as shown provides a compact path along which the projected image
can
be channeled to the display surface. Projector 22 is oriented horizontally in
order to
preserve projector bulb life, as commonly-available projectors are typically
designed
for horizontal placement.
[00041] An external data port/switch, in this embodiment a Universal Serial
Bus (USB) port/switch 34, extends from the interior of the cabinet 16 through
the
cabinet wall to the exterior of the touch table 10 providing access for
insertion and
removal of a USB key 36, as well as switching of functions.
CA 02738178 2011-03-23
WO 2010/034119 PCT/CA2009/001356
-8-
1000421 The USB port/switch 34, projector 22, and imaging device 32 are each
connected to and managed by the processing structure 20. A power supply (not
shown) supplies electrical power to the electrical components of the touch
table 10.
The power supply may be an external unit or, for example, a universal power
supply
within the cabinet 16 for improving portability of the touch table 10. The
cabinet 16
fully encloses its contents in order to restrict the levels of ambient visible
and infrared
light entering the cabinet 16 thereby to facilitate satisfactory signal to
noise
performance. Doing this can compete with various techniques for managing heat
within the cabinet 16. The touch panel 14, the projector 22, and the
processing
structure are all sources of heat, and such heat if contained within the
cabinet 16 for
extended periods of time can reduce the life of components, affect performance
of
components, and create heat waves that can distort the optical components of
the
touch table 10. As such, the cabinet 16 houses heat managing provisions (not
shown)
to introduce cooler ambient air into the cabinet while exhausting hot air from
the
cabinet. For example, the heat management provisions may be of the type
disclosed
in U.S. Patent Application Serial No. 12/240,953 to Sirotich et al., filed on
September
29, 2008 entitled "TOUCH PANEL FOR INTERACTIVE INPUT SYSTEM AND
INTERACTIVE INPUT SYSTEM EMPLOYING THE TOUCH PANEL" and
assigned to SMART Technologies ULC of Calgary, Alberta, the assignee of the
subject application, the content of which is incorporated herein by reference.
[000431 As set out above, the touch panel 14 of touch table 10 operates based
on the principles of frustrated total internal reflection (FTIR), as described
in further
detail in the above-mentioned U.S. Patent Application Serial No. 12/240,953 to
Sirotich et al., referred to above. Figure 2b is a sectional view of the table
top 12 and
touch panel 14. Table top 12 comprises a frame 120 formed of plastic
supporting the
touch panel 14.
[00044] Touch panel 14 comprises an optical waveguide 144 that, according to
this embodiment, is a sheet of acrylic. A resilient diffusion layer 146, in
this
embodiment a layer of V-CARE V-LITE barrier fabric manufactured by Vintex
Inc. of Mount Forest, Ontario, Canada, or other suitable material lies against
the
optical waveguide 144.
CA 02738178 2011-03-23
WO 2010/034119 PCT/CA2009/001356
-9-
[00045] The diffusion layer 146, when pressed into contact with the optical
waveguide 144, substantially reflects the IR light escaping the optical
waveguide 144
so that the escaping IR light travels down into the cabinet 16. The diffusion
layer 146
also diffuses visible light being projected onto it in order to display the
projected
image.
[00046] Overlying the resilient diffusion layer 146 on the opposite side of
the
optical waveguide 144 is a clear, protective layer 148 having a smooth touch
surface.
In this embodiment, the protective layer 148 is a thin sheet of polycarbonate
material
over which is applied a hardcoat of Marriott material, manufactured by Tekra
Corporation of New Berlin, Wisconsin, U.S.A. While the touch panel 14 may
function without the protective layer 148, the protective layer 148 permits
use of the
touch panel 14 without undue discoloration, snagging or creasing of the
underlying
diffusion layer 146, and without undue wear on users' fingers. Furthermore,
the
protective layer 148 provides abrasion, scratch and chemical resistance to the
overall
touch panel 14, as is useful for panel longevity.
[00047] The protective layer 148, diffusion layer 146, and optical waveguide
144 are clamped together at their edges as a unit and mounted within the table
top 12.
Over time, prolonged use may wear one or more of the layers. As desired, the
edges
of the layers may be unclamped in order to inexpensively provide replacements
for
the worn layers. It will be understood that the layers may be kept together in
other
ways, such as by use of one or more of adhesives, friction fit, screws, nails,
or other
fastening methods.
[00048] An IR light source comprising a bank of infrared light emitting diodes
(LEDs) 142 is positioned along at least one side surface of the optical
waveguide 144
(into the page in Figure 2b). Each LED 142 emits infrared light into the
optical
waveguide 144. In this embodiment, the side surface along which the IR LEDs
142
are positioned is flame-polished to facilitate reception of light from the IR
LEDs 142.
An air gap of 1-2 millimetres (mm) is maintained between the IR LEDs 142 and
the
side surface of the optical waveguide 144 in order to reduce heat
transmittance from
the IR LEDs 142 to the optical waveguide 144, and thereby mitigate heat
distortions
in the acrylic optical waveguide 144. Bonded to the other side surfaces of the
optical
CA 02738178 2011-03-23
WO 2010/034119 PCT/CA2009/001356
-10-
waveguide 144 is reflective tape 143 to reflect light back into the optical
waveguide
144 thereby saturating the optical waveguide 144 with infrared illumination.
[00049] In operation, IR light is introduced via the flame-polished side
surface
of the optical waveguide 144 in a direction generally parallel to its large
upper and
lower surfaces. The IR light does not escape through the upper or lower
surfaces of
the optical waveguide 144 due to total internal reflection (TIR) because its
angle of
incidence at the upper and lower surfaces is not sufficient to allow for its
escape. The
IR light reaching other side surfaces is generally reflected entirely back
into the
optical waveguide 144 by the reflective tape 143 at the other side surfaces.
[00050] As shown in Figure 2c, when a user contacts the display surface of the
touch panel 14 with a pointer 11, the pressure of the pointer 11 against the
protective
layer 148 compresses the resilient diffusion layer 146 against the optical
waveguide
144, causing the index of refraction on the optical waveguide 144 at the
contact point
of the pointer 11, or "touch point," to change. This change "frustrates" the
TIR at the
touch point causing IR light to reflect at an angle that allows it to escape
from the
optical waveguide 144 in a direction generally perpendicular to the plane of
the
optical waveguide 144 at the touch point. The escaping IR light reflects off
of the
point 11 and scatters locally downward through the optical waveguide 144 and
exits
the optical waveguide 144 through its bottom surface. This occurs for each
pointer 1 1
as it contacts the display surface of the touch panel 114 at a respective
touch point.
1000511 As each touch point is moved along the display surface 15 of the touch
panel 14, the compression of the resilient diffusion layer 146 against the
optical
waveguide 144 occurs and thus escaping of IR light tracks the touch point
movement.
During touch point movement or upon removal of the touch point, decompression
of
the diffusion layer 146 where the touch point had previously been due to the
resilience
of the diffusion layer 146, causes escape of IR light from optical waveguide
144 to
once again cease. As such, IR light escapes from the optical waveguide 144
only at
touch point location(s) allowing the IR light to be captured in image frames
acquired
by the imaging device.
[00052] The imaging device 32 captures two-dimensional, IR video images of
the third mirror 30. IR light having been filtered from the images projected
by
projector 22, in combination with the cabinet 16 substantially keeping out
ambient
CA 02738178 2011-03-23
WO 2010/034119 PCT/CA2009/001356
-11-
light, ensures that the background of the images captured by imaging device 32
is
substantially black. When the display surface 15 of the touch panel 14 is
contacted by
one or more pointers as described above, the images captured by IR camera 32
comprise one or more bright points corresponding to respective touch points.
The
processing structure 20 receives the captured images and performs image
processing
to detect the coordinates and characteristics of the one or more bright points
in the
captured image. The detected coordinates are then mapped to display
coordinates and
interpreted as ink or mouse events by application programs running on the
processing
structure 20.
[00053] The transformation for mapping detected image coordinates to display
coordinates is determined by calibration. For the purpose of calibration, a
calibration
video is prepared that includes multiple frames including a black-white
checkerboard
pattern and multiple frames including an inverse (i.e., white-black)
checkerboard
pattern of the same size. The calibration video data is provided to projector
22, which
presents frames of the calibration video on the display surface 15 via mirrors
26, 28
and 30. Imaging device 32 directed at mirror 30 captures images of the
calibration
video.
[00054] Figure 3 is a flowchart 300 showing steps performed to determine the
transformation from image coordinates to display coordinates using the
calibration
video. First, the captured images of the calibration video are received (step
302).
Figure 5 is a single captured image of the calibration video. The signal to
noise ratio
in the image of Figure 5 is very low, as would be expected. It is difficult to
glean the
checkerboard pattern for calibration from this single image.
[00055] However, based on several received images of the calibration video, a
calibration image with a defined checkerboard pattern is created (step 304).
During
creation of the calibration image, a mean checkerboard image I, is created
based on
received images of the checkerboard pattern, and a mean inverse checkerboard
image
I;c is created based on received images of the inverse checkerboard pattern.
In order
to distinguish received images corresponding to the checkerboard pattern from
received images corresponding to the inverse checkerboard pattern, pixel
intensity of
a pixel or across a cluster of pixels at a selected location in the received
images is
monitored. A range of pixel intensities is defined, having an upper intensity
threshold
CA 02738178 2011-03-23
WO 2010/034119 PCT/CA2009/001356
-12-
and a lower intensity threshold. Those received images having, at the selected
location, a pixel intensity that is above the upper intensity threshold are
considered to
be images corresponding to the checkerboard pattern. Those received images
having,
at the selected location, a pixel intensity that is below the lower intensity
threshold are
considered to be images corresponding to the inverse checkerboard pattern.
Those
received images having, at the selected location, a pixel intensity that is
within the
defined range of pixel intensities, are discarded. In the graph of Figure 6,
the
horizontal axis represents, for a received set of images captured of the
calibration
video, the received image number, and the vertical axis represents the pixel
intensity
at the selected pixel location for each of the received images. The upper and
lower
intensity thresholds defining the range are also shown in Figure 6.
100056] The mean checkerboard image I, is formed by setting each of its pixels
as the mean intensity of corresponding pixels in each of the received images
corresponding to the checkerboard pattern. Likewise, the mean inverse
checkerboard
image I,; is formed by setting each of its pixels as the mean intensity of
corresponding
pixels in each of the received images corresponding to the inverse
checkerboard
pattern.
[00057] The mean checkerboard image I, and the mean inverse checkerboard
image k; are then scaled to the same intensity range [0,1 ]. A mean
difference, or
"grid" image d, as shown in Figure 7a, is then created using the mean
checkerboard
and mean inverse checkerboard images Ic and I;,, according to Equation 1,
below:
d= IC - I;c (1)
1000581 The mean grid image is then smoothed using an edge preserving
smoothing procedure in order to remove noise while preserving prominent edges
in
the mean grid image. In this embodiment, the smoothing, edge-preserving
procedure
is an anisotropic diffusion, as set out in the publication by Perona et al.
entitled
"Scale-Space And Edge Detection Using Anisotropic Diffusion"; 1990, IEEE
TPAMI, vol. 12, no. 7, 629-639, the content of which is incorporated herein by
reference in its entirety.
[00059] Figures 7b to 7d show the effects of anisotropic diffusion on the mean
grid image shown in Figure 7a. Figure 7b shows the mean grid image after
having
undergone ten (10) iterations of the anisotropic diffusion procedure, and
Figure 7d
CA 02738178 2011-03-23
WO 2010/034119 PCT/CA2009/001356
-13-
shows an image representing the difference between the mean grid image in
Figure 7a
and the resultant smoothed, edge-preserved mean grid image in 7b, thereby
illustrating the mean grid image after non-edge noise has been removed. Figure
7c
shows an image of the diffusion coefficient c(x,y) and thereby illustrates
where
smoothing is effectively limited in order to preserve edges. It can be seen
from Figure
7c that smoothing is limited at the grid lines in the edge image.
1000601 With the mean grid image having been smoothed, a lens distortion
correction of the mean grid image is performed in order to correct for
"pincushion"
distortion in the mean grid image that is due to the physical shape of the
lens of the
imaging device 32. With reference to Figure 8, lens distortion is often
considered a
combination of both radial and tangential effects. For short focal length
applications
such as in the case with imaging device 32, the radial effects dominate.
Radial
distortion occurs along the optical radius r.
1000611 The normalized, undistorted image coordinates (x',y') are calculated
as
shown in Equations 2 and 3, below:
x'= xn(1+K,r2+K2r4+K3r6) (2)
Y,= yn(1+K,r2+K2r4+K3r6) (3)
where:
x - xO and (4)
x =
-
n f
(5)
_ y - yo
yn f
are normalized, distorted image coordinates;
r2=(x-x0)2+(y-y0)2 ; (6)
(x0, yo) is the principal point;
f is the imaging device focal length; and
K1, K2 and K3 are distortion coefficients.
[00062] The de-normalized and undistorted image coordinates (x,,, yõ) are
calculated according to Equations 7 and 8, below:
XU = fx'+ x0 (7)
yu =fy + y0 (8)
CA 02738178 2011-03-23
WO 2010/034119 PCT/CA2009/001356
-14-
[00063] The principal point (xO,yO) , the focal length f and distortion
coefficients K), K2 and K3 parameterize the effects of lens distortion for a
given lens
and imaging device sensor combination. The principal point, (xo,yo) is the
origin for
measuring the lens distortion as it is the center of symmetry for the lens
distortion
effect. As shown in Figure 8, the undistorted image is larger than the
distorted image.
A known calibration process set out by Bouguet in the publication entitled
"Camera
Calibration Toolbox For Matlab"; 2007,
http://www.vision.caltech.edu/bouguetj/calih doc/index.html, the content of
which is
incorporated by reference herein in its entirety, may be employed to determine
distortion coefficients Ki, K2 and K3.
[00064] It will be understood that the above distortion correction procedure
is
performed also during image processing when transforming images received from
the
imaging device 32 during use of the interactive input system 10.
[00065] With the mean grid image having been corrected for lens distortion as
shown in Figure 9, an edge detection procedure is performed to detect grid
lines in the
mean grid image. Prior to performing edge detection, a sub-image of the
undistorted
mean grid image is created by cropping the corrected mean grid image to remove
strong artifacts at the image edges, which can be seen also in Figure 9,
particularly at
the top left and top right corners. The pixel intensity of the sub-image is
then rescaled
to the range of [0,1 ].
[00066] With the sub-image having been created and rescaled, Canny edge
detection is then performed in order to emphasize image edges and reduce
noise.
During Canny edge detection, an edge image of the scaled sub-image is created
by,
along each coordinate, applying a centered difference, according to Equations
9 and
10, below:
+i (9)
az l 2
2
where:
I represents the scaled sub-image; and
Ii,i is the pixel intensity of the scaled sub-image at position (i,j).
CA 02738178 2011-03-23
WO 2010/034119 PCT/CA2009/001356
-15-
[00067) With Canny edge detection, non-maximum suppression is also
performed in order to remove edge features that would not be associated with
grid
lines. Canny edge detection routines are described in the publication entitled
"MA' TLAB Functions for Computer Vision and Image Analysis ", Kovesi, P. D.,
2000;
School of Computer Science & Software Engineering, The University of Western
Australia, http://www.csse.uwa.edu.au/-I)k/research/matlabfns/, the content of
which
is incorporated herein by reference in its entirety. Figure 10 shows a
resultant edge
image that is used as the calibration image for subsequent processing.
[00068) With the calibration image having been created, features are located
in
the calibration image (step 306). During feature location, prominent lines in
the
calibration are identified and their intersection points are determined in
order to
identify the intersection points as the located features. During
identification of the
prominent lines, the calibration image is transformed into the Radon plane
using a
Radon transform. The Radon transform converts a line in the image place to a
point
in the Radon plane, as shown in Figure 11. Formally, the Radon transform is
defined
according to Equation 11, below:
R(p,0)= f rF(x,y)6(p-xcos(0)-ysin(6))dxdy (11)
where: J J
F(x,y) is the calibration image;
6 is the Dirac delta function; and
R(p,0) is a point in the Radon plane that represents a line in the image
plane for F(x,y) that is a distance p from the center of image F to the point
in the line
that is closes to the center of the image F, and at an angle 0 with respect to
the x-axis
of the image plane.
[00069] The Radon transform evaluates each point in the calibration image to
determine whether the point lies on each of a number of "test" lines xcos(0) +
ysin(0)
= p over a range of line angles and distances from the center of the
calibration image,
wherein the distances are measured to the line's closest point. As such,
vertical lines
correspond to an angle 0 of zero (0) radians whereas horizontal lines
correspond to an
angle 0 of it/2 radians.
[00070] The Radon transform may be evaluated numerically as a sum over the
calibration image at discrete angles and distances. In this embodiment, the
evaluation
CA 02738178 2011-03-23
WO 2010/034119 PCTICA2009/001356
-16-
is conducted by approximating the Dirac delta function as a narrow Gaussian of
width
a=1 pixel, and performing the sum according to Equation 12, below:
N
v
x N l_(P-x.cos(0)- ~sin(0))2//1111 I (12)
`
F(x,,yj)e
I
,=j j i
where:
the range of p is from -150 to 150 pixels; and
the range of 0 is from -2 to 2 radians.
1000711 The ranges set out above for p and 0 enable isolation of the generally
vertical and generally horizontal lines, thereby removing from consideration
those
lines that are unlikely to be grid lines and thereby reducing the amount of
processing
by the processing structure 20.
1000721 Figure 12 is an image of an illustrative Radon transform image R(p, 0)
of the calibration image of Figure 10, with the angle 0 on the horizontal axis
ranging
from -2 and 2 radians and the distance p on the vertical axis ranging from -
I50 to 150
pixels. As can be seen, there are four (4) maxima, or "peaks" at respective
distances p
at about the zero (0) radians position in the Radon transform image. Each of
these
four (4) maxima indicates a respective nearly vertical grid line in the
calibration
image. Similarly, the four (4) maxima at respective distances p at about the
n/2
radians position in the Radon transform image indicate a respective, nearly
horizontal
grid line in the calibration image. The four (4) maxima at respective
distances p at
about the - 7r/2 radians position in the Radon transform image indicate the
same
horizontal lines as those mentioned above at the 1.5 radians position, having
been
considered by the Radon transform to have "flipped" vertically. The leftmost
maxima
are therefore redundant since the rightmost maxima suitably represent the
nearly
horizontal grid lines.
[000731 A clustering procedure is conducted to identify the maxima in the
Radon transform image, and accordingly return a set of (p,0) coordinates in
the Radon
transform image that represent grid lines in the calibration image. Figure 13
shows
the mean checkerboard image with the set of grid lines corresponding to the
(p,0)
coordinates in the set returned by the clustering procedure having been
superimposed
on it. It can be seen that the grid lines correspond well with the
checkerboard pattern.
CA 02738178 2011-03-23
WO 2010/034119 PCT/CA2009/001356
-17-
[00074] With the grid lines having been determined, the intersection points of
the grid lines are then calculated for use as feature points. During
calculating of the
intersection points, the vector product of each of the horizontal grid lines
(p1,01) with
each of the vertical grid lines (p2,02) is calculated as described in the
publication
entitled "Geometric Computation For Machine Vision", Oxford University Press,
Oxford; Kanatani, K.; 1993 the content of which is incorporated herein by
reference
in its entirety, and shown in general in Equation 13, below:
v=nxm (13)
where:
T
n= [cos(01),sin(01),PI]
and
m = [ cos(02 ), sin(02 ), p2 ] T .
[00075] The first two elements of each vector v are the coordinates of the
intersection point of the lines n and m.
[00076] With the undistorted image coordinates of the intersection points
having been located, a transformation between the touch panel display plane
and the
image plane is determined (step 308), as shown in the diagram of Figure 15.
The
image plane is defined by the set of the determined intersection points, which
are
taken to correspond to known intersection points (X,Y) in the display plane.
Because
the scale of the display plane is arbitrary, each grid square is taken to have
a side of
unit length thereby to take each intersection points as being one unit away
from the
next intersection point. The aspect ratio of the display plane is applied to X
and Y, as
is necessary. As such, the aspect ratio of 4/3 may be used and both X and Y
lie in the
range [0,4].
[00077] During determination of the transformation, or "homography", the
intersection points in the image plane (x,y) are related to corresponding
points (X,Y)
in the display plane according to Equation 14, below:
X HI, I H1, 1,2 HI, 3 X (14)
Y = H2,1 H22 2 H2,3 Y
H3 I H3 2 H3 3 I
where:
CA 02738178 2011-03-23
WO 2010/034119 PCTICA2009/001356
-18-
H;j are the matrix elements of transformation matrix H encoding the
position and orientation of the camera plane with respect to the display
plane, to be
determined.
[00078] The transformation is invertible if the matrix inverse of the
homography exists; the homography is defined only up to an arbitrary scale
factor. A
least-squares estimation procedure is performed in order to compute the
homography
based on intersection points in the image plane having known corresponding
intersection points in the display plane. A similar procedure is described in
the
publication entitled "Multiple View Geometry in Computer Vision"; Hartley, R.
1.,
Zisserman, A. W., 2005; Second edition; Cambridge University Press, Cambridge,
the
content of which is incorporated herein by reference in its entirety. In
general, the
least-squares estimation procedure comprises an initial linear estimation of
H,
followed by a nonlinear refinement of H. The nonlinear refinement is performed
using the Levenberg-Marquardt algorithm, otherwise known as the damped least-
squares method, and can significantly improve the fit (measured as a decrease
in the
root-mean-square error of the fit).
[00079] The fit of the above described transformation based on the
intersection
points of Figure 14 is shown in Figure 16. In this case, the final homography
H
transforming the display coordinates into image coordinates is shown in
Equation 15,
below:
24.8891 -3.2707 30.0737 (15)
H= -0.4856 22.4278 38.6608
-0.0051 -0.0151 0.6194
[00080] In order to compute the inverse transformation (i.e. the
transformation
from image coordinates into display coordinates), the inverse of the matrix
shown in
Equation 15 is calculated, producing corresponding errors E due to inversion
as
shown in Equation 16, below:
0.2575 0.2949 -0.7348 (16)
E= 0.3096 0.2902 -0.8180
0.0014 0.0014 -0.0043
[00081) The calibration method described above is typically conducted when
the interactive input system 10 is being configured. However, the calibration
method
may be conducted at the user's command, automatically executed from time to
time
and/or may be conducted during operation of the interactive input system 10.
For
CA 02738178 2011-03-23
WO 2010/034119 PCT/CA2009/001356
-19-
example, the calibration checkerboard pattern could be interleaved with other
presented images of application programs for short enough duration so as to
perform
calibration using the presented checkerboard/inverse checkerboard pattern
without
interrupting the user.
[00082] With the transformation from image coordinates to display coordinates
having been determined, image processing during operation of the interactive
input
system 10 is performed in order to detect the coordinates and characteristics
of one or
more bright points in captured images corresponding to touch points. The
coordinates
of the touch points in the image plane are mapped to coordinates in the
display plane
based on the transformation and interpreted as ink or mouse events by
application
programs. Figure 4 is a flowchart showing the steps performed during image
processing in order to detect the coordinates and characteristics of the touch
points.
(00083] When each image captured by imaging device 32 is received (step
702), a Gaussian filter is applied to remove noise and generally smooth the
image
(step 706). An exemplary smoothed image Ihg is shown in Figure 17(b). A
similarity
image IS is then created using the smoothed image Ihg and an image Ibq having
been
captured of the background of the touch panel when there were no touch points
(step
708), according to Equation 17 below, where sgrt() is the square root
operation:
IS = A/sqrt(BxC) (17)
where
A = Ihgxlbq;
B = IhgxIhg; and
C = Ibgxlbq.
[00084] An exemplary background image Ihg is shown in Figure 17(a), and an
exemplary similarity image IS is shown in Figure 17(c).
[00085] The similarity image IS is adaptively thresholded and segmented in
order to create a thresholded similarity image in which touch points in the
thresholded
similarity image are clearly distinguishable as white areas in an otherwise
black image
(step 710). It will be understood that, in fact, a touch point typically
covers an area of
several pixels in the images, and may therefore be referred to interchangeably
as a
touch area. During adaptive thresholding, an adaptive threshold is selected as
the
intensity value at which a large change in the number of pixels having that or
a higher
CA 02738178 2011-03-23
WO 2010/034119 PCT/CA2009/001356
-20-
intensity value first manifests itself. This is determined by constructing a
histogram
for IS representing pixel values at particular intensities, and creating a
differential
curve representing the differential values between the numbers of pixels at
the
particular intensities, as illustrated in Figure 18 The adaptive threshold is
selected as
the intensity value (e.g., point A in Figure 18) at which the differential
curve transits
from gradual changing (e.g., the curve on the left of point A in Figure 18) to
rapid
changing (e.g., the curve on the right of point A in Figure 18). Based on the
adaptive
threshold, the similarity image IS is thresholded thereby to form a binary
image, where
pixels having intensity lower than the adaptive threshold are set to black,
and pixels
having intensity higher than the adaptive threshold are set to white. An
exemplary
binary image is shown in Figure 17(d).
[000861 At step 712, a flood fill and localization procedure is then performed
on the adaptively thresholded similarity image, in order to identify the touch
points.
During this procedure, white areas in the binary image are flood filled and
labeled.
Then, the average pixel intensity and the standard deviation in pixel
intensity for each
corresponding area in the smoothed image Ihg is determined, and used to define
a local
threshold for refining the bounds of the white area. By defining local
thresholds for
each touch point in this manner, two touch points that are physically close to
each
other can be successfully distinguished from each other as opposed to
considered a
single touch point.
[00087J At step 714, a principal component analysis (PCA) is then performed
in order to characterize each identified touch point as an ellipse having an
index
number, a focal point, a major and minor axis, and an angle. The focal point
coordinates are considered the coordinates of the center of the touch point,
or the
touch point location. An exemplary image having touch points characterized as
respective ellipses is shown in Figure 17(e). At step 716, feature extractions
and
classification is then performed to characterize each ellipse as, for example,
a finger, a
fist or a palm. With the touch points having been located and characterized,
the touch
point data is provided to the host application as input (step 718).
1000881 According to this embodiment, the processing structure 20 processes
image data using both its central processing unit (CPU) and a graphics
processing unit
(GPU). As will be understood, a GPU is structured so as to be very efficient
at
CA 02738178 2011-03-23
WO 2010/034119 PCT/CA2009/001356
-21-
parallel processing operations and is therefore well-suited to quickly
processing image
data. In this embodiment, the CPU receives the captured images from imaging
device
32, and provides the captured images to the graphics processing unit (GPU).
The
GPU performs the filtering, similarity image creation, thresholding, flood
filling and
localization. The processed images are provided by the GPU back to the CPU for
the
PCA and characterizing. The CPU then provides the touch point data to the host
application for use as ink and/or mouse command input data.
[000891 Upon receipt by the host application, the touch point data captured in
the image coordinate system undergoes a transformation to account for the
effects of
lens distortion caused by the imaging device, and a transformation of the
undistorted
touch point data into the display coordinate system. The lens distortion
transformation is the same as that described above with reference to the
calibration
method, and the transformation of the undistorted touch point data into the
display
coordinate system is a mapping based on the transformation determined during
calibration. The host application then tracks each touch point, and handles
continuity
processing between image frames. More particularly, the host application
receives
touch point data from frames and based on the touch point data determines
whether to
register a new touch point, modify an existing touch point, or cancel/delete
an existing
touch point. Thus, the host application registers a Contact Down event
representing a
new touch point when it receives touch point data that is not related to an
existing
touch point, and accords the new touch point a unique identifier. Touch point
data
may be considered unrelated to an existing touch point if it characterizes a
touch point
that is a threshold distance away from an existing touch point, for example.
The host
application registers a Contact Move event representing movement of the touch
point
when it receives touch point data that is related to an existing pointer, for
example by
being within a threshold distance of, or overlapping an existing touch point,
but
having a different focal point. The host application registers a Contact Up
event
representing removal of the touch point from the surface of the touch panel 14
when
touch point data that can be associated with an existing touch point ceases to
be
received from subsequent images. The Contact Down, Contact Move and Contact Up
events are passed to respective elements of the user interface such as
graphical
CA 02738178 2011-03-23
WO 2010/034119 PCT/CA2009/001356
-22-
objects, widgets, or the background/canvas, based on the element with which
the
touch point is currently associated, and/or the touch point's current
position.
(000901 The method and system described above for calibrating an interactive
input system, and the method and system described above for determining touch
points may be embodied in one or more software applications comprising
computer
executable instructions executed by the processing structure 20. The software
application(s) may comprise program modules including routines, programs,
object
components, data structures etc. and may be embodied as computer readable
program
code stored on a computer readable medium. The computer readable medium is any
data storage device that can store data, which can thereafter be read by a
processing
structure 20. Examples of computer readable media include for example read-
only
memory, random-access memory, CD-ROMs, magnetic tape and optical data storage
devices. The computer readable program code can also be distributed over a
network
including coupled computer systems so that the computer readable program code
is
stored and executed in a distributed fashion.
[000911 While the above has been set out with reference to an embodiment, it
will be understood that alternative embodiments that fall within the purpose
of the
invention set forth herein are possible.
[000921 For example, while individual touch points have been described above
as been characterized as ellipses, it will be understood that touch points may
be
characterized as rectangles, squares, or other shapes. It may be that all
touch points in
a given session are characterized as having the same shape, such as a square,
with
different sizes and orientations, or that different simultaneous touch points
be
characterized as having different shapes depending upon the shape of the
pointer
itself. By supporting characterizing of different shapes, different actions
may be
taken for different shapes of pointers, increasing the ways by which
applications may
be controlled.
[00093) While embodiments described above employ anisotropic diffusion
during the calibration method to smooth the mean grid image prior to lens
distortion
correction, other smoothing techniques may be used as desired, such as for
example
applying a median filter of 3x3 pixels or greater.
CA 02738178 2011-03-23
WO 2010/034119 PCT/CA2009/001356
-23-
[000941 While embodiments described above during the image processing
perform lens distortion correction and image coordinate to display coordinate
transformation of touch points, according to an alternative embodiment, the
lens
distortion correction and transformation is performed on the received images,
such
that image processing is performed on undistorted and transformed images to
locate
touch points that do not need further transformation. In such an
implementation,
distortion correction and transformation will have been accordingly performed
on the
background image Ibg.
1000951 Although embodiments have been described with reference to the
drawings, those of skill in the art will appreciate that variations and
modifications
may be made without departing from the spirit and scope thereof as defined by
the
appended claims.