Note: Descriptions are shown in the official language in which they were submitted.
CA 02846968 2015-09-18
Methods and Apparatus Having Borehole Seismic Waveform Compression
CROSS-REFERENCE TO RELATED APPLICATIONS
The present application claims priority to Provisional U.S. Pat. App. No.
61/543,616, titled
"Methods and Apparatus Having Borehole Seismic Waveform Compression" and filed
October
5,2011.
BACKGROUND
Current development of logging/measuring while drilling have enabled the
development of
new seismic tools that acquire and transmit seismic data in real time during
the drilling process
without impairing rig operations. This Seismic While Drilling (SWD) technology
may
significantly impact (positively) the cost of exploration and development
drilling, particularly in
deepwater environment and other areas with significant seismic uncertainties.
The primary
application of SWD is to locate the well properly in the seismic section so
the driller can guide
the well towards a target. SWD can further aid the driller with other drilling
decisions including
setting, coring, and casing points; drilling hazard avoidance; and
overpressure zone
identification.
In SWD, time-domain waveforms are captured by digitizing signal responses of a
rock
formation to an acoustic source at remote point relative to one or more
microphones (e.g.
hydrophones and/or geophones). Processors at the surface process the seismic
time-domain data
and translate it into a space-domain representation. In order to accomplish
this, these processors
employ a velocity model, which is usually estimated from the seismic data
itself However, the
errors associated with these estimates can be quite large, especially in
exploration areas where
well information is scarce or non-existent. Such errors may result in the
reflectors (and thus
targets) being placed incorrectly in space. In order to properly place the
well that is being drilled,
either the seismic versus time profile or seismic versus depth profile is
desired. Both of these can
be achieved via SWD.
Seismic while drilling can potentially be done in at least three distinct
ways: 1) using a
downhole source (active or drill bit) and surface receivers; 2) using an
active seismic source on
the surface and one or more receivers downhole; 3) using both a downhole
source and downhole
1
CA 02846968 2014-02-26
receivers. The early commercial SWD services employed the first approach.
However, with
the advance of PDC bits, the drill bit signal was found in many situations to
be too weak to
serve as a useful seismic source.
The latter two options employ downhole receivers. Conventional drilling
systems
employ notoriously low-data-rate mud pulse telemetry systems to communicate
downhole
measurements to the surface. The bandwidth constraints of such systems make it
infeasible
to communicate all of the collected waveforms to the surface for processing,
visualization,
and interpretation. Previous attempts to address this issue are believed to be
inadequate.
BRIEF DESCRIPTION OF THE DRAWINGS
Accordingly, there are disclosed in the drawings and the following description
specific
apparatus and method embodiments employing borehole seismic waveform
compression to
at least partly address this issue. In the drawings:
Fig. 1 shows an illustrative seismic while drilling (SWD) environment.
Fig. 2 shows an illustrative graph of raw, unfiltered SWD waveforms captured
at
different depths.
Fig. 3 is a block diagram of an illustrative encoder that provides borehole
seismic
waveform compression.
Fig. 4 shows an illustrative Kaiser band-pass filter to remove 0 Hz offset and
frequencies above 100 Hz.
Fig. 5 shows illustrative overlaid received and band-passed filtered acoustic
waveforms
from 5 air-gun check-shots.
Fig. 6 compares illustrative spectral content of the original and filtered
signal.
Figs. 7A-7E compare an illustrative "stacked" waveform with the individual
filtered
check-shots at the original sampling rate of 2035 Hz.
Figs. 8A and 8B compare a first illustrative stacked and reconstructed
waveform with
different compressions.
Figs. 9A and 9B compare a second illustrative stacked and reconstructed
waveform
with different compressions.
2
CA 02846968 2014-02-26
Figs. 10A and 10B compare a third illustrative stacked and reconstructed
waveform
with different compressions.
It should be understood, however, that the specific embodiments given in the
drawings
and detailed description thereto do not limit the disclosure, but on the
contrary, they provide
the foundation for one of ordinary skill to discern the alternative forms,
equivalents, and
modifications that are encompassed with the given embodiments by the scope of
the
appended claims.
DETAILED DESCRIPTION
Fig. 1 shows an illustrative seismic while drilling (SWD) environment. A
drilling
platform 2 is equipped with a derrick 4 that supports a hoist 6 for raising
and lowering a
drill string 8. The hoist 6 suspends a top drive 10 suitable for rotating the
drill string 8 and
lowering the drill string through the well head 12. Connected to the lower end
of the drill
string 8 is a drill bit 14. As bit 14 rotates, it creates a borehole 16 that
passes through
various formations 18. A pump 20 circulates drilling fluid through a supply
pipe 22 to top
drive 10, down through the interior of drill string 8, through orifices in
drill bit 14, back to
the surface via the annulus around drill string 8, and into a retention pit
24. The drilling
fluid transports cuttings from the borehole into the pit 24 and aids in
maintaining the
integrity of the borehole 16.
A logging tool suite 26 is integrated into the bottom-hole assembly near the
bit 14. As
the bit 14 extends the borehole through the formations, logging tool 26
collects
measurements relating to various formation properties as well as the tool
orientation and
various other drilling conditions. During pauses in the drilling process
(e.g., when the drill
string 8 is extended by the addition of an additional length of tubing), the
tool suite 26
collects seismic measurements. As the pump 20 is normally off during this
extension
process, the downhole environment is generally quiet during these pauses. The
bottomhole
assembly can be configured to automatically detect such pauses and to initiate
a
programmable time window for recording any received seismic waveforms.
3
CA 02846968 2014-02-26
WO 2013/052423
PCT/US2012/058330
At predetermined time intervals, a seismic source 40, e.g., a surface vibrator
or an air gun, is
triggered to create a "shot", i.e., a burst of seismic energy that propagates
as seismic S-waves
and/or 1-waves 42 into the subsurface. Such waves undergo partial
transmission, reflection,
refraction., and mode transfortnation at acoustic impedance chan.ges such as
those caused by bed
boundaries, fluid interfaces, and faults. The tool suite 26 includes seismic
sensors to detect the
modified seismic waves reaching th.e bottornh.ole assembly. Data is recorded
in downhole
memory when each shot is fired on the surface. 'The tool suite 26 (and the
other system
components) has a high-accuracy clock to ensure that the _recorded
measurements' timing can be
synchronized to the timing of the shot. One possible synchronization approach
is to synchronize
the bottomhole assembly clock to the clock information in the Global
Positioning System (GPS)
prior to insertion into the -borehole.
The tool suite 26 may take the form of one or more drill collars, i.e., a
thick-walled tubulars
that provide weight and rigidity to aid the drilling process. The toot suite
26 further includes a
navigational sensor package having directional sensors for determining the
inclination angle, the
horizontal angle, and th.e rotational angle (a.k.a. "tool face angle") of the
bottotnhole assembly
(BHA). As is commonly defined in the art, the inclination angle is the
deviation from vertically
downward, the horizontal angle is the angle in a horizontal 'plane from_ true
North, and the tool -face
angle is the orientation (rotational about the tool axis) angle from the high
side of the wellbore. In
accordance with known techniques, directional measurements can be made as
follows: a three axis
accelerometer measures the earth.'s gravitational _field vector relative to
the tool axis and a point on
the circumference of the tool called the "tool thee scribe tine". (The toot
face scribe line is typically
drawn. on the tooi surface as a line parallel -to th.e tool axis.) From this
measurem.ent, the inclination
and tool face angle of the BHA. can be determined. Additionally, a three axis
magnetometer
measures the earth's magnetic field vector in a similar manner. From the
combined magnetometer
and accelerometer data, the horizontal angle of the BHA may be determined.
Inertial and gyroscopic
sensors are also suitable and useful for tracking the position and orientation
of the seismic sensors.
_A mud pulse telemetry sub 28 is included to transfer measurem.ent data to a
surface receiver
and to receive commands from the surface. The telemetry sub 28 operates by
modulating the
flow of drilling fluid to create pressure pulses that propagate along the
fluid column between the
30 bottom-hole assembly and the surface. (Mud pulse telemetry generally
requires a flow of drilling
fluid and th-us is not perfbrmed while the pump is off.)
4
CA 02846968 2014-02-26
WO 2013/052423
PCT/US2012/058330
The mud pulse telemetry receiver(s) 30 are coupled to a d.ata acquisition
SyStein that
digitizes the receive si.gnal and cotnmunicates it to a surface computer
systetn 66 via a wired or
wireless link 60. The link 60 can also support the transmission of commands
and configuration
information from the computer system 66 to the bottomhole assembly. Surface
computer system
66 is configured by software (shown in Fig. l in the form of removable storage
media 72) to
monitor and control downhole instruments 26, 28. System 66 includes a display.
device 68 and a
user-input device 70 to enable a human operator to interact with the system
control software 72.
Thus SWD systems can be broadly partitioned into two components: a surface
system and a
downhole system that work in a synchronized fashion. The surface system may
include an
acoustic source 40 and at least a single processing unit 66 typically
executing microcode to
control the actuation of the acoustic source. Other embodiments may involve
dedicated hard.ware
to control the actuation of the acoustic source 40. Often the acoustic source
40 may be an air-gun
or a seismic vibrator (e.g. Vibroseis) possibly firedlvibrated within
predetermined time intervals.
They operate to excite an acoustic signal that propagates through rock
formations to the
downhole systems. For offshore operations, the acoustic signal may propagate
through water in
addition to a rock forrnation.
As described previously, the downhole SWD component may be a part of a Logging
While
Drilling (LWD) or Measurement While Drilling (MWD) subsystem used in providing
UMWD
services, respectively. The tea.chings herein may also apply to wireline
services, in which the
downhole component is part of a wirel.in.e logging sonde. An illustrative
Logging While Drifting
(LWD) downhole system providing SWD services may include at least one embedded
processing system capable of synchronizing, operations with predetermined time
intervals al.so
used by the surface system, receiving at least one copy of the acoustic signal
from the
surrounding rock formation., digitizing and storing of the received. acoustic
signals, and.
compression. and transmission of at least some of the received acoustic
signals to the surface
system. In typical embodiments, the surface subsystem may doi,vnioad or
configure the
pred.etermin.ed time intervals within the downhole subsystem at the surface
prior to entering the
borehole via communication link (tethered or otherwise).
The digitized acoustic si.gnal.s acquired during -the predetermined -time
intervals are
compressed. Digital wavefbnn compression of received waveforms may be used
with either
LWD or MWD services for either or both storage and transmission. For storage,
the waveform
5
CA 02846968 2014-02-26
WO 2013/052423
PCT/US2012/058330
compression's utility lies in the ability to increase the storage density of a
given finite FLASH
memory, or other non---volatile memory-. Thus, digital waveform compression
may- enable more
recorded waveforms for either additional accuracy or for longer operation
periods relative to a
comparable LW) downhole apparatus without compression. For transmission, the
waveform
compression's utility focuses on increasing the throughput of digitized
waveforms through a
communication channel when transmitted to the surface systems in addition to
any possible
improved storage density. Thus, compression may enable timely transmission of
digitized,
received waveforms at an effective data rate -that enables real.-time SWD
service and does not
n.egatively impact other MWD services. For wireline systems, compression
benefits are similar
to LIMWD benefits with the possibility of additional waveform sampling
densities, i.e. more
waveforms per linear foot.
As an alternative to predetermined timing intervals, the shots (and recording
intervals) may
be event driven. For example, -they- may- be ac-tuated by- comtnands frotn the
surface computer
system 66, which can be communicated via mud pulse downlink telemetry or via
cycling of the
circulation pump between on and off states. As another example, the timing
m.ay be set as part of
thc pump cycle. A pump cycle is where the surface mud pumps are cycled between
off and on
states, e.g. "on to off to on" is a full cycl.e.
71'he ability to detect these events may exist elsewhere in the LAVAID
sdbsystem, and
through an inter-toot communication system, the downhole SIND component
receives a message
indicating such an event occurred or a comm.and to act i.n response to the
event. In these
embodiments, the downhole apparatus listens/monitor (receives) for trailing
acoustic reflections
off of surrounding rock formations, i.e. "echoes." The digital wavelbrm
compression of at least
one digitized acoustic signal received facilitates either or both storage
and/or transmission
purposes.
The source 40 need not be on the surface, and iri some contemplated
embodiments, it is
included as part of the drilistring. For example, the downhole seismic
subsystems may further
include a piezoelectric transducer such as those found in Halliburton's
Acoustic Caliper and/or
SONIC/BAT downhole toots. The triggering of the downhote source corresponds
with the timing
of the recording intervals, e.g,., in an event-driven fashion or at
predetertnined time intervals
configured by the surface system prior to the downhole system entering into
the borehole.
6
CA 02846968 2015-09-18
The following references supply additional detail which may prove helpful to
the
understanding of SWD concepts herein:
[1] Fuxian Song, H. Sadi Kuleli, M. Nafi Toksoz, Erkan Ay, and Haijiang Zhang,
An
improved method for hydrofracture-induced microseismic event detection and
phase
picking, Geophysics, Volume 75, Issue 6, 2010.
[2] Gary Althoff and Bruce Cornish; Halliburton Energy Services; Georgious
Varsamis,
Balaji Kalaipatti, Abbas Arian, Laurence T. Wisniewski, Joakim O. Blanch and
Arthur
C. Cheng; SensorWise Inc., New Concepts for Seismic Survey While Drilling,;
SPE
90751, 2004.
[3] Jakob B.U. Haldorsen, Cengiz Esmersoy, and Andrew Hawthorn, Schlumberger;
Mary
L. Krasovec, Massachusetts Institute of Technology; Sue Raikes, Toby Harrold,
and
David N. Day, BP plc; and James D. Clippard, Shell E&P Technology Co.,
Optimizing
the Well Construction Process: Full-Waveform Data From While-Drilling Seismic
Measurements in the South Caspian Sea., SPE/IADC 79844, 2003.
[4] Paul S. Earle, and Peter. M. Shearer, 1994, Characterization of global
seismograms using
an automatic-picking algorithm: Bulletin of the Seismological Society of
America, 84,
366-376
[5] T. Harrold, A. Poole, L. Nelson, A. Hawthorn, W. Underhill, Seismic
Measurement
While Drilling in Azerbaijan and Brazil, In Proceedings of IADC/SPE Drilling
Conference, Dallas, TX Feb 2002.
[6] Anchliya, A Review of Seismic-While-Drilling (SWD) Techniques: A Journey
From
1986 to 2005, In Proceedings of SPE Europe/EAGE Annual Conference and
Exhibition
held in Vienna, Austria, 12-15 June 2006.
The received acoustic waveforms contain useful information for drilling
purposes. When
available at the surface, the received acoustic waveforms may be plotted
across time and depth
to construct a seismic image (see, e.g., Fig. 2). The challenge, then, is to
communicate the
receive acoustic waveforms from the downhole tool that receives these
waveforms (deep within
a borehole) to the surface computer system. Ideally, full waveforms would be
sent uphole for
real time processing, visualization and interpretation (Fig. 2), but such is
not feasible. Indeed, in
many cases it may even be infeasible to just store all of the recorded
waveforms in the tool's
memory. Accordingly, there is disclosed herein digital compression techniques
to facilitate
7
CA 02846968 2014-02-26
WO 2013/052423
PCT/US2012/058330
corr3munication of an adequate number of .wavethrms to -the surface for near
real tirn.e analysis
and to further facilitate the storage of a greater number of -waveforms in a
memory of a given.
capacity. The disclosed compression techniques are applicable not only to mud
pulse telemetry
systems and data storage, but also for use with other -telemetry systems
(including, e.g.,
electromagnetic telemetry, acoustic telemetry, and wireline telemetry).
One, illustrative 8-inch SWD tooi captures acoustic waveform data in -the
following format:
32 bits/sample at a sampling frequency of 2035 samples/sec for at least 2
minutes for each of
eight acoustic receive transducers (4 hydrophones and 4 geophones). Thus
without additional
signal processing and compression to reduce the aggregate bit count, the total
digitized received
set of waveforms total is 8 signals x 32 bits/sample x 2035 santples/sec x 120
sec = 62,515,200
bits, i.e. 7,814,400 bytes. Even given an aspirationat .mitd pulse telemetry
rate of 15 bits of
information per second, the total time to transmit is 48.23 days. Even one
transducer for 0.5
second consists of 32 x 2035 x 0.5 = 32,560 bits and would take --36 minutes
to transmit with the
rate of 15 bits/sec, a prohibitive time interval for drilling operations
relying on MWI) for
information other than a SWD waveform.
A more typical mud pulse telemetry rate is ¨3 bits/sec, pushing the time to
transmit a single
0.5 sec waveform to ¨3 hours. For a more manageable SWD system. retying on mud
pulse
telemetry, we believe a single processed digitized received waveform should be
compressed to
no more than about ¨190 bits. The methods disclosed herein can accomplish
this, putting the
transmission time on the order of 1. minute .for 3 bits/sec telemetry rates.
.At every stand (3
sections of pipe or ¨90 feet), the 1 minute taken for SWD waveform telemetry
is quite acceptable
and should not affect negatively other dritlir3.g operations relying on rr3ud
pulse telemetry. Even
when limited to less than 2,00 bits per wavefomi, we can provide SWD waveforms
of sufficient
quality to provide usefitl infortnation for the driller during the current
drilling, run without pulling
out of the hole for a tool reading.
A suitable goal for the disclosed implementations of SWD technology would be
to produce
"Vertical Seismic Profile" surveys in real-time, where the fuli seismic wave
forrns are promptly
sent to surface via mud pulse telemetry. in this context, a "full" wave form
is a time-domain
waveform in, say, a 512 msec window around the first break arrival titne. A.
series of such.
waveforms would enable the seismic velocity profile to be continuously updated
to facilitate the
proper 'positioning of the welt in the seismic time/location. Rea1-tirr3.e VSP
analysis with full
8
CA 02846968 2014-02-26
WO 2013/052423
PCT/US2012/058330
seismic waveforms further assists in id.entifying/interpreting reflections and
corridor stacks for
seismic ties and look-ahead applications, and saves the extra tirne and money
that might
otherwise be spent on a wiretine VSP survey for the same purpose.
Th.e disclosed methods and apparatus may adaptively adjust the filtering,
sampling and
quantization of received acoustic waveforms, with a quality measare that uses
a plurality of
perceptual parameters relied on by seismic analysts to interpret Vertical
Seismic Profiles. The
resulting data compression facilitates the storage and./or transmission of a
plurality of digitized
received seismic waveforms that retain features important to seismic fog-
analysts for recorded
and/or real-time applications. Many embodiments both at the surface and
downhole allow for
user defined/customized weighting parameters that ma.y be used in a weighted
linear fashion
andlor in a nonlinear gateway fashion (i.e. if the break time is less than
some threshold, theiì
check the weighted perception parameters against another threshold, e.g. sign,
amplitude, mean-
squared error).
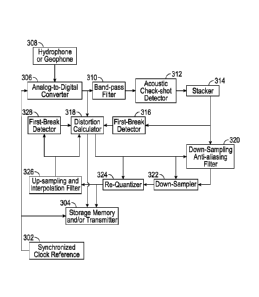
Fig. 3 shows an illustrative compression process for the received digital
waveforms. A high-
accuracy clock 302 for the tool is synchronized to that of the surface
systems, e.g., by means of a
GI'S reference clock before the tool is deployed downhole. (Other
synchronization techniques
are known and may be employed.) The d.ownhole tool determines the recording
time intervals
and sampling times based at least in part on the clock 302. .A toot module 304
for data storage
and/or communication to the surface tags the measurements with a time reading
from the clock
302..
During the recording windows, one or more AID converters 306 begin sampling
the signals
from one or more seismic sensors 308. .A bandpass filter 3 10 isolates the
frequency range of
interest, screening out the high frequency noise and potentially 'blocking any
DC component. A
shot profile detector 312 detects and separates the individual waveforms.
(Often the source fires
a series of shots in the recordin.g interval. The shot profile detector
defines a time window for
each shot, thereby separating the digitized signal into individual waveforms.)
The stacker 3 14
averages the individual. wavefOrms from a given shot series together, thereby=
improvin.g, the
signal to noise ratio.
A. first-break detector 3 16 processes the stacked waveform to identify the
"start" of the
30. received acoustic waveform, which corresponds to the first arrival of
seismic energy from the
shot. (Standard detection techniques are avada.ble in th.e literature and may
include, for example,
9
CA 02846968 2014-02-26
WO 2013/052423
PCT/US2012/058330
identifying the zero crossing preceding the first peak that exceeds a
pred.etermined. threshold.) A
distortion calculator 318 operates on this start point and/or other
information derived from the
stacked waveform, comparing them to corresponding measures derived from a re-
constructed
waveform to derive a measure of distortion caused by the compression process.
S-uitable
distortion measures include start point error and mean-square error between
the stacked.
waveform and the reconstructed wavefbrm, or a combination thereof. Based on
the distortion
measure, the distortion calculator adapts the compression parameters to
maximize compression
subject to limits on the distortion. Illustrative compression parameters
include: sample
quantization, sampling rate, and anti-aliasing fitter cutoff.
An anti-aliasing ("downsampling") filter 320 performs a low-pass filtering
operation on the
stacked signal to suppress any- frequency content above a programmable cutoff
frequency, to
enable the ensuing downsampler 322 to operate without creating frequency
aliasing. The
maximum cutoff frequency- is limited by the desired downsampling rate, but it
can be lower if
desired.
Downsampler 322 reduces the sampling rate of the filtered waveform, employing
interpolation if needed (e.g., when the original sampling rate is not an
integer multiple of the
reduced sampling rate). The downsampled waveform is then re-quantized by re-
quantizer 324.
R.e-quantizer 324 represents each waveform sample with a smaller number of -
bits, e.g., two or
three bits per sample rather than 32 bits per sample. The re-quarnizer 324 may
employ evenly
-
spaced quantization thresholds, but even spacing is not a requirement. Some
embodiments may
employ nonunifomi quantization threshold spacing. In any event, effective re-
quantization
generally employs some form of waveform normalization, i.e., a gain term that
can be applied to
the wave form at, or at nearly any point upstream of, the re-quantizer 324.
The output of re-quantizer 324 is a compressed waveform, but before it is
accepted as a
suitable representation for storage and/or transmission, a reconstructor 326
upsamples and filters
the compressed signal to provide a reconstructed estimate of the stacked
waveform. A first-break
detector 328 operates on the reconstructed estimate to identify the start of
the received acoustic
waveform in the same fashion as detector 316. The distortion calculator 318
compares the start
times from. detectors 316 and 328 and/or the mean square error between the
reconstructed
estimate and the stacked waveform to derive a distortion measure If the
distortion measure is too
high, one or More of the compression param.eters is adjusted to permit more
bits to be used in the
CA 02846968 2014-02-26
WO 2013/052423
PCT/US2012/058330
compressed representation. Conversely, if the distortion measure is far enough
below the limit,
the compression parameters may be adjusted to reduce the number of bits used
.for the
compressed representation. When an acceptable distortion measure is attained,
the compressed
representation may be stored and/or communicated by module 304 with an
appropriate time
stamp attached. As part of the storage and/or transmission, an entropy coding
scheme
(differential. encoding, Huffman, etc) may be employed to further reduce the
number of bits
needed to represent the compressed waveform.
The distortion measure may be a weighted average of a plurality of error
measures derived
frorn the comparison of the reconstructed estimate with the original waveform,
the filtered
waveform, or the stacked waveform. The distortion measure includes at least
one measure of the
accuracy of at least one perceptual parameter. Some embodiments 'may further
enable a user to
specify (through a Graphical User Interface (GUI)) the set of perceptual
parameters to be
measured and used for a distortion criterion.. Likewise, the -user may further
specify the weights
associated with each perceptual parameter or other distortion measures andlor
criterion limits
either linear or nonlinear in nature. These embodiments may then configure the
downhole system
embodiment with the user specified distortion measure/threshold through some
predetermined
communication protocol allowing for fine tuning of the perceptual based
distortion measure
and/or the calibration of any partic-ular realization of downhote embodiments.
Linear threshold
embodiments may be described as a linear weighted sum of various perception
measures and/or
errors. A. nonlinear threshold embodim.ent may piecewise 1ink multiple
perceptual criteria i.n a
gated/seriallif-then-else fashion. For exarnple, if the reconstructed first
break time is off more
than 3 m.sec from the original received. waveform, then the downh.ole
processor may reject the
current set of compression parameters and compress by some other parameter
set. Otherwise, the
downhole processor ma.y go on to further check the sign of the largest
(absolute amplitude) peak
of the reconstructed waveforrn with a programmable threshold and reject the
current
compression parameters for failure to satisfy this criterion, and so forth.
:Perceptual parameters may includ.e the "the .first break" (i.e. start of the
received waveform
from the acoustic source), peak amplitude of principle reflections within the
received waveform,
the sign of principle reflections, general shape of the received digital
waveform, arrival time and
amplitude of "Stoneley Waves," and the perceived end of the seismic waveform
where the
waveforrn.'s energy has dissipated below a threshold. One skilled in the art
may identify many
CA 02846968 2014-02-26
WO 2013/052423
PCT/US2012/058330
more perceptual parameters. Additional perceptual parameters may include
features of the P.-
wave portion of the received seismic waveform, such as the detected beginning,
the spectral
content of the P-wave's dominant frequency, the magnitude of the P-wave's peak
amplitude, the
sign corresponding to the P-wave's peak magnitude. Similarly, additional
perceptual parameters
may include features of the S-wave portion of the received seismic waveform,
such as the
detected beginning, the magnitude of the S-wave's peak, the spectral content
of -the S-wave's
dominate frequency, the magnitude of the S-wave's peak amplitude, and the sign
correspon.din.g
to the S-wave's peak magnitude. One skil.led in the art may identify many
rr3.ore paranieters that
facilitate perceptual understanding of the received waveform..
In one illustrative embodiment a 50% weight is applied to the first break
point timing
accuracy, 20% weight to -the sign accuracy of the first break point, 20%
weight to exceeding the
amplitude value threshold, and the remaining 10% on the general shape of the
encoded
waveform relative to the received acoustic waveform (as measured by mean
square error). These
weights, the corresponding thresholds, and any goals or absolute limits on bit
counts can be
specified and changed via a user interface to configure the operation of the
downhole toot before
it is placed in the borehole or durin.g the drilling run.
Certain elements of Fig. 3 are now described with additional detail and
alternative
embodiments. In at least some embodiments, the .A/D converter 306 digitizes
each transducer
signal with 32 bits/sample at a sampling frequency of 2035 samples/see for at
least 2 minutes
after the triggering of the source. The bandpass filter 310 may have a
frequency response such as
that indicated in Fig. 4, effectively suppressing any frequency content
outside of the 5 Hz to 100
Hz band. Fig. 5 compares the filter's input and output for an illustrative
waveform, showing that
a large portion of the signal energy is excluded by this filter. Fig. 6
compares the power spectral
density of these waveforms. Aside from the excluded spike at 0 Fiz, the power
spectral densities
of these two waveforms are largely identicai in the illustrated frequency
range between 0 an.d
150 Hz.
Returning to Fig. 5, the illustrative waveform exhibits five arrivals
corresponding to the
sequential firings of the source. The acoustic detector 312 identifies the
windows associated with
each arrival. Some detector embodiments perform correlation of portions of -
the received acoustic
waveforms containing temporal peak energy with other portions of the received
acoustic
waveforms. Th.ese locations of correlation peaks correspond to repetitive
check-shots at
12
CA 02846968 2014-02-26
WO 2013/052423
PCT/US2012/058330
predetermined intervals. Thus certain detector embodiments include a
correlation module; a peak
energy detector; a synchronizer module and storage memory for containing the
starting locations
of a plurality of times at least in part related to peak auto correlation
values.
Other detection emboditnents process the entire signal in time and/or
frequency to detect P-
wave and/or S-wave arrival times. As one example, we define the average
absolute value of a
signal x [k] in a symmetric window of length N around a sample number n as:
N
v--¶=-2-
A=
N N /2
Two window lengths can be defined, i.e., a short term window and a long term
window, where N
for the short term window is less than that for the long term window.
.Denoting the average
absolute value, for the short term. window as STA. and the average absolute
val.ue for the long
terrn window as LTA, the ratio STA/LTA can be used as a detector for P-wave
arrival times in
the received acoustic signal W. The STA. is more sensitive to sudden amplitude
variations in. the
time series, whereas the LTA is calculated over a lon.g,er window and hence is
more sensitive to
background noise, causing the ratio to provide a measure of signal-to-noise
ratio in the
considered time window of the STA M. Of course, a ratio of root-m.ean-square
values or other
detection techniques could also be employed.
Th.e operation. of stacker 314 is straightforward and in some cases may be
optional. After the
filtered waveform. of Fig. 5 has been divided into five waveforms, the stacker
314 averages them
together. Figs. 7A-7F, compare each of the individual waveforms to the stacked
waveform. The
minor discrepancies can be seen only under close in.spection. In alternative
system embodiments
(e.g., those employing a Vibroseis source) the waveform may be much_ longer
making it
infeasible (and probably- unnecessary) to perform a stacking operation.
Fig. 8A compares an illustrative stacked waveform with an estimated waveform
reconstructed .from a cotnpressed wave .form. The compression parameters for
this -waveform.
were a 512 msec window, leading zeros omitted in favor of a first break time
tag, an anti-ali.asing
fitter (Lowpass 8' order Chebyshev Type II) cutoff frequency of 101.75 Hz, a
downsampled rate
of 127.2 samples/sec, and 3 bits per sample (including on.e sign bit per
sample). The compressed
waveform is representable as 165 bits. Inspection reveals the reconstructed
waveform to be fairly
accurate.
13
CA 02846968 2014-02-26
WO 2013/052423
PCT/US2012/058330
Fig. 8B compares the stacked waveform of Fig. 8A to a reconstruction of an
even more
compressed waveform, which may be allowed by- the user relaxing a distortion
limit. The
compression parameters are the same except for a downsa.mpled rate of 101.8
samples/sec,
enabling a 132 bit representation. Several of the peaks are attenuated, but
the waveform shape i.s
largely preserved.
The foregoing comparison is repeated for two other illustrative waveforms in
Figs. 9A and.
913, and 10A. and 1013. The bit representations for the second illustrative
wavefomi are 177 bits
and 138 bits, respectively. -For the third illustrative waveform, th.e bit
representations are 192 bits
and 153 bits, respectively. The increased bit counts are primarily
attributable to the reduced
number of leading zeros in these waveforms. As before, the more severe
compression exhibits
sorne distortion relative to the stacked waveform, but the character of the
waveforms is largel.y
preserved. Compression is thus successfully achieved without requiring any
predefined templates
of any sort.
As module 304 stores and/or transmits the compressed waveform, it may employ
an entropy
code to achieve further corr3.pression. Illustrative exarr3.ples include
Huffman. codir3.g and
arithmetic coding. The correspondin.g receiver or reconstruction modules would
similarly
employ appropriate decoders. Module 304 ina.y further include attaching, or
associating a time tag
for each waveform and at least one digital indicator representing the
compression parameters
used to generate the coinpressed. waveform (i.e., the conibination of filter,
downsainpler, and
quarttizer settings). In addition, module 304 may also provide a gain -term,
which in some
embodiments can be determined in part by the sample variance and/or peak
absolute amplitude
of a first received waveform. The gain term (or some function. thereof,
including the square root)
may be applied to the waveform to nomialize it. The gain tem' is communicated
to the receiver
andlor reconstruction. module so that the normalization can be reversed as
part of the waveforrr3.
reconstruction. The normalization can be performed in an absolute fashion or
in a relative
fashion. That is, some embodiments adjust the scale of a first reconstructed
waveform in relation
to a second reconstructed waveform that may be received before or after the
first waveform
The time tags may take the form of at least one digital clock reference
indicator which can
correspond to the detected first break along with the compressed
representation of a received
waveform, and which may be expressed relative to another digital clock
reference indicator, as
diMrential representations may require fewer bits. This reference indicator
may be the lower
14
CA 02846968 2014-02-26
WO 2013/052423
PCT/US2012/058330
significant digits of a time difference with respect to a universal clock
reference point enabling at
least in part time synchronization 'between surface and downhole systems.
In some embodiments, leading zeros may be omitted in favor of a time reference
to the "first
break". The recei.ver will then append appropriately leading zeros to
reconstructed waveforms.
Thus, in the receiver or reconstruction modules, the compressed waveforms are
received or
read from memory and used to reconstruct an estimate of the acoustic waveforms
captured
downhole. An indication of the compression parameters is similarly received or
read from
'memory and used as part of -the reconstruction process to extend the bit
resolution of the
samples, to upsample the waveform with interpolation, to scale the waveform
and associate it
with an appropriate time interval or position, and to display a representation
of the waveforin to a
user.
In one illustrative usage example, the SWD system einploys an air gun that
fires a timed
series of 5 check-shots at a predetermined delay after -the mud pumps are shut
off: The E3RA
detects the pause in drilling by, e.g., downhote pressure change or a
significant decrease in flow
rate, and initiates a waveform acquisition cycle by the SW{) tool. Based on
preprogrammed.
parameters, the SWD tool determines the data acquisition window relative to
the mud purrip
shutdown and acquires high-resolution acoustic wavefomis from each of its
sensors within that
.window. See, e.g., an illustrative raw waveform in Fig. 5, A bandpass filter
(e.g., Fig. 4) may be
applied to the data to isolate the signal in the frequency range of interest.
An illustrative filtered
signal is overlaid on -the raw signal in Fig. 5 for comparison. The spectral
content of -the -two
signals is shown in Fig. 6. The 0 Hz component of the raw waveform has been
excluded.
Otherwise the spectral content is essentially identical in thc.: frequency
range of interest.
Based on the predetermined shot profile (e.g., a series of 5 check-shots), the
SAND tool can
extract the individual received waveforms as indicated in Figs. 7A.-7E. The
individual
waveforms may preferably be extracted frorn the ban.dpass filtered signal,
though this is not
required. To improve signal to noise ratio, the individual waveforms may be
stacked, i.e.,
averaged together (although this too is not required). Figs. 7a-7e show a
comparison of an
illustrative stacked waveform to each of the individual waveforms. The stacked
waveform is
subjected to compression as previously described and stored or transmitted to
the surface. Figs.
8a and 8b. Figs. 9a and 9b, and Figs. 10a. and 10b, show three different
waveforms, along with
their compressed representations at different sampling rates. The bit count
for each
CA 02846968 2014-02-26
WO 2013/052423
PCT/US2012/058330
representation is also shown., along with a compression factor. Though
distortion is visible,
particularly at the h.igh.er compressions, the essential features of the
waveforms are preserved.
On the topic of customization and compression, we have proposed using a user
interface
where a plurality of weights may be given to different perceptual .features
important to the user
(generally a seismic waveform analyst). Using a plurality of perceptual
parameters, we suggest
adaptively adjusting th.e quantization, sampling and/or filter processing
modules to assist in
making real-time -VSP waveforms available via mud-pulse telemetry. Likewise,
we have
suggested allowing for adjustable distortion thresholds as to customize the
level of distortion
acceptable to th.e driller or analyst. Similarly, this allows for the field
engineer the capability to
adapt the number of bits for a given time interval or adapt the time window
for a given number
of bits).
On the topic of transmission, we have proposed sending the actual waveform
rather than
"quality" factors andlor wavelets from a codebook. Such transmission of real-
time waveforms is
desirable for competing in th.e SWD market. The technology is also applicable
to oth.er seismic
and acoustic borehole applications (e.g., SONIC caliper, where the downhole
tool wili both.
excite the acoustic waveform and receive the reflected acoustic waveform from
the surrounding
rock formation).
.In certain illustrative method embodiments, the SWD system. excites aii
acoustic source a
plurality of times just before, during and/or just after the beginning of
pred.eteranned. time
intervals; receives at least one acoustic signal within a -borehole from
surroundin.g rock
formations; digitizes at least one the received acoustic signal with a first
sampling rate/period.;
detects th.e first break time within the received acoustic signal; searches a
plurality of
configuration parameters (cutoff frequency, sampling rate and quantization)
for an optimized
configuration pararn.eter set th.at reduces the required number of bits to
represent the received
waveform within a predetermined bit count thresh.old and still remain within a
predetermined
distortion measure threshold for a reconstructed acoustic signal; and
digitally compresses the
d.igitized acoustic si.gnals accordin.g, to the set of optimized parameters
for storage or
communication to the surfitce.
Certain surface system embodiments include a graphical user interface
operating on. a
computer enabling a user to customize the weights placed on each a plurality
of perception
parameters within a set of weighted distortion criteria. These surface system
embodiments
16
CA 02846968 2014-02-26
WO 2013/052423
PCT/US2012/058330
further operate to configure downhole components with -the weighted distortion
criteria for use in
optimizing the digital compression parameters (e.g. filtering, sampling rate,
quantization, etc.)
prior to storing and/or transmitting. Some embodiments may use multiple sets
of perception
parameters and/or distortion criteria for storage and transmission.
Alternatively, sorne
embodiments may use multiple sets of perception parameters for different
depths, regions,
anticipated drilling conditions and/or anticipated rock formations. (For
example, the bit count
limit may be progressively reduced at a corresponding rate as that expected
for the mud pulse
-telemetry system operating at increasing depths.)
Certain downhole tool embodiments are synchronized with at least one surface
system using
predetermined shot time intervals. The downhole toot includes: at least one
acoustic receiver
(e.g. geophones, hydrophones) enabled to receive acoustic waveforms from the
surrounding
environment; at least one sampling rnoduie that digitizes/quantizes the
acoustic waveforms; a
fitter with a programmable cutoff frequency; a programmable down-sampler; an
adjustable re-
quantizer; a processor detecting, selecting and/or processing the received
digitized acoustic
waveforms to store or transmit compressed representations. The downhole toot
may further
include a decoder to reconstructluncompress the encoded digitized waveforni,
wherein the
'processor compares the reconstructed waveform to the original to determine a
distortion measure
and a suitable set of compression parameters.
Additionally, the downhole tool may further include a storage memory (FLASH or
RAM)
storing either/or both the configuration inputs or/and encoded waveform once a
distortioii.
measure meets a desired threshold orland the encoded waveform representation
has a bit count
failing below a desired bit count threshold. Additionally., a controller may
selectively transmit
encoded representations satisfying the thresholds. The controller may operate
by storing each
encoded waveform in nonvolatile memory and -then removing or overwriting
selective encoded
waveforms.
Additionally, the downhole toot may further determine, store, and/or transmit
a digital clock
value representing a detected first-break time in each. waveform. Similarly,
the d.o,,:vnhole tool
may further determine, store, and/or transmit a calculated distortion measure
corresponding to
each encoded -waveform.
Numerous other modifications, equivalents, and alternatives, will become
apparent to those
skilled in the art once the above disclosure is fully appreciated. !It is
intended that the following
17
CA 02846968 2014-02-26
WO 2013/052423 PCT/US2012/058330
claims be intetpreted to embrace all such modifications, equivalents, and
alternatives where
applicable.
18