Note: Descriptions are shown in the official language in which they were submitted.
CA 02912791 2015-11-18
WO 2014/186899
PCT/CA2014/050480
SYSTEM AND METHOD FOR CLASSIFYING AND CHARACTERIZING TISSUES USING
FIRST-ORDER AND SECOND-ORDER STATISTICS OF QUANTITATIVE ULTRASOUND
PARAMETRIC MAPS
BACKGROUND OF THE INVENTION
[0001] The field of the invention is systems and methods for quantitative
ultrasound ("QUS"). More particularly, the invention relates to systems and
methods for
classifying and characterizing tissues as being associated with a particular
histological
state using QUS.
[0002] Clinical ultrasound is a useful, and noninvasive tool for diagnosing
cancer
and other diseases. In addition to ultrasound's ability to non-invasively
differentiate
malignant tumors from their benign counterpart, the ability to characterize a
malignant
tumor in terms of its histological grade is of paramount importance for
staging and
treatment design. Due to the many instrument parameters that can be chosen
during an
ultrasound imaging session, however, a comparative interpretation of
conventional B-
mode images becomes difficult when different ultrasound machines are used, or
when
different settings are applied. Additionally, B-mode images lack information
about
microstructural properties of soft tissues.
[0003] Quantitative ultrasound ("QUS") techniques, which examine the
frequency-dependent backscatter of tissues independent of the instrument
settings,
have been suggested to overcome this limitation. Such techniques have been
applied in-
vivo to reveal information about the tissue's underlying microstructure, or
histological
state, enabling the differentiation of disease from non-disease, the
differentiation of
viable from apoptotic tissue, and the characterization of a disease into its
subtypes.
Specifically, parameters including effective scatterer diameter ("ESD") and
effective
acoustic concentration ("EAC") have demonstrated the potential to distinguish
between
mouse tumor models of mammary carcinoma and fibroadenoma. However, the
estimation of effective scatterer size and acoustic concentration require
prior
knowledge about the backscattering model, which can often be complicated to
characterize in the case of tissue particular tissues.
[0004] To avoid complex model fitting, basic spectral parameters extracted
via a
linear regression analysis of the radio frequency ("RF") echo signal spectrum,
including
mid-band fit ("MBF"), spectral slope ("SS"), and spectral 0-MHz intercept
("SI"), were
proposed for tissue characterization. Such quantitative parameters have been
-1-
CA 02912791 2015-11-18
WO 2014/186899
PCT/CA2014/050480
previously used to characterize various types of tissue abnormalities,
including those in
prostate, lymph nodes, and myocardium, and to detect apoptotic cell death. By
modeling the ultrasonic power spectrum as an acoustic impedance
autocorrelation
function, it has been demonstrated that SS can be related to effective
scatterer size, SI
can be related to acoustic concentration, and MBF can be related to both
effective
scatterer size and acoustic concentration. Alternatively, scatterer spacing,
also known
as spacing among scatterers ("SAS"), has been investigated as a tissue
characterizing
parameter when the tissue of interest contained detectable periodicity in its
structural
organization. In this context, scatterer spacing has been applied to
characterize human
breast tumors by categorizing them into normal, fibroadenoma, simple
carcinoma, or
infiltrating papillary carcinoma. Other studies have also investigated the
potential of
SAS for characterizing diffuse diseases of the liver.
[0005] While the conventional quantitative ultrasound mean parameters
discussed above describe the frequency-dependent properties of tissue
microstructure,
textural characteristics of their parametric maps can provide second-order
statistics by
quantifying the patterns of gray-level transitions. A number of previous
studies have
applied the textural features of ultrasound B-mode images to distinguish
between
malignant and benign breast tumors. The principle behind this tissue
classification
technique is that malignant tumors tend to present as heterogeneous internal
echoes,
while benign tumors often demonstrate homogeneous internal echoes. Textural
analysis techniques aim at extracting the tissue internal echo properties or
"texture,"
based on the ultrasonic gray-level transitions, and hence can define
differentiable
characteristics in this application. However, conventional B-mode images may
also
present undesirable variations in textural estimates due to variations in
instrument
settings, ultrasound beam diffraction, and attenuation effects.
[0006] It would therefore be desirable to provide systems and methods for
classifying tissues as being associated with particular histological states
using
ultrasound, but without the limitations in accuracy that are associated with
analyzing B-
mode images. Advantageously, such systems and methods would be capable of
classifying tissues based on histological states including both general
classifications
(e.g., normal, cancerous) and subtype classifications (e.g., tumor grade,
liver fibrosis
stage).
-2-
CA 02912791 2015-11-18
WO 2014/186899
PCT/CA2014/050480
SUMMARY OF THE INVENTION
[0007] The
present invention overcomes the aforementioned drawbacks by
providing systems and method for classifying tissues by analyzing first-order
and
second-order statistics of quantitative ultrasound parametric maps, in which
undesirable variations in textural estimates due to variations in instruments
settings,
ultrasound beam diffraction, and attenuation effects, are substantially
mitigated.
[0008] It is
an aspect of the invention to provide a method for classifying a tissue
as being associated with a particular histological state using an ultrasound
system.
Ultrasound echo signal data is acquired from a region-of-interest that
contains the
tissue, using the ultrasound system. At least one parametric map is produced
from the
acquired ultrasound echo signal data. The at least one parametric map has
pixel values
associated with a parameter computed from the acquired ultrasound echo signal
data.
At least one first-order statistical measure of the at least one parametric
map is
computed, such as a mean. At least one second-order statistical measure of the
at least
one parametric map is also computed, such as a contrast, energy, homogeneity,
or
correlation. The tissue is then classified as being associated with a
particular
histological state using the computed at least one first-order statistical
measure and the
computed at least one second-order statistical measure.
[0009] It is
another aspect of the invention to provide a method for generating an
imaging biomarker that is indicative of a histological state of a tissue using
an
ultrasound system. Ultrasound echo signal data is acquired from a tissue using
the
ultrasound system. At least one parametric map is then produced from the
acquired
ultrasound echo signal data. The at least one parametric map has pixel values
associated with a parameter computed from the acquired ultrasound echo signal
data.
At least one first-order statistical measure of the at least one parametric
map is
computed, as is a plurality of second-order statistical measures of the at
least one
parametric map. An imaging biomarker is then generated by determining a
combination of the computed at least one first-order statistical measure and
the
computed plurality of second-order statistical measures that is correlated
with a
desired accuracy of classifying the tissue as being associated with a
particular
histological state. The desired accuracy may be a desired specificity,
sensitivity, or
combination of both.
[0010] The
foregoing and other aspects and advantages of the invention will
-3-
CA 02912791 2015-11-18
WO 2014/186899
PCT/CA2014/050480
appear from the following description. In the description, reference is made
to the
accompanying drawings which form a part hereof, and in which there is shown by
way
of illustration a preferred embodiment of the invention. Such embodiment does
not
necessarily represent the full scope of the invention, however, and reference
is made
therefore to the claims and herein for interpreting the scope of the
invention.
BRIEF DESCRIPTION OF THE DRAWINGS
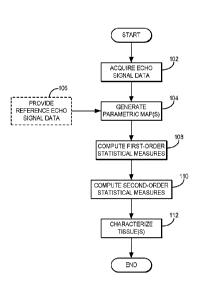
[0011] FIG. 1 is a flowchart setting forth the steps of an example of a
method for
characterizing a tissue using quantitative ultrasound and first-order and
second-order
statistical measures of quantitative ultrasound parametric maps;
[0012] FIG. 2A is an example scatter plot of different tumor grade sampled
overlaid on territorial maps over a plane of canonical discriminant functions
obtained
using the means of four parameters;
[0013] FIG. 2B is an example scatter plot of different tumor grade sampled
overlaid on territorial maps over a plane of canonical discriminant functions
obtained
using second-order statistics of four parameters;
[0014] FIG. 2C is an example scatter plot of different tumor grade sampled
overlaid on territorial maps over a plane of canonical discriminant functions
obtained
using both the means and second-order statistics of four parameters;
[0015] FIG. 3 is an example scatter plot of a linear discriminant analysis
function
of the mean of effective scatterer diameter ("ESD") combined with contrast,
correlation,
homogeneity, and energy parameters of the corresponding parametric map;
[0016] FIG. 4 is a block diagram of an example computer system that can be
configured to implement embodiments of the present invention;
[0017] FIG. 5 illustrates a series of plots of average values of different
QUS
spectral (first-order) and textural (second-order) parameters obtained for
normal
(control) and fatty livers;
[0018] FIG. 6A is an example scatter plot on a plane of MBF energy and MBF
correlation parameters with data obtained for normal (control) and fatty
livers, where
samples for the two tissue types were classified using linear discriminant
analysis on
the combined parameters associated with the plane and the classification
border is
illustrated as the dashed line;
[0019] FIG. 6B is an example scatter plot on a plane of MBF energy and SS
-4-
CA 02912791 2015-11-18
WO 2014/186899
PCT/CA2014/050480
parameters with data obtained for normal (control) and fatty livers, where
samples for
the two tissue types were classified using linear discriminant analysis on the
combined
parameters associated with the plane and the classification border is
illustrated as the
dashed line;
[0020] FIG. 6C is an example scatter plot on a plane of SS energy and SS
parameters with data obtained for normal (control) and fatty livers, where
samples for
the two tissue types were classified using linear discriminant analysis on the
combined
parameters associated with the plane and the classification border is
illustrated as the
dashed line; and
[0021] FIG. 6D is an example scatter plot on a plane of SI energy and SI
parameters with data obtained for normal (control) and fatty livers, where
samples for
the two tissue types were classified using linear discriminant analysis on the
combined
parameters associated with the plane and the classification border is
illustrated as the
dashed line.
DETAILED DESCRIPTION OF THE INVENTION
[0022] Described here are systems and methods for characterizing tissue
using
quantitative ultrasound techniques. Parameters are calculated directly from
raw echo
signal data acquired from a region-of-interest during an ultrasound scan.
Preferably,
these parameters are calculated after normalizing the echo signal data using
reference
data so as to mitigate the effects of variations in instruments settings,
ultrasound beam
diffraction, and attenuation effects. For instance, quantitative ultrasound
("QUS")
parameters such as mid-band fit ("MBF"), spectral slope ("SS"), spectral O-Mhz
intercept
("SI"), spacing among scatterers ("SAS"), effective scatterer diameter
("ESD"), and
effective acoustic concentration ("EAC") can be computed, from which
parametric maps
associated with the region-of-interest are generated. First-order and second-
order
statistical measures are computed from these parametric maps, and are used to
characterize the tissue or tissues in the region-of-interest. Using these
systems and
methods, tissue can be characterized in different levels of classification.
For instance, a
tissue characterized as malignant cancer can additionally be graded (e.g.,
Grade I, II, or
III), and tissue characterized as fibrotic liver can additionally be
characterized based on
stage of liver fibrosis. As such, the systems and methods described here
provide for
non-invasive, highly accurate characterization and grading of tissues.
-5-
CA 02912791 2015-11-18
WO 2014/186899
PCT/CA2014/050480
[0023] Referring now to FIG. 1, a flowchart setting forth the steps of an
example
of a method for characterizing a tissue using quantitative ultrasound is
illustrated. The
method generally begins with the acquisition of ultrasound echo signal data
from a
region that contains the tissue to be characterized, as indicated at step 102.
The echo
signal data, also referred to as radio frequency ("RF") data, is acquired in
response to
ultrasound transmitted to the region-of-interest. The transmitted ultrasound
is
preferably conventional-frequency, but can also be high-frequency ultrasound.
In some
instances, it may also be beneficial to use combinations of low-frequency and
high-
frequency ultrasound depending on the depth of the tissue and the desired
imaging
resolution. For instance, higher ultrasound frequencies are capable of
increasing
imaging resolution, but at the cost of limiting the penetration depth of the
ultrasound.
For example, ultrasound frequencies in the range of 20-60 MHz can achieve
imaging
resolutions in the range of 30-80 nm, whereas ultrasound frequencies in the
range of 1-
20 MHz can achieve imaging resolutions of 30 nm to about 1.5 mm.
[0024] By way of example, echo signal data can be acquired from a subject
using
an ultrasound system operating at a conventional ultrasound frequency, such as
6 MHz
or 10 MHz. Alternatively, the ultrasound system can be operated to generate
high
frequency ultrasound, such as greater than 20 MHz. The echo signals can be
obtained in
a number of differently oriented image planes. Optionally, B-mode images can
also be
acquired and used to identify one or more region-of-interest ("ROI")
containing the
tissue or tissues to be characterized. As an example, each selected ROI can
then be
segmented using a sliding window approach with or without overlap between
adjacent
windows. Each window is advantageously sized to be larger than the minimum
size
required to obtain reliable spectral parameters that are independent of window
length.
For instance, the window can be sized to be larger than ten wavelengths of the
transmitted ultrasound.
[0025] From the echo signal data, one or more parametric maps are
generated, as
indicated at step 104. For instance, the parametric maps are images whose
pixel values
are representative of quantitative ultrasound parameters computed from the raw
echo
signal data. Examples of such parameters include mid-band fit ("MB F"),
spectral slop
("SS"), spectral 0-MHz intercept ("SI"), spacing among scatterers ("SAS"),
effective
scatterer diameter ("ESD"), and effective acoustic concentration ("EAC"). An
example of
how these parameters may be calculated is provided below.
-6-
CA 02912791 2015-11-18
WO 2014/186899
PCT/CA2014/050480
[0026] First, a mean power spectrum can be computed in each window of a
selected ROI by taking the squared magnitude of the Fourier transform of the
Hanning
gated RF echo, es(t,x,) , and averaging the result across the RF lines, xi ,
= N, N +1,...,M
[0027] In order to make the analysis system-independent, the echo signal
data
can be normalized on a sliding window basis using reference data obtained from
a
tissue-mimicking phantom, a planar reflector, or the like. To this end,
reference echo
signal data can optionally be provided, as indicated at step 106.
[0028] For example, a tissue-mimicking phantom composed of agar gel
embedded with glass microspheres can be used to obtain reference echo signal
data.
Preferably, such reference echo signal data can be used for normalizing the
mean power
spectrum on which linear regression analyses will be performed in order to
extract a
number of quantitative ultrasound parameters, such as MBG, SS, and SI.
[0029] As another example, a planar reflector, such as a Plexiglas planar
reflector, can be used to obtain reference echo signal data to be used when
computed
SAS in order to avoid affecting the estimation of SAS in the tissue by the
glass scatterers
in the tissue-mimicking phantom. Reference echo signal data obtained from such
a
planar reflector are preferably obtained at a plurality of different depths to
cover the
potential tissue depths in the region of the subject. As an example, twelve
equally
spaced depths ranging from 1-6 cm can be utilized.
[0030] For a given data window, the corresponding reference window can be
selected by nearest neighbor interpolation. Spectral normalization of the mean
power
spectrum may be performed using RF echoes obtained from a reference phantom,
ep (t, x), to remove the system transfer function. The mean normalized power
spectrum, S ( f ), of a window can be written as,
IFFT(es(t,x,))r
s(f)=7
I1(1);
FFT(ep (t, ,12
i=N
[0031] where f is frequency and FFT (= = =) is the Fast Fourier Transform
operator. A linear regression analysis, such as a least squares fit, can then
be applied to
-7-
CA 02912791 2015-11-18
WO 2014/186899
PCT/CA2014/050480
the mean normalized power spectrum to extract the MBF, SS, and SI parameters
as
follows:
S(f )= SS = f + SI (2);
MBF = SS = fc+ SI (3);
[0032] where fc. is the frequency at the center of the analysis bandwidth,
which
may be the -6 dB frequency bandwidth. More generally, the bandwidth can be
determined empirically, such as from the power spectrum of a reference
phantom.
[0033] SAS can be estimated using an autoregressive ("AR") model of the
echo
signal, as one example. The AR model predicts the output of a stationary
stochastic
process as a linear combination of previous samples of its output, which can
be written
as,
[t] = akes [t ¨ w[t] (4);
k=1
[0034] where ak are the AR coefficients, w [t] is a white noise input
sequence,
õ
and p is the order of the AR model. The power spectrum, IX 2 , can
be obtained by
Fourier transforming both sides of Eqn. (4) as follows,
2
= 52
2 (5).
1+ IP ake-j27rik
k=1
[0035] The normalized AR power spectrum, S AR( f ) , is obtained similar
to Eqn.
(1), except that the numerator is an AR-estimated power spectrum, IX (f) 2 ,
and the
denominator is reference echo data, er(t), such as that obtained from a planar
reflector as described above. The subscript "n" in er(tn) represents discrete
depth
intervals at which the reference echo data is obtained. Also, in some
instances the
reference echo data, er(tn), can be independent of lateral location, xi , as
the power
spectrum of the reference can be averaged laterally across the entire
transducer width,
L, to obtain a smooth mean power spectrum. More generally,
-8-
CA 02912791 2015-11-18
WO 2014/186899
PCT/CA2014/050480
jx (f,Xi)12
SAR f, Xi = Mi=N
(6).
IIFFT(er(tõ,xj))12
i=N
[0036] The autocorrelation of the normalized AR power spectrum can then be
computed as,
Rff(Af)= 1S(f)S(f ¨Af) (7);
Af
[0037] which is termed the spectral autocorrelation ("SAC"). The SAS
corresponds to the frequency lag, Af, , at which the first peak in the SAC
occurs, Af ,
and thus can be computed as,
SAS = ______________________________________________________________ (8);
2Afp
[0038] where C is the mean speed of sound in the tissue of interest. As one
example, for normal breast tissue, which encompasses both fatty and
parenchymal
tissue, a sound speed of 1455 m/s can be assumed, while for breast tumors, a
sound
speed of 1540 m/s can be assumed. These values are consistent with tomography
measurements of the speed of sound in the breast.
[0039] Other quantitative ultrasound parameters that can be computed from
the
echo signal data are the effective scatterer diameter ("ESD") and effective
acoustic
concentration ("EAC"), which can be estimated by fitting a theoretical tissue
backscatter
model to the measured backscatter signal from the tissue of interest. For
example,
estimated and theoretical backscatter coefficients ("BSCs") can be used to
compute ESD
and EAC.
[0040] The BSC, igh(f) is defined as the differential backscattering cross-
section per unit volume and is related to the normalized sample power
spectrum,
S (f), through a scaling factor that includes the gate length, Az, aperture
area, Ao ,
and the distance between the transducer and the proximal surface of the gated
ROI, R.
The BSC can thus be computed as follows:
1.45 = R2
Cb(f)= (A Az)S(f) (9);
-9-
CA 02912791 2015-11-18
WO 2014/186899
PCT/CA2014/050480
[0041] The formula for the BSC in Eqn. (9) was originally developed for
single-
element transducers. For clinical ultrasound applications, where linear array
transducers are used, a reference phantom technique can be used to estimate
the BSC,
, Az,
Ss ( f) 4(-a) R+
abs(f)=5ç ( )abr(f)e , 2 , (10);
r
[0042] where the subscript s denotes sample and the subscript r denotes
reference, and a is the attenuation coefficient.
[0043] Once the BSC estimate of an ROI in the sample is obtained, the
average
ESD and EAC for the ROI can be estimated by least squares fitting of the
estimated and
theoretical BSCs. For the theoretical BSC, the Gaussian form factor can be
used. The
Gaussian form factor describes spherical scatterers whose acoustic impedance
varies
continuously with the surrounding material. In contrast to the SAS estimation,
which is
based on detection of coherent scatterers, the Gaussian form factor is a model
for
estimating the properties of incoherent scatterers. This form factor has been
proven
useful for characterizing mouse models of breast cancer and human lymph nodes.
[0044] At least one first-order statistical measure of the one or more
parametric
maps produced in step 104 is computed, as indicated at step 108. In general
first-order
statistics are computed from a function that measures the probability of a
certain pixel
occurring in an image and, therefore, depend on individual pixel values and
not on the
interaction of neighboring pixel values. By way of example, the first-order
statistical
measure may be the mean of a parametric map. Alternatively, the first-order
statistical
measure may be the standard deviation, skewness, or kurtosis of a parametric
map.
[0045] At least one second-order statistical measure of the one or more
parametric maps produced in step 104 is also computed, as indicated at step
110. In
general, second-order statistics are computed from a probability function that
measures
the probability of a pair of pixel values occurring at some offset in an
image. This
probability function is typically referred to as a "co-occurrence matrix"
because it
measures the probability of two pixel values co-occurring at the given offset.
An
example of the co-occurrence matrix is the gray level co-occurrence matrix
("GLCM").
These second-order statistics can generally be referred to as textural
features of an
image. The application of textural analysis on the quantitative ultrasound
parametric
maps, where instrument dependencies are preferably removed via the
aforementioned
normalization, provides advantageous information for the tissue
characterization
-10-
CA 02912791 2015-11-18
WO 2014/186899
PCT/CA2014/050480
techniques described later.
[0046] The GLCM represents, statistically, the angular relationship between
neighboring pixels as well as the distance between them. Based on the
statistical
information provided by a GLCM, several textural features can be defined and
extracted.
By way of example, the second-order statistical measure computed in step 110
may
include contrast, energy, homogeneity, or correlation. Alternatively, the
second-order
statistical measure could include other second-order statistics, including
autocorrelation, dissimilarity, GLCM variance, entropy, cluster shade, cluster
prominence., and maximum probability
[0047] Contrast ("CON") represents a measure of difference between the
lowest
and highest intensities in a set of pixels. Energy ("ENE") measures the
frequency of
occurrence of pixel pairs and quantifies its power as the square of the
frequency of gray-
level transitions. Homogeneity ("HOM") measures the incidence of pixel pairs
of
different intensities; thus, as the frequency of pixel pairs with close
intensities
increases, HOM increases. Correlation ("COR") measures the intensity
correlation
between pixel pairs.
[0048] The computed parametric maps are processed using a GLCM-based
texture analysis process to extract the aforementioned second-order
statistical
measures, which may also be referred to as textural features, as follows. A
GLCM is an
N X N matrix, where N is the number of quantized gray levels in the image for
which the GLCM is computed (e.g., the parametric maps in this instance). Each
element
=th
in the GLCM, p (i, j) , is a statistical probability value for changes between
the / and
=th
j gray levels at a particular displacement distance, d, and angle, 0. Thus,
given
p (i, j) as an element in an Ng x Ng GLCM, the above-mentioned textural
parameters
can be defined as follows:
Ng-1 (Ng Ng
CON= k2 p (i, j) with k -j (11);
k=0 i=1 j=1
Ng Ng
ENE = (12);
j=1
-11-
CA 02912791 2015-11-18
WO 2014/186899
PCT/CA2014/050480
Ng Ngp (id)
HOM =11 ____________________________________________________________ (13);
j=i 1 A
Ng Ng
11(i 11x)( j)
COR = ___________ i=1 j=1 (14);
6 6
x y
[0049] where ,Ux and ,u are the means for the columns and rows,
respectively,
of the GLCM,
Ng Ng
eUx (i, j) (15);
j=1
Ng Ng
illy =11 j P (i, j) (16);
j=1
[0050] and where 6x and 0- are the standard deviations for the columns and
rows, respectively, of the GLCM,
Ng Ng
2
Cx2 =11(i ¨gc) P(i,j) (17);
j=1
Ng Ng
2
=2
CY = 11(j MUY Mid) (18).
j=1
[0051] A number of different GLCMs can be constructed for each parametric
map.
For example, sixteen symmetric GLCMs can be constructed considering each
pixel's
neighbors located at the displacement distances, d, of one to four pixels with
angular
values, 0, of 0-135 degrees with 45 degree increments. The second-order
statistical
measures, or textural features, can then be extracted from the corresponding
GLCMs of
each QUS parametric map and consequently averaged to produce the computed
second-
order statistical measures. This example results in sixteen second-order
statistical
measures (CON, ENE, HOM, and COR for each of MBF, SS, SI, and SAS parametric
maps),
which, as described below, can be applied for distinguishing tumors or other
pathologic
disease states from normal tissue, as well as for grading tumors and staging
other
diseases, such as liver fibrosis.
[0052] Using the at least one first-order statistical measure and the at
least one
second-order statistical measure computed earlier, the tissue in the region-of-
interest is
-12-
CA 02912791 2015-11-18
WO 2014/186899
PCT/CA2014/050480
characterized, as indicated in step 112. For example, the tissue is
characterized by
identifying a combination of the first-order and second-order statistical
measures that
is representative of a defined class, such as a tissue state, disease
progression state, or
tumor grade. As such, combinations of the first-order and second-order
statistical
measures of the quantitative ultrasound parametric maps can be viewed as
defining
imaging biomarkers that indicate the histological state of tissue.
[0053] The histological state of tissue can include whether the microscopic
anatomy of a tissue is normal and healthy, or whether the microscopic anatomy
of the
tissue is in some way abnormal. The microscopic anatomy of a tissue can be
considered
abnormal as a result of any number of different processes. For example, a
tissue can be
characterized as having an abnormal histological state when the tissue is has
become
cancerous, whether benign or malignant, or affected by other pathologies. As
one
example, when the tissue is liver, histological states may include liver
fibrosis, non-
alcoholic fatty liver disease ("NAFLD"), cirrhosis, and ischemic damage of the
liver
tissue. A tissue can also be characterized as having an abnormal histological
state when
it has undergone structural changes, such as scarring in response to
mechanical,
thermal, or other stresses, or when it has undergone apoptosis.
[0054] By way of example, a discriminant analysis, such as a linear
discriminant
analysis ("LDA"), can be implemented to characterize the tissue based on the
first-order
and second-order statistical measures of the parametric maps. The
characterization
process can include multiple steps. For instance, the first iteration of
characterization
can indicate whether a tissue is normal or cancerous. If the tissue is
characterized as
cancerous, a second iteration of characterization can be performed to grade
the tumor
by categorizing the tumor into histopathological grades (e.g., Grade I, II, or
III).
[0055] To characterize tissue using LDA, the linear discriminant can be
trained
for the tissue being analyzed. Examples of tissues that can be analyzed
include, but are
not limited to, tissues in the breast, liver, brain, prostate, kidney,
bladder, gallbladder,
spleen, cervix, blood vessels, muscle, and bone. This training can be
performed in real-
time or, preferably, can be performed off-line with the results stored in a
feature set
database that can be provided during processing. Such a feature set database
includes
combinations of the first-order statistical measures and second-order
statistical
measures that maximize, or otherwise provide desired levels of, the
specificity and
sensitivity of the tissue characterization for a given organ (e.g., breast,
liver, brain,
-13-
CA 02912791 2015-11-18
WO 2014/186899
PCT/CA2014/050480
prostate, kidney, bladder, gallbladder, spleen, cervix, blood vessels, muscle,
bone) or
tissue type (e.g., brain gray matter, brain white matter). As discussed above,
these
feature sets can define imaging biomarkers for the specific organ or tissue
type and can
additionally define imaging biomarkers for tumor grading.
[0056] It is
also noted that that statistical measures other than first-order or
second-order statistics can be computed and implemented in the tissue
characterization
process. For instance, higher-order statistics of the parametric maps can be
computed
and included in a feature set. Examples of higher-order statistics include
third-order
statistics, which consider the relationships among three or more pixels,
fourth-order
statistics, which consider the relationships among four or more pixels, and so
on.
Higher-order statistics can also be derived by computing second-order or
higher-order
statistics of the statistical parameters maps generated by computing the
second-order
statistics of quantitative ultrasound parametric maps. For instance, higher-
order
statistics can be computed by first producing a statistical map that indicates
a particular
second-order statistic of a parametric map and then computing a second-order
statistic
of that statistical map. This process can be iteratively applied to acquire
higher-order
statistics if desired.
[0057] It will
be appreciated by those skilled in the art that each organ and tissue
type may have a different feature set that provides the desired accuracy for
characterizing a tissue or grading a tumor. In general, a feature set includes
at least one
first-order statistical measure of at least one parametric map and at least
one second-
order statistical measure of at least one parametric map. It is contemplated
that in at
least some instances, a single first-order statistical measure and a plurality
of second-
order statistical measures computed for each of two or more parametric maps
will
generally provide clinically acceptable accuracy.
Practically, the two or more
parametric maps can often include at least MBF, SS, and SI because these three
parameters are generally computed together.
[0058] It is
noted that the computational time of the tissue classification method
described above is primarily allocated to generating the parametric maps. As
one
example, computing MBF, SS, SI, and SAS maps for one subject can take upwards
of ten
minutes; although, this time can be considerably lessened by using a processor
such as a
graphics processing unit ("GPU"). Other steps of the method, such as computing
the
GLCM matrices and textural parameters can be performed on the order of a
second or
-14-
CA 02912791 2015-11-18
WO 2014/186899
PCT/CA2014/050480
two, and characterization step (e.g., using discriminant analysis) can be
performed in a
manner of a few milliseconds. Overall, the method can be performed in a
clinically-
relevant period of time.
[0059] As an alternative to using LDA to characterize tissues, other
statistical
analyses can be implemented. Examples of other statistical analyses that can
be
implemented include an unpaired t-test for normally distributed data, a Mann-
Whitney
unpaired test, a pairwise comparison using a paired t-test for normally
distributed data,
a Wilcoxon paired test for non-parametric data, and a one-way AN OVA test when
trying
to differentiate more than two tissue types. As an alternative to use LDA,
other pattern
recognition or machine learning techniques can be used for tissue
classification and
characterization. Examples of alternative techniques include using artificial
neural
networks ("ANNs") or a support vector machine ("SVM").
[0060] Having described the general steps of a method for characterizing a
tissue's histological state using first-order and second-order statistical
measures of
quantitative ultrasound parameter maps, some examples of implementing this
method,
and of different clinical applications for such a method, are now described.
[0061] In one example, breast tissue can be characterized. The first-order
and
second-order statistical measures listed in Table 1 below define an example of
an
imaging biomarker that can achieve 100 percent sensitivity, 97 percent
specificity, and
98 percent overall accuracy in characterizing breast tissue as either normal
or
cancerous. In addition, the same set of measures can further define an imaging
biomarker that can achieve 91 percent accuracy in grading the characterized
cancerous
breast tissue as Grade I, II, or III.
Table 1
First-Order Statistical Measures Second-Order Statistical Measures
Mean of MBF CON, ENE, HOM, and COR of MBF
Mean of SS CON, ENE, HOM, and COR of SS
Mean of SI CON, ENE, HOM, and COR of SI
Mean of SAS CON, ENE, HOM, and COR of SAS
[0062] Examples of two-dimensional scatter plots for quantitative
ultrasound
data that has been classified using the method described above, and using a
-15-
CA 02912791 2015-11-18
WO 2014/186899
PCT/CA2014/050480
discriminant analysis approach, are illustrated in FIGS. 2A-2C. These scatter
plots
illustrate an example in which the quantitative ultrasound data has been
obtained from
a population of subjects each having different grades of breast tumors. The
axes of the
scatter plots define the plane of the canonical discriminant functions
acquired. FIG. 2A
corresponds to using only the means of MBF, SS, SI, and SAS; FIG. 2B
corresponds to
using only the CON, ENE, HOM, and COR of MBF, SS, SI, and SAS; and FIG. 2C
corresponds to using both the means and CON, ENE, HOM, and COR of MBF, SS, SI,
and
SAS. Step-by-step enhancements in between-class separability can be observed
considering more isolated class centroids, resulting in a reduced number of
misclassified samples.
[0063] An example of one-dimensional scatter plot of a linear discriminant
function computed using the mean and CON, ENE, HOM, and COR of a single
parametric
map, the ESD, for a population of subjects with varying grades of breast
cancer is
illustrated in FIG. 3. This example illustrates that in some instances, the
first-order and
second-order statistics of a single parametric map can be used to classify
tissues or to
grade tumors.
[0064] Thus, systems and methods for characterizing tissue and grading
tumors
using first-order and second-order statistical measures of quantitative
ultrasound
parametric maps have been described. The systems and methods are capable of
defining imaging biomarkers based on the first-order and second-order
statistical
measures of quantitative ultrasound parametric maps and using those imaging
biomarkers to classify tissues based on their histological state (e.g.,
normal, and varying
abnormal states). For instance, different pathological breast tissues can
be
distinguished including normal tissue and Grades I, II, and III invasive
carcinoma. Other
tissue histological states can also be characterized. For instance, it is
contemplated that
varying stages of liver fibrosis can be distinguished and characterized using
the systems
and methods described here.
[0065] Dynamic changes in the histological state of tissues can also be
characterized by comparing parametric images acquired at different time
points. By
way of example, the system and methods described here can thus be used to
monitor
changes in tissue histological state over time. As one example, the changes in
tissue
histological state can be associated with disease progression, such as a tumor
advancing
from Grade I to Grade II, or liver fibrosis advancing from a less severe stage
to a more
-16-
CA 02912791 2015-11-18
WO 2014/186899
PCT/CA2014/050480
severe stage. As another example, the changes in tissue histological state can
be
associated with a response to a treatment, such as chemotherapy or radiation
therapy.
In this manner, the systems and methods described here can be used to develop
and
implement adaptive treatment strategies that are tailored to a particular
patient based
on their response level to a particular treatment.
[0066] The systems and methods described here can also be used to gain a
better
understanding of the microstructural changes in tissue from one histological
state to
another. For example, as described by F. L. Lizzi, et al., in "Comparison of
theoretical
scattering results and ultrasonic data from clinical liver examinations,"
Ultrasound in
Medicine & Biology, 1988; 14N:377-385, the SS parameter can be related to ESD,
the SI
parameter can be related to EAC, and the MBF parameter can be related to both
ESD
and EAC. As one example, breast tumors generally appear as relatively
hypoechoic
regions in ultrasound B-mode images, whereas normal tissue typically
demonstrates
relatively hyperechoic characteristics. However both normal and cancerous
breast
tissues exhibit heterogeneous patterns in ultrasound B-mode images. In the
parametric
images described above, lower MBF values can generally be seen in breast
tumors
compared to normal breast tissue, and the MBF values generally vary with
breast tumor
grade. The MBF also generally shows contrast between the breast tumor and
adjacent
tissue. The SS parameter generally varies with breast tumor grade and normal
tissue,
but is not tumor-specific so there is generally little contrast between breast
tumor and
adjacent tissue. The SI parameter is generally fairly similar to the SS
parameter. The
SAS parameter images generally depict a higher SAS value in normal tissue
compared to
breast tumors. Among breast tumors, there is generally a greater degree of
heterogeneity in Grades II and III compared to that of Grade I.
[0067] Referring now to FIG. 4, a block diagram of an example computer
system
400 that can be configured to characterize tissue using the quantitative
ultrasound
techniques described above, is illustrated. The echo signal data can be
provided to the
computer system 400 from an ultrasound system, or from a data storage device,
and is
received in a processing unit 402.
[0068] In some embodiments, the processing unit 402 can include one or more
processors. As an example, the processing unit 402 may include one or more of
a digital
signal processor ("DSP") 404, a microprocessor unit ("MPU") 406, and a
graphics
processing unit ("GPU") 408. The processing unit 402 can also include a data
-17-
CA 02912791 2015-11-18
WO 2014/186899
PCT/CA2014/050480
acquisition unit 410 that is configured to electronically receive data to be
processed,
which may include echo signal data or digital images. The DSP 404, MPU 406,
GPU 408,
and data acquisition unit 410 are all coupled to a communication bus 412. As
an
example, the communication bus 412 can be a group of wires, or a hardwire used
for
switching data between the peripherals or between any component in the
processing
unit 402.
[0069] The DSP
404 can be configured to receive and processes the echo signal
data. For instance, the DSP 404 can be configured to receive the echo signal
data and
form a digital image therefrom. The MPU 406 and GPU 408 can be configured to
process
the echo signal data, or a digital image formed therefrom, in conjunction with
the DSP
404. As an example, the MPU 406 can be configured to control the operation of
components in the processing unit 402 and can include instructions to perform
processing of the echo signal data, or a digital image formed therefrom, on
the DSP 404.
Also as an example, the GPU 408 can process image graphics. Also
[0070] In some
embodiments, the DSP 404 can be configured to process the echo
signal data, or a digital image formed therefrom, received by the processing
unit 402 in
accordance with the algorithms described herein. Thus, the DSP 404 can be
configured
to generate parametric maps, compute first-order and second-order statistical
measures of the parametric maps, and characterize tissues based on the first-
order and
second-order statistical measures.
[0071] The
processing unit 402 preferably includes a communication port 414 in
electronic communication with other devices, which may include a storage
device 416, a
display 418, and one or more input devices 420. Examples of an input device
420
include, but are not limited to, a keyboard, a mouse, and a touch screen
through which a
user can provide an input.
[0072] The
storage device 416 is configured to store echo signal data, digital
images, or both, whether provided to or processed by the processing unit 402.
The
display 418 is used to display images, such as images that may be stored in
the storage
device 416, and other information. Thus, in some embodiments, the storage
device 416
and the display 418 can be used for displaying the parametric maps, and for
outputting
other information such as data plots or other reports based on statistical
measures
computed from the parametric maps, including information indicating a
characterization of tissues.
-18-
CA 02912791 2015-11-18
WO 2014/186899
PCT/CA2014/050480
[0073] The processing unit 402 can also be in electronic communication with
a
network 422 to transmit and receive data, including echo data, images, and
other
information. The communication port 414 can also be coupled to the processing
unit
402 through a switched central resource, for example the communication bus
412.
[0074] The processing unit 402 can also include a temporary storage 424 and
a
display controller 426. As an example, the temporary storage 424 can store
temporary
information. For instance, the temporary storage 424 can be a random access
memory.
Example: Characterizing Fatty Liver
[0075] In this example, liver tissue was characterized using the
quantitative
ultrasound ("QUS") analysis methods described above. The results indicate that
the
methods are capable of characterizing fatty liver tissue relative to normal
liver tissue,
thereby providing diagnostic value for evaluating histological states of liver
tissues,
including whether a particular liver tissue is afflicted by NAFLD.
Materials and methods
[0076] Liver Samples. In this example, fresh liver samples were extracted
from
New Zealand White rabbits. A group of the rabbits consumed a standard chow
diet and
was used as a control for the study. Another group of the rabbits had been on
a special
fatty diet, which contained 2% cholesterol and 6% peanut oil, for two weeks,
followed
by 12 weeks of normal diet. Water was given ad libitum and food was given
daily to the
rabbits. The feed intake was measured daily and rabbit weights were done
weekly. The
animals were housed individually in standard stainless steel cages at normal
room
temperature and light cycles.
[0077] Ultrasound Data Acquisition and Processing. Ultrasound images and
radio-frequency ("RF") data were collected from the liver specimens, which
were
completely submerged in phosphate buffered saline ("PBS") solution, within
five
minutes of the removal of the liver from the body. The specimens were scanned
using a
Sonix RP system (Ultrasonix, Vancouver, Canada) and a L14-5/38 transducer,
with a
centre frequency of about 6.5 MHz, and a sampling frequency of 40 MHz. The
system
was used to collect three-dimensional data with scan plane separations of 0.5
mm.
[0078] Ultrasound data were analyzed across scan planes, within a
standardized
region of interest ("ROI") positioned at the transducer focal depth.
Ultrasound RF data
analysis was performed using the normalized power spectrum, and textural
analysis on
QUS parametric maps, to extract quantitative ultrasound spectral and textural
-19-
CA 02912791 2015-11-18
WO 2014/186899
PCT/CA2014/050480
parameters (i.e., first-order and second-order statistics of quantitative
ultrasound
parametric maps).
[0079] Power spectra were calculated using a Fourier transform of the raw
RF
data for each scan line through the ROI and subsequently averaged. The power
spectra
were corrected for attenuation, with a fixed attenuation coefficient of 0.7
dB/MHz/cm,
using a point attenuation compensation approach. In order to remove effects of
system
transfer functions, the US RF data were normalized using reference data
obtained from
a tissue-mimicking phantom, through a sliding-window analysis approach. In
particular,
data were normalized against averaged power spectrum obtained from a glass-
bead-
embedded agar-gel phantom model, scanned with the same setting used for the
liver
scans, in order to more accurately account for beam diffraction effects and
other
instrument-dependent factors, considering the use of a linear array
transducer.
[0080] Linear regression analysis was performed on the averaged power
spectrum within a center frequency-based -6 dB window (bandwidth of 4-9 MHz)
to
generate a best-fit line. Parameters extracted included the mid-band fit
("MBF"), the
spectral slope ("SS"), and the corresponding spectral 0-MHz intercept ("SI").
The
parametric maps were generated using the sliding window analysis on a pixel-by-
pixel
basis, with the parameters calculated for each window and assigned to its
centre. The
sliding window had a size of 2 mm-by-2 mm.
[0081] Texture analysis on QUS parametric maps (e.g., MBF, SS, and SI) was
performed on the basis of a gray-level co-occurrence matrix ("GLCM"). Sixteen
symmetric GLCMs were constructed considering each pixel's neighbors located at
a
distance of one to ten pixels with angular values of 0-135 degrees at 45
degree
increments. Textural parameters (e.g., homogeneity, contrast, correlation, and
energy)
were extracted from the corresponding GLCMs of each QUS parametric map and
were
subsequently averaged.
[0082] Statistical Analysis and Tissue Categorization. Statistical analyses
were applied in order to evaluate if normal and fatty livers demonstrate
statistically
significant differences in first and second order statistics of QUS parametric
maps.
Statistical test of significance were conducted using a t-test (unpaired, two-
sided, 95
percent confidence). Linear discriminant analyses ("LDA") were performed using
different combinations of QUS spectral parameters (first-order statistics of
QUS
parametric maps) and textural parameters (second-order statistics of QUS
parametric
-20-
CA 02912791 2015-11-18
WO 2014/186899
PCT/CA2014/050480
maps) in order to differentiate between normal and fatty liver samples non-
invasively.
A step-wise linear discriminant analysis was performed, using the most
significant QUS
spectral and textural parameters, in order to determine an optimized
combination of
QUS parameters for categorizing liver tissue more robustly.
Results
[0083]
Quantitative ultrasound parametric maps could provide favorable
contrasts between normal and fatty liver tissues, as observed in this study.
[0084] FIG. 5
demonstrates average values of single QUS spectral and textural
parameters, obtained for normal and fatty livers, respectively. MBF-
Correlation and
MBF-Energy demonstrated statistically significant differences between the two
tissue
types, whereas no significant differences were observed in the mean values of
the MBF
parameter. Also SS, SS-Homogeneity, SS-Energy, SI, SI-Homogeneity, and SI-
Energy
showed statistically significant differences between the normal and fatty
liver
specimens.
[0085] FIGS.
6A-5D are scatter plots of data on different planes of QUS spectral
and textural parameters. Samples of the two liver-tissue types have been
classified
using linear discriminant analyses on the combined parameters associated with
each
plane. The classification borders have been presented with dash lines. A
sensitivity and
specificity of 80 percent was obtained for detecting fatty liver samples using
MBF-
Correlation and MBF-Energy in a combination (p= 0.018). SS and SS-Energy
combined
parameters resulted in a sensitivity and specificity of 100 percent (p =
0.000), whereas
SI and SI-Energy parameters, in a combination, resulted in a sensitivity of
100 percent
and a specificity of 95 percent (p = 0.000). A step-wise linear discriminant
analysis was
performed using all the six QUS parameters mentioned above, in order to obtain
an
optimized classification plane providing a more robust separability between
the two
tissue-type samples. The step-wise analysis resulted in a combination of the
MBF-
Energy and the SS, as a hybrid QUS parameter, with a sensitivity and
specificity of 100
percent (p = 0.000) for detecting fatty liver specimens.
[0086] The
present invention has been described in terms of one or more
preferred embodiments, and it should be appreciated that many equivalents,
alternatives, variations, and modifications, aside from those expressly
stated, are
possible and within the scope of the invention.
-21-