Note: Descriptions are shown in the official language in which they were submitted.
1~15~91
A METHOD AND SYSTEM FOR
GEOPHYSICAL EXPLORATION
BACKGROUND
The present invention relates generally to a
method and system for geophysical exploration and more
particularly to a method and system for obtaining selected
physical properties from samples of the earth's subterra-
15 nean formations surrounding a wellbore and for obtaininginverse logs of the selected physical properties along the
length of the wellbore for evaluating the oil and gas
bearing potential of the earth's subterranean formations.
In the continuing search for oil and gas, explo-
20 rationists have developed a wide array of geophysicalexploration methods for imaging the earth's subterranean
formation structures and displaying those images as well
: as providing estimates of selected formation char~cter-
istics such as lithology, porosity, density, and velocity
25 of propagation of seismic energy in the earth's forma-
tions. Exemplary of such geophysical exploration methods
seismic surveys, gravity surveys, and magnetic surveys.
The principal geophysical method for oil and gas explora-
tion within the earth's subterranean formation is seismic
-1-
,:
exploration. Simplistically, seismic exploration com-
prises imparting seismic energy into the earth and record-
ing the earth's response thereto. The earth response can
include both refracted and reflected seismic energy. As
5 the seismic energy propagates through the earth, it is
controlled by the physical properties of the rocks and the
fluids contained therein. Unfortunately, explorationists
cannot directly measure these physical properties which
constrain the propagation of seismic energy from the
10 recorded seismic survey data. Rather, seismic exploration
techniques merely provide a measure of the time it takes
the seismic energy to traverse some path. In fact, it is
often times impossible to precisely ascertain the path
taken by the seismic energy. In view of such uncertain-
15 ties, how is it that explorationists are able to estimateformation lithology, fluid content or even simple, recon-
struct formation geometries through which the seismic
energy propagates with only a measure of time? Quite
simply, the answer is explorationists cannot without the
20 aid of additional in'ormation such as estimates of the
velocities of propagation of seismic energy in rock and
rock density as well as other rock and fluid physical pro-
perties. Methods for estimating the velocity of propa-
gation and a density as a function of depth are generally
25 known to those skilled in the art; however, velocity esti-
mations are the weakest element in the inversion of seis-
mic time data.
Often times, wells which have been drilled based
on geophysical survey data are logged using one or more of
--2--
1 3 ~
the well logging techniques such as acoustic logging,
resistivity logging, neutron logging, etc. Results of
such well logging techni~ues can provide the exploration-
ist with selected physical properties generall~ over
S regions of interest along the wellbore length. With such
well logging techniques, explorationists are able to
obtain better estimates of the formation physical proper-
ties for evaluating geophysical survey data. However, it
must be recognized that such well logging techniques still
10 only provide an indirect measure of the formation physical
properties of interest and are generally limited to only
selected regions of interest within a wellbore.
Occasionally, core samples are obtained from
limited regions of interest within a wellbore for trans-
15 port to a central laboratory so that physical propertiesof the formations adjacent the borehole, such as fluid
content of the sample, ~U.S. Patent 2,458,093 M. Muskat,
et al., January 4, 1949), oil content of the sample (U.S.
Patent 2,S31,083, A. L. Smith, November 21, l9S0), and
20 electrical resistivity of the sample (U.S. Patent
2,613,250, H. L. Bilhartz, et al., October 7, 1952), can
be obtained. Unfortunately, such core samples generally
represent only a small fraction of the formational lithol-
ogies traversed by the wellbore along its length. More-
2S over, the delay associated with transporting the samplesto the central laboratory can preclude the measurement of
properties of certain friable lithologies or result in
seriously degraded measurements of certain properties.
During the drilling process, chips which have broken away
--3--
from the subsurface formations can be captured from the
~rilling fluid at the surface for analysis. Typically,
explorationists have identified the lithologies of the
subsurface formations from such chips. However, determin-
5 ing the exact depth in the wellbore from which the chipsoriginated is generally not possible due to the very
nature of their transport to the surface. Consequently,
core samples and chip samples fail to provide either a
regular sampling of borehole formation lithologies along
10 the length of the wellbore or fail to accurately determine
the depth of origin of such samples so that logs of forma-
tion characteristics, as a function of depth over gener-
ally the entire wellbore length, cannot be produced.
Moreover, the very nature of the chip samples can often
lS times preclude measuring certain formation characteristics
(for example, measurement of rock velocity or compressive
strength).
In spite of current geophysical exploration
methods, explorationists are not provided with direct mea-
20 sures of the physical properties of the formations sur-
rounding a wellbore along its length. Rather, attempts to
evaluate and interpret geophysical survey data must gener-
ally depend on estimates of formation physical properties
or on indirect measures of the formation physical proper-
25 ties from only limited regions of interest in the earth'ssubsurface. Consequently, explorationists are unable to
accurately calibrate the vertical extent of their geophy-
sical survey data with direct measures of the earth's phy-
9 ~
sical properties so as to better evaluate the oil and gasbearing potential of the earth's subterranean formations.
In order to overcome the difficulties noted
above, the present invention provides a novel method and
S system of obtaining selected physical properties from sam-
ples of the earth's subterranean formations surrounding a
wellbore and developing inverse logs of the selected phys-
ical properties along the length of the wellbore. Explo-
rationists can employ such inverse logs of the selected
10 physical properties to perform basin analysis whereby the
physical properties obtained at one or more wellbores`can
be used to calibrate geophysical survey data at each well-
bore location and then extrapolate such physical proper-
ties to other locations in the basin with the geophysical
15 survey data so as to evaluate the oil and gas bearing
potential of the earth's subterranean formations.
SUMMARY OF THE INVENTION
The present invention relates generally to a
method and system for geophysical exploration and more
20 particularly to a method and system for obtaining selected
physical properties from samples of the earth's subterra-
nean formations surrounding a wellbore and for obtaining
inverse logs of the selected physical properties along the
length of the wellbore so as to aid the geophysicist in
25 evaluating the oil and gas bearing potential of the
earth's subterranean formations.
In one embodiment of the invention, discrete
samples can be obtained at selected intervals along the
length of a wellbore so as to be representative of the
_5_
~ 3:~3~
formation lithologies traversed by the wellbore along its
length. The discrete samples can then be processed at the
wellsite with a transportable laboratory so as to obtain
measures of a plurality of selected physical properties of
5 the subterranean formations representative of their in-
situ condition. An inverse log of each physical property
as a function of depth can be prepared with which explora-
tionists can evaluate geophysical survey data for oil and
gas potential. In more detail, measures of the subterra-
10 nean formation's compressional wave velocity, shear wavevelocity, grain density, saturated density, dry density,
magnetic susceptibility, compressive strength, and static
elastic moduli can be determined from which one can also
calculate the formation's acoustic impedance and porosity.
Inverse logs of one or more of the physical pro-
perties can be used to perform basin analyses. When used
for basin analysis, the physical properties of each
inverse log can be used to calibrate geophysical survey
data of the basin at one or more wellbore sites within the
20 basin from which the inverse logs were obtained. Having
thus calibrated the geophysical survey data, exploration-
ists can then extrapolate the physical properties to other
locations in the basin remote to the wellbore site with
the geophysical survey data to evaluate the oil and gas
25 potential of the earth's subterranean formations at such
remote locations.
In another embodiment of the invention, a trans-
portable laboratory is provided which is especially
adapted for processing, at a wellsite, large numbers of
--6--
` ~ 3 ~
discrete samples obtained along the length of a wellbore
in a minimum amount of time so as to obtain measures of
the formations physical properties which more properly
reflect their in-situ condition. Timely measurement of
5 the physical properties of certain friable lithologies
~such as shales) is essential if physical properties are
to be obtained at all. Additionally, the in-situ measures
of certain physical properties can be seriously degraded
by a delay in measurement e.g., seismic energy velocities
10 of propagation in the rock, and porosity. Surprisingly,
such properties have been found to vary over a wide ran~e
of values simply due to a delay in the time of their meas-
urement.
The transportable laboratory comprises a plural-
15 ity of highly automated measurement stations each con-
nected to a central processing unit (CPU). By labelin~
each sample with a unique machine readable sample code and
each measurement station with a unique machine readable
station code, reader means can be provided for reading the
20 sample code of each sample and the station cod~ of a
selected mea~urement station into the CPU. Upon receipt
of valid sample and station codes, the CPU initiates the
measurement of the sample at the selected measurement sta-
tion and stores the measurements in a data file associated
25 with the unique sample code. The CPU can also calculate
additional physical properties from selected measured phy-
sical properties. Thus, the transportable laboratory
becomes in effect a "paperless" laboratory since manual
recordation of a sample's identity and it's measured and
~L s3 ~ L
calculated physical properties has been eliminated. The
paperless laboratory greatly reduces errors generally
associated with manually recording such information. In
addition to initiating such measurements and recordation,
5 the CPU can initiate a prescribed sequence of measurements
at a given measurement station as well as collect, collate
and evaluate the physical properties measured to provide
inverse well logs of the measured properties as a function
of depth. Additionally, the CPU can calculate additional
10 physical properties from the physical properties measured
as well as reinterpret geophysical survey data and models
at a remote site.
The present invention will be better understood
with reference to the following drawings and detailed
15 description.
BRIEF DESCRIPTION OF THE DRAWINGS
Figure 1 is a schematic representation of a
transportable laboratory according to the present
invention;
Figure 2 is a generalized flow diagram for the
operation of each measurement station in the transportable
laboratory;
Figures 3 (a, b, c) depict inverse logs of
velocity measured from samples obtained at selected inter-
25 vals along three separate wellbores;
Figures 4 (a, b, c) depict inverse logs ofporosity measured from samples obtained at selected inter-
vals along three separate wellbores;
Figures 5 (a, b, c, d, e) depict inverse logs of
formation properties density, compressional velocity (Vp),
shear velocity (Vs) Vp/Vs ratio, impedance and magnetic
susceptibility from samples obtained at generally ten foot
5 intervals along the length of the wellbore; and
Figures 6 (a, b, c, d, e) depict smoothed
inverse logs of density, compressional velocity (vp),
shear velocity (vs), the ratio vp/vs, and formation impe-
dance, respectively, while Figure 6 (f) represents syn-
10 thetic seismic traces obtained by convolving a sourcewavelet with the inverse log of formation impedance shown
in Figure 5 (e);
Figures 7 (a, b) show a section of a seismic
survey in Fig. 7a, and Fig. 7b depicts an inverse log of
15 formation impedance obtained from samples collected along
the length of the wellbore indicated by the derrick struc-
ture in Fig. 7a.
DETAILED DESCRIPTION OF THE INVENTION
The present invention provides a novel method
20 and system for geophysical exploration.
The following discussion is provided in order to
more completely understand the present invention. In the
continuing search for oil and gas, explorationists employ
a variety of geophysical and geological survey techniques
25 to identify regions having potential oil and gas forma-
tions. By their very nature, such geophysical and geolog-
ical survey techniques generally provide only indirect
estimates of selected subsurface formation properties
which the explorationist uses to interpret potential oil
_g_
and gas formations. Moreover, such survey techniques gen-
erally depend on at least estimates of selected physical
properties of the earth's subterranean formations before
any meaningful interpretation can be made of either the
5 formations' structure or their oil and gas bearing poten-
tial
By way of example, explorationists often times
employ the time it takes seismic energy to travel from the
earth's surface to a reflecting horizon and back again to
10 infer structure, lithology, porosity fluid content as well
as the path traversed by the seismic energy. Similarly,
magnetic surveys can provide estimates of formation struc-
ture. However, geophysical and geological survey tech-
niques do not generally directly measure the properties of
15 interest, but rather simply provide indirect measures of
other characteristics of the formation from which it is
possible for the explorationist to estimate the physical
properties of interest.
After a wellbore is drilled, well logging tech-
20 niques (such as sonic logging, electric resistivity log-
ging, gamma ray logging, gravity logging, neutron logging,
etc.) can provide additional estimates of the subsurface
formation properties of interest. However, additional
sources of error (such as borehole rugosity, mudcaking,
25 varying borehole dimensions, variation of and borehole
fluids) can be introduced by such logging techniques which
may adversely affect the quality of the estimates of the
formation physical properties. On occasion, wellbores
have been cored to provide a few samples of selected for-
--10--
mations over limited intervals adjacent the wellbore fromwhich direct measures can be obtained. Generally, such
samples are obtained at a wellsite and then transported to
a central facility for measurement some time thereafter.
5 However, Applicants have found that certain formation pro-
perties (such as velocity and porosity) can be substan-
tially altered if they are not measured shortly after
removal from the wellbore, while the physical properties
for certain friable lithologies are simply not obtainable
10 at all if not done within a few hours after their removal
from the wellbore. Moreover, even for those formation
physical properties not affected by time, the physical
properties measured are generally measured on only a hand-
ful or so of samples over a very short interval of the
15 wellbore. Consequently, the explorationist is simply not
provided with direct measures of formation physical prop-
erties for substantially the entire length of the well-
bore. Hence, the value of such information is limited to
regions adjacent the borehole from which the samples came
20 and the explorationist is left to evaluate and interpret
the balance of his geophysical survey data with only esti-
mates of the subterranean formation physical properties.
In one embodiment of the invention, core samples
can be obtained over substantially the entire length of a
25 wellbore; however, an important aspect of the present
invention is that discrete samples of the earth's forma-
tions surrounding a wellbore need only be taken at
selected intervals along the length of the wellbore. One
criteria for establishing the sampling intervals is that
--11--
~ Q ~
discrete samples generally be obtained for every formation
lithology traversed by the wellbore along its length.
Since the physical properties of the formations surround-
ing the wellbore can also be used to evaluate and cali-
5 ~rate geophysical survey data (e.g., seismic survey data),the minimum resolution interval of the geophysical survey
data being evaluated establishes another criteria for the
sampling interval. Typically seismic data has the finest
resolution interval of any geophysical survey technique
10 (approximately 100 ft). In practice, we have found that a
sampling interval of one sample every 10 ft adequately
addresses the criteria of lithology changes as well as the
geophysical survey minimum resolution interval criteria so
as to address the problems of heterogeneous rather than
15 homogeneous earth formations so that the physical proper-
ties of the samples can be correlated with geophysical
survey data without introducing sampling bias.
In another embodiment of the invention, a trans-
portable laboratory is provided so as to process samples
2~ obtained from the earth's formations surrounding a well-
bore along its length. Since timely measurement of cer-
tain physical properties and of certain lithologies can be
important, the transportable laboratory is preferably con-
figured for field operation in the vicinity of the well-
25 bore. Generally, the transportable laboratory comprises aplurality of measurement stations, each adapted to measure
at least one physical property of each sample. Addi-
tionally, the transportable laboratory includes a central
processing unit for identifying samples, initiating meas-
-12-
urements on the samples at selected measurement stations,and storing the measured physical properties in a sample
data file.
Prior to discussing the operation of each meas-
5 urement station of the transportable laboratory A, the
basic sequence of steps for all operations will be dis-
cussed with reference to both ~igures 1 and 2. Every
sample which enters the transportable laboratory A is
given a unique machine readable sample code (which
10 includes a well identifier, date and depth). Preferably,
such sample codes are included on a label adapted to be
mounted on each sample. Every measurement station is
assigned a unique machine readable station code. Prefera-
bly, the sample codes and station codes are bar codes
15 which can be read by a laser bar code reader into a cen-
tral processing unit (CPU). As such, the transportable
laboratory A is capable of processing a large number of
samples through each of the various measurement stations
employing multiple, asynchronous flow paths, until each
20 sample has been through each measurement station. To ini-
tiate a measurement sequence at any measurement station,
the machine readable station code (preferably a bar code)
assigned to a selected measurement station is read into
the CPU using a laser bar code reader 70 at step 100. The
25 sample to be measured at the selected measurement station
then has its unique machine readable sample code (prefera-
bly a bar code) read into the CPU with the laser bar code
reader 70 at step 110. If the station code and the sample
code are both valid codes, the CPU directs the selected
-13-
r~
measurement station at Step 120 to initiate a sequence ofmeasurements unique to the selected measurement station
and the set of measurements obtained are then stored in
t~e CPU at step 130 in a sample data file associated with
5 the sample's unique sample code.
I. SYSTEM
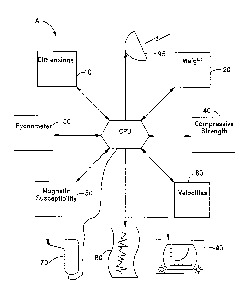
Looking now to Figure 1, a schematic represen-
tation of the transportable laboratory A is shown.
Although the transportable laboratory A is particularly
10 suited to field needs, those skilled in the art will
appreciate that the transportable laboratory satisfies
many of the needs of a central stationary laboratory.
Generally, the transportable laboratory A comprises a plu-
rality of uniquely identified measurement stations con-
15 nected to a central processing unit (CPU) such as aHewlett-Packard 9000 series 500 computer and a laser bar
code reader 70 as manufactured by Intermec. The CPU also
includes a mass storage system (not shown) for collecting
and storing the physical properties obtained from the var-
20 ious samples which are processed by the transportable lab-
oratory A.
In particular, the transportable laboratory A
includes an electronic dimension jig 10 for digitally mea-
suring sample lengths and diameters. The dimensioning jig
25 10 includes pairs of opposed linear voltage displacement
transducers (~VDT) adapted to measure axial and lateral
dimensions o~ each sample. The transportable laboratory A
also includes an electronic balance 20 adapted to measure
the weight of each sample. Further, an electronically
-14-
~ ~ 3 ~ ~
driven pycnometer 30 is provided to measure grain densityof each sample; a triaxial loading apparatus 40 is pro-
vided to obtain measures of each sample's compressive
strength, as well as provide an input for calculating
5 ~oung's modulus and Poisson's ratio for each sample; an
electronic magnetic susceptibility meter 50 is provided to
obtain a measure of the magnetic susceptibility for a
given weight of sample; and a pair of electronically
driven pressure velocity cells 60 are provided to measure
10 the velocities of propagation of compressional (P), hori-
zontal shear (SH), and vertical shear (SV) waves in each
sample as a function of pressure. A laser bar code reader
70 is provided to read both the unique sample codes
assigned to each sample and the unique station codes
15 assigned to each measurement station into the CPU such
that the CPU can initiate a measuring sequence on a sample
at a selected measurement station and store the results of
such measurement in a sample data file within the CPU
memory. The CPU accumulates all the measurements from the
20 various measurement stations for a particular sample in
the sample data file. The individual sample data files
can be displayed at a printer or plotter 80 or a CRT
screen 90, or be transmitted via satellite to a central
location with a satellite communication station 9S. Addi-
25 tionally, each physical property from the samples can besequenced according to depth to produce inverse logs of
selected physical properties representing the formations
surrounding the wellbore along its length or used form
-15-
13~ g~
cross plots of selected physical properties for trend
analysis.
The transportable laboratory A of the present
invention provides means for obtaining measurements of the
5 following physical properties from discrete samples taken
at selected intervals along the length of a wellbore:
grain density, dry bulk density, saturated bulk density,
magnetic susceptibility, compressive strength, elastic
moduli, and seismic velocities (P, SH, SV) versus pres-
10 sure. With these direct measurements one can calculatemany other physical properties of interest. For example,
the difference between the grain density and the dry bulk
density yields a porosity estimate; likewise, the differ-
ence between the saturated and dry bulk densities yields
15 another estimate of porosity. Further, combinations of
saturated density and seismic velocities yield dynamic
elastic moduli, acoustic impedance and reflection coeffi-
cients. Piecewise integration of the seismic velocity
over the depth interval sampled can yield an estimate of
20 the two-way traveltime, which can be used to calibrate the
time observed on a seismic section to a true depth. Addi-
tionally, synthetic seismic traces can be produced by con-
volving an inverse log of formation impedance with a
wavelet having known characteristics for the calibration
25 of seismic survey data. A more complete discussion below
will detail uses of the measured physical properties and
the inverse logs derived therefrom.
-16-
II. OPERATION
Each discrete sample obtained at selected inter-
~als along the length of a wellbore is assigned a unique
machine readable sample code, preferably a bar code, which
5 can be mounted with the sample or attached with its sample
holder. All measurement sequences begin by entering the
measurement station code and sample code via the bar code
reader 70 into the CPU. Hereafter, the step of reading
the station code and sample code will be understood in the
10 operation of each measurement station. In order to carry
out the desired measurements at the various measurement
stations shown in Figure l, three separate samples are cut
from each discrete sample. The three samples obtained
from each discrete sample are each generally right circu-
15 lar cylinders having lengths of approximately 0.5", 1.5"and 2.75". With reference to Figures l and 2, generally
the detailed steps to obtain at least one physical prop-
erty of each sample at each measurement station will be
discussed. In order to simplify the following discussion,
20 the operation of the transportable laboratory A will be
made with respect to the operations which occur on each
separately sized sample (i.e., .5", l.S" and 2.75").
The .S" sample will be referred to hereafter as
the disc sanple. The initial measurements made on each
25 disc sample are its length and diameter at 10 and its sat-
urated weight at 20. The disc sample is dried and then
placed in a vacuum oven for an additional period. The
dried disc samples are then weighed again at 20 to obtain
their dry weight. The dry weight can be used by the CPU
-17-
in calculating the dry bulk density of each sample. About20 gms of the disc sample are subsequently crushed to a
particulate size of 0.25" or less. A portion of the frag-
mented disc sample is then placed in a pycnometer cup and
5 reheated in a vacuum oven. The pycnometer 30 is used to
obtain a measure of the disc sample's grain density. The
pycnometer 30 measures a volume of space occupied by the
fragmented sample and pycnometer cup using helium gas.
Because the measurements by the pycnometer 30 takes the
10 longest time of any measurement station, the system
includes multiple pycnometers 30 which are each interfaced
to an IBM AT computer (IBM) (not shown) so as to permit
automated operation of each pycnometer which in turn is
connected with the CPU.
After receiving a valid sample code and pycnome-
ter station code, the CPU signals the selected pycnometer
to begin its measurements. The fragmented disc sample is
inserted into the pycnometer's sample chamber. Upon com-
pletion of the measurement cycle, the IBM reads a measured
20 volume and divides by the recorded sample weight to arrive
at a grain density for the fragmented disc sample. This
value along with the sample code and pycnometer station
code are sent back to the CPU for storage and further pro-
cessing.
The fragmented disc sample can also be used for
magnetic susceptibility measurement at 50. Here the frag-
mented disc sample is poured into a polyethylene vial of
known weight and reweighed at 20 and its specific magnetic
susceptibility is measured using a Bartington magnetic
-18-
~` 131~91
susceptibility ~eter at 50. When the magnetic suscepti-
bility measurement has been completed, an average of five
-----~eadings-can be sent to the-e~U-memory.-~
The 1.5" sample can be used to measure the seis-
- 5 mic velocities of the discrete samples at pr~ssures appro-
priate for their in situ depth. The magnitude of seismic
; velocity in rock is sensitive the concentrations or cracks
and pores. Since cracks exhi~it a strong pressure depend-
ence, seismic rock velocities can exhibit a strong pres-
10 sure dependence. Therefore, to make meaningful velocity
measurements on rock, one must subject it to the pressure
and saturation it experiences in situ. This is done most
effectively by making velocity measurements on the 1.5"
samples at a plurality o~ pressures which bracket the in-
15 situ pressure appropriate for each discrete samp}e.
The flat faces of the 1.5" samples are firstpolished to remove cutting marks and to make the faces
more parallel for dimension measurements at 10 and veloc-
_ty measurements at 60. A bar code label can be aff-xed
20 to the perimeter of the 1.5" sample with myiar*tape. One
side of the l.S" sample is marked to indicate a preferred
bedding direceion for alignment with respect to the shear
wave polarizations. ~he 1.5" samples are kept in a water
bath while awaiting velocity measurement so as to main~ain
25 t~.eir fluid saturation. The 1.5" sampies are typicall-~
?rocessed in batches since each pressure veloc-~y celi ~0
has positions for multiple samples.
The 1.5" sample processing ~egins Dy measur-ng
.s dimensions at measur-ng station 0. ~.e '.5" samDie
*Trademark
weight can then be obtained at measurement station 20.
Having the 1.5" sample dimensions and weight, one is ready
to measure the velocities of the compressional (P) and
shear (S) waves in the 1.5" samples as a function of pres-
5 sure using a pulse transmission technique.
Each 1.5" sample is inserted between a set of
end caps. The relative orientation of each 1.5" sample
with the end cap provides a mechanism for determining the
relative anisotropic orientation of the sample. Piezoe-
10 lectric transducers assemblies are mounted within both endcaps. The 1.5" sample and end cap assembly are then
installed in the pressure velocity cell 60 and electrical
connectors are attached. These connectors permit the
transmitted and detected signals to be applied and
15 received from the appropriate transducers. The operator
selects a pressure velocity cell by reading the appropri-
ate station code and sample code via the bar code readers.
Once the CPU decides there is a valid sample code, a con-
trol program begins filling and pressurizing the pressure
20 velocity cell 60. An acquisition program is activated by
the CPU when equilibrium at programmed pressure set points
is achieved. Five time series are collected for each
sample at each pressure point. When the measurements at
the pressure velocity cell 60 are complete, the samples
25 are removed and reweighed at 20. The new weight is the
saturated weight. Saturated weight plus sample volume
obtained from sample dimensions yields a saturated den-
sity.
-20-
With the measurement of the compressional (P)
and shear (S) wave velocities of each 1.5" sample, the CPU
can calculate a measure of the 1.5" samples anisotropy,
the magnitude of the difference between the fast and slow
5 shear velocities, and saturated density. When these meas-
urements are coupled with disc sample measurements, one
can estimate sample porosity i.e., difference between sat-
urated and dry density provide a saturated porosity esti-
mate.
The remaining 2.75" sample (hereafter plug) is
plugged parallel to its long axis with a 1" diameter
hollow core bit. The ends are trimmed parallel and flat
with a slow speed precisicn cutoff saw. The plug sample
is used in the triaxial loading apparatus 40 to determine
15 its compressive strength, Young's modulus, and Poisson's
ratio. The plug sample length and diameter are measured
at 10. A radial LVDT is positioned at the midpoint of the
plug sample and an axial LVDT is mounted on one end of the
plug sample and extension rod on the other. The plug
20 sample can then be inserted into the triaxial loading
apparatus 40. The CPU first sets a confining pressure
within the triaxial loading apparatus 40 to a value appro-
priate for the sample's depth within the wellbore and then
raises the pore pressure to a fixed value to assure sample
25 saturation. The CPU then initiates axial loading of the
plug sample at a programmed rate, nominally 10-6 sec-l,
until failure of the plug sample. Axial and radial dis-
placements from the LVTS's are constantly recorded by the
CPU during loading. These values can be normalized by the
-21-
original dimensions to provide axial and radial strains.The CPU can also determine the slope of the axial strain
versus axial stress to yield a value for Young's modulus.
The incremental ratio of radial to axial strain can pro-
5 vide values of Poisson's ratio. The maximum stress(force/sample area) reached during the test is the com-
pressive strength of the plug sample.
Separate operating programs allow the CPU to
process a plurality of samples through multiple, asynchro-
10 nous flow paths until each sample has gone through each ofthe various measurement stations. These programs run in
there own virtual machines within the CPU.
The most complicated program is MAIN. This pro-
gram directly interfaces to the bar code readers 70, mag-
15 netic susceptibility meter 50, balance 20, pycnometer,digital dimension jig 10 and memory storage devices (not
shown) and indirectly with the pressure velocity cell 60
and the triaxial loading apparatus 40. All bookkeeping
and sample data file entries are done through the program
20 MAIN. When a sample code is recognized by the CPU, it is
assigned an external sequence number which consists of
year, Julian day and daily run number. An active discrete
sample code list is maintained by MAIN. The sample code
list includes filenames and mass storage locations, The
25 filenames correspond to the measurement results from
selected measurement stations. When a sample code is
entered by the laser code reader 70, MAIN first checks the
active sa~ple code list; if the sample code exists, it
will proceed to the proper measurement subroutines. If
-22-
:~ 3 ~
the sample code is not found on the active sample codelist, a set of data files are created and the sample code
is added to the active sample code list and measurements
can then be carried out. Whenever the active sample code
S list is updated or a new measurement is performed, the
sample codes and status can be displayed on the CRT 90.
There are a few measurements which are more
involved than weighing or measuring sample dimensions such
as velocity and compressive measurements. For such meas-
10 urements, additional programs which vary extrinsic vari-
ables and programs to measure intrinsic properties of the
samples as a function of the variation in extrinsic vari-
ables are provided.
III. FORMATION EVALUATION
With the direct measures of a plurality of
selected physical properties of the formation surrounding
one or more wellbores along their length, explorationists
are now in a position for the first time to more intelli-
gently use geophysical survey data to evaluate the oil and
20 gas bearing potential of the earth's subterranean forma-
tion both during the well drilling process at the wellsite
as well as after completion of the well at a remote facil-
ity. Looking first to Figures 3, 4, 5, and 6, inverse
logs of measured and calculated physical properties
25 obtained from samples of the earth's formations at
selected intervals along the length of a wellbore are
shown. In particular, Figures 3 (a, b and c) each repre-
sent sent inverse logs of the compressional wave velocity
(Vp) in samples obtained at selected intervals along the
-23-
1~ ~ 5~
length of three separate wells. The velocities depictedin Figure 3 represent the velocity in a particular sample
u~like previous velocity estimates which are really no
more than an averaged or integrated velocity. The impor-
5 tance of such distinction is that acoustic impedancechanges in the earth which provide an indication of the
nature of the reflection and refraction of seismic energy
depend not on averaged or integrated velocities; but
rather, on the interval velocity of seismic propagation in
10 each formation lithology.
Figures 4 (a, b, and c) depict inverse logs of
formation porosity measured from samples obtained at
selected intervals along the length of three separate
wellbores. Additionally, Figures 5 (a, b, c, d, e and f)
15 depict inverse logs of formation density, compressional
wave velocity (Vp), shear wave velocity (Vs)~ the ratio
Vp/Vs, formation impedance and magnetic susceptibility,
respectively. The sample interval for the inverse logs of
Figure 5 is much finer than the minimum resolution thick-
20 ness of conventional geophysical survey data. Conse-
quently, such oversampling tends to produce inverse logs
which have a very "spiky" appearance as depicted in Figure
5. However, when the inverse logs of Figure 5 are
smoothed with a smoothing operator having a wave length
25 generally equal to the minimum resolution thickness of the
geophysical survey data with which it is to be compared,
the inverse logs take on an appearance similar to those in
Figures 6 (a-e). In fact, the inverse logs of Figure 6
(a-e) were smoothed with a smoothing operator having a
-24-
minimum resolution thickness appropriate for seismicsurvey data. The synthetic traces of Figure 6 (f) were
produced by convolving a wavelet signal having character-
:;stics of a seismic source with the smoothed inverse impe-
5 dance log of Figure 5 (e) and correspond well with actualseismic survey data.
The importance of having such inverse logs of
formation properties along the length of a well both
during the drilling process and upon completion of the
10 drilling process can be very important. By way of example
with the inverse logs of formation velocity to the point
of current drilling within the wellbore, the original geo-
physical survey data can be reprocessed to forecast depth
to target. Additionally, inverse logs of formation com-
15 pressive strength obtained during the drilling process canprovide the drillers with information important for con-
trolling drilling parameters.
With inverse logs of formation physical proper-
ties obtained at selected intervals along the wellbore,
20 the geophysical survey data can be calibrated to the phys-
ical properties represented in the inverse log. In par-
ticular, Figures 7a and 7b represent a seismic time
section and an inverse log of formation impedance measured
from samples obtained at selected intervals along the
25 length of a wellbore. In particular, the inverse impe-
dance log of Figure 7b was obtained at a well site indi-
cated by the derrick structure in Figure 7a. With such
comparison of the inverse log of impedance and the seismic
section one can calibrate the physical properties of the
-25-
formation at the location of the wellbore site. Havingcalibrated the geophysical survey data (in this case the
seismic survey data) at the wellbore site, geophysicists
can then use the calibrated geophysical survey data to
5 extrapolate the physical properties to remote locations in
a basin.
Thus, the present invention provides a novel
method and system of obtaining selected physical proper-
ties from samples of the earth's subterranean formations
10 surrounding a wellbore and developing inverse logs of the
selected physical properties along the length of the well-
bore. Explorationists can employ such inverse logs of the
selected physical properties to perform basin analysis
whereby the physical properties obtained at one or more
15 wellbores can be used to calibrate geophysical survey data
at each wellbore location and then extrapolate such phys-
ical properties to other locations in the basin with the
geophysical survey data so as to evaluate the oil- and
gas-bearing potential of the earth's subterranean forma-
20 tions.
It should thus be understood that the inventionis not limited to any specific embodiment set forth herein
as variations are readily apparent and thus the invention
is to be given the broadest possible interpretation within
25 the terms of the following claims.