Note: Descriptions are shown in the official language in which they were submitted.
131999~
BACKGROUND OF THE INVENTION
The present invention relates to a speech
analysis method used in a speech processing apparatus,
and more particularly to a speech analysis method which
can reduce variations in analytical result due to a
change in pitch of speech signal and can accurately
analyze even a ~uasi-stationary speech signal.
In a speech processing apparatus, speech
analysis is usually carried out to extract features of a
speech. Further, in the speech analysis, window
multiplication is usually carried out for a speech
signal. The window multiplication suitable for use in
speech analysis has been widely studied, and is described
in detail, for example, on pages 250 to 260 of a book
entitled "Digital Processing of Speech Signals" by L.R.
Rabiner et al. (Prentice-Hall Inc.). Usually, a Hamming
window having a duration of 10 to 30 msec is used for a
speech signal.
A detailed discussion of the prior art is given
hereinbelow with reference to the drawings.
It is an object of the present invention to
provide a speech analysis method which can eliminate
variations in spectrum of speech signal due to a change
in pitch period thereof, and can accurately analyze the
speech signal without being affected by the change in
pitch period.
,
1319994
In order to attain the above object, according
to the present invention, there is provided a speech
analysis method which includes the steps of detecting a
maximum-level position in that portion of an input speech
signal which exists in a period equal to the pitch period
of the input speech signal from a predetermined one of
periodically-generated timing pulses, tracing the speech
signal from the maximum-level position in a time
reversing direction to find a zero-crossing point where
the level of the traced signal is first reduced to zero,
extracting a one-pitch waveform which starts from the
zero-crossing point and has a duration equal to the pitch
period of the speech signal, from the speech signal, and
carrying out Fourier transform for the extracted one-
pitch waveform to obtain a spectrum of the input speechsignal.
The characteristic features of the present
invention will be explained below in more detail. In
general, the first formant component of a speech signal
is considered to be a damped sinusoidal wave which is
excited at an interval equal to the pitch period of the
speech signal. As mentioned above, adjacent one-pitch
waveforms of the speech signal are usually different in
phase of the first formant component from each other. In
order for the first formant component to hold the same
phase, at least a waveform having a duration less than or
equal to the pitch period is to be used as the analytical
region. Even when the duration of the analytical region
131999~
is made equal to the pitch period of the speech signal,
there is a fear that a phase shift of the first formant
component occurs in the analytical region. Accordingly,
it is required to place the starting point of the
analytical region in the vicinity of the maximum-level
position. This problem will be explained below in more
detail, with reference to Fig. 1.
Fig. 1 is a waveform chart for explaining an
inventive speech analysis method which is carried out for
the speech waveform (b) of Fig. 2. Referring to Fig. 1,
when the analytical region having a duration A longer
than the pitch period of the speech signal (b~ is used,
the phase of the first formant component changes in the
analytical region. Hence, it is necessary to make the
duration of the analytical region equal to the pitch
period of the speech signal. In a case where the
analytical region has a duration which is indicated by
reference character B and is equal to the pitch period,
however, the phase of the first formant component can
vary. Now, attention is paid to the fact that the first
formant component can be approximated by a damaged
sinusoidal ~ave. Thus, a maximum-level position in that
portion of the speech signal which has a duration equal
to ~he pitch period, is detected, and the speech signal
is traced from the maximum-level position in a time
reversing direction to find a zero-crossing point where
the level of the traced signal is first reduced to zero.
When the analytical region starts from the zero-crossing
..
- J ~
13199~
point and has a duration equal to the pitch period, the
analytical region is free from the phase shift of the
first formant component, and thus a stable analytical
result can be obtained. This analytical region is
indicated by reference character C in Fig. 1. It is to
be noted that a zero level indicates the mean value of
the signal level in a one-pitch waveform.
As mentioned above, an accurate analytical
result can be obtained by using the one-pitch waveform C
as the analytical region. In the above, however, no
attention is paid to frequency resolution. When speech
analysis is made in the analytical region C, the
frequency resolution is equal to the reciprocal of the
pitch period (that is, pitch frequency). In ordinary
cases, the frequency resolution thus obtained lies in a
range from 70 to 500 Hz. Accordingly, the analytical
result will be low in frequency resolution. The
frequency resolution can be enhanced by using a virtual
waveform Wl which is obtained by adding a zero-level
signal to the one-pitch waveform C, as the analytical
region. The virtual waveform Wl will be hereinafter
referred to as "zero-inflated one-pitch waveform". When
the waveform W~ has a duration of T sec, the analytical
result which is obtained by using the waveform W~ as the
analytical region, has a frequency resolution of (l/T)Hz.
By selecting the value of the time T appropriately, the
analytical result is able to have high frequency
resolution.
131999~
BRIEF DESCRIPTION OF THE DRAWINGS
Fig. l is a waveform chart for explaining the
operation principle of the present invention.
Fig. 2 is a waveform chart showing two speech
waveforms which are different in pitch period from each
other.
Fig. 3 is a graph which shows the analytical
results of the waveforms (a) and (b) of Fig. 2 obtained
by a conventional speech analysis method.
Fig. 4 is a graph showing the analytical result
of that portion of the waveform (b) of Fig. 2 which has a
duration twice longer than the pitch period.
Fig. 5 is a block diagram showing the main
parts of a speech analysis apparatus, to which the
present invention is applied.
Fig. 6 is a block diagram showing an embodiment
of a speech analysis unit according to the present
invention.
Fig. 7 is a waveform chart for explaining a
processing procedure according to the present invention.
Fig. 8 is a table showing the number of
sampling points necessary for attaining favorable
frequency resolution.
Fig. 9 is a block diagram showing another
embodiment of a speech analysis unit according to the
present invention.
13~99~
Fig. 10 is a block diagram showing a further
embodiment of a speech analysis unit according to the
present invention.
Fig. 11 is a block diagram showing an example
of a speech analyzing/synthesizing apparatus which
example includes a speech analysis unit according to the
present invention.
Fig. 12 is a block diagram showing an example
of a speech recognition apparatus which example includes
lo a speech analysis unit according to the present
invention.
Fig. 13 is a graph showing an example of the
spectrum obtained by the speech analysis method according
to the present invention.
Speech waveforms (a) and (b) of Fig. 2 show
examples of a vowel [i,] spoken by adult men. The
waveforms (a) and (b) are different in pitch period from
each other, but are substantially equal in shape of one-
pitch waveform portion to each other. Accordingly, a
listener cannot detect the difference in tone quality
between the speech waveforms (a) and (b).
The speech analysis is required to obtain
spectral information independent of the pitch period.
That is, it is required that the analytical results of
the speech waveforms (a) and (b) are identical with each
other. According to a conventional speech analysis
method, however, the analytical results of the waveforms
(a) and (b) are greatly different from each other. Fig.
13199~'~
3 shows spectra which are obtained by extracting a one-
pitch waveform from each of the speech waveforms (a) and
(b) of Fig. 2, and by carrying out discrete Fourier
transform (DFT) for the extracted one-pitch waveforms.
Although only higher harmonics of the pitch frequency
(that is, reciprocal of the pitch period) are obtained by
the DFT, curves obtained by carrying out linear
interpolation for the higher harmonics are shown in Fig.
3. A formant frequency which has the highest level in
Fig. 3, is the reciprocal of the pitch period of the
first formant component shown in Fig. 2. In the speech
waveforms (a) and (b) of Fig. 2, the first formant
component has the same period (that is, a period of 3.45
msec) and thus a formant frequency of 290 Hz. While, the
speech waveform (a) has a pitch frequency of 130 Hz, and
the speech waveform (b) has a pitch frequency of 115 Hz.
As can be seen from Fig. 3, the spectrum of a speech
signal is changed when the pitch frequency thereof
varies. A change in spectrum is remarkable when the
difference between the formant frequency and a harmonic
of the pitch frequency is large.
Even when the analytical region for speech
analysis is enlarged and thus the frequency resolution is
enhanced, it is impossible to detect the first formant
component accurately. Fig. 4 shows a spectrum which is
obtained by extracting a double-pitch waveform from the
speech waveform (b) of Fig. 2 and by carrying out the DFT
for the extracted waveform. The spectrum of Fig. 4 has a
i3199~
frequency resolution of 5?-5 Hz (namely, 115/2 Hz),
because the analytical region is doubled. Thus, a
Fourier component having a frequency of 287.5 Hz is
obtained. The frequency of this spectral line (namely,
287.5 Hz) is nearly equal to the formant frequency having
the highest spectral level (namely, 290 H~), but the
level of the above spectral line is very low. This is
because adjacent one-pitch waveforms are different in
phase of the first formant component from each other.
The degree of phase shift can be known from the decimal
part of a quotient which is obtained by dividing the
pitch period of a speech signal by the period of the
first formant component. When the decimal part of the
quotient is zero, the adjacent one-pitch waveforms are
equal in phase of the first formant component to each
other. When the decimal part of the quotient is 0.5, the
adjacent one-pitch waveforms are opposite in phase of the
first formant component. For example, in the speech
waveform (b) of Fig. 2, the pitch period is 8.7 msec, and
the period of the first formant component is 3.45 msec.
Accordingly, the quotient which is obtained by dividing
the former by the latter period, is 2.52, and the decimal
part of the quotient is 0.52. ~hus, adjacent one-pitch
waveforms are substantially opposite in phase of the
first format component to each other.
As mentioned above, variations in spectrum of
speech signal due to a change in pitch period of the
speech signal is based upon a fact that adjacent one-
~'
131999~
pitch waveforms of the speech signal are different inphase of the first formant component from each other.
Such variations in spectrum cannot be eliminated by
increasing the number of one-pitch waveforms included in
the analytical region or by carrying out window
multiplication for the speech signal.
Fig. 5 is a blocX diagram showing an ordinary
speech analysis apparatus. Referring to Fig. 5, an input
speech signal lO0 is converted into a digital signal 200
by a sampling unit l and an A-D converter 2, and an
analysis timing generator 3 generates timing pulses 300
at a predetermined interval Ts (namely, at an interval of
10 to 20 msec). Further, a speech analysis unit 4
generates a spectral signal 400 on the basis of the
digital signal 200 and the timing pulses 300.
The gist of the present invention resides in
the operation of the speech analysis unit 4. Now,
explanation will be made of an embodiment of a speech
analysis unit according to the present invention, with
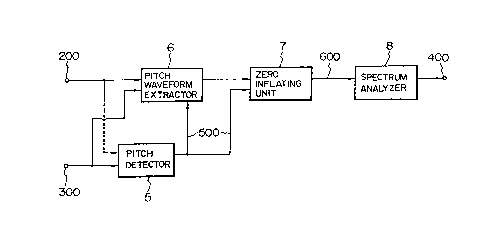
reference to Figs. 6 and 7.
Referring to Fig. 6, a pitch detector 5 detects
the pitch period of that portion of the digital signal
200 which exists between a predetermined one of the
timing pulses 300 and a timing pulse adjacent to the
predetermined pulse, by the autocorrelation method, and
delivers a periodic signal 500 having a period equal to
j~
13~99~
1 the detected pitch period. The processing carried out
by the pitch detector 5 is described in, for example,
an article entitled "Average Magnitude Difference
Function Pitch Extractor" by M. J. Loss et al. (IEEE
Transactions on ASSP, Oct., 1974).
A pitch waveform extractor 6 extracts one-pitch
waveform data which starts from a predetermined one of
the timing pulses 300, from the digital signal 200.
The operation of the pitch waveform extractor 6 will
be explained below, with reference to Fig. 7.
Referring to Fig. 7, let us suppose that a
timing pulse ~ is specified, that is, a time tl is
the specified time. A maximum sigr.al level in that
portion of the digital signal 200 which starts from the
time tl and has a duration equal to the period of the
periodic signal 500, is searched for, and a time tp when
the maximum level appears, is detected. Then, the digital
signal 200 is traced from the time Tp in a time revers-
ing direction, to find a time tz when the level of the
traced signal is reduced to a zero level or coincides
with the zero level. Next, one-pitch waveform data
starting from the time tz is extracted from the digital
signal 200.
A zero inflating unit 7 adds zero-value data,
the number of which is equal to the difference between
the number of data points of Fourier transform and
the number of sampling points in the one-pitch waveform
data, to the one-pitch waveform data, to form a zero-
-- 10 --
i3199$~
1 inflated, one-pitch waveform 60n. This waveform 600
corresponds to the waveform WI of Fig. 1. The above
processing of the zero inflating or empadding unit 7
is carried out to obtain predetermined frequency
resolution. The number of zero-value data added to
the one-pitch waveform data will be explained later.
A spectrum analyzer 8 carries out Fourier transform and
absolute-value processing for the zero-inflated one-
pitch waveform 600, to produce the spectral signal 400.
Incidentally, the fast Fourier transform (FFT) is used
for carrying out the above Fourier transform at high
speed.
Next, explanation will be made of the number
of zero-value data which are added to the one-pitch
waveform data by the zero inflating unit. The number
of added zero-value data depends upon desired frequency
resolution. The present inventors heard a large number
of synthetic sounds which were different in frequency
resolution from each other, to estimate the tone quality
of each synthetic sound, and found that the tone
quality was greatly degraded when the frequency resolution
was made greater than 20 Hz, but was kept unchanged
when the frequency resolution was made less than 5 Hz.
That is, it is preferable to put the frequency resolution
within a range from 5 to 20 Hz.
Fig. 8 shows the number of sampling points
necessary for obtaining predetermined frequency resolution.
In Fig. 8, numerals 2, 4, 6, ..., and 16 arranged in a
131999~
1 longitudinal direction indicate sampling frequencies,
and numerals 5 and 20 arranged in a transverse direction
indicate frequency resolution.
The FFT is used for carrying out Fourier trans-
form at high speed. In the FFT, however, it is requiredto make the number of processing points equal to the
n-th power of 2 (where _ is a positive integer). In
order to carry out the FFT so that the frequency resolution
lies in the range of Fig. 8 tthat is, a range from 5
to 20 Hz), it is necessary to make the number of sampling
points (that is, processing points) equal to 512 or
1,024 for a case where a sampling frequency of 8 KHz
is used. In this case, the use of 512 processing points
corresponds to a frequency resolution of 15.625 Hz, and
the use of 1,~24 processing points corresponds to a
frequency resolution of 7.8125 Hz.
In the zero inflating unit 7, zero-value data,
the number of which is equal to the difference between
the number of processing points used in the FFT and
the number of sampling points in the one-pitch waveform
data, are added to the one-pitch waveform data. In
the spectrum analyzer 8, the FFT using the above proces-
sing points is carried out. For example, in a case
where 512 processing points are required and 60 sampling
points are included in the one-pitch waveform data,
452 zero-value data are added to the one-pitch waveform
data, and the FFT using 512 processing points is carried
out.
13199~
1 Next, explanation will be made of another
embodiment of a speech analysis unit according to the
present invention, with reference to Fig. 9.
The embodiment of Fig. 6 is excellent in
extraction accuracy for a low-frequency spectral compo-
nent, but is low in extraction accuracy for a high-
frequency spectral component. In order to solve this
problem, according to the present embodiment, the
low-frequency spectral component is detected by the
embodiment of Fig. 6, and the high-frequency spectral
component is detected by a conventional method.
Referring to Fig. 9, a first speech analysis
unit 10 is formed of the embodiment of Fig. 6, and
delivers a first spectral signal 700. Further, a
second speech analysis unit 11 carries out a conventional
speech analysis method. That is, one of a Hamming
window, a Hanning window and other windows is used for
a fixed-time waveform which includes a plurality of
consecutive one-pitch waveforms and has a duration of
about 20 msec, and then the Fourier transform is carried
out for the windowed waveform to obtain a second spectral
signal 800. The above-mentioned conventional method is
described, for example, on page 460 of an article
entitled "Speech Analysis-Synthesis System Based on
Homomorphic Filtering" by A.V. Oppenheim (J.A.S.A.,
Vol. 45, No. 2, 1969). It is to be noted that the first
and second speech analysis units are made equal to
each other in the number of processing points used in
- 13 -
1~9~
1 Fourier transform. In a spectral connector 12, the
first spectral signal 700 and the second spectral signal
800 are combined to form the spectral signal 400.
According to the inventors' experiments, it
is preferable to use a fixed frequency of 500 to 600 Hz
or a frequency three times higher than the pitch
frequency of the input speech signal, as the boundary
frequency in the spectral connector 12.
Fig. 10 is a block diagram showing a- different
embodiment of the first speech analysis unit 10 of
Fig. 9. The present embodiment is different from the
embodiment of Fig. 6 only in that a low pass filter 13
is additionally provided. It is desirable to put
the cut-off frequency of the low pass filter 13 in a
range from 800 to 1,000 Hz, since the effect of the side
lope of a high frequency component on the first
spectral signal can be reduced. In this case, however,
it is necessary to use a fixed frequency of 500 to
600 Hz as the boundary frequency in the spectral connector
12. The design and construction of a low pass filter are
minutely described in, for example, a book entitled
"Digital Signal Processing" by A.V. Oppenheim (Prentice-
Hall Inc.).
Speech analysis technology is used in various
speech processing fields, and a speech analysis method
according to the present invention is applicable to a
speech analyzing/synthesizing apparatus. When an
inventive speech analysis method is used in a speech
- 14 -
1319`9`~
1 analyzing/synthesizing apparatus, the performance of
the apparatus will be improved, since a stable,
accurate analytical result can be obtained by the
speech analysis method, without being affected by varia-
tions in pitch period of speech signal.
Fig. 11 is a block diagram showing an embodi-
ment of a speech analyzing/synthesizing apparatus according
to the present invention. A speech analyzing/synthesizing
apparatus is minutely described in, for example, an item
"Homomorphic Vocoders" of a book entitled "Speech Analysis
Synthesis and Perception" by J. L. Flanagan.
Referring to Fig. 11, a speech analysis unit
14 is formed of one of the embodiments of Figs. 6, 9
and 10, and a pitch pulse generator 15 detects the
pitch period of an input spe~ech signal to generate pitch
pulses at an interval equal to the detected pitch
period. Further, a synthesizer 16 generates a waveform
corresponding to the frequency spectrum from the speech
analysis unit 14, each time the pitch pulse is applied
to synthesizer 16. The waveforms thus produced are
successively combined to form a speech output waveform.
The waveform corresponding to the frequency spectrum
can be obtained in such a manner that a zero-phase or
minimum phase is given to the spectrum and inverse
Fourier transform is carried out for the spectrum. The
pitch pulse generator 15 and the synthesizer 16 are
described minutely in the above-referred book by J.A.
Flanagan, and hence can be readily constructed by those
- 15 -
1319~9~
1 skilled in the art.
Fig. 12 is a block diagram showing an embodi-
ment of a speech recognition apparatus according to
the present invention. A speech recognition apparatus
is minutely described in a book entitled "Automatic
Speech & Speaker Recognition" edited by T . B . Martin.
Referring to Fig. 12, a speech analysis unit
17 is formed of one of the embodiments of Figs. 6, 9
and 10, and delivers the frequency spectrum of an
input speech signal. Standard patterns which are
previously stored in a standard pattern loading unit 18,
are successively read out, to be compared with the
spectrum from the speech analysis unit 17. A matching
unit 19 detects a standard pattern which has the greatest
resemblance to the spectrum, and delivers a category,
to which the detected standard pattern belongs. The
standard pattern loading unit 18 and the matching unit
19 are minutely described in the above-referred book
edited by J.B. Martin, and hence can be readily constructed
by those skilled in the art.
Fig. 13 shows spectra obtained by analyzing
the speech waveform of Fig. 1. It is to be noted that,
in order to clearly show formant components, numeral
values on the abscissa of Fig. 13 are arranged on a
logarithmic scale. In Fig. 13, a solid curve indicates
a spectrum obtained by the speech analysis method
according to the present invention, and dashed lines
indicate a spectrum which corresponds to the spectrum
- 16 -
131999~
1 of Fig. 4 and is obtained by the conventional speech
analysis method using an analytical region equal in
duration to a double-pitch waveform. In Fig. 13, that
portion of the dashed-line spectrum which exceeds 2 KHz,
is omitted, because the portion is difficult to
illustrate.
As can be seen from Fig. 13, a speech analysis
method according to the present invention can extract
formant components accurately. Further, according to
10` the present invention, even the spectrum of a speech
waveform whose spectrum varies with time, such as a
contracted sound can be accurately detected.
As has been explained in the above, according
to the present invention, the spectrum of a speech
signal whose spectrum varies with time, for example,
the spectrum of a contracted sound can be accurately
detected, and the accuracy of a detected spectrum is
scarcely affected by variations in pitch period of
input speech signal.
Further, according to the present invention,
the tone quality of a synthetic speech and a speech
recognition rate can be improved, because the spectrum
of a speech signal is detected very accurately.
- 17 -