Note: Descriptions are shown in the official language in which they were submitted.
2 9 8 0
T 5608
OPTICAL FLOW METER
The invention relates to a method and apparatus for measuring
the volume flow of fluid in a pipe.
In particular, the invention relates to optical flow
measurement. Optical flow measurement, almost invariably with gas
lasers and Doppler difference configuration, is established as a
known technique of making measurements of fluid velocity at a
point.
However, this technique has made no headway towards replacing
existing meters such as mechanical turbine and positive
displacement meters which are in common use to measure integrated
volume flows.
One of the reasons is the lack of optical transmission in
black oils and multiphase flows. Further, for single phase flows of
gases and white products there exist problems of mechanical
vulnerability and ignition hazard associated with gas lasers, and
the expense of precision optics required for what is, in effect, an
interferometric method.
Therefore, it is an object of the invention to provide a
method and apparatus for optical flow measurement which is not
interferometric and therefore more tolerant of the imperfections of
low-cost optical components.
It is another object of the invention to provide an apparatus
for optical flow measurement which has no moving parts, does not
obstruct the flow in any way, and is capable of measuring flows
which vary over a wide range and oscillate or reverse.
The invention therefore provides a method for measuring the
volume flow of fluid in a pipe, characterized by the steps of
illuminating scattering particles suspended in the fluid, imaging
the scattered light onto a multi-element photodetector, calculating
a time-delayed spatial correlation function of the detected signals
~ 3S2~80
2 -
and deriving therefrom the magnitude and direction of the flowvelocity at one or more points of the pipe.
The invention also provides an apparatus for measuring the
volume flow of fluid in a pipe, characterized by means for
illuminating scattering particles suspended in the fluid, means for
imaging the scattered light on to a multi-element photo-detector,
means for calculating a time-delayed spatial correlation function
of the detected signals and means for deriving therefrom the
magnitude and direction of the flow velocity at one or more points
of the pipe.
Like all laser flow measurements, the invention requires
scattering centres to be present in the fluid and to be carried
along by the flow.
The concentration of water droplets and particulates in bulk
lS products is more than sufficient.
The invention will now be described by way of example in more
detail with reference to the accompanying drawings, in which:
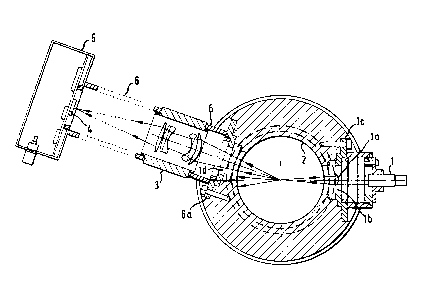
Fig. 1 represents a sectional view of the mechanical
construction of the apparatus of the invention;
Fig. 2 represents schematically a scheme of the signal
processing electronics of the invention;
Fig. 3 represents a typical binary sequence read by the
microprocessor applied in the apparatus of the invention; and
Fig. 4 represents a measured temporal-spatial correlation
function obtained by the method of the invention.
Referring now to fig. 1 a light source 1 (e.g. a semiconductor
diode laser with a wavelength of 800 nm and a power of 1 mW)
illuminates scattering particles in the fluid flowing in the pipe 2
through a cylindrical lens la and a window lb. The window lb is
secured by means of a window clamp lc. A lens 3 images the scatter-
ed light onto a multi-element photodetector 4 in signal processing
electronics 5. A digital processor interfaced to the detector
calculates a time-delayed spatial correlation function and hence
the magnitude and direction of the flow velocity at one or more
points of the pipe. Reference numeral 6 represents an extension
1 3 72980
- 3 -
tube to connect the lens 3 to the pipe 2 and to the signal
processing electronics 5. Further, a clamp 6a and an output window
ld have been represented.
In Fig. 2 the multi-element photodiode array 4 is shown. On
this multi-element array are imaged scattering particles in the
flow to be measured, which are illuminated by the light source (not
shown for reasons of clarity). In this figure 16 elements are
linked in pairs and connected via any suitable a.c. coupled
amplified and comparator circuits (only one of which has been
represented for reasons of clarity) to a 8-bit digital input part
7a of a microprocessor.
The object of the measurement is to determine the rate and
direction of movement of random images across the detector plane in
the presence of noise. To do this, the processor runs a program to
accumulate a cross-correlation function of the signals in time and
space within its memory. The nature of the correlation function is
best understood by reference to fig. 3.
The eight-bit byte generated by the comparators is read at
equal intervals of time, as closely spaced as possible. In the
experimental system, the sample interval is 170 ~s, determined by
the time taken to execute a loop in the machine code program. Fig.
3 lists 192 consecutive samples, with a high state from the
corresponding comparator shown as '1' and a low state as '.'. The
pattern of states at any particular bit position in successive
bytes is random, due to noise in the associated detector element
and amplifier, but with an increased probability of a '1' when the
element is illuminated by light from a scattering centre in the
liquid. If Fig. 3 is now viewed as a whole, a slanting structure is
discernible in the bit patterns, which is indicative of the liquid
motion. It is this statistical information that the processor code
seeks to extract.
Fig. 4 is a three-dimensional plot of a correlation function
computed from such data. It indicates the probability that,
following the occurrence of a '1' at some bit position at some
time, a second '1' will be observed at some later time in either
1 3 ~q~o
- 4 -
the same position or a position displaced by a certain number of
units. The axis A represents the displacement in elements; the axis
B represents the correlation in arbitrary units and the axis C
represents the time difference in milliseconds. As usual with
correlation functions, the time axis does not indicate the duration
of the experiment (which was several seconds) but the time-
difference between events. Likewise, the horizontal axis relates
(via the spacing of the detector elements) to linear displacements
in the detector plane and not to specific positions on the
detector. Clearly, the correlation is strongest at zero
time-difference and decreases with increasing time-difference. More
importantly, however, the slanting trend in Fig. 3 is now visible
as a ridge of correlation in which the mean displacement observed
for each time difference is in direct proportion to the time
difference. The ratio of each mean displacement to the
corresponding time difference is, in magnitude and sign, the
component of mean velocity of images in the detector plane resolved
in the direction perpendicular to the parallel boundaries
separating the elements. Since the element separation and the lens
magnification are known constants, the magnitude and direction of
the corresponding component of mean velocity of scatterers in the
conjugate plane within the fluid can be determined. The optical
system is so focussed and the detector array is so oriented that
the velocity measured is the mean axial velocity at the centre of
the pipe, which is related to the total flow in the pipe by various
well known theoretical and empirical relations.
The function plotted in Fig. 4 is:
7 ~
K(n,m) ~ ~ D(j,k) D(j+n, k+m) (1)
j_0 k-l
in which D(j,k) is the value of the binary digit in the jth
position observed during the kth time interval. Since an eight-bit
processor is applied, displacements are limited to _7 units.
However, the interconnection of the detector elements in Fig. 1 is
such that spatial displacements of up to _15 element spacings are
1 3 ~2980
physically ~~ningful. This is taken into account by the
convention:
D(j,k) D(j mod 8, k) (2)
For clarity, the cyclic ambiguity in j has been artificially
removed in Fig. 4 when the displacement exceeds 7 elements. A
related effect, which has not been removed, is a systematic change
of weighting with displacement. With 16 detector elements, events
involving a displacement n are generated by (16-n) possible pairs
of elements. In Fig. 4, this artifact accentuates but does not
cause the decay of the correlation with time-difference, which is
predominantly caused by turbulence. Since D(j,k) takes only the
values 0 and 1, the multiplication in (1) can be interpreted simply
as an AND function, allowing rapid computation in real time. The
resulting K(n,m) is then a convenient, though imperfect,
approximation to the true temporal-spatial correlation function of
the light intensity in the detector plane:
~-~ I(x',t) I(x' + x, t + z) dx'dt
c(x z) = J~ [I(x',t)] dx'dt
in which z is time difference and x is linear displacement along
the detector. C(x,z) is related to the required mean velocity
component:
J x C (x,z) dx
(4)
z J~ C (x,z) dx
In the interests of rapid calculation, the full surface shown
in Fig. 4 does not need to be computed for the purpose of a simple
flow measurement. After making a preliminary measurement to ascer-
tain the direction and approximate velocity of the flow, the
processor software selects a suitable time-difference to eliminate
the ambiguity arising from (2). It then accumulates a purely
spatial correlation function for this value. In Fig. 4, this
980
- 6 -
corresponds to the intersection of the surface with a vertical
plane perpendicular to the time axis. From the observed distri-
bution, it is a simple matter to calculate the average displacement
occurring in the known time, the average velocity of the turbulent
flow at the measurement position, using a suitable numerical
approximation to Equation (4).
An interesting insight is obtained if the present technique is
compared with a different and widely used technique of flow
measurement, in which two points in the flow are illuminated by
laser beams and the temporal cross-correlation function is
measured. In Fig. 4, this corresponds to the intersection of the
surface with a vertical plane parallel to the time axis. The shape
of the surface is such that the peak of the measured function does
not correspond exactly to the top of the ridge, indicating a
systematic bias for turbulent flow.
In particular, Fig. 4 shows the performance of the method of
the invention when measuring the flow of kerosene in a 3-inch pipe.
The flow rate is 5.5 litres/s.
It will be appreciated that any multi-element photo-diode
array and microprocessor suitable for the purpose can be applied.
It will further be appreciated that the apparatus of the
invention could comprise any suitable modification dependent on the
nature of the fluid flow to be measured.
For example, modifications required to measure gas flows by
the method of the invention stem from the fact that the scattered
light intensities to be expected from a gas are much weaker than
those from even very clean liquid products, such as aviation
kerosine. Thus, the optical system of the invention could be
modified to collect light scattered into a solid angle centred on
the forward direction, where the scattering for spherical particles
is greatest.
In order to prevent the detector to be flooded with direct
laser light the cylindrical lens la could focus the beam not (as
shown in fig. l) at the measurement in the middle of the pipe, but
/
1 33~980
onto a rectangular beam stop at the output window of the apparatus
of the invention.
Further, in measuring gas flows, the flow could be seeded with
a fine mist of oil (for example approximately 0.1 parts per million
by volume of odourless kerosine in the form of approximately one
micrometer diameter droplets from a commercial lubicator unit.
Various modifications of the present invention will become
apparent to those skilled in the art from the foregoing description
and accompanying drawing. Such modifications are intended to fall
within the scope of the appended claims.