Note: Descriptions are shown in the official language in which they were submitted.
202~90~
The present invention relates generally to a
meat freshness measuring apparatus. More particularly,
the present invention relates to a meat freshness
measuring apparatus for exposing meat to light from a
light source and for analyzing a specific pigment
component representing freshness in the meat based on
~,
light reflected or transmitted from the meat. ~ -
Freshness of beef or other meat is an important
factor in quality control in a meat distribution
process, or in a meat supply business. There have been
: proposed various methods or apparatus for measuring the
freshness of meat. One of such apparatus is a meat
freshness measuring apparatus described in Japanese
Patent Laying-Open No. 1-156664. According to this ~ ;
Japanese Patent Document, it was made clear by studies
of Saito et al (Transactions of the Japanese Society of
Scientific Fisheries, Vol. 24, pp. 749 750: 1957) and
Uchiyama, Ehira et al (Transactions of the Japanese
Society of Scientific Fisheries, Vol. 36, pp. l77_187,
~;~ 20 977-992: 1970) that a composition ratio of
202~90~
nucleic acid compounds contained in beef or other animal- ~-
meat has a close relation with freshness. More
specifically, since ATP (adenosine triphosphate) in ~ ~:
bee~ or other animal meat decomposes, after the death, in
the order of ATP - > ADP (adenosine triphosphate) -> AMP
~adenosine monophosphate) - > IMP (inosinic acid) - > Hx R :
(inosine) - > Hx (buxanthine), the following K value is
used as an index of freshness. ~ ~
K value (%) = tH x R + Hx) / (ATP + ADP + AMP + IMP + i;.
:~ 10 H x R + Hx) x lO0. ..
In addition, it was found as a result of the study by .
Watanabe et al (Papers on Polymers, Vol. 41, pp. 233-248~
19~4) that ATP and ADP decompose rapidly after death, : ;
and that there is a very small quantity of AMP. Thus, it ~ ~:
15 was found that there is no practical problem ir the terms ~ -~
of ATP, ADP and AMP are omitted from the above-mentioned:`
expression o~ the K value. ~
The K value has been conventionally measured by - .;
~ various methods such as a column chromatographic method -~
: 20 ~Kato et al, Transactions of the Japanese Society of `~
Scientific Fisheries, Vol. 39, pp. 1039-1044: 1973), an ~ -
~: oxygen method:(Uda et al, Japanese Patent Publicatlon No.
59-130200), and a sensor method (Watanabe et al, Japanese
Patent Publication No. 59-1072S6, or Arai et al, Japanese
25 Patent Publication No. 59-232097). ;~
~'' '
- 2 - ~:
202~90~
Another method conventionally used is a spectral
method utilizing reflected or transmitted light, in which
conditions of a meat pigment can be directly detected.
Thus, this method is useful for determining what influence
the handling and processing of meat exert on the stability of
the meat pigment. For this method an application of a laser
beam may be considered. However, measuring apparatus
using this method are suited for use in laboratories but
not suited for practical use in meat processing factories.
~ 10
Therefore, the principal object of the present
invention is to provide a meat freshness measuring
apparatus capable of measuring freshness of meat by
spectral analysis based on changes of a pigment (such as
myoglobin) in the meat in real time utilizing reflected or
transmitted light from the meat.
Briefly stated, in the apparatus of the present
invention, meat is exposed to rays of different
wavelengths and the rays of the respective wavelengths
from the meat are separated into spectra of the respective
wavelengths. The rays of the spectra of the respective
wavelengths are received and spectrum data is stored for
each wavelength. Based on the spectrum data for each
wavelength thus stored and a prescribed calculation
- 3 ~
1 2 ~ ~ ~ 9
equation, a content of a pigment in the meat is calculated
and outputted.
Consequently, according to t,he present invention, the ;
contents of pigments in meat are calculated according to `~
spectrum data for each wavelength obtained from the meat.
.~.,: .
Thus, the apparatus can be compact and light, which '~
makes it possible to measure the freshness of meat 2;
efficiently and in a handy manner in various p~aces as
,: ,
required.
The foregoing and other objects, features, aspects
and advantages of the present invention will become more
;~ apparent from the following detailed description of the
present invention when taken in conjunction with the , ~;
accompanying drawings.
`-~ ~
Fig. 1 is a schematLc block diagram of an embodiment ,
of the present invention.
Fig. 2 is a graph showing spectra in specimens of
refrigerated meat blocks in three different conditions.
Fig. 3 is a graph showing absorption spectra of Mb,
Mbd and MMb.
Fig. 4 is a graph showing a calibration curve of an
absorbance A525 of a wavelength 525nm and a content of Mb.,~-
Fig. S is a view showing a fiber probe. ~ -
.
- 4 - ;
~ ,.. .
2o2~9o~
Fig. 6 is a diagram showing data stored in the RAM
shown in Fig. 1.
Fig. 7 is a diagram showing an example of spectrum
data measured according to the embodiment of the
invention.
; Figs. 8 to lO are flow charts for explaining specific
operations of the embodiment of the invention.
Particularly, Fig. 8 represents a main routine; Fig. 9
represents a calibration subroutine; and Fig. lO
represents a spectrum measurement subroutine.
Referring first to Figs. 2, 3 and 4, the general
principles on which the present invention is based will now
be described. A surface of a carcass refrigerated
one night after slaughter presents a color inherent in
oxymyoglobin (hereinafter referred to as MbO). An
internal portion thereof cut by a knife presents a color
inherent in myoglobin (hereinafter referred to as Mb). A
surface of a carcass stocked for a very long period
presents a color of metmyoglobin (hereinafter referred to
as MMb). According to thé present invention, freshness of
meat is measured by analyzing spectral changes of Mb, MbO
and MMb. Fig. 3 shows absorption spectra of Mb, MbO and
MMb with absorption coefficients thereof being set in
25~ equal ranges. In this figure, 525nm represents an
,~:
- 5 -
j, i ~, t~
2 ~2 ~ 9 ~
isosbestic point of Mb, MbO and MMb. Therefore, the
absorbance A525 of a wavelength 525nm is as follows.
A525 = Ks2s (CMb + CMbO + cMMb) D ..(1)
where K525 : absorption coefficients of Mb, MbO, MMb at
': :,
the wavelength 525nm
CMb : concentration of Mb (myoglobin) ~;
CMbO: concentration of MbO (oxymyoglobin)
CMMb: concentration of MMb (metmyoglobin)
D: optical path at the time of reflection
spectrum measurement. -- ~
First, CMb will be obtained. A wavelength 474nm is `-
an isosbestic point of MbO and MMb, and absorbance A474
thereof is as follows.
A474 = KMb474 CMb D + K474 (CMbO + CMMb) D
... (2)
From the equations (1) and (2), the following
equation is obtained.
K474 ~A525/D) K525 (A474/D)
= K525 K474 CMb - KMb474 ~525 CMb
Therefore, CMb is obtained by the following equation.
474 525 R525 A47~) / [(K525 K47
KMb474 X525) D] -~(3) ;;~
Next, as for MbO, a wavelength 614nm represents an
isosbestic point of Mb and MMb, and accordingly absorbance
A614 thereof is as follows.
- 6 -
2o2~9os
A614 = KM~614 CMb D + K614 (CMb * CMMb) . D
...(4)
Therefore, in the same manner as in the case of Mb,
from the equations (1) and (4), CMbO is obtained by the
following equation.
614 525 K525 A614) / ~(K52S K614 -
KMb 614 K525) D] - ( )
As for MMb, a wavelength 572nm represents an
isosbestic point of Mb and MbO and thus, in the same
manner, CMMb is obtained by the following equation.
: C (K572 A525 K525 A572~ / [~K525 KS72
KMMb572 K525) D] --(6)
The above-mentioned wavelengths may be within certain ;
ranges. For instance, the wavelength 474nm for Mb may be
370nm or 597nm; the wavelength 614nm for M~O may be 675nm or
460nm; and the wavelength 572nm for MMb may be 460nm, 507nm,
555nm or 597nm.
In addition, from the equation (1), the following
equation is obtained.
525 / K525 D ............... (7)
~` If a calibration curve of A525 and the Mb content is
prepared as shown in Fig. 4, the following equation (8) is
obtained.
Total Mb content = a A525 + ~ --(8)
:::
.` ~. ..
- 7 - ~
, ,
~`' 2o219o~ ~
A percentage of Mb is, from the equations (~) and
(7), as follows.
Mb% = c~Ib X 100/ ( CMb + CM~O + CM~lb~ ~ .`.,
- (K525/As2s) (K474 A525 Ks25 474 525
Ka74 - K 474 K525) x 100 ;-
= (1 - K525/K 474 A474/A525)
In the same manner, percentages of MbO and MMb are ~:
obtained as follows. ~.
MbO% = (1 -K525/K 614-A614/A525) ...(10)
MMb% = (1 -K525/K 572 A572/A525) ................ (11)
According to the present invention, Mb%, MbO%, MMb%
are measured on the basis of the above mentioned ~ :
principles. In the following, a ~ore detailed description
will be made in connection with an embodiment.
The foregoing terms are defined as follows~
A,25 : absorbance of light at a wavelength 525nm; `~.
KS25 : respective absorption coefficients or Mb, MbO, I~Mb -
at the wavelength 525 nm;
D : length of optical path at the time of reflection
2~ spectrum measurement;
Mb
Mb~ : percentage of Mb content = Mb + MbO2 T
: KMb absorption coefficient or Mb at a wavelength 474nm
A474 : absorbance of light at the wavelength 474 nm;
- 8 -
~ 2024905
MbO2
MbO~ : percentage of l~bO content = Mb + MbO MMb x 100%
KM 61a absorption coerficient of MkO at a wavelength 614nm
A614 : absorbance of light at the wavelength 614nm;
MMb~ : percentage of MMb content = Mb + MbO + ~Mb x 100%
2 absorption ccef icient ofMMb at awavelength 57Znm; an~
-72 : absorbance of light at the wavelength 572 r~.-- ~
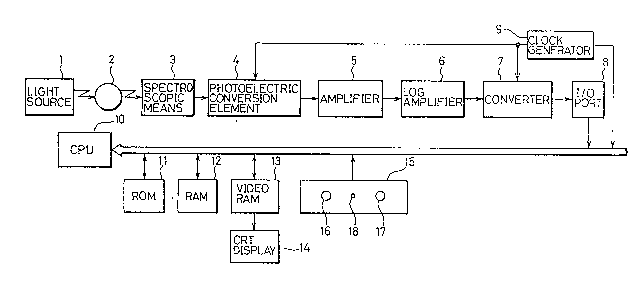
Fig. 1 is a schematic block diagram of an embodiment of `
the present invention. A light source 1 irradiates an object
2 to be measured such as meat. Reflected or transmitted light ~;
;~from the object 2 enters spectroscopic means 3, where it is ; `
spectrally separated. A beam of a prescribed wavelength thus
obtained is supplied to a photoelectric conversion element 4, ~:
where it is converted to an electric signal. The electric
signal is amplified by an amplifier 5 and the
' 1 ` ~ ' :
..., ~;.,,
-8a-
- . ~ .... ..
2~2~9~5
amplified signal is supplied to a log amplifier 6, where
it is converted to a light quantity signal. The light ~
auantity signal is supplied to an A/D converter 7, where ~;
it is converted to a digital signal. The digital signal -
thus obtained is supplied as light quantity data of the
prescribed wavelength to a CPU 10 through an I~O port 8
and an I/O bus.
The CPU 10 is connected with a ROM 11, a RAM 12, a
video RAM 13, and an operation unit 15 through the I¦O
bus. Necessary programs for processing by the CPU 10 are
stored in the ROM 11. These programs are based, for example,
on the below-described flow charts as shown in Figs. 7 to 9.
The RAM 12 stores various data necessary for processing
by the CPU 10 as will be described in detail below with
reference to Fig. 5. The video RAM 13 temporarily stores
data processed by the CPU 10 and displays the data on a
` CRT display 14.
The operation unit 15 includes a calibration key 16,
a spectrum measurement key 17 and an analysis prohibition
indicator 18. The calibration key 16 is provided to give
an instruction for obtaining a reference spectrum at the
time of obtaining an absorption spectrum. The spectrum
measurement key 17 is provided to initiate the measurement of
spectrum data. The analysis prohibition indicator 18
indicates that sampling data cannot be
;'~
_ g _
2024905
analyzed. The calibration key 16 and the spectrum
measurement key 17 can indivldually provide instructions
to the CPU 10. By operating those keys, an operation as
described below based on the flow charts shown in Figs. 9
and 10 is executed.
A clock generator 9 supplies clock pulses to the
photoelectric conversion element 4, the A/D converter 7 and
the I/O bus.
Fig. 5 shows a fiber probe 20 for transmitting ~;
light from the light source 1 to the object 2 to be
measured and for transmitting the light reflected
from the object 2 to the spectroscopic means 3. The
fiber probe 2 includes a light transmitting fiber
bundle 21 and a light receiving fiber bundle 22,
15 which are joined together in an intermediate portion to `
form a fiber bundle 23. An end of the light transmitting
fiber bundle 21 receives the light from the light source
1. An end of the fiber bundle 23 on the other side ~
contacts the object 2. The light transmitted through the ;
light transmitting fiber bundle 21 is reflected by the
~ ~.. ..
, object 2 and is communicated to the spectroscopic means 3 -- -
through the light receiving fiber bundle 22. If the probe i~
i . :- . ~
is of a transmission type, the transmitted light may be ~-
communicated to the spectroscopic means 3 through the --~
.. :,
:.i: ::;:.~:
25 light receiving bundle 22 without integrally forming the -i-
-- 10 -- G ' ~ ~ ~
~, : .''.. ;~,"
'~ ': :'~ ~ '
. -, - i ' ' `.
~ - - ~
- 202490~
light transmitting fiber bundle 21 and the light receiving
fiber bundle 22.
Fig. 6 is a diagram showing data stored in the RAM 12
shown in Fig. 1, and Fig. 7 is a graph showing an example
5 of spectrum data measured in the embodiment of the present
invention.
In the above-described measurement apparatus shown in
Fig. I, the light from the light source 1 is applied to
the object 2 through the light transmitting fiber bundle
10 21 of the fiber probe 20 shown in Fig. 5 and the reflected
or transmitted light therefrom is directed to the `
spectroscopic means 3 through the light receiving fiber
bundle 22, by which a spectrum is produced, and then it is
converted to an electric signal by the photoelectric
15 conversion element 4. The electric signal is amplified by
the amplifier 5 and the amplified signal is converted
; to a light quantity signal by the log amplifier 6, whereby
the light quality signal is sampled by the A/D converter `~
; Ell' E12~ E13~ E1m of the sampling
20 with respective wavelengths ~ 2~ ~3~ ~ ~m are stored
as spectrum data in an area 12al of the RAM 12 shown in
Fig. 6. Distribution of those spectrum data is as shown
in Fig. 7.
Referring to Fig. 6, the data stored in the RAM 12
will be described. The RAM 12 includes areas 12al,
~' `~, ''
,' :. :, ~ .:: ' . .
~ 202~905
12a2... 12ak... 12an, 12b, 12cl to 12c4, 12d and 12e.
Spectrum data the number of which is n,are stored in the
areas 12al to 12an. Average spectrum matrix data El,
E2... Em are stored in the area ~2b. The total Mb
content, respective percentages of Mb%, MbO%, MMb%
analyzed by absorption spectra are stored in the areas
12cl to 12c4. Measured calibration data is stored in the
area 12d, and absorption spectrum data ar~ stored in the
area 12e.
lo Figs. 8 to 10 are flow charts for explaining a
specific operation of the embodiment of the present
invention. Particularly, Fig. 8 represents a main ~ ;
routine; Fig. 9 represents a calibration subroutine; and
Fig. 10 represents a spectrum measurement subroutine.
15 Referring to Figs. 1 to 10, the specific operation of the ;
embodiment will be described. First, in the main xoutine ~ ;
shown in Fig. 8, when measurement is started, the program
proceeds to a calibration mode in step SPl, in which the ~`-
calibration subroutine shown in Fig. 9 is executed. In
20 the calibration mode, the top end of the fiber probe 20 -~
shown in Fig. 5 is in contact with a material such as a
reference white plate having a fLxed reflectance with - ~.
respect to a measured wavelength range instead of the -
object 2 to be measured. In the case of a probe of a `-
transmission type, light from the light transmitting fiber
. . ~.
- 12 - -
.-. ~ .,,;
~=~
202490~
bundle 21 may be directly applied to the light receiving
fiber bundle 22.
The CPU 10 waits for the t:urn-on of the calibration key
16 in step SP11 shown in Fig. 9 and when it is determined
that the calibration key 16 is on, the CPU 10 sets the
number k of measurements to 1 in step SP12. Then, the CPU
: 10 executes the spectrum measurement subroutlne in step
SP13. In the spectrum measurement subroutine, the number
i of measurements is set to 1 in step SP51 as shown in
Fig. 10 so as to sample the first light quantity. In step
SP52, a clock pulse corresponding to the wavelength ~ is
generated from the clock generator 9. When this clock `
: pulse is generated from the clock generator 9, the
photoelectric conversion element 4 photoelectrically
: 15 converts a spectral component corresponding to the
wavelength ~1 provided by the spectroscopic means 3 in
step SP53.
In step SP54, the amplifier 5 amplifies an output of
the photoelectric conversion element 4 and the log
amplifier 6 converts the output of the amplifier 5 to a
light quantity slgnal. In step SP55, the A/D converter 7
converts the light quantity signal to a digital signal in
response to the clock pulse supplied from the clock -~ ::
; generator 9. The digital signal obtained by the A/D
converter 7 is supplied to the CPU 10 from the I/0 port 8
- 13 -
~ ~ 2 /~ 3
through the I/O bus. The CPU 10 accepts digital data E
cor.responding to the wavelength ~ in step SP56, and
stores the data Ekl in the area 12ak of the the RAM 12 in
step SP57. The CPU 10 determines in step SP58 whether the
number i is smaller than m. If it is determined that the
number i is smaller than m, the CPU 10 returns to step
SP52.
In step SP52, a clock pulse corresponding to the
wavelength ~2 is generated from the clock generator 9.
Subsequently, in the same manner as described above, the
operation in steps SP53 to SP57 is executed, whereby the
sampling data Ek2 of the wavelength ~2 is stored in the
area 12ak of the RAM 12. The CPU 10 repeats this
operation, whereby the spectrum data Ek1, Ek2..Ekm having
m wavelength components are stored in the storage area ;
12ak. Then, the CPU 10 returns to the calibration
..... ;: .: .
subroutine shown in Fig. 9. -
The CPU 10 stores, in step SP15, the spectrum data
stored in the area 12ak into the area 12al. Thus, i~ the
initial condition set in step SP12 is k = 1, the measured --
spectrum data is stored in the area 12al, and -
subsequently, each time the number k is set to 2, 3,... , ~
n, the spectrum data is stored successively in the areas ~-
12a2, 12a3,... , 12an. - `
'..'.'''
:, ~ .; .. .~:
: :,.:
- 14 - -~
~,~:',. ::
~ 20~49~5
In step SP15, the initial condition is set to k = k +
l and, in step SP16, it is determined whether k is smaller
than n. If k is smaller than n, the CPU 10 returns to
the above-mentioned step SP13. Thus, sampling for the
spectral output from the object 2 is repeated m times in
steps SP13 to SPl6. In step SP17, the sampled spectrum
data are averaged and the result is stored as calibration
data in the area 12d. After that, the CPU 10 returns to
step SP2 shown in Fig. 8.
In step SP2, the top end of the fiber probe 20 shown
in Fig. 5 is brought into contact with a specimen of mea~
as the object 2 to be measured. In step SP3, the CPU 10
sets the number i of measurements to 1, and the CPU lO
waits in step SP4 until the spectrum measurement key 17 is
15 operated. When the spectrum measurement key 17 is
operated, the CPU 10 executes the spectrum measurement ~ -`
subroutine in step SP5. In the spectrum measurement `~
subroutine, steps SP51 to SP58 shown in Fig. 10 are
:
executed in the same manner as described above. Through
20 this spectrum measurement subroutine, the spectrum data of
-~ the respective wavelengths are measured, and the number i
`~ + l is set in step SP6. In step SP7, it is determined
whether the number i of measurements is smaller than n,
and if the number i is smaller than n, the CPU lO returns
to step SP3. Thus, steps SP3 to SP7 are repeated and the
- 15 -
!'-- ,
- 2~2~
spectrum data for the respective wavelengths are measured
n times.
In step SP8, the measured spectrum data are averaged
and subtraction is performed as to the calibratlon data C
to Cm stored in the area 12d. Thus, the following
e~uation:
n
Ai = Ci k~lEKi/
is performed, whereby the absorption spectrum data is ;~
stored in the area 12e. After that, the CPU 10 executes
calculations of the above-mentioned equations (8), (9), ~
(10) and (11), so as to obtain the entire Mb content, `
respective percentages of Mb%, MbO%, MMb% and to store ` -
those data in the areas 12cl to 12c4. The CPU 10 displays ;
the entire Mb content, Mb%, MbO%, MMb% stored in the areas ;~ ;
:....~: .
12cl to 12c4 in step SP9, on the CRT display 14 through ~-
the video RAM 13.
As described in the foregoing, according to the ;
embodiment of the invention, meat to be tested is exposed
to rays of different wavelengths and the rays of the
respective dlfferent wavelengths obtained from the meat
are received for spectrum analysis. Thus, data ` `
representing a pigment of the meat is calculated according
to the spectrum pattern and prescribed calculation --
equations and the data is provided as output.
- 6 - - ~
- ,., .~.
202~90~
. :
The components of the present apparatus are small so that the
apparatus may be compact and light weight, and the freshness
of meat can be measured efficiently and in a handy manner in
various places.
Although the present invention has been described and
illustrated in detail, it is clearly understood that the
same is by way of illustration and example only and is not
to be taken by way of limitation, the spirit and scope of
the present invention being limited only by the terms of
10 the appended claims. . ~
~,, c :,