Note: Descriptions are shown in the official language in which they were submitted.
- 1 -
BACKGROUND OF THE INVENTION
The present invention describes a method for measuring the
mass flow rate of liquid flow in a two phase (gas/liquid) feed nozzle.
Two phase nozzles are important for a variety of applications
particularly for the injection of atomized feed in chemical or
petroleum processing operations. In many such processes, operability
or selectivity improvements result when an atomized hydrocarbon liquid
is sprayed in a controlled and measured manner into a reaction zone,
particularly when a process catalyst is involved. One example is the
process of fluidized catalytic cracking (FCC) of higher boiling
petroleum fractions. Typically, a high degree of feed atomization is
achieved by mixing the liquid feed with a gas and injecting the
mixture into the process from a feed nozzle designed to produce finely
dispersed drops. In catalytic cracking, steam is typically used as
the atomizing gas, but any process compatible gas may be used.
The need to control and measure the distribution of the
atomized liquid sprayed into a process vessel is normally satisfied by
using multiple services or nozzles. Maintaining the proper mixture of
liquid to gas for atomization, and ensuring that each nozzle carries a
specified liquid or mass flow, enables potential unit operating
advantages. One common operating mode is to maintain equal liquid
flow in each nozzle. Most installations which have multiple feed
nozzles usually include block valves or restriction orifices on the
liquid and gas lines to each individual nozzle, but these do not
uniquely determine the liquid flow. When nozzles are fed from a
common manifold, there is no assurance that the liquid flow through
each nozzle is optimized since only the net liquid flow to the total
manifold can be readily measured. In fact, measurement of various
manifolded nozzle flows has usually shown significant deviations from
equal liquid flow to each nozzle. In contrast the gas flow to a
nozzle is usually determined by a restriction orifice on the gas line
which ensures relatively uniform gas distribution to the individual
nozzles.
rb ~ ~~
-
Measuring mass flow of a liquid is not new. There are a
variety of flow meters that have been used to measure mass flow. Some
of them are mechanical in nature utilizing the force of a moving
liquid to turn a wheel or deflect a needle. Such flow meters can only
measure mass flow in single phase conditions and are usually re-
stricted to non-fouling liquids. Those flow meters available for the
single phase flows common to the petroleum and petrochemical industry
tend to be quite costly. The vary high temperatures that are main-
tained to reduce flow viscosity impose yet other complications.
Furthermore, the service liquids readily foul and clog the mechanical
components of such flow meters.
There are a variety of flow meters known as "vortex flow
meters' that utilize vortex wakes proceedings from obstacles placed in
the flow to measure the velocity of the flow from the frequency of
vortex shedding. Such flow meters are again limited to single phase
flow. Again, they require placement of an obstacle in the flow, and
hence are again prone to fouling. The temperature range of most
systems is narrow due to fundamental restrictions on the sonic trans-
ducers required to pick up the sound generated by the obstacle.
There are a variety of acoustic flow meters that utilize
ultrasonics to measure flow. A class of such flow meters utilizes an
ultrasonic transducer/receiver attached to the pipe containing the
moving fluid, and an ultrasonic receiver/transducer attached to the
same pipe up stream and/or down stream of each other. The high
operating temperature of many petroleum and petrochemical processes,
as well as geometrical constraints on the attachment of the acoustic
devices make these flow meters expensive and difficult to apply in
many petroleum and petrochemical applications. The operating tempera-
tures often exceed the operating limits of many single phase flow
meters.
Measurement of the liquid fraction of a gas/liquid mixture
flowing through two phase nozzles is difficult. Usual devices for
flow measurement are sensitive only to the velocity of the flow or its
pressure and not to mass flow. Hence, such devices are incapable of
..
- 3 -
measuring liquid flow without separate and equally complex measure-
ments of the density of the mixture. Devices that are capable of
measuring single phase liquid flow are expensive, and are often intru-
sive since they require the insertion of an orifice or barrier in the
flow which can be easily fouled by the liquid portion of the mixture.
Since in most petroleum and petrochemical applications, the two phase
mixture is maintained at an elevated temperature to achieve a suffi-
ciently low viscosity for flow, there is a temperature limitation on
flow measurement devices as well.
Thus most petroleum and petrochemical installations do not
meter flows to each feed nozzle because suitable and easily maintained
flow meters are expensive due to the sevexity of process conditions
and pipe geometry limitations. The development of specialized flew
meters to meet such stringent conditions would require significant
expense and undesired complexity.
Although petroleum and petrochemical processing units may
demonstrate improved operation with specified liquid distribution from
manifolded feed nozzles, only the net liquid flow to the manifold is
usually measured or controlled. However, without a measuring scheme
the probability of a desired flow distribution among feed nozzles is
small due to the complex nature of the two phase fluid exiting the
nozzle. Uncertainties in liquid distribution are compounded by the
possibility that a portion of the liquid feed could be vaporized.
The existence of such flow imbalance is usually inferred only
by anomalous process conditions or from changes in output yields over
an extended period of time. Furthermore, feed nozzles can partially
plug or erode leading to significant flow maldistributions which can
remain undetermined until the unit is shut down far maintenance.
There is thus a need for a technique that can measure and monitor the
liquid flow from an individual nozzle.
The present invention is a method for determining the mass
flow rate of the liquid feed in individual feed services. The present
- 4 -
invention shows how this measurement can be done passively and non-
intrusively with respect to the flow by either
(1) using a dynamic pressure transducer in acoustic contact
with the acoustic energy within the fluid within the barrel of the
feed nozzle or connected piping.
(2) using accelerometers in solid borne sound contact with
the acoustic energy within the fluid within the barrel of the feed
nozzle.
The term "non-intrusively" is used to mean that the sensor does not
penetrate into the flow although it may be permanently installed
approximately flush with the surface of the pipe interior. That is,
the sensor is not disruptive to the flow.
From the method taught in this invention, liquid flow rate
can be measured and monitored in real time for a wide degree of
liquid/gas atomization conditions in individual feed services or
nozzles. Since the method measures quantities related to the mass of
the flowing fluid it is a widely applicable technique for many
categories of two-phase fluid sprayers. Since it depends only upon
the vibration and resonances inherent in the flowing systems and
piping, it can be applied rapidly and with, ease in a variety of
systems. Since the output of the method taught is electronic in
nature it is easily transmitted to a control system and the method can
be used to automatically measure and control the feed atomization and
feed flow through individual nozzles fed off a common manifold.
SZTM~IARY OF THE INVENTION
The present invention is a method for measuring the mass flow
rate of liquid flow exiting a two phase (gas/liquid) feed nozzle. The
present invention can also be expressed as a method for measuring
liquid volumetric flow since the flow rate of liquid mass and volume
are related by the nearly constant liquid density. For convenience in
what follows, the "mass flow" shall be used to designate both liquid
- 5 -
mass flow and liquid volumetric flow. The method includes determining
the Power Spectral Density from the output of a vibrational sensor
(accelerometer or dynamic pressure sensor) in close proximity to the
nozzle or in contact with the fluid within the nozzle in a frequency
band that includes resonant peaks (Liquid Flow Peaks or LFP) whose
magnitude is strongly dependent on the mass flow rate of the the
liquid and which increases as the flow increases. The frequency range
of the power spectral density may include only a single dominant peak
or a series of peaks. Measurement of the area of the resonant peaks
or of a band of frequencies that includes them is proportional to the
liquid flow and is insensitive to the gas flow. The proportionality
constant between the magnitude of the LFP or of a band of frequencies
including them can be determined before the nozzle is attached to the
unit or by one time calibration.
The Power Spectrum of the vibrational sensor is defined as
the distribution in frequency of the square of the output of the
vibrational sensor (the Power Spectral Density). The power spectral
density has the units in this invention of either acceleration squared
per unit frequency (Hertz) or pressure squared per Hertz (Hz). The
power spectrum has the property that the area of the power spectral
density over any frequency range is equal to the mean square of the
output of the vibrational sensor; for this invention, either the mean
square acceleration or the mean square pressure. The Power Spectrum
is most simply obtained as a plot of the power spectral density as a
function of frequency by passing the output o~,the vibrational sensor
into a digital signal processor (Brue1 and Kjaer 2032 or similar).
Under these circumstances it is often convenient to display in
figures, the RMS Pressure or Acceleration Spectrum which is propor-
tional to the square root of the Pressure or Acceleration Power
Spectral Density. It is also often convenient to plot the square root
of the area of the Power Spectrum of the vibrational sensor as the RMS
Acceleration or RMS Pressure over a band of frequencies.
It is found experimentally that the LFP are found at rela-
tively low frequencies and usually between 0 and 4000 Hz and in few
cases above 6400 Hz.
.
- 6 -
The vibrational sensor can either be an accelerometer in
contact with the shell of the feed nozzle with or a dynamic pressure
transducer in acoustic contact with the flow within the nozzle. One
of the advantages of the present invention is that the method does not
depend on nozzle geometry, working equally well for nozzles that
achieve gas/liquid mixing by either having mixing vanes or flow
restriction.
BRIEF DESCRIPTION OF THE DRAWINGS
Figure la shows a schematic of the feed injection zone in a
fluidized catalytic cracking unit (FCC unit) indicating the placement
of the feed nozzles.
Figure lb shows the ail manifold supplying oil to an
individual feed nozzle with oil block valves indicated (7).
Figure lc shows the flow connections to an individual feed
nozzle where the steam flow is determined through a restriction
orifice (RO) (10) and where the oil flow is determined by a block
valve (12).
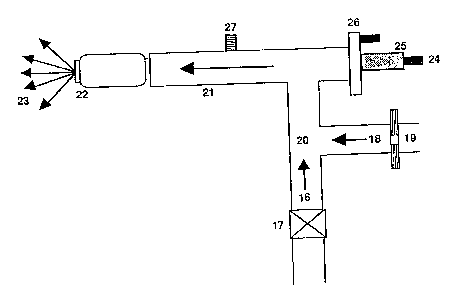
Figure 1d illustrates a suitable location for the pressure
transducer which should be in contact with the two phase fluid within
the injection nozzle, and suitable locations for the accelerometer (25
& 26) which should be mounted such that it is sensitive to vibrational
modes of the nozzle that are excited by the turbulent two phase stream
exiting the nozzle tip.
Figures 2a, 2b, 2c, 2d, 2e, 2f, 2g, and 2h illustrate the
conversion of an unfiltered and filtered time varying acceleration
(pressure) to an Acceleration (Pressure) Power Spectrum or to a RMS
Power Spectrum. For specificity, the vibrational sensor in Figure 2
is taken to be an acceleration sensor; a dynamic pressure sensor would
do as well.
7 _
Figure 2a shows a typical Acceleration signal as a function
o.f time. Figure 2b shows the square of the Acceleration signal of
Figure 2a. Figure 2c shows the Acceleration Power Spectrum of the
signal shown in Figure 2a. The Acceleration Power Spectrum displays
Acceleration Power Spectral Density as a function of frequency. The
integral of the Acceleration Power Spectral Density over all the
frequencies contained in the Acceleration signal shown in Figure 2a is
equal to the time average of the square of the Acceleration signal
shown in Figure 2b. Figure 2d shows the RMS Acceleration Spectrum
which is proportional to the square root of the Acceleration Power
Spectral Density shown in Figure 2c.
Figure 2e shows another typical Acceleration signal as a
function of time. Figure 2f shows the Acceleration Power Spectrum of
the signal shown in Figure 2e. The Acceleration Power Spectrum
displays Acceleration Power Spectral Density as function of frequency.
The integral of the Acceleration Power Spectral Density between the
frequencies, F1 and F2, indicated on Figure 2f is defined as the area
of the indicated peak. It is equal to the mean squared power of the
acceleration time signal for the band of frequencies between Fl and
F2.
Figure 2g shows the Acceleration signal of Figure 2f that has
been passed through a filter device that reproduces the signal for
frequencies, F, inside a pass band Fl < F < F2 and strongly attenuates
the signal outside that band.
Figure 2h shows the Acceleration -Power Spectrum of the
filtered signal shown in Figure 2g. The Acceleration Power Spectrum
displays the Acceleration Power Spectral Density as function of
frequency. The integral of the Acceleration Power Spectral Density
over all the frequencies contained in the Acceleration signal shown in
Figure 2g is equal to the time average of the square of the accelera-
tion signal shown in Figure 2g.
Figure 3 shows the RhiS Acceleration Spectrum from an
accelerometer mounted on the rodding plug (Figure ld) (Location 25) of
~~r~~J~~
_ g _
a feed nozzle on a cat-cracker injecting oil and steam into the feed
riser of a FCC unit. The region of the spectrum for this nozzle
containing the "Liquid Flow Peaks (LFP)" (0-4000 Hz) which increase
with increasing oil flow, and the "Gas Flow Peaks (GFP)" (4,000-
12,8000 Hz) which decrease with increasing oil flow are approximately
indicated. Precise identification of these peaks, and the regions of
the RMS Acceleration Spectrum where they are found, is based on field
calibration.
Figure 4a shows the RMS Acceleration Spectrum (units o~ Ms-2)
derived from an accelerometer mounted as shown in Figure ld (Location
26) for 150 gpm (gallons per minute) of water and 370 SCFM (volume
flow in standard cubic feet per minute) of air over the range 0-1600
Hz. The Liquid Flow Peak is the shaded region about 400 Hz.
Figure 4b shows a plot of the area of the shaded peak in the
RMS Acceleration Spectrum defined by the shaded region of Figure 4a as
a function of air mass flow for discrete values of liquid exiting the
injection nozzle. This peak is the Liquid Flow Peak (LFP) in ques-
tion. The area of the LFP is denoted the ALFP (units: Ms-2).
Figure 4c shows the linear dependence of the area of the 400
Hz peak for the feed nozzle (ALFP) of Figure 4b as a function of water
flow for air flows of 200, 250 and 300 SCFM.
Figure 5a shows the ltMS Pressure Spectrum (27) (units: Pounds
per inch2) derived from a dynamic pressure transducer mounted as shown
in Figure 1d for 150 gpm of water and 248 SCFM of air over the range
0-50 Hz for the same nozzle whose RMS acceleration spectra is shown in
Figure 4a.
Figure 5b shows a plot of the area of the RMS Pressure
Spectrum over the full 50 Hz range (ALFP; units:pounds per inch2) as a
function of air flow for discrete values of liquid flow exiting the
inject nozzle illustrating the weak dependence on air flow.
- 9 -
Figure 5c shows the linear dependence of the area of the P,MS
Pressure Spectrum over the full SO Hz range (ALFP) of Figure 5b as a
function of water flow for air flows of 200, 250 and 300 SCFM illus-
trating the strong dependence on water flow.
Figure 6a shows the RMS Acceleration Spectrum derived from an
accelerometer mounted as shown in Figure ld (Location (25)) for 150
gpm of water and 370 SCFM of air over the range 0-6400 Hz for the same
injection nozzle whose RMS Acceleration Spectrum shown in Figure 4a
for the range 0-1600 Hz.
Figure 6b shows a plot of the area of the RMS Acceleration
Spectrum (ALFP) over the range 0-6400 Hz for the nozzle whose RMS
Acceleration Spectrum is shown in Figure 6a as a function of air mass
flow for discrete values of liquid exiting the injection nozzle.
Figure 6c shows the linear dependence of the area of the RMS
Acceleration Spectrum (ALFP) for the injection nozzle of Figure 6b as
a function of water flow for air flows of 200, 250 and 300 SCFM.
Figure 7a shows the RMS Acceleration Spectrum (0-1000 Hz) of
an injection nozzle of a different design as that shown in Figures 3-6
for a constant flow of air at 230 SCFM and water flow varying from 0
to 240 gpm. The darkened peak near 600 Hz is the LFP.
Figure 7b shows a plot of the water flow (gpm) of Figure 7a
as a function of the height of the shaded peak in Figure 7a.
Figure 8a shows the RMS Acceleration Spectra over the range
800-2500 Hz a feed nozzle which is injecting a mixture of oiI and
steam into an operating cat-cracker. 'Che location of the accelero-
meter was on the "rodding" plug of the feed nozzle (Location (24) of
Figure 1d). The opening of the respective block valve is indicated on
Figure SA. The LFP for the feed nozzle is also indicated.
- 10 -
Figure 8b shows the linear correlation between oil flow and
RMS acceleration defined by area of the "Oil Peak" (ALFP) for the feed
nozzle in Figure 8a.
DESCRIPTTON OF THE PREFERRED EMBODIMENT
The present invention is a method for non-intrusively deter-
mining liquid (mass) flow exiting a two phase (gas/liquid) nozzle the
method correlates vibrational power on the surface of the nozzle or
related piping or of the fluid mixture within the nozzle to the liquid
flow rate. In one embodiment of the invention, an accelerometer or
other vibrational measuring device is attached to the shell of the
feed nozzle or related piping in solid borne sound contact with the
acoustic power within the fluid mixture. In another embodiment of the
invention a dynamic pressure transducer is in contact with the gas-
liquid mixture within the nozzle or related piping. In both cases the
time varying electric signal from either of these sensors is amplified
and then either recorded for subsequent processing or processed
directly into a power spectrt~nn. This power spectrum displays the
frequency content of the vibrations of the nozzle or of the dynamic
pressure fluctuations of the liquid within the nozzle. A general
description of the electronic system by which the vibrational signal
is correlated with liquid flow is given in what follows. Two phase
feed injection nozzles of a fluidized catalytic reactor are sometimes
used for illustrative purposes but this invention is not restricted to
this use.
Figure la is a schematic of the injection region o~ a typical
fluidized catalytic cracking unit/FCC unit showing the location of the
eight,(for this example) feed nozzles (1) injecting into feed riser
(2) with catalyst flow (3) indicated. Oil to the feed nozzles is
distributed from header (4) to a common manifold (5) as shown in
Figure lb. As indicated in the figure, individual block valves (7) in
each nozzle line control the oil flow to the (6) nozzle. As shown in
Figure lc, steam (9) and oil (11) are fed to an individual nozzle;
where the steam serves the dual purpose of atomizing the oil and
keeping the nozzle unplugged when the oil is off. Oil flow is
- 11 -
controlled by the block valves (12) as indicated in Figure lc; steam
flow is controlled by having the high pressure steam flow through a
restriction orifice (RO) (10) which typically under conditions of
"choke flow" maintains a constant mass flow of steam independent of
the downstream pressure. The nozzle protrudes into feed riser wall
(13) to disperse atomized oil (14), into catalyst flow (15).
Figure ld shows an individual feed nozzle plumbing in more
detail. Oil (16) flowing through block valve (17) mixes with steam
(:L8) controlled by RO (19). The oil/steam mix point (20) is located
downstream of both the oil valve and R0. The mixture is pushed
through nozzle barrel (21) to nozzle tip (22) and exits as a spray
(23) from the nozzle tip.
In one embodiment of the invention, a vibrational sensor (24)
is placed on nodding plug (25) or adjacent to the flange (26) support-
ing the nodding plug or in any location responsive to the liquid flow-
generated sound and vibration. In another embodiment of the inven-
tion, a dynamic pressure transducer (27) is located to be in contact
with the flow downstream of the mix point (20). Any location where
the transducer is sensitive to changes in the flow rate is acceptable.
The magnitude of the time dependent electrical signal from
the accelerometer, or dynamic pressure transducer illustrated in
Figures 2a and 2e, is proportional to the vibrational power of the
surface of the feed nozzle (accelerometer) and/or to the fluid within
(dynamic pressure transducer). Quantitatively, the average of the
square of this signal over a time interval is proportional to the Mean
Square Power over that time interval. This quantity is one measure of
the vibrational energy being produced by the turbulent flow exiting
the nozzle as shown in Figure 2b. In what follows we will sometimes
refer to the output of either the accelerometer or dynamic pressure
signal as the "vibrational signal" and the square of the output of
either the accelerometer or the dynamic pressure transducer as the
"vibrational power".
2~~~~~~
- 12 -
The present invention utilizes another measure of the vibra-
tional power -- namely the distribution of vibrational power over
frequency. As is well known, the distribution of vibrational power is
given by the Power Spectrum of the vibrational sensor which is a
plot of the Power Spectral Density as a function of frequency. Figure
2c shows the Power Spectrum of the time varying random signal of
Figure 2a. The area of the Power Spectrum density over any frequency
range is proportional to the mean square vibrational energy of the
time varying signal in that frequency range (Figure 2b). The power
spectral density for an accelerometer (dynamic pressure transducer)
has the units of acceleration squared per hertz (pressure squared per
hertz).
It is often more convenient to display the RMS Power Spectrum
where the RMS Spectral Density is plotted as a function of frequency
as shown in Figure 2d. RMS stands for "Root Mean Square". The RMS
Power Spectral Density for an accelerometer (dynamic pressure trans-
ducer) has the units of RMS acceleration (RMS pressure). Within a
constant factor the RMS acceleration (or pressure) is equal to the
square root of the power spectrum for acceleration or pressure. As is
well known to those skilled in the art of digital signal processing,
the proportionality factor between the Power Spectrum of the accelera-
tion (pressure) and the RMS acceleration (pressure) spectrum is the
square root of the frequency resolution of the signal processor.
The electrical output for both acceleration and pressure
vibrational sensors is converted from a function of time to one of
frequency by means of a digital signal processor or equivalent tech-
nique. The Power Spectrum displays the, power of the signal as a
function of frequency and has the unique property that the area of the
power spectrum density over a frequency band is proportional to
vibrational power in that frequency band.
It has been discovered that the vibrational power in certain
regions of the Power Spectrum can be used to measure the volumetric of
liquid flow rate exiting the two phase nozzle. In some cases the
method of measuring the flow utilizes the power in a specific peak in
~~r~~~~f~
- 13 -
the Power Spectrum; in other cases, it can be shown that the power of
a band of frequencies in the Power Spectrum, including the peak, can
also be a measure of the liquid flow. In some cases the height of the
peak can also be used as a measure of the liquid flow.
There are alternative signal processing techniques that may
have significant cost or performance advantages over computing the
entire Power Spectrum. For example, once the above band of frequen-
cies has been identified, the energy content of the band can be
determined in a variety of ways. Digital (or other) band pass filter-
ing of the signal from the vibrational sensor followed by power
detection is equivalent to measuring the area of the Power Spectrum
over a selected bandwidth. The specific signal processing technique
by which the energy content of the vibrational signals over a band of
frequencies is determined is not critical as long as the frequency
range includes peaks or series of peaks whose area is a sensitive
function of the mass of liquid exiting the nozzle. It is also not
critical for the purpose of this invention, whether the necessary
signal processing of the vibratianal signals is done on the platform
adjacent to~ the injection nozzle, or done in the control room, or
distributed between them.
It is critical for the purpose of this invention, that field
calibration be used to identify peaks and associated regions of the
Power Spectrum whose area (or mean square vibrational power) is a
strong function of the acoustic noise generated by liquid flow exiting
the nozzle in question. In what follows, these peaks are denoted as
Liquid Flow Peaks (LFP). In this patent the measure of the vibra-
tional power in the frequency band that includes the Liquid Flow Peaks
will be the RMS Acceleration (or Pressure) which is defined by the
square root of the area of the power spectral density over a frequency
band that includes the Liquid Flow Peaks. This area will be designat-
ed as the ALFP and has the units of RMS acceleration (or pressure).
It has been discovered that the ALFP is directly correlated with the
volume of liquid flow. In many cases, the ALFP is a linear function
of the liquid flow rate, but for the purpose of this patent does not
have to be. Establishing the correlation factor between the ALFP and
Y~~ t
- 14 -
liquid flow from the nozzle can either be done in a test facility
where liquid can be measured directly or by field calibration as
described later. Above the liquid flow peaks on the frequency spec-
trum are gas flow peaks which axe primarily responsive to gas flow
through the restriction orifice. These gas flow peaks are not rele-
vant to the present invention.
The Liquid Flow Peaks (LFP) are usually found at relatively
low frequencies and it appears that they arise from longitudinal
"organ pipe" resonances excited by the turbulent stream exiting the
two phase injection nozzle. The excitation of the "organ pipe"
resonances would be expected to be proportional to the kinetic energy
of the liquid exiting the nozzle and hence a function of the mass
flow. However, it is well known in acoustics that the frequencies of
resonances can depend on the coupling between the fluid and the
mechanical structure surrounding it, as well as all acoustic paths
within the two phase liquid available. For these reasons the LFP's
are specific to given nozzle and its plumbing, and have to be deter-
mined directly for the working injection nozzle.
Figure 2e shows the time varying signal from a vibrational
sensor (accelerometer or dynamic pressure). Figure 2f shows a plot of
the power spectral density of such a transducer. The peak between
frequencies F1 and F2 is meant to represent the LFP. The area under
the Power Spectral Density curve between frequencies F1 and F2 is the
ALFP. This area is equal to the mean square power of the vibrational
sensor in the frequency band between F1 and F2.
Once the Liquid Flow Peak (LFP) has been identified through
its dependence on liquid flow, the ALFP can be determined in a variety
of ways. One approach has been described above based on a digital
signal processor. There are other ways which may be sometimes conve-
nient. For example, the original vibrational signal shown in Figure
2e can be passed through a filter which strongly attenuates vibra-
tional energy at frequencies below F1 and above F2. Such a filter is
known as a digital or analog "band-pass" filter. If the vibrational
signal shown for Figure 2e is passed through such a filter, the output
~~~~J~~
- 15 -
is a different vibrational signal as illustrated in Figure 2g. The
signal shown in Figure 2g only has a finite Power Spectral Density
between F1 and F2 as shown in Figure 2h. The time varying signal of
Figure 2g can be squared in a suitable electronic device and average
(rectified and filtered) to give a do signal that is proportional to
the ALFP that was illustrated in Figure 2h.
In general the LFP are often found in the relatively narrow
range of 0 to 6400 Hz for injection nozzles of common use in petroleum
refining and the petrochemical industry corresponding to two phase
flow in the flow regime where liquid flow is from 50 to 300 gpm
(gallons per minute) and gas flow in the regime is 50 to 450 SCFM
(mass flow of gas in standard cubic feet per minute).
Figure 3 shows the RMS acceleration power spectrum (Location
25 of Figure ld) from an accelerometer mounted on the "rodding plug"
of a working feed nozzle. The liquid Flow Peaks (LFP) whose amplitude
increases with oil flow are found in this example below 2000 Hz. The
Gas Flow Peaks whose amplitude decreases with oil flow, are found fox
this nozzle are found in a significantly higher frequency range; for
the case of this nozzle the Gas Peaks lie between 4,000 and 12,000 Hz.
1
Figure 4 illustrates the method of the present invention when
a plant scale injection nozzle is attached to a test facility where
gas (air) and liquid (water) flow to the nozzle can be determined
directly. The acoustic properties of air and water are similar to the
acoustic properties of the gases and liquids in common use within
petroleum refining and the petrochemical industry. Figure 4a shows
the RMS Acceleration Spectrum of the accelerometer signal attached in
location 26 of Figure ld over the range 0-1600 Hz for water flow of
150 gpm (gallons per minute) and air flow of 370 SCFM (standard cubic
feet per minute). The LFP at 400 Hz is identified by the arrow and
its area identified by the shading. The ordinate of Figure 4b is the
square root of the area of the LFP, in units of meter per second2
(Ms-2) plotted as a function of the measured air mass flow (SCFM) for
different liquid flow rates (gpm).
- 16 -
From Figure 4b, and clearly shown in Figure 4c, the ALFP is
an approximately linear function of the liquid flow and is relatively
independent of gas flow in the flow regime of liquid flow above 100
gpm and air flow above 100 SCFM.
Figure 5a shows the RMS Pressure Spectrum over the range 50
Hz of output of a dynamic pressure transducer obtained for the same
nozzle as in Figure 4a whose RMS acceleration spectra is shown for
water flow of 150 gpm and air flow of 270 SCFM. The ALFP is defined
as the area of the Power Spectrum from 0-50Hz. The ordinate of Figure
5b is the ALFP (pounds per square inch) plotted as a function of the
measured air flow (mass flow in SCFM) with different liquid flow rates
in gallons per minute. For air flow above about 100 SCFM and liquid
flows between 0 and 250 gpm, the RMS pressure over the 50 Hz band is
an approximately linear function of the liquid flow rate as is shown
directly in Figure 5c.
Figure 6a shows the RMS Acceleration Spectrum of the
accelerometer over the range 0-6400 Hz for the same nozzle utilized in
Figure 4 and for the same flow conditions as in Figure 4a. The
ordinate in Figure 6b is the ALFP as a function of air flow for
different values of liquid flow. The curves of Figure 6b are very
similar to that of Figure 4b showing the relative insensitivity of the
ALFP to the precise bandwidth chosen for the area as long as the
bandwidth includes the LFP at 400 Hz. Figure 6c is a plot of the ALFP
as a function of volume of liquid flow rate at constant air flow.
Figure 6c is similar to Figure 4c despite the increased bandwidth,
because the ALFP is dominated by the LFP (400 Hz) and its harmonics
over the range 6400 Hz for the flow regime in question.
It is clear that if separate liquid flow measurements are
made, the correlation connecting the ALFP and the liquid flow rate can
be obtained. Subsequent measurements of the ALFP can then be used to
monitor and measure the oil flow from individual injection nozzles and
optimize the refining or petrochemical process with respect to the
flow distribution. Blocked or partially blocked feed nozzles can be
identified and corrective action taken.
- 17 -
In a plant environment the LFP can be identified by changing
the oil block valve ((12) of Figure lc) in steps from fully closed to
fully open and identifying the peaks in the power spectrum that
change. There are several ways of calibrating the ALFP and the liquid
flow out of the nozzle.
The correlation between the ALFP and liquid flow can be
determined by measuring the change in oil flow to the manifold when
the block valve of a specific nozzle is changed while the pressure in
the manifold is kept constant. Under these circumstances the flow out
of the other nozzles is unchanged and the change in the net flow to
the manifold is the flow to the nozzle in question. After the corre-
lation coefficient has been determined for each nozzle, the assumption
of unchanged oil flow to the other nozzles When the block valve on one
nozzle is changed, can be tested. Another alternative is the direct
one of measuring directly the liquid flow to the nozzle in question,
replacing the oil and steam by more easily handled liquids and gases
such as water and air, and measure the ALFP for a range of liquid flow
that correspond to the operating conditions of the nozzle in question.
Yet another way to calibrate the ALFP with respect to liquid flow is
to insert for the time of calibration, a flow meter in the liquid
line. Once the calibration has been obtained, the ALFP for that
nozzle can be used as a measure of liquid flow.
Figures 7 and 8 illustrate two alternative ways of calibrat-
ing the vibrational signal with respect to liquid flow for the same
injection nozzle; in this case a FCC unit feed nozzle. In Figure 7
the liquid flow to a specific nozzle was measured directly; in this
case the liquid was water and the gas was air. In Figure 8, constant
pressure was maintained to the oil manifold feeding the nozzle in
question, and the change in total oil flow to the manifold was
measured directly as the valve controlling the flow to the nozzle was
changed. At the same time the ALFP was measured. The gas in this
case was steam.
Figure 7a shows a series of RMS Acceleration Power Spectra
for the cat-cracking feed injector tested with water and air. The
- 18 -
design of the mixing chamber within this nozzle is considerably
different from the nozzles considered in Figures 4-b. The shaded
region illustrates the LFP at 600 Hz. In Figure 7b the changes in the
peak height of the LFP (which for the data of Figure 7a are propor-
tional to the ALFP) are shown to be a linear function of the water
flow at constant air mass flow (230 SCFM). This is one way of obtain-
ing the correlation between the ALFP and the liquid flow exiting the
nozzle.
The alternative way of calibrating the correlation between
the vibrational signal and the liquid flow exiting the nozzle is
described below. The oil flow to the nozzle in question was deter-
mined from the change in oil flow to the oil manifold under constant
pressure conditions.
Figure 8a is the RMS Acceleration Spectra for the accelera-
tion over the range 800-2500 Hz for a feed nozzle on a working FCC
unit. The shaded region is the LFP which is at about 1650 Hz. The
accelerometer which i.s the source of the vibrational signal is mounted
on the "rodding" plug of the nozzle (Location (25) of Figure ld). In
each the control variable is the oil block valve setting (indicated in
X Open) and the LFP is indicated by the shading. Measurement of the
change in the manifold oil flow when the feed nozzle is shut off from
any specific setting it is possible to estimate the oil flow corre-
sponding to the setting of the oil block valve.
Figure 8b exhibits the linear correlation that is obtained
between the ALFP and the measured liquid flow. From this correlation
the liquid flow through the feed nozzles can be estimated by suitable
algorithms. Changes in the oil block valve can be made to optimize
the flow into the injection zone of the FCC unit. In addition the
ratio of steam to oil can be monitored and controlled by measuring the
oil flow and changing the steam mass flow by suitable changes in the
steam restriction orifice (Figure lc).