Note: Descriptions are shown in the official language in which they were submitted.
20~S~
LOGGING WHILE DRILLING APP~RATUS WITH
MULTIPLE DEPTH OF RESISTIVITY INVESTIGATION
BACKGROUND OF THE INVENTION
Several methods of resistivity logging while drilling
have been developed in the past. A method using toroidal coils
around the drill stem mandrel to act as low frequency current
transmitters and receivers (Arps U.S. No. 3,305,771 ) is
currently employed and provides resistivity logs similar to the
wireline laterolog tools. The high frequency wave propagation
method (Gouilloud et al U.S. No. 3,551,797) provides logs
similar to the wireline induction tools, and is currently
employed widely in the industry. Recently the wave
propagation method was improved by the incorporation of the
borehole compensation feature and the dual depth of
investigation feature (Clark et al U.S. No. 4,968,940). Both of
these recent improvements, however, had been previously
disclosed by Calvert (U.S. No. 3,84g,721) and Huchital (U.S. No.
4,209,741 ) respectively, and the Clark disclosure builds on the
combination of the previous ideas.
It has been standard practice in wireline resistivity
logging tools to provide three measurements with different
radial penetration, this being the minimum number required to
solve quantitatively even the simplest model of formation
invasion. While these methods are highly successful, the
wireline data are gathered usually days or weeks after
important reservoir rocks have been drilled, and can only
observe the possibly damaging effects of drilling at excessive
borehole pressure, resulting in severe invasion and possible
plugging of porous formations by water or other borehole
fluids. This may at the least require costly remedial actions, or,
at the worst, result in an oil bearing formation being
misinterpreted as water laden by the drilling fluid filtrate.
J ~ . ~ ~ $ ~
--2--
There is clearly a great value in observing invasion
quantitatively while drilling (or immediately thereafter) so
that the drilling engineer can adjust mud weights optimally.
Similarly, the correction of resistivity data for invasion effects
allows more accurate calculation of the hydrocarbon content of
rocks which is of great importance in estimating reservoir
potential. This can best be achieved as soon as possible after
drilling. Analysis of the trend of resistivity data in otherwise
uniform rock formations has been widely used as a predictor of
over pressure mud conditions, so this information may also be
used by the drilling engineer to adjust mud weights.
While it has not previously been possible to in situ
measure a time profile of invasion during and immediately
after drilling, such information could be of immense
importance to reservoir engineers in determining the fluid
permeability of rock formations in the virgin form encountered
by the drill bit. Estimates of this data are obtained by wireline
formation tester logging tools, but often are inaccurate due to
the difficulty of mechanically displacing fluids in a localized
area of the borehole wall and of overcoming the effects of
previous formation invasion.
Finally, it is sometimes difficult for wireline logging
tools to acquire information due to mechanical difficulties after
drilling through poorly consolidated formations or in smaller
borehole diameters. It is possible that a well may have to be
abandoned due to the inability to use wireline tools or to
equipment failure. Clearly, if a measurement while drilling
could be made that provides data of equal quality to the
wireline tool (accuracy, thin bed resolution, invasion corrected,
etc.), then it would result in significant operational and
economic benefits. This might avoid delay to run wire line
tools .
One of the advantages of the present invention
derives from the fact that three different depths of
measurement are incorporated in an MWD tool. In the
preferred and illustrated embodiment, a drill collar is
f ~ ~J.
--3--
constructed having an axial passage for delivery of mud flow
through the lower end of the collar and it is preferably located
just above the drill bit. Indeed, it comprises the lower part of
several drill collars typically found in a drill string. Moreover,
it supports coils on the exterior used to form fields in the
adjacent formations to make measurements. Measurements
are made at three depths which are generally a shallow
measurement which is obtained at a relatively low frequency,
and higher frequency coils are used to make investigations at
intermediate and maximum depths of investigation. This
arrangement of the equipment enables resistivity to be
determined at three depths which is significant for obtaining
data with regard to the rate of filtrate invasion into the
formations.
Consider as an example a well where the drill bit is
momentarily totally within a non-producing formation which is
substantially impervious to the penetration of filtrate. As the
drill bit passes through the lower interface of that formation
and enters a producing sand formation, there is a consequential
flow of filtrate out of the drilling fluid into that formation.
Assuming that a pressure differential does prevail and some
portion of drilling fluid will enter the formation, the filtrate
will displace the connate fluids. In ordinary circumstances, one
can presume that the formation is axisymetric about the well
borehole and the filtrate will therefore flow radially outwardly
in an equal omnidirectional fashion. The filtrate rate of flow
measured radially from the borehole requires typically several
hours, and indeed several days, to reach the distance from the
borehole at which the deepest area of investigation occurs. The
sensors supported on the drill collar are positioned so that
measurements are made at the three depths, and provide this
information regarding invasion in the midst of the filtrate
invasion thereby providing data showing the virgin formation
material measurements.
20~ 1 1 q6
SI ~ Y OF THE INVENTION
Accordingly, it is the purpose of the
present invention to include at least three resistivity
measurements with deep, medium, and shallow depths of
investigation. It is a further feature of the
invention to design the spatial responses of these
measurements so that quantitative correction and inter-
pretation of invasion effects may be made in a wide
range of formation/borehole environments. Specifi-
cally, the mud filtrate may be of lower or higherresistivity than the connate formation fluids, result-
ing in what is commonly known as normal and inverse
resistivity contrast. Additionally, in accordance with
recent advances in wireline induction logging, it is an
important part of the invention that all measurements
have thin bed resolution sufficient to resolve accu-
rately two foot thick formation features. False
indications of invasion due to unmatched resolution are
eliminated, unlike previous methods. Finally, a method
of data processing to interpret the resistivity and
invasion information and to correct for deleterious
phenomena at dipping bed boundaries is included.
A method in accordance with the present
invention comprises the steps of: (a) while drilling
the well borehole with the drill bit, forming a multi-
frequency field into formations around the well
borehole wherein the field enables resistivity measure-
ments, the field having a first frequency in the audio
range and having a second frequency in the radio
frequency range; (b) forming the field sufficiently
close to the drill bit that drilling fluid invasion
into the formations drilled with the well borehole is
observed to change resistivity during drilling; and (c)
forming the field at multiple times while drilling the
well borehole so that fluid invasion is measured during
drilling to enable preinvasion and post invasion values
of resistivity to be obtained.
., ~
f:, ~
2081 1~6
- 4a -
BRIEF DESCRIPTION OF THE DRAWINGS
So that the manner in which the above
recited features, advantages and objects of the present
invention are attained and can be understood in detail,
a more particular description of the invention, briefly
summarized above, may be had by reference to the
embodiments thereof which are illustrated in the
appended drawings.
It is to be noted, however, that the
appended drawings illustrate only typical embodiments
of this invention and are therefore not to be
considered limiting of its scope, for the invention may
admit to other equally effective embodiments.
Fig. 1 schematically shows a typical MWD
arrangement on a drilling well employing a system
according to the present invention;
.~
- 5 ~ ~ r~
Fig. 2 shows a drill collar supporting an array of
CWR and HTR coils enabling investigations at three different
depths from the drill collar during MWD operations to measure
resistivity before and during filtrate invasion;
Fig. 3 is a schematic block diagram of the high
frequency circuitry CWR of the present apparatus and further
shows how that circuitry connects with the transmitter and
receiver coils positioned on the drill collar in Fig. 2;
Fig. 4 shows additional circuitry found in the
apparatus which is used for operation at relatively low HTR
frequencies to obtain resistivity on a shallow investigation, and
further shows transmitter and receiver coils positioned on the
drill collar shown in Fig. 2;
Figs. 5 and 5A show different curves of phase shift
and attenuation with respect to resistivity for the intermediate
and deep spacing coils on the drill collar of Fig. 2;
Fig. 6 is a timing chart showing signal timing as an
aid in explanation of the sequence of operations where signals
are transmitted upwardly and downwardly;
Figs. 7 and 8 show different tornado charts
representing resistive and conductive fluid invasion;
Fig. 9 shows a chart of resistivity as a function of
depth for the medium and deep spacing coils on the drill collar;
Figs. 10 and 11 show similar comparable resistivity
curves for different angles of dip; and
Fig. 12 is a profile of amplitude and phase on
opposite sides of the well borehole showing amplitude on the
left and phase angle on the right.
DETAILED DESCRIPIION OF THE PREFERRED EMBODIMENT
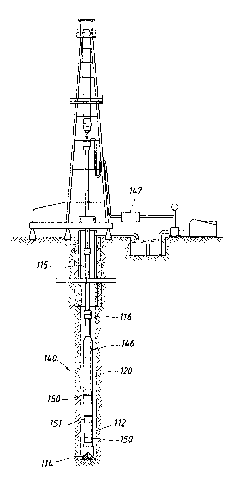
Referring initially to Fig. 1, a MWD formation
property and directional measuring system is shown
schematically deployed in a drilling well, the numeral 140
refers generally to the system. The drill pipe 11 5 supports the
system 1 40 in a borehole 11 6. The system 1 40 generally
--6--
comprises a MWD mud pulse telemetry transmitter 146, a
directional measurement package 120 and an earth formation
properties measuring package employing concepts of the
present invention and comprising the transmitter coils 1~0 and
receiver coil assembly 151 which are deployed in the drill
collars 112 just above the rotary drilling bit 114.
Measurements made by the directional package 120 and the
earth formation properties measuring package are telemetered
by the MWD telemetry transmitter 146 to the surface where
they are received by a MWD mud pulse telemetry receiver
147.
The configuration of the logging tool preferably
installed immediately above the drill bit and the incorporated
mud pulse data telemetry system for transmission to the
surface processing computer is shown in Fig. 2. This simplified
view of the drill collar is shown with the electromagnetic
sensors mounted around the tubular metal drill collar or
mandrel, and the sensors connect with electronic circuits to
generate and transmit to, and to measure received signals from
the surrounding rock formations. The coil shaped sensors
include shielded axial coils that are associated with 2 MHz
electromagnetic waves passed through the rock, and also has
toroidal coils containing permeable magnetic material that are
associated with 2 KHz currents formed in the adjacent
formations. All coils are disposed in a symmetrical array
around a common measure point 13 corresponding to the
position along the tool axis of maximum response to formation
properties. A common measure point is useful because the data
from any given portion of the tested formation at different
radial depths should be acquired simultaneously (assuming
invasion is occurring rapidly) to allow for most accurate
interpretation .
Signals are communicated between sensors and
electronic circuits (Figs. 3 and 4) by means of shielded cables to
prevent cross talk of signals from transmitter sensors into
receiver circuits and vice versa. Cross talk can result in
~7~
measurement errors that are very difficult to correct. The
shielded cables pass through longitudinal grooves in the
mandrel immediately underneath the sensors. Each sensor is
formed by loops on a bobbin, and the bobbin is sealed (e.g., by
epoxy resin potting) against ingress of corrosive borehole
fluids, and the cables and electronics are also sealed. The
entire assembly may conveniently be demounted for repair
and replacement of any defective sensor. It will be readily
appreciated that the coils and cables are exposed to severe
environmental conditions during drilling and that the operating
lifetime of component parts is not unlimited, necessitating easy
repair.
Attention is directed to Fig. 2 of the drawings
where the numeral 10 identifies the formation properties MWD
tool. It is structurally mounted on the drill collar 12 which is
preferably installed in the drill stem at the very lower end and
is preferably immediately above the drill bit. This positions
the equipment of this disclosure as close as possible to the drill
bit so that data can be obtained immediately upon penetration
of permeable formations. It is particularly of interest to
measure the rate of fluid invasion of the drilling fluid into the
formations. More particularly, drilling proceeds as the drill bit
is advanced on rotation of the drill stem and is accompanied by
continuous flow of drilling fluid through the drilling collar 12.
It is provided with a central axial passage to deliver the
drilling fluid to the drill bit. The region around the drill bit is
flushed by the continuous flow, and the drill fluid is returned
to the surface in the annular space on the exterior of the drill
collar 11. Customarily, the drilling fluid is formed of weight
material added to water, and the weight material makes up a
mud cake which is deposited against the side wall of the well
borehole. The mud cake is more dense than the drilling fluid
after loss of water (filtrate) which is forced into the formation
by any pressure differential between borehole and formation
pressure that is placed on the drilling fluid. If the well
borehole penetrates a highly permeable formation, a
--8--
substantial fluid portion of the drilling fluid of the well
borehole can pass into the formation and is labelled the
invasive filtrate. Generally, the filtrate comprises water having
soluble salts and other materials in it. Also, the filtrate can be
relatively conductive because the concentration of soluble salts
in the filtrate can be relatively high.
Drilling fluid thus serves the purpose of removing
the cuttings from the drill bit, and it also provides a mechanism
whereby formation pressure is kept under control. Ideally, the
pressure on the drilling fluid is equal to and preferably slightly
greater than the ambient pressure prevailing in the formation.
This prevents mixing of oil and gas materials into the drilling
fluid which might otherwise thin (or cut) the drilling fluid,
reducing its density, to thereby engender the risk of a blow
out.
A mud pulse mechanism is controlled by the
electronics, and forms a pressure pulse or surge which is
conveyed up the column of standing mud in the drill stem so
that a mud pressure pulse can be detected at the surface.
Fig. 2 shows a set of coils which are located on a
drill collar. The CWR (compensated wave resistivity) coils are
wound axially around the drill collar (as a support) so that the
coils of Fig. 2 form flux lines axially of the drill collar or
coaxially with the borehole. The CWR operates at
approximately 2 MHz. The flux is therefore axial. The CWR
coils will be collectively discussed with regard to Fig. 3
operation. By contrast, the HTR (high resolution toroidal
resistivity) coils of Fig. 2 are wound on magnetically permeable
toroidal forms (not shown) positioned in external grooves. The
toroidal cores can be circular in cross section or can be
approximately rectangular in cross section with the coil wound
around the core. This will be discussed further in regard to Fig.
4. The HTR coils are located symmetrically above and below a
central measuring point located at the plane 13. The HTR
operates in the frequency range of a few kilohertz. ~everal
coils are deployed symmetrically above and below the measure
- 9 -
point 13. The measure point 13 thus defines the center of the
coils deployed. The system incorporates six coils deployed
above the measure point 13 and six coils deployed below. The
two coil sets (CWR and HTR) are arranged symmetrically with
regard to the measure point 13. Proceeding from the measure
point in both directions, the numeral 14 identifies the low
frequency HTR upper receiver coil. In similar fashion, the
numeral 24 identifies the corresponding lower HTR receiver
coil symmetrically arranged. In addition there is a high
frequency CWR upper receiver coil 15 and a similar lower CWR
receiver coil 25. Further a low frequency HTR shallow upper
transmitter 16 is included. A lower similar HTR transmitter
coil 26 is included in the structure. The numerals 17 and 27
identify the CWR medium depth upper and lower transmitter
coils. A low frequency HTR deep transmitter coil is likewise
provided at 18 above the measure point of the tool and the
corresponding lower deep HTR transmitter coil 28 is shown.
The HTR coils 18 and 28 are involved in other measurements
and are not shown in Fig. 4; their relative position enables a
deep measurement (deeper than that obtained from the coils
16 and 26) should it be desired. The numerals 19 and 29
identify the most remote coils which are the upper and lower
deep CWR transmitter coils. Corresponding numbers will be
assigned to corresponding coils shown in Figs. 3 and 4 to aid in
the explanation.
For specific identification purposes, the terms upper
and lower refer to the location of the respective coils either
above or below the measure point 13. In addition to that, the
term shallow refers to a system which investigates at shallow
radial depths about the well borehole. There are three radial
depths of investigation which are generally identified as
shallow, medium or some times intermediate, and also deep.
These radial depths of investigation in one model of the
equipment extend about 60 inches from the axis of the
equipment. In this particular example, the shallow radial
investigation depth might be in the range of about 15 inches
--10--
from the borehole axis while the next depth or the
intermediate radial depth is perhaps 36 inches while the
deepest radial penetration is 60 inches. Note that these
relative distances refer to a location radially out from and
concentric about the axis of the equipment in the well borehole
assuming that the equipment of Fig. 2 is approximately
centered in the well borehole. This is normally the case and
normally prevails in most drilling circumstances. Moreover,
-this also assumes that the well - borehole is concentric and is
sufficiently defined by the formations. It is possible that an
unconsolidated sand will slough off and destroy the cylindrical
shape of the borehole. However, the foregoing depths of
investigation are typical for the uncased well borehole. The
depth of investigation can be varied with change of scale
factors and positioning of the coils in Fig. 1, change of
frequency, change of power and implementation of other
changes in the system.
HIGH F~REQUENCY CIRCUIT
Going now to Fig. 3 of the drawings, the high
frequency CWR system for performing the medium and deep
radial investigations is shown and is identified generally by the
numeral 20. The system 20 utilizes the coils which are marked
in Fig. 3 of the drawings. At megahertz frequencies such as
two or three MHz, the steel material of the drill collar does not
act as a magnetic material. The installed coils are wound
around a ring of sheet material which is a good electrical
conductor. The ring and loops of wire are recessed in a circular
groove for protection from abrasion during use. The several
transmitters utilize a crystal controlled waveform generator.
There is a crystal operative at 32 MHz indicated by the
numeral 21. It provides a stabilized frequency signal for a
waveform generator 22. In turn that is connected by means of
a relay 23 to provide a high frequency signal. Frequencies will
be discussed momentarily.
The transmitter system utilizes identical power
--11--
amplifiers 41 and 42 which are output through ganged contacts
in an output relay 40. The relays 23 and 40 operate together
to control routing of the output signal. They control application
of the transmitter drive signal to one of the four coils shown in
Fig. 3 of the drawings. More particularly, the system uses in
the preferred embodiment a 32 MHz stabilized crystal
oscillator. That signal is divided by a divider circuit in
waveform generator 22 and is reduced to 2.000 MHz. That
frequency is applied to the respective selected transmitter coil.
Control of this is accomplished through the relays 23 and 40 as
mentioned. The transmitted signal is received at the receiver
coils 15 and 25. Fig. 3 shows these coils connected with
identical low noise amplifiers at 44 and 45. These amplifiers
form outputs provided to duplicate mixers 46 and 47. The
mixers 46 and 47 are provided with an input signal at 2.001
MHz from the waveform generator 22. The difference output
of the mixers 46 and 47 has a frequency of 1,000 Hz and
preserves the amplitude and phase of the input signals. The
two mixers connect with duplicate band pass filters 48 and 49.
In turn, the filters 48 and 49 are connected to duplicate zero-
crossing detectors or comparators 50 and 51 forming outputs at
A and B. The comparators 50 and 51 form outputs furnished to
similar divider circuits 52 and 53. The two divider circuits
form outputs which are labelled C and D and which are
provided as inputs to an exclusive OR circuit 61 which forms an
output at E indicative of relative phase of the input signals.
This signal in turn is applied as an input to an XOR gate 64
which is used to control up/down counting in a counter 66.
The signals at A, B, C, D, and E are detailed in Fig. 6 in
discussion of the relative timing of these waveforms. As
observed in Fig. 3, the two receiver coils 15 ,and 25 connect
with duplicate processing channels which are identical up to
the XOR gate 61. The dual channels additionally incorporate
phase sensitive detectors at 54 and 55. The two detectors 54
and 55 form output signals to appropriate low pass filter
circuits 56 and 57. In turn, these low pass filters connect to
--12--
analog-to-digital converter circuits 58 and 59. In turn, the A/D
converters 58 and 59 connect with an output data buffer 60.
The buffer 60 contains an output data stream which is
indicative of relative amplitude of the input signals as will be
described .
The waveform generator 22 forms clock signals and
control signals which dictate certain switching sequences. The
waveform generator 22 thus provides an output signal on the
conductor 65 which switches between transmission of the 2
MHz signal into the formation from either the upper ( l 7 and
19) or the lower (27 and 29) transmitters. The signal on the
conductor 65 provides this control signal for the relay 40 to
control transmitter switching. In addition, the conductor 65 is
one of the two inputs for the XOR gate 64 and the data buffer
60. The gate 64 is provided with that input control signal and
also the signal at E output by the XOR gate 61 which, it will be
recalled, is indicative of the phase of input signals C and D with
respect to each other. The output of the XOR gate 64 is
therefore the variable duty-cycle control signal which
represents the phase shift of signals at the receiver coils 15
and 25, and is input to an up/down counter 66. The counter 66
has several inputs. A conductor 67 is input from waveform
generator 22 to provide the necessary trigger which controls
counting by providing a latch and a reset signal and is also
output to external data transmission circuits (not shown). In
addition to that, the waveform generator 22 forms signal at a
clock frequency, typically 16 MHz to the counter 66.
The manner in which resistivity data is used
involves explanation of the operation of the high frequency
system shown in Fig. 3 of the drawings. This is more readily
understood by going now to Fig. 6 of the drawings. Briefly, Fig.
6 of the drawings shows the waveforms (indicated by the
letters A through E) origin~ting in the lower portion of Fig. 3 of
the drawings. The solid line representation shows the signals
from the respective signal sources which are labelled by the
letters A through E without formation phase shift. The signal
--13--
at A shows possible phase shift in the dotted line as a result of
transit time between the two receiver coils, i.e. a phase shift
due to the formation resistivity. The left side of Fig. 6 shows
the waveforms at the circuit at signal test points A through E
when transmitting upwardly while the right side shows the
same signals when transmitting downwardly. The data output
of the counter 66 is shown at the bottom of Fig. 6 for
transmission both upwardly and downwardly.
The values shown in Fig. 6 and marked on the
curves include the phase shift error e which arises from the
coils and electronic components or from tool eccentering in the
well borehole. The symbol d> is the phase shift in earth
formations between the two receivers. It is desirable to
measure ~ accurately and reduce e to the smallest value
possible. As shown at the data output in the lower part of Fig.
6, values are provided which cancel the phase shift error e as
will be described.
In Fig. 6, the solid lines show the operation of the
system without formation phase shift. The dashed lines show
the system operation with a formation phase shift ~. There is a
sequence of measurements including forming a transmission
upwardly in the borehole followed by an equal time period of
transmission downwardly.
A ratio quantity referred to as the duty cycle a/d in
Fig. 6 is measured during each of these time periods. The
quantity a represents the time period of upward incrementing
in the counter 66 of the 16 MHz clock pulses, while the
quantity b represents the time period o downward
decrementing in the counter 66 of the 16 MHz clock pulses. At
the end of the upward transmission period, the counter 66
contains an accumulated count representative of the duty cycle
a/b, which is in turn representative of the apparent phase shift
upwardly through the formation plus the error e.
The downward transmission period is now
performed without resetting the counter 66. However, the gate
64 is conditioned by control line 65 to reverse the order of
incrementing and decrementing of the counter 66. This
conditioning is necessary because of the change in algebraic
sign of ~ with upward and downward transmission caused by
wave propagation through the formation. Thus the total
accumulated count in the counter 66 at the end of this period is
representative of twice the formation phase ~ with the error e
cancelled. This entire sequence is repeated while exciting the
deep transmitters 19 and 29, and the medium transmitters 17
and 27 as determined by a control signal on the line 68
provided by the waveform generator 22.
Referring again to Fig. 3, the CWR attenuation
measurement is performed by measuring the amplitudes of the
two received signals in the detectors 54 and 55, low pass filters
56 and 57, and A/D converters 58 and 59. The signals are
labelled F and G in Fig. 6. The low pass filters 56 and 57
remove all high frequency components from the signals F and
G, leaving a direct current signal for~ the A/D converters 58 and
59 to convert. The A/D converters 58 and 59 both operate
during upward and downward transmission times. Means are
provided in the buffer circuitry 60 to calculate the ratio of the
amplitudes for both upward and down transmissions and to
then calculate the product of these ratios according to the
following relationship:
A2 = ADI AU2
AD2 AU1
w here A= formation attenuation,
U= upward transmission,
D= downward transmission,
1 = receiver channel 1, and
2= receiver channel 2.
When the numerical value of A2 is analyzed in data processing,
1/2 logarithm (A2 ) is plotted on the log to provide A, or the
attenuation .
In the present invention novel methods are
employed to provide precise phase shift and attenuation
measurements corrected for any systematic errors in the
sensors, cables or electronic circuits. The data transfer rate of
available telemetry systems used in MWD measurements is
likely limited and it is imperative to minimi7e the band width
required, particularly with multiple depths of investigation
which create multiple channels of data. One purpose of the
measurements is to determine the phase shift between signals
arriving at the two receiver sensors 15 and 25 and the relative
amplitudes thereof, corresponding to the phase shift and
attenuation of an electromagnetic wave traversing a distance in
the rock formation essentially equal to the spacing between the
receiver sensors. In view of Maxwell's equations for
electromagnetic waves, and including physical details of the
sensor coils placed on the metal mandrel within a borehole for
a wide range of formation resistivities, Figs. 5 and 5A of the
drawings show the relation between measured data and rock
resistivity. It will be noted that, at high resistivity, the phase
shift falls to fractional degree levels and attenuations to a few
decibels. If accurate determinations of resistivity are required,
then the resolution must be on the order of about 0.001 degree
and one tenth of a decibel. Due to the slope of the curve at the
left hand side of Fig. 5, a very small error in phase
measurement results in a large error in resistivity
determination; the need for accuracy becomes evident.
Fortunately, the attenuation measurement is only required in
low-resistivity formations so a less stringent specification is
normally needed.
The preferred solution derives from the
compensation method wherein two transmitters are
sequentially energized at equal distances each side of the two
central receiver sensors 15 and 25. The measured quantities
determined from each transmitter (phase shift and the
logarithm of attenuation) are arithmetically averaged over
time. The dual direction transmission system with two
receivers provides quality cancellation of perturbations due to
the presence of borehole fluids around the sensors and
--16--
variations in borehole diameter within a distance equal to the
spacing between receiver sensors. There is the very beneficial
corollary effect of an instantaneous cancellation of all errors
within the measurement system. The arithmetic averaging
performs the function of matching the two parallel receiver
systems so that errors due to component variations or resulting
from temperature drift are reduced to the trivial level of
changes occurring in the time between sequential transmitter
cycles. Since the system cycle is short, this error source can be
as short as a small fraction of a second, and errors become
insignificant.
In summary, the high frequency receiver has a pair
of receiver sensors 15 and 25 which are fed to the exclusive OR
gate 6 l and the up/down counter circuits 66. These circuits
perform the function of generating a rectangular wave whose
duty cycle varies from 0- l 00% in proportion as the receiver
input signals relative phase shift varies from - l 80~ to + l 800 .
This rectangular wave controls the up or down counting of the
counter 66 receiving the high frequency clock ( l 6 MHz) pulse
train, with the result that a running average or integral of the
mean duty cycle or phase shift is accumulated in the counter
66. As shown in the sequence of signals in Fig. 6, sequential
periods of signal averaging with the upper transmitter and
lower transmitter energized (and synchronous switching of the
polarity of the rectangular wave) perform the mentioned
additional function of "borehole compensation." After a suitable
period of count accumulation to attain an optimum signal-to-
noise ratio due to signal averaging, the total count
(representing phase shift) may be read out from the counter 66
and transmitted to the surface for conversion into an
equivalent resistivity. The phase shift measurement is the most
accurate indication of formation resistivity and it is utilized
with the deep spaced pair (upper and lower) of transmitter
coils 19 and 29 as well as with a medium spaced pair of
transmitter coils 17 and 27 to provide resistivity logs with
deep and medium radial penetration, respectively.
SHALLOW MEASUREMENI
Fig. 4 shows a low frequency HTR system which is
indicated generally by the numeral 70. This system
incorporates the transmitter and receiver coils 14, 16 and 24,
26. It is a system which is driven by an oscillator 71. The 2
KHz signal from the oscillator 71 is provided through a power
amplifier 72 and then is delivered to the upper and lower
transmitter coils 16 and 26. Recall that these coils are
illustrated in Fig. 2 with respect to the measure point on the
mandrel which supports them. The two coils are deployed at
selected distances from the receiver coils 14 and 24. The
transmission system also includes a load resistor 73. When the
transmission occurs, a voltage signal indicative of the current
transmitted into the borehole and formation is developed
across the load resistor 73 and is coupled through a comparator
74 operating as a zero crossing detector.
The system further includes a monitor electrode 75
on the mandrel. This electrode provides an input to an
amplifier 76. The output of the amplifier 76 serves via switch
77 as an input to a phase sensitive detector 81. The multiplex
switch 77 is operated by a signal on the conductor 78 from a
switch control source which enables switching so that the
system forms an output which is either the current flow in the
receiver coils 14 and 24 or alternately, the voltage output from
the monitor electrode 75. Also, there is a calibration terminal
as well as a ground input terminal on the multiplex switch 77.
The two coils 14 and 24 are jointly connected to an
input transimpedance amplifier 80. The amplifier 80 is
equipped with a feedback resistor Rf defining an output
voltage related to the current signals in the two coils. It will be
observed that the coils are connected with polarity such that
the current signals are subtractive. The amplified signals are
input to the switch 77 and, when switched to the current
sensing mode, the switch 77 provides output from the coils to
--18--
the phase sensitive detector 81. The phase sensitive detector
8 l is also provided with the phase reference signal from the
zero crossing detector 74. The in phase signals are detected by
detector 8 l, and then delivered to a low pass filter 82 which
provides a DC output to a voltage controlled oscillator (VCO) 83.
The VCO connects with a counter 84 which adds pulses. The
counter 84 provides an output to a shift register 85. By means
of a controlled clock signal input to the shift register 85, the
total stored in the shift register 85 is periodically transferred
out. By timing the reset of the shift register 85 the low
frequency shallow resistivity measurement system of Fig. 4
provides a digital number periodically which is indicative of
formation current. This current is inversely proportional to the
formation resistivity. When the switch 77 selects the output of
the amplifier 76, a digital number indicative of the formation
voltage at the measure point 13 induced by the transmitters 16
and 26 is obtained. The current and voltage measurements are
subsequently combined to determine formation resistivity. It
will be recalled that the spacing of the transmitter coils l 6 and
26 of Figs. 2 and 4 is close to the receiver coils 14 and 24. This
limits the depth of investigation to relatively shallow radial
values .
Returning now to Fig. 2 of the drawings, it will be
seen that the low frequency coils are symmetrically arranged
around the measure point l 3. This alignment assists in
enabling measurement in a region which is close to the drill
stem, and which is immediately above the drill bit. This
deployment of coils in near proximity to the drill bit assists
measurably in obtaining dynamic measurements of the
formations immediately after the drill bit has penetrated into a
formation. This enables the system to provide measurements
of the formation resistivity before drilling fluid filtrate flows
out of the well borehole into the permeable formation and
modifies formation resistivity. As mentioned earlier, the HTR
measurement is relatively shallow using closely positioned
toroidal coils 16 and 26. If desired, a slightly deeper
--19--
measurement can be obtained by using coils 18 and 28 as an
alternative .
DYNAMIC FLUID INVASION IS MEASURED
The three different depths of investigation of the
CWR and HTR coil system enable measurements from a single
formation to be obtained and in particular enables this set of
data to be obtained before fluid invasion has occurred at all
depths. There is, of course, a time lag in the penetration of the
filtrate into the formation. Assuming that the drill bit is first
drilling in an impermeable formation and then punches
through into a permeable sand having petroleum products in it,
the fluid pressure acting on the drilling fluid will force a
portion of the filtrate into the formation. The rate of
penetration is dependent on a number of factors including the
pressure differential between the formation and the drilling
fluid, the permeability of the rock, the viscosity of the drilling
fluid, and many other factors. Ordinarily, the drilling fluid
filtrate leaches into the permeable rock rather slowly. The
present invention enables measurements to be taken from that
formation indicative of resistivity prior to invasion. It also
enables measurements to be obtained during invasion. So to
speak, the invasive fluids which practically always have a
different resistivity than the connate fluids will provide
resistivity measurements which are uninvaded, partially
invaded and completely invaded. This enables more
information to be determined regarding the formation and
further assists in well completion procedures which are
dependent on the formation resistivity ideally without
nvaslon.
A shallow depth of investigation is provided by the
HTR 2 KHz measurement using the toroidal coils 16 and 26.
The spacing of the CWR transmitter sensors 129, 29, 17, and 27
is selected so that an optimum combination of spatial responses
is obtained, allowing an interpretive method shown in Fig. 7
where the three measurements are combined in a crossplot to
.3.
--20--
perform graphically a solution of an abrupt boundary model of
invasion. Values of the resistivity for the undisturbed rock Rt,
the invaded rock Rxo, and the diameter of invasion di may be
inferred from the phase shift of the deep and medium CWR
wave propagation sensors and the resistivity from the shallow
HTR toroidal sensors. While Fig. 7 may be used as a visual aid
in understanding the method, typically the computation of the
answers will be performed by an algorithm that takes a set of
data representing the vertices of all the curves in Fig. 7
(themselves computed using a model of the tool spatial
responses) and interpolates any value of input data from the
logging tool on a two dimensional plane to find the interpolated
answer. There are several well known methods, such as
defining polynomial equations to describe each curve and
making successive approximations along orthogonal curves to
find an answer within a predefined error margin. Use of
readily available digital computers allows the almost
immediate display of the answers while logging and drilling is
proceeding .
The solution set of responses in Fig. 7 is only one of
a wide range of precomputed tool responses that may be called
upon depending on the resistivity of the drilling mud filtrate
(which is normally known from independent measurements)
and is particular to the case where mud filtrate has lower
resistivity than the fluids in the formation (the range of which
is approximated from other geological data). Fig. 8 shows how
the invasion data may be found when there is invasion of
relatively more resistive (opposed to more conductive)
borehole fluids. In this case, the method of Fig. 7 will not
provide a useful answer, and a different set of log data must be
used. Phase shift data and attenuation data from the medium
CWR measurement are combined with the HTR toroid
resistivity. In this special case of resistive invasion, shown in
Fig. 12, the depth of investigation of the deep and medium
phase measurements, indicated by the shaded contours varies
very similarly with increasing diameter of invasion. The depth
3 ~ ~
--21--
of investigation of the corresponding attenuation
measurements are much less affected. Thus, within the
resistive invaded zone, the attenuation measurements have
disparate depth of investigation and may be used to resolve
invasion diameter. This is demonstrated in the computer
modeling results shown in Fig . l 2, where the attenuation
measurement zones (shown on the left) are compared to the
phase measurement zones (shown on the right) in a cross-
sectional view of the tool in a borehole with an invasion zone of
60 inches diameter.
In the case of both Figs. 7 and 8, it may be seen
that the present configuration of sensors is able to accurately
respond to invasion diameter from l 8 to 60 inches,
corresponding to an invasion depth of 5 to 26 inches beyond
the borehole wall for a borehole of typical size. This
corresponds to the range of interest in logging permeable
~eservoir rocks during the drilling operation.
With respect to the ability to resolve thin laminar
beds oriented normally to the borehole axis, an example is
shown in Fig. 9 of the computed response to an artificial
formation of various bed thicknesses and resistivities. The deep
and medium logs (derived from phase data) are able to resolve
almost all the bed boundaries and to overlay well on center
bed values. Any separation between the curves may be
misinterpreted as invasion and is to be avoided. The
departures from true center bed resistivity are due to the
influence of shoulder beds, but the errors are not significant.
When bed boundaries are not normal to the
borehole axis, as is the case with dipping beds and/or a
deviated borehole, then various undesirable phenomena
become apparent, as shown in Fig. lO. Electromagnetic waves
are reflected at any abrupt boundary between propagating
media of differing resistivity. In general, as the Fresnel law
teaches in analysis of light reflection at a reflective surface, the
amount of reflection increases as the angle of incidence
becomes more oblique. Any reflected wave has a velocity
--22--
component in the opposite direction to the incident wave, and
will contribute a component of received signal having a
negative apparent phase shift. As seen in Fig. 10 at large dip
angles of 60~, the logging tool indicates large spikes in apparent
resistivity at some bed boundaries resulting from a lower
apparent phase shift, which could be misinterpreted as thin
resistive beds. Since it is not possible to separate the incident
and reflected components of the wave with existing sensor
designs, there remains the need to provide a corrective
procedure applied to the measured data.
Often, other data sources will indicate a measure of
dip. While a high dip angle at a bed boundary introduces an
anomalous spike in the log, it also alters the spatial response of
the tool because the reflected wave cancels a portion of the
signal originating in the shoulder beds. This results in an
increase in the thin bed resolution of the tool, which is
impacted by shoulder contributions. Thus, a digital filtering
scheme responsive to the dip angle (known from other well
logs in the vicinity) is able to modify the effective resolution of
the log data to remove the offending spikes while maintaining
a nearly constant apparent thin bed response for the tool. An
example is shown in Fig. 11, where the same data from Fig. 10
is filtered by an averaging process over a depth interval that
varies with dip angle. If N is the number of filter stages, ~ is
the dip angle, and W is a constant related to the spatial
response of the sensor, then equation 1 applies:
N=2modW( 1 1)+1
cos~ (1)
This adjusts the filter length to give a constant true
depth resolution. N is a positive integer. For a unity gain filter
with a triangular distribution of the coefficient weights, the
values are given by equation 2:
~ r;
--23--
aO= (N - l)/(N+l)
al, a l= (N - 3)/(N+l)
a2, a 2= (N - 5)/(N+l)
.
a~L, aN-l, ~ ( 2 )
The filtering process is a convolution of the discrete
sampled phase data at fixed depth intervals (for example, six
inches) with the filter, thus equation 3:
+(N- 1 )
''Pd = ~ anq)d+n
(N-l)
2 (3)
The summation ~d is the phase at depth d. Again,
digital computers can carry out the filtering to be performed in
real time. There are other filtering methods that may be
employed that are well known in the art, but it is important
that they be made adaptive to the dip angle as indicated above
to normalize the formation data.
In s~lmm~ry, the log response of this apparatus in
combination with data processing as described provides high
quality quantitative information in a wide range of conditions
similar to the best wireline logging equipment. The preferred
frequencies in this measuring system are about 2000 hertz for
the audio frequency. This can vary between upper and lower
audio limits, say the range of 800 to 8000 hertz. The radio
frequency range can vary also, say in the range of 0.8 to 5.0
megahertz. The best frequencies seem to be 2000 hertz and
2.000 megahertz, respectively. While the foregoing is directed
to the preferred embodiment, the scope of the present
disclosure is determined by the claims which follow.