Note: Descriptions are shown in the official language in which they were submitted.
~~~~~~30
20365-3273
MQNITQIZIfdG METHOD FAR A 'I'ECHhIICAI, PIt~CESS
BACKG1~OUND OF TI-IE INVENTION
The present invention relates to a monitoring method for a technical
process and the automation system monitoring .and controlling the
technical process. The automation system transmits messages to an
observation system, which is higher ranking than the automation system:
From this observation system, messages are evaluated, and the results of the
evaluation are displayed by a display unit which preferably includes graphics
capability. The present invention also relates to an observation system for
implementing the method.
Normally, such monitoring methods entail displaying a graphic
diagram of the installation or of the process on a video screen. In
particular,
the observation system also handles the displaying and documenting of
messages: When a fault such as a wire breakage in a peripheral adapter is
recognized in the automation system, the fault is usually graphically
displayed
by showing its consequences. That is, the part of the system where the fault
CA 02092880 2000-05-30
~ ~ 20365-3273
has occurred is marked by a predetermined color or indicated by
a flashing on the screen. In addition, a message text
indicator code is normally output on the video screen. This
message text is also printed out on a printer as an error list.
It is also known to graphically display the side in
the circuit diagram in which the electrical error has occurred
on the video screen. However, no kind of comprehensive help
exists for locating and isolating the fault. Often, it is not
apparent from the circuit diagram at which geographical
location of the automation system the fault has occurred.
Also, there is no graphic support with respect to localizing
the error within the circuit diagram.
SUMMARY OF THE INVENTION
The present invention supports the user of the
automation system in his or her efforts to troubleshoot and
localize the fault. In particular, when the error evaluation
is complete, the user should know exactly at or in which module
and at which location the fault has occurred.
According to the present invention, there is provided
a monitoring method for an automation system and a technical
process: whereby an automation system is provided which
monitors and controls the technical process and which is
arranged in control cabinets (3) containing subracks (4) with
modules (5), where the automation system transmits messages
about faults in the technical process to an observation system
(1) which is higher-ranking than the automation system, with
these messages being evaluated by the observation system and
being graphically displayed by means of a display unit (10),
whereby the important planning and design data of the
2
CA 02092880 2000-05-30
~ ' 20365-3273
automation system is accessible to the observation system (1),
whereby, upon the detection of a fault in the technical
process, the fault location in terms of geography and circuit
engineering can be displayed in general or detailed view,
characterized in that faults in the automation system are also
detected and displayed by the observation system (1), the
respective fault location can be displayed in such a way that
first of all the design of the control cabinet (3) is
displayed, with the defective module (5') located therein being
emphasized, the subrack (4) is then displayed with its modules
(5) among which the defective module (5') is located, which is
in turn emphasized, and the circuit diagram of this defective
module (5') is then displayed with the addition, if necessary,
of the peripheral circuit, with the circuit in which the fault
has occurred being emphasized.
According to another aspect of the present invention,
there is provided an observation system, in particular a
control and observation system, for monitoring an automation
system and a technical process, having a processor (9) which
evaluates messages transmitted by an automation system which
controls and monitors the technical process and which is
arranged in control cabinets (3) containing subtracks (4) with
modules (5), having a display device (10) with graphics
capabilities, with which device the evaluation results can be
graphically displayed, and having a planning and design data
memory (13), preferably a mass memory (13), in which the
important, preferably all the planning and design a data of the
automation system is stored, and which, is connected to the
processor (9) in an accessible manner, whereby, upon the
detection of a fault in the technical process, the fault
location in terms of geography and circuit engineering can be
displayed in a general or detailed view, characterized in that
faults in the automation system can also be detected and
2a
CA 02092880 2000-05-30
. ' 20365-3273
displayed by the observation system (1), the respective fault
location can be displayed in such a way that first of all the
design of the control cabinet (3) can be displayed, whereby the
defective module (5') located therein can be emphasized, the
subrack (4) can then be displayed with its modules (5) among
which the defective module (5') is located, which in turn can
be emphasized, and the circuit diagram of this defective module
(5') can then be displayed with the addition, if necessary, of
the peripheral circuit, whereby the circuit in which the fault
has occurred can be emphasized.
A monitoring method according to the present
invention:
- allows the important planning and design data
(preferably the entire planning and design data of
the automation system) to be accessible from the
observation system; and
- allows the location of a fault such as a defective
module or a wire breakage in the peripheral circuit
elements to be displayed in a type of
2b
hierarchical progression when the fault is detected in the automation
system.
When the monitoring method includes several process displays, it is
advantageous to be able to start the hierarchically graduated display of a
fault location from each process display. In this case, one does not have to
refer back to the entire display of the process or of the installation when a
fault has occurred somewhere in the process or in the system.
When the location of a fault is depicted in a graphics display, the user
is able to detect the fault location very easily and quickly.
When the display steps include displays of the geographical location as
well as displays of the circuit location of the fault, the user receives
information about the location where the fault has occurred, as well as
information about the type of fault that has occurred.
When the automation system is arranged in control cabinets, whereby
each control cabinet has at least one subrack with electronic modules, it is
advantageous:
- for the design of the control cabinet to be initially displayed when the
fault location is displayed, whereby the module in which the fault has
occurred is specially set off or emphasized in some manner;
3
- to display the subrack including the module where the fault occurred,
whereby the module is emphasized in some manner; and
- in some instances, to display the circuit diagram of the module
including the peripheral circuit elements in which the fault has
S occurred, whereby the circuit in which the fault occurred is
emphasized.
BRIEF DESCRIPTION OF TI-IE DRA'VVTNGS
Further advantages and details of the present invention will become
apparent in view of the following description of an exemplified embodiment
in conjunction with the attached drawings.
FIG l illustrates a basic representation of an automation system
according to an embodiment of the present irxvention.
FIG 2 illustrates a basic representation of an operating and
observation system according to an embodiment of the present invention.
FIG 3 illustrates an exemplary representation of an installation.
FIG 4 illustrates an exemplary depiction of a control loop.
FIG 5 illustrates a control cabinet.
4
FIG 6 illustrates a subrack having modules.
FIG 7 illustrates a section of the circuit diagram of the peripheral
circuit elements of one module.
FIG 8 illustrates a control cabinet.
FIG 9 illustrates a section of the circuit diagram of the peripheral
circuit elements of one electric component.
DETAILED DESCRIPTION
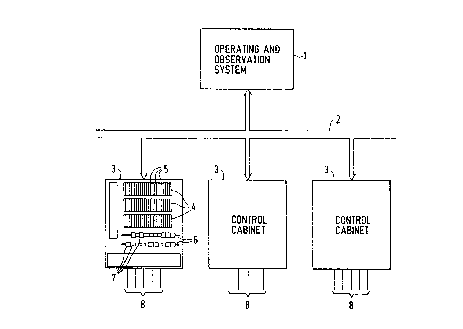
FIG 1 illustrates an automation system including an operating and
observation system 1 to which the other components of the automation
system are linked via a bus 2. The components are typically arranged in
control cabinets 3. Several subracks ~4 having modules 5 and several rows b
of electrical components 7 are situated in control cabinets 3. Only one of the
control cabinets 3 is depicted in detail in FIG 1. The other control cabinets
3
are only depicted schematically for the sake of clarity. Several lines 8 run
from the control cabinets 3 to the controlled process.
As illustrated in FIG 2, the aperating and observation system 1
includes a processor 9 which evaluates messages transmitted by the remainder
of the automation'system. A graphics monitor 10 and a terminal 11 are
linked to the pracessor 9. A mouse 12 is also linked to processor 9 via the
20365-3273
terminal 11. Furthermore, a data storage unit 13 is linked to the
processor 9. The entire planning and design data
pertaining to the automation system are stored in data storage unit 13.
Alternatively, only important planning and design data may be stored in data
S storage unit 13. The planning and design data include, among other things,
all of the circuit diagrams of the installation and the configuration plans of
all
the installation systems, such as the subrack 4 and the cabinets 3, together
with all identification data and parameters.
In the normal operation of the automation system, a graphic
representation of the installation, a graphic representation of a section of
the
installation, and a graphic representation of the process or a graphic
representation of part of the process are displayed on the monitor 10. The
image of the installation or of the process that is displayed is continually
updated on the basis of operator controls or messages transmitted by the
automation system to the operating and observation system 1.
FIG 3 illustrates a representation of the installation to be controlled,
as displayed on the monitor 10. A reactor 14 is loaded by supply tanks 15, 16
and 17 via pumps 15', 16' and 1T, respectively. The pumps 15', 16' and 1T
are regulated by flow controllers 15", 16" and 17", respectively. In the
reactor
14, the reactor mixture 18 is mixed by an agitator 20 that is driven by a
motor
19. The reactor mixture 113 flows off through valve 14' via line 21. Valve 14'
is controlled by discharge controller 14". Furthermore, the graphic display
6 ,
according to FIG 3 also depicts a temperature controller 22" which regulates
the supply of hot water to heating coils 22 by way of a valve 22' so that a
predetermined temperature range is adhered to in the reactor mixture 18. A
level controller 23 is also illustrated in the display according to FIG 3.
This
S level controller 23 acts as a master controller to specify setpoint values
to the
flow controllers IS", 16" and 17" and to the discharge controller 14".
A representation according to FIG 3, which can be a complete
representation of the entire installation or also of only a partial section as
displayed on the monitor 10 of the control system l, is quite typical of
automated processes. A display as shown in FIG 4 is also quite common.
Here, for example, the time characteristic of the setpoint value w and the
actual value x of one of the control loops of the reactor 14 are depicted.
Furthermore, in accordance with FIG 4, the control-loop parameters are also
displayed on the video screen in a control room (or operating and
observation system 1 ).
If a control system fault were to occur in the monitored installation or
in the monitored process, then an appropriate message would be sent to the
operating and observation system 1. Arty fault in the automation system
would be considered as a control system fault, such as a wire breakage in one
of the lines 8. The message transmitted to the operating and observation
system 1 includes at least the following information:
- a code for the type of fault that has occurred;
7
- a code for the location of the fault; and
- the time of the fault.
The location of the fault can be given implicitly, for example, by
transmitting the address of the programmable cantroller as well as the
address of the module ~' in which the fault has occurred or by transmitting
Lhe identification of the electrical component T (for example, of an automatic
circuit breaker) in which the fault has occurred. Initially, the address or
the
identification relates only logically and not physically to the actual
location
(i,g,,L the module slot). The actual fault location cannot be determined until
the address or the identification is compared to the planning and design data.
The time that the fault occurred can either be determined by the operating
and observation system 1 or may be transmitted along with the other
information.
The fault is superimposed on the image that is displayed at the
moment immediately after it is reported. This occurs independently of
whether the image displayed at the moment shows the entire process, the
complete installation, or only parts of them, and is shown schematically for a
detected wire breakage in FIG 4.
When the user of the installation does not want to ignore the error '
message, but would like to precisely locate the error, he or she inputs an
appropriate command at terminal 11 to have a closer look at the
geographical and circuit location of the fault.
This input can be the "control-S" command, for example. When a
mouse 12 is available to the user, he or she can easily call up a view of the
fault. In this case, the user merely clicks with the mouse 12 on field 24,
which displays a special message. When the user calls up the fault display
function, the next thing that comes up is a display of the control cabinet 3
in
which the fault has occurred. This display is shown in FIG 5.
To display the fault on the monitor 10, the processor 9 retrieves the
planning and design data of the automation system from the data storage unit
13 for planning and design. On the basis of this planning and design data,
the processor 9 determines the control cabinet 3 in which the fault has
occurred, as well as its geometric structure. According to FIG 5, this
structure is displayed on the monitor 10 when the fault-display program is
called up. In addition; the number and possibly also the location of the
control cabinet 3 are indicated in the display field 25.
In the present case illustrated in FIG 5, it is assumed that the fault has
occurred in the peripheral circuit elements of the module 5' of the uppermost
subrack 4. This module 5' is, therefore, set off optically (i~g", it is
indicated
by a color marking, as shown in FIG 5, or by a flashing on the screen).
9
s~~~~~~
When the user of the installation would like to view the fault more
closely, he can again input a command, such as "control-N", or click with the
mouse 12 on the uppermost subrack 4. A display of this subrack ~l then
comes up, as illustrated in FIG 6. This representation is also determined by
S the processor 9 on the basis of the planning and design data.
According to FIG 6, the number of the control cabinet 3 and that of
the subrack 4 being displayed are now entered in the display field 2S on the
monitor 10. The subrack 4 is displayed, as shown in FIG S. Here, as well,
the modules S are again displayed, whereby the defective module S' is set off
optically. In this display, the geographic location of the fault, namely the
module S', is sufficiently localized. When the module S' itself is defective,
the
display according to FIG 6 is a final display. On the other hand, if there are
wire breakages, besides the geographic location, the circuit location of the
1S fault can also be reported to the user.
In case of a wire breakage, to additionally determine the circuit
location of the fault, the user clicks with the mouse 12 on module S' on the
monitor 10 and the display comes up as shown in FIG. 7, which depicts the
section of the circuit diagram in which the fault has occurred. The circuit
diagram was also determined by the processor 9 on the basis of the planning
and design data from the data storage unit 13 for planning and design. The
numbers of the control cabinet 3, the subrack 4, the module S', and the side
of the circuit diagram are indicated thereby in the display field 25. In the
same way, the circuit diagram of this side is shown on the monitor 1Ø
The location, this time the circuit location of the fault, is again set off
optically (i.e., it is indicated by outline 26 flashing on the screen). In
addition, a message about the type of fault can also be indicated on the
monitor 10.
To be able to display the fault, the geographic location of the fault,
and the circuit location of the fault, it does not suffice, of course, that
the
complete planning and design data are retrievable by a computer from the
control room 1 (or operating and observation system 1). The planning and
design data of the automation system must also be up-to-date, since otherwise
meaningless error messages would occur.
1S
Furthermore, the fault recognition in the automation system must
follow precisely to such an extent that each fault is able to be exactly
localized. Thus; it does not suffice to merely recognize a fault, but rather
at
least the fault code and the address or the identification of the component in
which the fault has occurred must be transmitted.
FIG 8 illustrates the display of the entire control cabinet 3 in which a
fault in the electrical component T was detected. When the electrical
component 7' itself cannot transmit any message to the aperating and
11
observation system 1, this must be done indirectly via a programmable
controller, which then relays this fault to the operating and observation
system 1. To this end, a signal which is released by the electrical component
T in case of a fault is used as an input signal for a programmable controller,
S whereby the programmable controller is programmed to respond to the
application of a fault signal by reporting this fault to the operating and
observation system 1.
This fault is also displayed on the monitor 10 after the planning and
design data are retrieved by the processor 9. The fault of the defective
electrical component T is optically set off in a manner similar to the
defective module 5' illustrated in FIG S, T'he geographic location of the
fault
is thus sufficiently localized. After clicking the mouse 12 on the ~defeetive
electrical component T the part of the circuit diagram of this electrical
component T in which the fault has occurred is again displayed on the
monitor 10 as illustrated in FIG 9. The fault is again optically highlighted,
for example, by a flashing outline 26.
The above-described exemplified embodiment only illustrates how
electrical faults are detected and displayed. When the planning and design
data also include the programs for the individual components of the
automation system, it is, of course, also possible to detect and display
program faults (such as when the limiting value of a software controller is
exceeded or when there is an overrun time-out at one operational level).
12
In conclusion, it is established that the fault localization and the fault
diagnosis are considerably facilitated from the control room (or operating and
observation system 1) by means of the above-described monitoring method.
To implement the method, besides a graphics monitor, which is usually
already present in control rooms, a data storage trait such as 'a hard disk is
also needed on which the complete, up-to-date planning and design data are
stored and from which this data can be retrieved on-line from the control
room computer. The present invention is capable of rapidly localizing the
fault location from the control room. Moreover, the present invention
eliminates the need for cumbersome searches in circuit books of paper.
Additionally, it is not merely possible for the monitoring method to be
carried out in the control room, but in principle also from every computer
which has a graphics monitor and access to the planning and design data. It
is conceivable, for example, to interconnect the control cabinets 3 via a
local
area network (LAN) and to provide for ways to interface a graphics
programming unit to the local area network. When the planning and design
data are then available to the programming unit, for example by diskette, the
method can also be implemented, of course, by means of the programming
unit.
13