Note: Descriptions are shown in the official language in which they were submitted.
~W0 92/1B$?6 2 0 9 81 ~ 0 pCf/GB91/022~
- 1 -
COMPENSATING FILTERS
This invention relates to filtering audio signals to
compensate the effects of acoustic and/or electrical
stages in the si nal
9 path from the original sound
source to the human ear.
In general, this signal path will include a pickup
receiving the sound, and converting it to, typically,
an electrical signal; signal transmission channels;
signal processing (e.g. filtering, tone control or
noise reduction); signal transmission, or
alternatively recording on to a record carrier; signal
reception or alternatively replaying from the record
carrier; a further transmission link; and
reconversion into an audio signal via an
electro-acoustic transducer. If the transducer is a
loudspeaker, the final stage in the path is
transmission through an acoustic environment
(typically a room) to the human ear.
Associated with each stage of the signal path is a
transfer characteristic, and at various stages in the
path attempts may be made to filter the signal to
compensate the effects of these transfer
characteristics. Compensation generally takes place
at a stage in the signal path subsequent to the stages
to be compensated. For example, in the case of a
sound recording, the signal will be filtered at the
mixing and cutting stages so as to compensate, if
necessary, for the recording environment and equipment
(amongst other things).
At the reproduction stage, it is nowadays common to
provide a so called "graphic equalizer"~comprising a
plurality of band pass filters each with its own gain
control, though which the signal is passed, to allow a
WO 92/1076 2 U 9 819 0 PC'T~GB91102200
e. ,
- 2 -
listener to re-equalize the reproduced sound signal.
The graphic equalizer is generally positioned between
the record carrier reader (e. g. turntable or compact
disc player) and the power amplifier driving the
electro-acoustic transducer (loudspeaker).
Since such equalizers are adjusted manually, their
setting is a matter for the personal taste of the
listener but they can be used (and are intended for
use) to compensate for large scale irregularities in
the amplitude response over frequency of the
electro-acoustic transducer or of the acoustic
environment in which the transducer is positioned.
In fact, with modern high fidelity audio equipment,
the major variations in sound reproduction quality are
due to the transfer functions of the loudspeaker and
of the acoustic environment in which the loudspeaker
is positioned.
The loudspeaker often comprises several separate
transducers responsive to different frequency ranges,
the loudspeaker input signal being split into the
ranges by a crossover network (generally an analogue
filter), and the transducers being mounted in a
cabinet. The transfer function of the loudspeaker
will thus depend upon the electrical characteristics
of the crossover network and of the transducers; on
the relevant positions of the transducers; and on the
mechanical resonances of the cabinet.
The transfer function of the acoustic environment may
be visualised by considering that the signal passes
though multiple paths between the loudspeaker and the
human ear; as well as the direct path through the air
between the two, there will generally be a path
W4 92/10876 PCT/GB91/02200
2098190
- 3 -
through the floor on which the loudspeaker and user
stand, and reflected paths from the (at least) four
walls, ceiling and floor. This leads to constructive
w
and destructive acoustic interference and to standing
wave patterns of considerable complexity within the
room, so that the paths from the loudspeaker to
different points in the room will have different
transfer characteristics - where the room exhibits
pronounced resonances, these transfer characteristics
can be extremely different, with complete
cancellation at some frequencies, the frequencies
differing between different points. These effects are
audible as colorations of the reproduced sound, and as
relatively long reverberations.
It would in principle be desirable to provide a
compensating filter and means for deriving the
parameters of the filter such that a given sound
source would be reproduced substantially identically
through any loudspeaker and/or acoustic environment,
so as to free the listener from the need to carefully
select certain loudspeakers, and pay attention to
their position within a room and to the acoustic
properties of the room.
One example of a proposal to achieve exactly this is
described in US4458362 and corresponding EP0094762A,
in which it is proposed to provide a finite impulse
response digital filter (implemented by a
microcomputer and a random access memory) in the
signal path preceding the loudspeaker. The
coefficients of the filter are derived in an initial
.
phase, in which a listener postions himself at his
desired listening point within a room and instructs
the microprocessor to generate a test signal which is
propagated via the loudspeaker through the room to the
WO 92/ 10876 PCT/GB91 /02200
~0981~p.
- 4 -
listener position and picked up by a microphone
carried by the listener. From the test signal and
signal picked up by the microphone, the impulse
response of the intervening portions of the signal
path (e. g. the loudspeaker and the acoustic path
through the room to that listener position) is derived
and the coefficients of an FIR filter approximating
the inverse transfer characteristic to that of the
signal path are calculated and used in subsequent
filtering.
However, this attractively simple idea suffers from
major drawbacks in practice. Firstly, since the
transfer characteristic of the signal path is derived
to only a single listener point within a room, and
since (as discussed above) the transfer
characteristics of signal paths to closely spaced
points in the room can have widely different transfer
characteristics because of the presence of multiple
room resonances, if the listener moves within the
room, then the transfer characteristic derived for the
filter becomes inappropriate so that, far from
compensating for the effects of the room, the filter
may actually further degrade the sound heard by the
listener at his new position.
The disclosure of US4458362 further refers only to
compensating the frequency response of elements of the
signal path and ignores the phase responses of those
elements. Although it is commonly thought that the
human ear is relatively insensitive to phase, we have
found that phase distortion, even at low levels, can
be perceptually significant to a listener.
WO 92/10876 PCT/GB91/02200
~~9~~.90
- 5 -
Different elements of the signal path will exhibit
different phase behaviour; the behaviour of
loudspeakers depends variously on the crossover
network, the transducers and the cabinet dimensions.
The phase response of the acoustic environment,
however, can be extremely complex due to the
reflection or resonances from the room boundaries.
These give rise to sharp changes in the phase response
of the path to a single point in the room.
Another problem is that it is possible, at some points
in the room, for sound to reach a listener by a first
path at a relatively low level and then by a second
path at a relatively higher level; the first path
could, for example, be through the floor of the room;
or the first path could be a direct path from the
loudspeaker through the air and the second a
reflection of greater magnitude (which can occur if
two reflections add up in amplitude and phase). The
effect in any event is that instead of hearing a sound
followed by a fainter echo, the listener hears a
"pre-echo" followed by a louder sound, which is
perceived as extremely unnatural.
It is relatively straightforward to cancel an echo; an
IIR filter having a delay equivalent to the echo
length and a loop gain equivalent to -1 times the
attenuation of the echo can be used, or an FIR filter
of length sufficiently long to approximate such an IIR
filter can be employed with suitable tap values.
However, compensating a pre-echo is considerably more
difficult. A direct compensation is impossible,
since the corresponding IIR filter would be unstable,
and it is necessary to employ a bulk delay within the
compensating filter so that the impulse response of
the compensating filter itself can be made acausal.
WO 92/10876 ~ 0 J 819 D PCT/GB91/02200
- 6 -
It is therefore clear that such filters themselves
will introduce pre-echo, calculated to exactly
compensate that introduced by the acoustic
environment. However, because the pre-echo time and
S amount are themselves sensitive functions of the
listener position in the room, a filter calculated to
compensate at one point will not only fail to
compensate pre-echo at another point but will
introduce a further pre-echo of its own which sounds
extremely unnatural to a listener. Even if no
distinct echo is heard, a low level of response
occuring prior to the arrival of the main part of the
impulse response.
The invention generally provides a filter (preferably
a digital filter) in which the substantially direction
independent portion of the path (including loudspeaker
and acoustic environment) is compensated so as to
substantially linearise the phase response thereof,
and the directionally dependent parts of the response
are compensated so as to flatten the amplitude
response without introducing further phase distortion.
The substantially direction independent part of the
response includes substantially the loudspeaker
response, and more particularly the electrical
portions thereof. Also provided are methods of
processing signals to yield the parameters of such
filters, and methods of manufacturing such filters
using the results of such processing.
Also provided according to one aspect of the invention
is audio processing apparatus which includes data
relating to the response of the loudspeaker with which
it is supplied or to be used, capable of generating a
test signal through the loudspeaker and of measuring
the test signal received at a plurality of points in
WO 92/1087 ; ~ ~h ~ '.~ ' ~~.' PGT/GB~3/02200
..~... ,,
2098190
_,_
the room to derive a representative room signal
response taking account of the loudspeaker response
data, and thereby generating filter parameters for
subsequent audio reproduction in such a manner as not
to generate audible pre-echos.
In another aspect, the invention provides a user
controllable phase correction to compensate phase lead
errors on audio source material, as a post filter.
Other aspects, embodiments, objects and advantages of
the invention will be apparent from the description
and claims.
The invention will now be illustrated, by way of
example only, with reference to the accompanying
drawings in which:
Figures la and lb illustrate schematically the
disposition of elements of the invention and
environment;
Figure 2 is a schematic block diagram of apparatus
according to the invention;
Figure 3 illustrates schematically a method of
deriving the characteristics of a filter to be used in
the apparatus of Figure 2;
. 30 Figure 4 illustrates in greater detail the method of
Figure 3;
Figure 5 illustrates in greater detail the method of
deriving loudspeaker parameters in the method of
Figure 4;
WO 92/10876 ~ 0 9 ~ ~ ~ ~ PCT/GB91/02200
_ g _
Figure 6 illustrates in greater detail the method of
deriving room parameters in the method of Figure 4;
Figure 7 illustrates a modification of the method of
Figure 6;
Figure 8 illustrates schematically the method of
combining Figures 5 and 6 in Figure 4;
Figure 9 illustrates a step in the method of Figure 7;
Figure 10 illustrates a further step in the method of
Figure 7;
Figure lla illustrates a step in the method of Figure
10;
Figure llb illustrates and alternative method to that
of Figures 10 and lla;
Figure 12 illustrates the form of a filter 5 in Figure
2 according to a first embodiment of the invention;
Figure 13 illustrates a modification to the method of
Figure 6 or Figure 7 for use with this first
embodiment of the invention;
Figure 14 illustrates schematically the form of a
filter 5 according to a second embodiment of the
invention;
Figure 15 illustrates schematically the method of
deriving the parameters of the filter of Figure 14;
WO 92h10~?6 2 0 g g ~ ~, 0 PCT/GB91/02200
_ 9 _
Figures 16a - 16c illustrate in greater detail stages
of the method of Figure 15;
Figure 17 illustrates in detail one example of the
method according to Figure 15;
Figure 18 illustrates schematically a variation of the
method of Figure 17;
Figure 19 illustrates schematically the structure of a
filter embodying a second aspect of the invention;
Figure 20 shows schematically the function of the
filter of Figure 12 including this embodiment;
Figure 21 illustrates schematically the gain of the
further component of the filter of Figure 20;
Figures 22a and 22b illustrate schematically the
amplitude and frequency behaviour against time of a
known test signal;
Figures 22c and 22d illustrate correspondingly the
behaviour of a test signal according to a first
embodiment of the invention;
Figures 22e and 22f illustrate correspondingly the
behaviour of a test signal according to a second
embodiment of the invention;
Figure 23 illustrates schematically the structure of a
test signal generator for generating the signals of
Figure 22;
WO 92/10876 O PCT/GB91/02Z00
209819
- 10 -
Figure 24 illustrates schematically the elements of a
stereo embodiment of the invention corresponding to
Figure 2;
Figure 25a and 25b shows schematically alternative
method of deriving parameters for equalizing the
stereo channels of the system of Figure 24;
Figure 26 shows schematically a variant of part of the
system of Figure 24;
Figures 27a and 27b show schematically apparatus
according to a further aspect of the invention;
Figure 28 shows schematically a method of deriving
characteristics of a filter of Figure 27b;
Figure 29 shows schematically an arrangement for
measuring the response of a crossover network;
Figure 30 illustrates schematically the inverse
impulse response of the crossover network;
Figure 31 shows the application of the invention to
automobile audio reproduction systems;
Figure 32 shows schematically the external appearance
of apparatus for domestic audio reproduction;
Figure 33 shows schematically the structure of a
processor forming part of the apparatus for Figure 32;
Figure 34 is a block diagram of the apparatus of
Figure 32;
WO 92/10876 PCT/G891/02200
- 11 -
Figure 35 shows schematically an embodiment of the
invention for audio visual reproduction;
Figure 36 shows schematically the structure of a
filter according to a preferred embodiment of the
invention;
Figures 37a-c shows schematically modification of the
impulse response of a phase lead correction filter
according to an aspect of the invention;
Figure 38 is a block diagram showing schematically the
structure of a testing system according to a further
aspect of the invention;
Figure 39 is a flow diagram showing the operation of
the system of Figure 38;
Figure 40 is a block diagram showing a portion of the
test signal generator of Figure 38, in greater
detail;
Figure 41 is a block diagram showing a portion of the
test signal analyser of Figure 38 in greater detail;
and
Figures 42a-f are diagrams showing illustratively the
spectra, in the Fourier domain, of signals at various
stages of the system of Figures 38, 40 and 41.
Physical Model
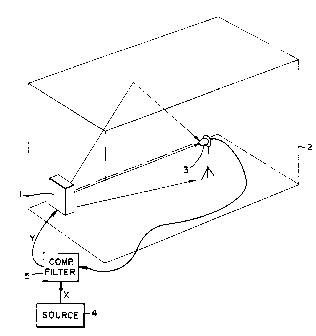
Referring to Figure la, a loudspeaker 1 is positioned
within a room or other acoustic environment 2. Also
within the room 2 is a listening point 3; a microphone
at this point is illustrated, but in use a human ear
would take its place. The loudspeaker 1 is fed from a
WO 92/10876 PCT/OB91/02200
X09'8190
- 12 -
signal source 4 an electrical signal representing a
sound signal to be reproduced by the loudspeaker 1.
In the electrical path between the source 4 and
loudspeaker 1 is the compensating filter apparatus 5
the subject of the present invention.
The acoustic signal generated by the loudspeaker in
response to the electrical signal it receives
traverses the acoustic environment 2 by several paths;
through the floor, directly through the air, and via
multiple reflections from the walls, floor and
ceiling. The walls, floor and ceiling will to some
extent attenuate the acoustic signal with each
reflection. If the degree of attenuation is
relatively low, long resonances lasting several
seconds can build up depending upon the dimensions of
the room 2, leading to sharp peaks and troughs in the
frequency spectrum of the room 2.
The peak height is a measure of resonance amplitude,
whereas the sharpness or narrowness in the spectral
domain is a measure of the length in time of the
reverberation or resonance, or the Q factor assocated
therewith. High Q, long lasting resonances, even of
low amplitude, are psycho-acoustically undesirable.
In the low frequency region below around 600 kHz,
complicated three dimensional standing wave patterns
may be present.
Signal Model
Referring to Figure lb, the path taken by an audio
signal to reach the listener at the listening position
3 is as follows. The source 4 providing the signal to
the loudspeaker 1 is equivalent to an original audio
source such as a human speaker or a musical
instrument, designated as 4a, which has passed through
WQ 92/1876 PCT/GB91/OZ2t10
..-,.
2a9~1~0
- 13 -
an electrical reproduction system such as a
microphone, a recording studio, a reproduction
turntable or tape deck and associated interconnection
' lines, designated generally as 4b. The original audio
signal will be designated S, and the transfer function
of the electrical reproduction stage 4b will be
designated FS, so that the electrical signal X
supplied by the source 4 comprises S*FS (where
denotes multiplication in the frequency domain or,
correspondingly, convolution in the time domain).
The signal X thereafter passes through, and is
filtered by, the compensating filter 5 the transfer
function of which is designated F 1, for reasons
discussed below. Thereafter the filtered signal Y is
fed (possibly through a power amplifier) to the
loudspeaker 1. The loudspeaker 1 generally comprises
an electrical crossover network la, typically a fourth
order passive filter, splitting the signal into
several frequency ranges - typically, a bass frequency
range (below 300 Hz), a mid-frequency range (between
this and 3000 Hz) and a treble frequency range (above
this). The transfer function of the crossover network
la will be designated Fx. Each filtered signal is
then supplied to a respective transducer; typically, a
moving coil cone transducer for the bass frequencies
and moving coil or piezo ceramic dome transducers for
mid and treble frequencies. These are mounted within
a loudspeaker cabinet.
These elements of the loudspeaker may be viewed as
exhibiting a transfer function FL which is due in part
to the electrical parameters of the transducers, and
in part to the geometrical disposition of the
2U~8~~0
WO 92/10876 PCT/GB9~/02200
- 14 -
transducers and to the mechanical properties of the
cabinet. In general, these latter parameters are
directional so that in fact the transfer function of
the loudspeaker depends upon the position of the
listener relative to the forward axis of the
loudspeaker (i.e. the axis along which the transducers
vibrate). However, for present purposes, the transfer
function of the loudspeaker in this description will
generally be understood to refer to its transfer
function along the loudspeaker axis, and at a distance
sufficiently great that near-field effects are not
overwhelming.
The audio signal generated by the loudspeaker 1 passes
to the listener point 3 through the acoustic
environment 2, which imposes on the audio signal a
transfer function which generally comprises a number
of different signal paths having differing
attenuations and also in general resonances. For any
given listener point 3, a room transfer function F
r
can be designated and measured but considered as a
whole the acoustic environment 2 cannot be described
by a single transfer function. The term "room
transfer function", when used in the following, is
used to indicate a transfer function which is valid
over a contiguous volume of the room as an
approximation to the transfer function between the
loudspeaker 1 and different listener positions 3
within that volume.
The entire signal path between the source 4 and the
listener position 3 may therefore be considered to
exhibit a lumped transfer function F, comprising
Fx*Fl*Fr, (or FL*FR where FL=Fx*F1 is the response of
the whole loudspeaker unit) and the compensating
WQ 92/10876 2 ~ ~ PCT/GB91:/02200
- 15 -
filter 5 should exhibit a transfer function F 1 which
tends to flatten, or reduce to unity, the lumped
transfer function F of the signal path.
Description of Hardware
F; 1 t~... c
It is greatly preferred to realise the filter 5 as a
digital filter by providing a digital input coupled to
a highspeed digital processor operable to execute a
stored program utilising a buffer memory to store
previous input values and/or previous output values.
As is well known, a digital filter operates by
generating a series of output values in dependence
upon combinations of previous input and/or output
values stored in the buffer memory multiplied by
digital coefficients which thus characterise the
filter.
A Digital Signal Processor (DSP) device comprising a
program memory, arithmetic logic, a multiplier and
fast data memory is employed as the filter 5.
Test Signal Generator 8
Also provided in this embodiment is a test signal
generator 8 which supplies an electrical test signal
to the input of the loudspeaker 1 directly (i.e. not
via the filter S). The test signal includes signal
frequency components across the range over which it is
intended to equalise the lumped transfer function F
(as discussed in greater detail below).
WO 92/10876 PCT/GB91/02200
- 16 -
Coefficient Calculator 6
A coefficient calculator 6 is provided, connectable to
a microphone 7, and arranged to calculate from the
signal from the microphone 7 the coefficients for the
filter 5 and to supply them to the filter. Since in
this embodiment the filter 5 and the coefficient
calculator 6 are not simultaneously employed, the
processor device which comprises the filter 5 may also
comprise the coefficient calculator 6 by executing a
different stored program.
General Operation of the Invention
One essential feature of the invention arises from our
realisation that the transfer functions of the
loudspeaker 1 and of the acoustic environment 2 are
qualitatively different, and that it is advantageous
to model and compensate the two separately (although,
of course, the same filter hardware 5 is preferably
used to compensate both). However, there are very
considerable difficulties in separately measuring the
two transfer functions in practice, since a
loudspeaker is required to inject an audio signal into
the acoustic environment, and a far field loudspeaker
response cannot be measured except within an acoustic
environment. It is possible to calculate a
mathematical approximation to the various transfer
functions. For example, if the type and cutoff
frequency of the crossover network is specified its
transfer function should be easy to calculate. This
applies also to the electrical parts (e. g. the moving
coil) of the loudspeaker. However, modelling the
mechanical behaviour of the loudspeaker is complex,
and modelling the acoustic behaviour of an environment
such as a room is extremely complex because of the
very large number of possible resonances. It is
VKO-92/lA~.?6 ~ ~ ~ ~ ~ ~ ~ P
CT/G891/02200
- 17 -
therefore prefered to derive the transfer functions of
the loudspeaker and room by measurement.
The response of a component to a signal can be
described in many ways; time domain descriptions such
as the impulse response or the auto correlation
spectrum; and spectral response descriptions such as
the complex frequency spectrum or the power spectrum
are amongst them. The various processes of measuring
the loudspeaker and room responses, processing the
responses, and designing the parameters of a filter to
compensate therefor, can therefore be performed in
many ways. In the following, for simplicity of
presentation, the response measurement and filter
design will be described using frequency domain
methods, from which alternative methods will be
obvious to the skilled man.
Referring to Figure 3, the general method of operation
of the coefficient calculator 8 is to obtain,
separately, a model of the loudspeaker response
substantially independent of the environment, and a
model of the environment response (which will be valid
over a zone within the environment) which is
substantially independent of the loudspeaker response.
The coefficient calculator 6 then calculates the
coefficients of a filter which will compensate for the
loudspeaker and for the environment in different ways
taking account of the different physical natures of
the loudspeaker and of the environment. The phase
response of the loudspeaker can be compensated to
substantially eliminate phase distortions introduced
by the loudspeaker, since the loudspeaker response is
largely independent of direction and position of the
listener relative to the loudspeaker. The acoustic
environment (e.g. room) is compensated so as to
WO 92/10876 2 fl 9 $1 ~ 0 PCT/GB91/02200
- 18 -
equalise its amplitude response but without completely
equalising its phase resonse so as to avoid
introducing further phase errors. The coefficients of
a signal filter which combines both compensations are
supplied to the filter 5 to enable subsequent filtered
audio reproduction via the loudspeaker 1.
Referring to Figure 4, the process of Figure 3 will be
described in greater detail. The response of the
loudspeaker 1 is measured by placing the loudspeaker
in an echo free environment, passing a test signal
through the loudspeaker, and picking up the reproduced
audio signal via a microphone. From the signal
measured by the microphone, a suitable model of 'the
loudspeaker response is derived. From this model, the
response necessary to compensate the loudspeaker is
derived; in a simple case, this is merely the spectral
inverse of the loudspeaker response itself. The model
loudspeaker response and the loudspeaker compensation
response data are then stored for subsequent use.
The loudspeaker 1 is then positioned within the
acoustic environment in which it is to be used, and
the microphone 7 is placed at a listener position
within the environment. An electrical test signal
from the test signal generator 8 is supplied to the
loudspeaker 1 and the resulting audio signal received
at the microphone 7 is measured and stored. The
microphone 7 is then moved to another point and the
process is repeated. Once sufficient measurements
have been taken, the coefficient calculator 6
calculates a room response from a combination of the
stored measurements, to be jointly representative of
all the points at which the measurements were taken.
This response includes the response due to the
loudspeaker 1. The coefficient calculator 6 therefore
WO 9Z/10$?6 ~ ~ ~ ~ ~ ~ ~ PGT/GB91/OZ200
...,.
- 19 -
uses the stored model loudspeaker response FL jointly
with the combined measured response to derive the
response of the acoustic environment 2 FR only,
eliminating the dependency upon the loudspeaker 1. A
compensation response FR-1 to substantially compensate
the room response is derived, and combined with the
loudspeaker compensation response FL 1. From the
combined compensation response the coefficients of the
digital filter S to execute the combined compensation
are derived and supplied to the filter 5 for use in
subsequent audio reproduction.
Loudspeaker Compensation
To measure the loudspeaker response, as shown in
Figure 4, the loudspeaker is placed in an anechoic
chamber comprising a room the walls and ceilings of
which are heavily acoustically damped, the microphone
7 (for example an electret microphone with a response
down to about 20 Hz) is positioned on the loudspeaker
axis in front of the loudspeaker at a distance away
from the near field of the bass unit (20-30 cms from
the cone for example) and the loudspeaker 1 is fed
with a test signal by the test signal generator 8.
The signal received by the microphone 7 is anti-alias
filtered, sampled and digitised by a conventional ADC
(not shown) and the digital signal is supplied to the
coefficient calculator 6.
Referring to Figure 5, the process of deriving the
transfer function or response of the loudspeaker from
the measured signal first comprises the step of taking
the Fourier transform of the signal.
WO 92/10875 , ~ ~ . : ~ PCT/GB91J022fl0
,i. 4 -',
- 20 -
For simplicity, in the following the effects of a
single impulse test signal will be discussed; the
signal measured by the microphone 7 therefore directly
yields the impulse response of the loudspeaker. If
other test signals are used, it is necessary to derive
the impulse response of the loudspeaker from the
measured signal by deconvolving the test signal
response from the measured response as discussed in
greater detail below.
The measured response may be improved by utilising any
other knowledge of the expected response; for example,
many loudspeakers have a log/linear low frequency
rolloff with a slope of six, twelve or 24 dB/octave,
and a mathematically calculated curve can therefore be
fitted to the measured data in the low frequency
region of the response. Alternatively, the response
can be calculated from measurements of dimensions and
mass of the loudspeaker components.
It is also preferred that any rapid variations of
phase with frequency (expressed as a logarithmic
scale) are left uncompensated so that the compensating
filter corrects only broad trends in the phase (and
amplitude) response of the loudspeaker. This is
because these rapid variations of phase are likely to
be due to mechanical resonances of the loudspeaker
cabinet, and consequently will sound different in
different directions around the loudspeaker - exact
compensation for one microphone position would
therefore worsen the response at other listener
positions. To achieve this, a smoothing operation is
performed on the derived Fourier transfer
coefficients.
The next step is to generate, from the measured
W0 9Z/lOB'16 2 0 ~ $ .~ ~ ~ PCT/GB91/02200
-...
- 21 -
response, the response of a compensation filter which,
when multiplied by the loudspeaker response in the
frequency domain (or convolved therewith in the time
domain) will achieve a desired target response. The
desired target response for an "ideal" loudspeaker has
the following features; its amplitude spectrum should
be essentially flat over the audible range; it should,
however, taper off smoothly at very low frequencies to
avoid overloading the loudspeaker; and its phase
response should be linear (within the passband at any
rate) to avoid phase distortion (and give a constant
group delay). Merely deriving the inverse to the
measured loudspeaker response (i.e. setting the target
response as unity) would cause the filter to boost the
amplitude response at low frequencies (possibly by as
much as twelve or twenty-four dB/octave), leading to
possible speaker overload.
It is particularly important to equalise the phase
response of the loudspeaker at low frequencies,
including the rolloff frequencies, and phase anomalies
above about 300-500 Hz are less noticable.
The spectral description of the target response (e. g.
flat amplitude spectrum down to 100 Hz, tapering into
linear. low frequency rolloff of twelve dB/octave,
linear phase response at least over lower frequencies)
will be permanently stored in the coefficient
calculator 6. The measured, smoothed, loudspeaker
response is divided into this target response to
provide a spectral description FL 1 of the loudspeaker
compensating filter response. The coefficient
calculator 6 can then, at a later stage, derive
corresponding filter coefficients from this
description using any convenient algorithm for the
WQ92f10876 ~ ~ ~ ~' ~ PCT/GB91/02~6t1
- 22 -
type of filter desired. For a FIR filter, it is
merely necessary to apply an inverse Fourier transform
to directly derive the impulse response (e.g. the
coefficients) of the filter.
Acoustic Environment Measurement
It would be possible to measure the response
of the acoustic environment 2 using a different
loudspeaker, for example one with a substantially
ideal response. However, we prefer to employ the
loudspeaker to be used in the room as shown
in Figure 4 so that elements of the loudspeaker
response not compensated by the loudspeaker
compensating filter F 1L can be lumped into, and
compensated with, the room compensating filter F 1
R
response.
This is particularly beneficial because those rapidly
fluctuating components of the loudspeaker response FL
which are direction or position dependent, and were
consequently not taken account of in deriving the
loudspeaker compensation response FL 1 are suitable to
be compensated in the same manner as the acoustic
environment.
Having decided to employ the same loudspeaker to
measure the room response, the obvious method of so
doing would be to feed the loudspeaker 1 with a
compensated signal passed through the loudspeaker
compensating filter so that the acoustic test signal
introduced into the acoustic environment 2 is not
affected by the response of the loudspeaker itself.
However, we find that this method can be affected by
WO 9"Z/1Q876 PCT/GB91/02200
2~~$~'~~
23
the presence of electrical and acoustic noise in the
path. More seriously, the rolloff introduced by the
loudspeaker compensation filter would then be
compensated for by the room compensation.
Additionally, this method will generally tend to
result in a longer filter (comprising a cascade of the
loudspeaker compensating filter and the room
compensating filter), leading to more calculations
being necessary in real time filtering.
Referring to Figures 4 and 5, the environment response
is therefore measured as follows. The loudspeaker 1
is positioned as desired in the acoustic environment
(e.g. room) 2. A compensated volume or zone is
designated within the room; this is typically a couch
or other area of the room where a listener is likely
to be. The microphone 7 is positioned at a first
point within the compensated volume. The test signal
generator 8 generates a test signal which is supplied
directly to the loudspeaker 1 which correspondingly
generates an audio signal (equivalent to the test
signal influenced by the loudspeaker response) within
the room 2. The audio signal travels through the room
2 via multiple paths and reaches the microphone 7
which correspondingly generate a measured signal,
which is digitised as before and supplied to the
coefficient calculator 6.
The microphone is then moved to another position
within the compensating volume and the process
is repeated. The coefficient calculator 6
stores the signal from the microphone for each
position. When measurements have been taken
at a suitable number of positions the
coefficient calculator 6 then generates an averaged
(in a loose sense) system response from the measured
WO 92/108?6 ~ p g g 19 0 PC'I'/GB91/~Z~0
- 24 -
signal, and obtains from this the averaged
room response Fr by taking acount of the already
measured loudspeaker response FL. After adjusting the
derived room response Fr (as described in greater
detail below), a desired correction response is
calculated and from this and the compensation response
FL 1 derived for the loudspeaker, coefficients for a
filter F 1 are calculated which when executed by the
filter 5 will compensate both the loudspeaker 1 and
the room 2. The filter coefficients for this are then
supplied to the filter 5 for subsequent processing of
audio signals from the source 4.
Referring to Figure 6, the process by which the
coefficient calculator 6 derives the room response Fr,
the room compensation response Fr 1 will now be
described in greater detail. As stated above, the
stored target response for the room has a broadly flat
amplitude spectrum.
The first step is to combine the responses of the
measured signal; this is conveniently done in the
spectral domain by executing a Fourier transform on
the impulse response obtained from the measured
signals, averaging the Fourier transform spectra from
all the measured points in the room and averaging the
Fourier spectra using some convenient average (not
necessarily the arithmetic mean) to give an averaged
spectrum. This process of averaging in the spectral
domain reduces the local amplitude response
differences due to standing wave patterns and
reflections within the acoustic environment 2. It is
preferred to average the amplitude spectra only,
W0 92II~876 ~,~°:~ ~ ~ ~ ~ PCT/GB91/0~200
,,...
- 25 -
rather than amplitude and phase spectra; averaging the
power spectra is one convenient amplitude related
method.
The response of the compensating filter Fr 1 is
desired to exhibit minimum phase behaviour so as to
avoid the possibility of introducing pre-echos.
A minimum phase filter is a causal filter having the
lowest deviation from zero phase response achievable
for a given amplitude response. As a consequence, the
envelope of its impulse response is tightly confined
around the t=0 (e. g. the initial) impulse response
component.
It is mathematically demonstrable that the phase
response of a minimum phase filter is directly related
to the amplitude response of the filter. It is in
fact given by computing the logarithm of the spectral
power response, computing the Hilbert transform of
the result, and then deriving a filter with amplitude
equal to the square root of the spectral power
response and phase equal to the calculated Hilbert
transform.
The coefficient calculator 6 therefore calculates, for
each of the stored microphone signals, the spectral
power response; conveniently this is achieved by
performing a discrete Fourier transform and then
taking the modulus (squared) of each complex term.
The corresponding terms for each stored signal are
then summed to yield an average spectral power
response representing the spectral power response over
the entire compensation volume. Figure 7 illustrates
WO 92110876 ~ a 9 ~ ~. (~ O PCT~GB9l~t~22n0
- 26 -
the process of Figure 6 adapted for a minimum phase
room compensation response.
The next step is to divide out from the measured
response the contribution to the transfer function due
to the loudspeaker 1. The loudspeaker response FL
will already be available, having been measured as
described above, although it is preferred to use the
smoothed response FL (omitting rapidly changing phase
components) since the position of the microphone 7
within the room 2 will inevitably differ from the
microphone position at which the loudspeaker response
measurements were taken, and the uncompensated parts
of the loudspeaker response are thus left in the
desired room response FR. The averaged measured
spectrum is therefore divided by the modulus of the
spectral response of the loudspeaker to produce a
response approximating that of the room.
Processing the Room Spectrum
Although averaging the measured response from a number
of points helps to somewhat reduce the influence of
some room resonance effects at low frequencies, the
averaged room response may still contain sharp peaks
corresponding to particular resonances and deep
troughs. Deep troughs are particularly problematical,
since a straightforward compensation filter would
strongly boost the signal at frequencies corresponding
to trough, which can lead to loudspeaker overloading.
Additionally, in other areas of the room the original
trough may not be noticable but the boost applied to
the signal certainly will. We have discovered that
the psycho-acoustic effect of troughs in a frequency
response is far less noticable to a listener than that
k .,. w .
W0 92/176 PGT/GB91/02200
,...
209819a
- 27 -
of peaks in a response. We therefore prefer for this
reason also not to introduce large peaks into the
response of the correction filter, so that the
correction filter is less responsive to troughs in the
measured room response than to peaks.
The sharpness of any troughs is also of significance,
since a correspondingly sharp feature in the
compensating filter response implies a high Q factor
and we have found that the psycho-acoustic effects of
such high Q filtering can be extremely subjectively
undesirable to the listener. Even quite low-level
resonances can, if they continue for a long time, be
disturbing to the listener.
Rather than generating a compensating filter which
corresponds to the spectral inverse of the measured
room response, it is therefore preferred to make the
compensating filter correspond to a processed version
of the room response.
The processing smooths (i.e. reduces the amplitude
and/or sharpness) of peaks and, more particularly,
troughs in the room response spectrum as discussed in
greater detail below. Having generated a smoothed
room response, FR the next step is to calculate the
response FR-1 of a filter to compensate the room
response. The desired filter amplitude response is
obtained simply by taking the square root of each
power spectrum term and dividing the result into unity
(or, in principle, a different room target response).
The desired phase response is, for a minimum phase
filter; directly calculated from the amplitude
spectrum as the Hilbert transform of the logarithm of
~0.y81~0
WO 92/10876 PCT/GB91/02200
- 28 -
the amplitude spectrum. From the phase and amplitude
spectra, the required filter coefficients can be
derived by an inverse Fourier transform back into the
time domain, with appropriate windowing to limit the
length of the filter. Although it would be possible
to separately derive the room correction filter, it is
prefered that, as shown in Figure 8, once the phase
and amplitude spectra of the desired room correction
filter have been calculated, they are multiplied with
the spectra already derived for the loudspeaker
correction filter to provide a frequency domain
description of a combined correction filter calculated
to compensate both the loudspeaker and the room; for
a FIR filter, coefficients of the combined filter are
then derived by inverse Fourier transform of the
combined spectral response.
The filter coefficients thus calculated are then
stored for use by the digital filter 5 in subsequent
audio reproduction.
Referring to Figure 9, the processing comprises two
operations; an amplitude adjusting step in which the
amplitude of spectral components is adjusted in
dependence upon their own value in a non-linear
fashion so that the depth of troughs is reduced, and a
smoothing step in which the amplitude of each spectral
component is adjusted in dependence upon that of its
neighbouring components so as to provide some degree
of smoothing, averaging or low pass filtering of the
spectral power response which reduces the sharpness of
peaks and troughs. This may be achieved simply by
providing a moving average over a number of samples (a
rectangular smoothing kernel or window), or by
employing a more sophisticated smoothing kernel such
as a triangular or quadratic kernel. The kernel shape
J ..
WO 92/1A876 PCT/GBli/02200
2~~~~9
- 29 -
also has some effect on truncating the length of the
eventual filter; the smoother the spectrum, the
shorter the filter.
The choice of the form of adjustment depends primarily
upon the size of the listening area or compensation
volume within the room which it is desired to
compensate. For equalisation at a single point, it is
possible to exactly compensate even the deepest trough
or highest peak without undesirable psycho-acoustic
effects. For a small compensation volume, a
relatively small adjustment avoids severe
psycho-acoustic effects but provides detailed
equalisation of response dips, whereas a larger
adjustment, necessary for a larger compensation zone,
produces a compensation filter which does not
compensate deep or narrow response troughs. In fact,
it is found that the volume over which a compensating
filter having a given degree of adjustment operates is
on the order of a predetermined number of wave lengths
irrespective of frequency; in other words, in order to
compensate over a given volume for all frequencies, it
is necessary to use a frequency dependent degree of
adjustment of the response spectrum so as to smooth
peaks and troughs to a greater degree at higher
frequencies than at lower frequencies.
We have discovered that at very low frequencies (below
20 Hz or 30 Hz) traffic and machine noise, together
with high frequency components of variations of
atmospheric pressure due to meteorological phenomena,
will be measured by the microphone 7 and hence will
erroneously appear to be part of the room response
spectrum. It is therefore preferred to very strongly
smooth the measured room response below some minimum
frequency around 20-30 Hz.
~~9~1~0
WO 92/10876 PCT/~B91/0221)II
It is undesirable to have sharp transitions between
types of spectral processing, however, as this
invariably sounds unnatural to the listener. The
amplitude adjustment function used therefore has the
5 following effects on the compensation filter response
derived:
1. It makes the compensation filter response
substantially independent of large troughs in the room
10 response at very low frequencies:
2. It makes the compensation filter response
progressively less dependent upon troughs in the room
response occuring at progressively higher frequencies
15 above some frequency threshold:
3. It applies an approximately constant amount of
amplitude adjustment over the spectral region between
very low frequencies and the threshold: and
4. There are not sharp transitions between the three
regimes above.
One suitable amplitude adjustment function is as
follows:
S(f)+k(f)z - S(f)
K+k ( f ~ z
WO 92/108?6 PCT/GB91102200
2Q~~~194
- 31 -
Where the function k(f)Z is:
r
k(f)Z fLOW 4 + a + f 4
f
(HIGH
The constants a and K are empirically set to some
suitable value. It will be seen that this function
achieves the above objects, but many other amplitude
adjustment functions - for example, using powers other
than 4 - could be employed. The coefficient
calculator 6 therefore takes the stored spectral power
coefficients, and replaces each by a modified spectral
power coefficient to yield an amplitude processed set
of coefficients. Each amplitude modified coefficient
is then, as mentioned above, processed by replacing it
with a local average comprising the normalised sum of
that coefficient and its immediate neighbours. The
number of immediate neighbours, and hence the
resulting spectral smoothness, is also preferably a
function of frequency to achieve the three broad
criteria set out above.
The two operations need not be carried out
sequentially, but can be combined. Further, each
operation can be made to depend upon the other; thus,
the degree of smoothing (i.e. the amount by which the
modified value of each coefficient depends upon its
neighbours) may be varied in dependence upon the
amplitude of a coefficient, or vice versa, so that
sharp troughs are both smoothed and reduce in
amplitude but other coefficients are not.
WO 92/1087b PCT/GB91/02200
- 32 -
Limited Pre-echo Filtering
In the foregoing, correction or the room acoustic
using a minimum phase filter was proposed. It is
found that using this type of correction, room
reverberation times (defined as the time taken for an
impulse amplitude to die away to some low level, for
example -60 dB) are substantially reduced, and the
response of the entire filter, loudspeaker and
acoustic environment path itself has no pre-echos over
the compensating volume.
However, we have found that room reverberation time
can be reduced further, with little or no penalty in
psycho-acoustic acceptability, by allowing the filter
5 to exhibit slightly non-minimum phase behaviour.
Since the acoustic environment response cannot be
exactly corrected over the whole compensation volume,
a certain amount of phase error be measurable at some
points, but we find that by constraining the amount
of preresponse exhibited by the filter 5 to a much
lower level than would be the case for linear phase
compensation of the room, the result is still
acceptable to the listener.
Typical pre-response times which are acceptable are
20msecs to 50msecs; one useful (but not rigorous)
design rule is found to be that the maximum permitted
pre-response time of the filter 5 (or, to be more
accurate, of the room compensation filter element of
the filter 5) should not significantly exceed the
difference between the time of arrival of a sound from
the loudspeaker at the compensation volume and the
time of arrival of the first reflection of that sound
in the compensation zone from the most distant
reflecting surface of the room.
WO 92/10876 PCT/GB91/02200
....
- 33 -
This measure can of course be calculated for any given
room dimensions and loudspeaker and listener
positions, or alternatively could be measured from the
impulse response of the signal received by the
microphone 7, but in general it is prefered to set the
maximum amount of pre-response for the filter to
compensate the acoustic environment at a predetermined
level typically less than 50msecs.
In this context, "pre-response" generally means that
portion of the envelope of the impulse response
occuring prior to the peak value of the impulse
response. Where a measurable definition is necessary,
the pre-response of a filter may be defined as the
time, from the first component of the impulse response
of the all pass part of the filter response, to the
"centre of gravity" of the all pass impulse
response;
Eatx*t/Eatz,
where at is the amplitude of the impulse response at
time t.
It is also possible to make some qualitative
statements about the shape of the impulse response of
the filter; there should be no discrete peak earlier
and lower than the highest peak in the impulse
response, as this will generally be audible as a
pre-echo unless very closely spaced. 4~e have also
discovered, however, that the ear appears to respond
more to early parts of transients, so that the mere
absence of early peaks is insufficient to eliminate
pre-echo; a sharply rising pre-response (compared with
the later portions of the impulse response) will still
WO 92/10876 PCT/GB~IdB2Z00
~°
- 34 -
sound audibly unacceptable, but an extended and slowly
rising pre-response generally avoids pre-echos.
Referring to Figure 10, and recalling that is is
possible to consider any given response to be the
convolution of (i.e. equivalent to a cascade of) a
minimum phase filter and an all pass filter; it will
therefore be apparent that the minimum phase
correction filter derived by the process of Figure 7
leaves uncorrected an all pass component of the
acoustic environment function.
Some degree of correction of this component is
provided by deriving a representative all pass
transfer function A of the acoustic environment;
truncating the length of the impulse reponse of the
all pass component A to some predetermined limit (e. g.
50msecs); time reversing the impulse response (it
being remembered that the convolution of an impulse
reponse and its time reversal give rise to a linear
phase); deriving the all pass part A 1 of the time
reversed response; and convoluting this with the
minimum phase room correction response produced
according to the process of Figure 7.
The process of deriving an all pass part of a response
may be achieved in several ways; for example, in the
frequency domain, by deriving the minimum phase
component of the spectrum and then dividing this into
the original spectrum. To avoid division by zero
anomalies, the minimum phase component may first be
smoothed as above.
WQ92f10876 2 0.9 ~ 19 0 P~/GB91/02200
- 35 -
The all pass component A of the room response which is
selected for correction may be derived by deriving the
all pass components for each microphone measured
signal, separately, and then selecting one of the
calculated all pass responses as representative. This
could :~e one which corresponds to a central microphone
position within the compensation zone, or could be one
exhibiting the lowest deviation from the average of
all the responses.
As an alternative to the above method of deriving the
response of the limited pre-response filter,
referring to Figure llb the impulse response
is measured at each microphone position (with
their initial, t=0, components aligned) may
be averaged and the averaged impulse response
Fourier transformed. The resulting spectrum is
strongly smoothed using a local averaging kernel
as discussed above, and the reciprocal spectrum is
derived - or, more specifically the "regularised
reciprocal" defined as c*(f)(K+k(f))/c(f)c*(f)+k(f)
where c is the complex conjugate of c, K is chosen to
have approximately the same mean value as cc*, and
k(f) is an amplitude varying function of the kind
discussed above.
As shown in Figure llb, the RMS term for each spectrum
of the inverse spectrum thus derived is multiplied by
the RMS power spectrum derived as in Figure 7, and a
minimum phase response is derived to compensate this
combined response. The inverse spectrum itself is
then used as the limited pre-response all pass which
is multiplied by the minimum phase correction and the
resulting correction spectrum is inverse Fourier
W0 92/1~876 PCT/GB91/02200
2091.94
- 36 -
transformed into the time domain to obtain the desired
filter coefficients.
The use of limited pre-response correction of this
type with a suitable limit on the length of the
pre-response (generally less than 50msecs; preferably
less than 20msecs and advantageously less than
lOmsecs) reflections from within the loudspeaker
cabinet, and off the walls adjacent the loudspeaker,
can be cancelled without giving rise to audible
pre-echo. The pre-response limits are, it should be
stressed, very much shorter than the amount of
pre-response which would normally be required to
provide linear phase correction for the entire room
(typically on the order of several seconds).
IMPLEMENTATION
We have found that at low frequencies a filter with a
frequency resolution of down to 1 Hz is desirable for
acceptable compensation. It is also at low
frequencies that some of the least acceptable
loudspeaker and room phase distortions occur.
Providing a filter which would give a resolution of 1
Hz across the full audio band width of 0-15 kHz would
however require a filter having a length of the order
30,000 stages and, at a sampling rate of 30 kHz,
therefore require 30,000 times 30,000 = 900 megaflops
processing power - which is not at present
practicable.
Low Frequency Equalisation
Because many of the features of the responses it is
desired to correct occur at relatively low frequencies
(below 1 kHz, or more specifically below 500 or 300
kHz), it is possible merely to compensate the room and
loudspeaker responses in these frequency regions.
WO 92/i0876 PGT/GB91/02200
209~.~90
- 37 -
Operating only on the low frequency regions can of
course be achieved at a much lower sampling rate and,
for a given frequency resolution, a shorter filter.
However, because the ear is particularly sensitive to
sudden jumps or changes in spectral response it is
particularly necessary to take great care that the
transition between the compensated and uncompensated
frequency regions is smooth and gradual without
discontinuities.
Referring to Figure 12, in an embodiment of the
invention for compensating at low frequencies, the
filter 5 may be represented as comprising two separate
signal paths. The first path 51 includes a delay
stage 52 characterised by a delay time 1 supplied by
the coefficient calculator 6 as discussed below. The
second path 53 includes a downsampler or decimation
filter 54, receiving input samples at some
predetermined rate (for example, 44.1 kHz) and
generating output samples at a much reduced rate
equivalent to the sampling rate for the frequency
range to be compensated (i.e. twice the highest
frequency present); for a compensation range up to
500 Hz, the output sample rate would therefore be 1
kHz.
To avoid aliasing, the downsampler 54 includes low
pass filtering; typically, each output sample
represents the average of a plurality of input
samples. The down sampled and band limited signal is
filtered by a digital compensating filter 55, so as
to effect the desired room/speaker compensation, and
the bit rate of the filtered signal is then increased
by an up-sampler 56 back to the input frequency (e. g.
44.1 kHz). The up-sampler 56 is an interpolating
filter receiving successive signal samples and
WO 92/10876 PCT/GB91/02200
~~19g190
- 38 -
generating a plurality of interpolated sample values
in between.
The length of the delay 1 of the delay stage 52 in the
first path 51 is equivalent to the lengths of the
delays caused by the down converter 54 and up
converter 56 {which are predetermined and constant)
together with the filter delay D caused by the
pre-response of the filter 55 (which is calculated by
the coefficient calculator 6).
In a conventional split band filter, the first path 51
would include a high pass filter to match the low pass
effects of the down sampler 54. We have found this
both undesirable and unnecessary however. Instead,
prior to up sampling by the up sampler 56, the down
sampled but unfiltered signal delayed by the filter
delay D is subtracted from the filtered output of the
filter 55. Thus, instead of adding to the original
full band width signal a component comprising the
filtered low frequency portion thereof, what is added
back is the difference generated by the compensating
filter 55 itself independently of the effects of the
down sampler 54 (which are cancelled by the
subtraction). No filtering of the high and mid-range
signal components within the path 51 is thus
necessary.
In fact, there is no need to separately subtract the
unfiltered down sampled signal by providing an extra
signal delay path 57; instead, this path may be
considered to form part of the filter 55 and, in the
case of an FIR filter, is effected simply by reducing
the value of the t=0 filter coefficient by unity. The
filter coefficient calculator 6 therefore performs
WO 93/10876 PCT/G891/03200
209~19fl
- 39 -
this subtraction as the last stage in deriving the
filter coefficients of the filter 55.
To derive the filter coefficients, the second signal
path 53 is broken before and after the filter 55 at
points X and Y respectively. A test signal (at a
sample rate of 1 kHz and containing frequencies
between 0 and 500 Hz is applied at the point Y, and is
interpolated to increase the sample rate by the
upsampler 56 and passed to the loudspeaker 1. The
microphone 7 is connected to the filter input, and the
down sampled output of the down sampler 54 is supplied
from point X to the coefficient calculator 6. The
signal from the microphone 7 is thus measured at the
same sample rate as that at which the filter 55 will
operate.
Referring to Figure 13, the coefficient calculator 6
in this embodiment operates as described above with
reference to Figures 3 to 11, except that because the
room response measured by the microphone 7 will have
been effected by the low pass characteristic of the
down sampler 54, the measured room response will fall
off to zero at 500Hz. The desired compensation filter
should have a response of unity at exactly 500Hz and
above, however, so as not to interfere with the
unfiltered signal through the delay stage 52. Merely
deriving a compensation filter to the measured
response including the fall off at 500Hz due to the
down sampler 54 would therefore result in a
compensation filter which strongly boosted frequencies
just below 500 Hz which would clearly be unacceptable.
The room response processing step within Figure 6
therefore includes the step of tapering the measured
room response towards a value of unity and just below
500Hz, using a function which is progressive with
WO 92/10876 ,~ PCT/GH91/02200
- 40 -
frequency so as to avoid discontinuities in the
compensation response. The exact method by which this
is achieved is irrelevant, but one possible method is
to multiply each spectral term above a given frequency
(for example 350Hz) with a function which decreases
smoothly and monotonically from unity at 350Hz to zero
at 500Hz, and then add unity minus the value of the
function; i.e.
S'(f) - S(f) * L(f) + (1-L(f))
Multiple Band Filter
It is also possible to provide a practical filter 5
capable of filtering the entire audio spectrum. At
higher frequencies, the spectral resolution of the
filter is less critical and the compensating filter
response will have been smoothed to a greater degree
as described above. It is therefore possible, in
addition to the relatively high resolution filter 55
operating at a low sample rate, to use shorter filters
58, 59 operating at higher rates, and therefore
higher frequencies, but with lower resolution, as
illustrated in Figure 14. By way of example, using
two Texas Instruments TMS 320 digital signal processor
devices (a first implementing the high rate filter and
a second implementing the mid and low rate filters)
filter dimensions of FIR filters were as follows:
Filter Sample Rate (kHz) Length (taps &
ms)
H/F(59) 44.1 75 1.7
M/F(58) 14.7 240 16.33
L/F(59) 1.8375 1024 557.28
WO 92/10876 < ~ ~ ~ ~ 1 (~ O PCT/GB91/02200
- 41 -
Filter Pre-response (taps & ms) Resol'n (Hz)
H/F(55) 20 0.46 294
M/F(58) 80 5.44 30.6
L/F(59) 200 108.84 0.9
Referring to Figure 14, the input digital signal is
filtered by the high rate filter 59. The input signal
is also down sampled by a first down sampler 60 by a
factor 3, and fed to the mid-rate filter 58. The
filtered signal is then interpolated by an up sampler
61 by a factor of three, and added to the high rate
filtered signal from the filter 59. The down sampled
input signal from the down sampler 60 is further
decimated by a second down sampler 54 by a factor of
8, and filtered by the low range filter 55. The low
range filtered signal is then interpolated by a factor
8 by up sampler 56 and added to the filtered signal
from the mid-range filter 58.
As in the embodiment of Figure 14, the high rate
filter 59 does not need to include a low freqeuncy
cutoff, since (as explained below) the coefficients of
the lower rate filters take account of the effects of
the high rate filter in mid and low frequency
ranges.
Deriving Split Hand Filters
Although the structure of the filter 5 in this case is
straight forward, the band splitting complicates the
process of filter derivation.
If the coefficients for the filters 55, 58, 59 were
derived separately, this could lead to anomalies in
the overall response at the transition frequencies.
Referring to Figure 15, it is therefore preferred that
the response for each compensation filter should be
WO 92/10876 ~ 2 ~ ~ 8 ~; ~ a '. PGT/~GB91/02200
42
derived taking cognizance of the filter for the
neighbouring band or bands. More specifically, by
deriving first the response for the high rate filter
59, then deriving the response of the mid-rate filter
58 taking into account that of the high rate filter
59, and then the response of the low rate filter 55
taking account of both, smooth transitions between the
responses of the three filters are obtained.
Referring to Figure 16a, in a first method of taking
account of higher band rate filters when calculating
lower band rate filters, the signal measured from the
microphone 7 is processed at its original band rate
and a spectral response is obtained (e. g. by executing
a Fourier transform). The measured signal is also
decimated by a down sampler so as to reduce the sample
rate, and consequently band limited to half the
decimated sample rate. The spectral response of the
down sampled measured signal is also obtained. As
stated above, this will be band limited to half the
sampling rate.
In Figure 13, the process of tapering, or merging, the
spectral response towards unity at the Nyquist
frequency was illustrated. However, when higher band
rate data is available, the process can be improved by
merging the response spectrum towards that of the
corresponding spectral region of the higher frequency
filter at the Nyquist frequency, as shown in Figure
16A. If the spectral responses at the different rates
were obtained by transforms using different a number
of terms over the operative band width, one spectrum
(typically the higher band rate spectrum) will require
interpolation of extra terms to intersperse the
existing terms so that they match the terms of the
lower rate spectrum. The operation of merging the two
wo nmos~6 ~ ~ ~ 8 ~ ~, . . PCT/GB91/OZ200
- 43 -
spectra at the Nyquist frequency is equivalent to that
set out in Figure 13; the corresponding expression
is:
S~(f) SL(f)L(f) + SF(f)(1'L(f))
If the spectral responses at the different rates were
obtained by transforms using a different number of
terms over the operative band width, and hence having
a different resolution, it is advantageous to smooth
the spectra using a frequency dependent smoothing
kernel to smooth the higher resolution spectrum to
match the lower resolution spectrum at the transition
between the two.
The second method by which account is taken of
compensation in higher frequency bands is illustrated
in Figure 16B. In deriving the co-efficients of the
high rate compensation response, at least if a finite
impulse response filter is used, it will generally
have been necessary to generate a filter having a
shorter length than would be required to exactly
possess the calculated compensation response. This is
conveniently achieved by windowing the impulse
response obtained by applying the inverse spectral
transform to the compensation spectral response.
However, reducing the filter length will inevitably
effect its spectral response, and may re-introduce
some response in the lower frequency region which the
lower rate filters are to compensate.
In fact, the low frequency cut within the target
response for the high frequency filter is relatively
gentle and so in any event the high rate filter may
WO 92/10876 PCT/GB91/02200
208190
- 44 -
have a substantial response in the low and mid-rate
regions.
In order to take account of the high rate filter
response in lower frequency ranges, the spectrum of
the actual high rate filter response is obtained by a
further Fourier transform, and corresponding
frequency terms are aligned or matched to those of the
low rate compensation response rior to deriving the
low rate compensation filter.
The values of coefficients of the high rate filter
response spectrum which fall within the pass band of
the low rate response spectrum are then subtracted
from their low rate equivalents, so that the low rate
filter excludes the filtering already performed by the
high rate filter. The similarity with the method used
to deprive the filter of the embodiment of Figure 12
will be apparent.
After this, the coefficients of the low rate filter
are derived, e.g. by inverse Fourier transform. Where
three or more filter responses in different bands are
calculated, as shown in Figure 16c, the corresponding
portions of the spectral correction response obtained
for each filter is subtracted from that of every
filter operating at a lower rate; in other words, the
spectral response of the derived high rate filter is
subtracted from the spectral response of the
calculated mid-band compensation, from which the
response for the mid-band compensation filter is
calculated. The spectral responses of the mid-band
compensation filter and the high band compensation
filter in the low band frequency region are both
subtracted from the calculated compensation response
for the low frequency band filter, and from the
WO 92/176 2 0 9 819 0 PC'1'/GB91102200
- 45 -
result the low rate compensation filter is
calculated.
For completeness, Figure 17 illustrates one way in
which, for example, the loudspeaker response may be
derived. The full band rate signal is Fourier
transformed, with an initial windowing operation using
a suitable flat topped window to prevent frequency
leakage, then divided into the high frequency target
which comprises a predetermined response calculated,
firstly, to prevent compensation for the low pass
anti-aliasing and sampling filtering present in the
measuring equipment, and secondly, to impose a
gentle low frequency cut at below the upper frequency
limit of the mid-rate filter, e.g. 4kHz.
The compensation filter thus derived is inverse
Fourier transformed, and the resulting impulse
response is windowed once more to limit the filter
length to a practical value (e.g. 75 samples}. The
measured signal is also decimated by a factor of, for
example, three to calculate the mid-rate filter
coefficients. The decimated signal is windowed and
Fourier transformed as before. Since the decimation
has band limited the spectrum, it is merged at around
its Nyquist frequency with the corresponding portion
of the high rate spectrum previously derived. The
resulting merged spectrum is divided into the
mid-frequency target, which includes a low frequency
cut below the upper frequency limit of the low rate
filter at, for example, g00Hz.
As discussed above with reference to Figure 16B and C,
the spectrum of the actual high rate filter is derived
by a Fourier transform and subtracted from the
mid-frequency compensation spectrum, and the result is
PCT/GB91/02200
WO 92/10876
- 46 -
inverse Fourier transformed and windowed to yield the
coefficients of the mid-rate filter 5B.
The measured signal is decimated further to provide a
low rate signal, which, as before, is windowed and
Fourier transformed. To correct the error around the
Nyquist frequency, the spectrum thus derived is merged
with the corresponding portion of the mid-frequency
spectrum previously derived, and the result is divided
into the low frequency target spectrum. The resulting
calculated compensation spectrum has subtracted from
it the spectra of the actual high and mid-rate filters
59 and 58, and the resulting corrected spectrum is
inverse Fourier transformed and windowed to yield the
coefficients of the low rate filter 55.
This process can be adapted in several ways; for
example, the mid-rate filter could be derived without
decimation from the full rate signal, in which case ,
as shown in Figure 18, the corresponding coefficients
of the high frequency filter can be subtracted from
those of the full rate impluse response derived by
inverse Fourier transforming the mid-frequency
correction response. This time domain subtraction
serves to prevent the mid-range filter correcting agin
those aspects of the mid-range response already taken
account of by the high rate filter. The mid-range
characteristic of the high range filter. To obtain
coefficients of a filter to work at the lower sample
rate required of the mid-rate filter 58, this impulse
response is then decimated (e.g. by a factor of
three). Further windowing to reduce this length of
the impulse response may be performed.
WO 92/108?6 2 0 9 8 ~ 9 0 ~/GB91/02200
- 47 -
The same process could of course by analogy be
employed to derive the low rate filter 55 taking
account of the mid-rate filter 58.
In calculating the room response, the measured signals
from each microphone position are separately windowed
and transformed (with decimation as necessary), and
the spectra averaged, prior to the subsequent stages
of Figures 17 or 18. At this stage, the corresponding
band response for the loudspeaker is divided out to
give the response of the room.
Compensating Source Phase Errors
The electrical source signal supplied to the filter 5
is, as discussed with reference to Figure 1B, usually
the result of an original audio source signal S
processed by electrical circuitry such as amplifiers,
filters, transformers and so on having an overall
transfer function Fs. Since the original audio source
signal itself is not available, it is not in general
possible to identify the source signal and the
transfer function FS separately.
A modern high fidelity sound recording may have passed
through many stages of processing, including AC
couplings and each will include e.g. RC high pass
circuits. At low frequencies, the phase leads induced
by these filters can lead to noticable phase
distortion. Because the original source signal is not
available, the co-efficient calculator 6 cannot
automatically compensate the effect of these phase
errors. It is also not possible to compensate for
such phase leads using a passive analogue filter as an
acausal filter is necessary: this can however be
WO 92/10876 ' . PCT/GB91/02200
- 48 -
provided by a digital filter including a bulk delay or
an FIR filter.
In a preferred embodiment of the invention we provide
an ail pass filter selectable by the user to
compensate these phase errors; this can be achieved
with a filter having a simple response in which the
phase is responsive (at least roughly) to 1/f over
bass frequencies. The constant of proportionality is
selected by the user, for example by a separately
provided phase control on the filter 5 housing.
It can be shown that over mid-bass frequencies, the
effect of cascaded RC high pass elements can
approximately be compensated by a filter having a
transfer function of the form e-ik/w
where K is a
constant that can be adjusted by the listener for an
optimum setting, and W is angular frequency in
radians. The group delay of such a filter equals
-K/y,12~ representing a time advance which becomes
larger without limit at very low frequencies. To
implement this directly would require infinite
processing delay, so the correction is implemented in
a modified form having substantially the correct form
over the audible frequency range (above around
l6Hz).
One such approach is as follows:
The Bessel filter 1/B,~(s) is an n-th order low-pass
filter whose phase response is a maximally flat
approximation to unit delay. Hence Bn.(-s/2)/Bn(s/2)
is a n-th order all-pass with the same property.
Hence Bn(K/(2s))/Bn(-K/(2s)) is an n-th order acausal
WO 92/10876
PGT/GB91/02200
- 49 -
all pass whose phase response is a maximally flat
approximation to -K/w for large w.
One could therefore calculate the corresponding
function of w (s=iw) in the frequency domain and take
the Fourier transform to obtain the corresponding
impulse response. This will be acausal but will
contain reverse-time exponential tails that die away
at a reasonable rate, so that an available
pre-response of, say 0.25 sec would be adequate.
A disadvantage of this technique is that all
coefficients of the transversal filter need to be
re-calculated each time the user demands a new value
of K, and this makes "continuous" manual adjustment
in response to a knob very difficult.
To overcome this difficulty, one can determine Kmax'
the maximum value of K likely to be needed, implement
a corresponding acausal response as a transversal
filter 62a, then subtract off the unwanted phase-shift
corresponding to Kmax K by means of a causal all-pass
filter 62b, which can be implemented recursively and
easily adjusted. The transversal filter 62a implements
Bn(Kmax/(2s)/Bn(-Kmax/(2s)) (acausal all-pass) and the
recursive all-pass filter 62b implements
Bn(-(Kmax-K)/(2s))/Bn((Kmax-K)/(2s)) (causal).
This structure is illustrated schematically in Figure
19; the transversal filter coefficients will in
practice be predetermined and will form part of the
filter 5, whereas the coefficients of the causal
infinite impulse response filter (typically a third
order filter) are swiftly calculated in real time by
2U9~190
WO 92/108'I6 PCT/GB91/02200
the coefficient calculator 6 in response to variation
of the value of K supplied as a control signal by a
phase control knob operated by a listener. Figure 20
illustrates the disposition of the phase control
5 filter 62 in the embodiment of Figure 12. Note that,
in this case, the delay path 57 is required explicitly
to be present.
Several pre-set Kmax values may be supplied, allowing
10 the user to select different ranges of correction.
WO 92/10876
'"' ~ 2 ~ 9 ~ 19 0 P~~GB91102200
- 51 -
As stated above, it is preferred that the phase
response of the compensation filter should be
inversely proportional to frequency in the mid and
bass frequency region. However, departures from this
proportionality are acceptable. In fact, the phase
response of loudspeakers in the bass region is
generally not exactly proportional to 1/f, but often
departs from such exact proportionality by a phase
angle of a few degrees, so that corresponding
variations in the correction of filter are of no
importance.
It may also be desirable, for other reasons, to
provide a filter which approximates the inversely
proportional phase response but has excursions or
ripples therefrom. For example, as will later be
discussed, it is desirable in many applications (such
as audio visual reproduction, where synchronisation
with a video signal must be maintained) to avoid long
bulk delays in the audio reproduction chain. However,
to precisely specify the phase response of the filter
to a good approximation to the desired inversely
proportional frequency relationship requires a large
number of filter stages and hence, since the phase
correction filter is acausal, a long preresponse and
corresponding filter delay, perhaps as high as
several hundred milliseconds. Accordingly, in
applications (such as audio visual reproduction) where
it is desirable to avoid lengthy delays, a filter
deviating from proportionality but having a lower
filter preresponse and hence delay is provided, in one
embodiment of the invention.
W0 92/10876 ~ PCT/G~91/02298
'~U'9~~90
- 52 -
One particularly preferred type of such filter has a
phase response which closely approximates inverse
proportionality to frequency over the mid-bass
frequency ranges, but deviates therefrom by
progressively increasing deviations at progressively
lower frequencies; the filter is thus linear over the
audio range where bass phase errors are particularly
noticeable (around 200 or 300 Hz).
Some discussion of the suitable filters and of their
derivation will now be given.
One example of a phase compensation or correction
filter has the response (g-z)/(1-gz), where, as
conventional; z 1 indicates the unit sample delay.
This filter defines an acausal all pass network if the
magnitude of g is less than 1, and its phase behaviour
compensates the phase response of, for example, a
loudspeaker having a low frequency roll off at l2dB
per octave below its bass cut off frequency and a
phase response corresponding to that of the all pass
filter (g-z 1)/(1-gz-1).
This correction filter can be implemented with an
impulse response of a realistic length if impulse
response terms at a sufficiently low level (for
example, below -100dB) are omitted. Where this figure
is taken, the preresponse length of the filter is
11.5/(1-g) samples.
3O
The phase response of the acaus~l filter (g-z)/ (1-gz)
is not exactly inversely proportional to 1/f at
frequencies above the cut off frequency of the
loudspeaker. For g very close to 1 in value, the phase
response of the acausal phase compensation filter
W0 92/108?6 '
PCT/GB91/a2200
,,..,..
~20~g190
- 53 -
approximates that of -(1+jwz)/(1-jwz) where w is
angular frequency and z is the time constant (equal to
1/(1-g) samples) of the filter, which has a phase
response, at angular frequency w, of 2cot 1 (wz) - 2wi
(radians) at higher frequencies. However, for wz=1,
2 cot 1(1) - 2n/4 - 1.57 radians which deviates from
the ideal 2/wz by 0.43 radians. For wz=2, 2 cot'
(wz)-2/wz = - 0.073 radians = - 4.17°. Thus the
deviation from the ideal inverse frequency law is less
than 0.1 radian above about twice the cut off
frequency of the loudspeaker, (typically above about
70 Hz), the deviation reducing rapidly with increasing
frequency.
Although the acausal phase compensation filter
(g-z)/(1-gz) has a shorter preresponse (of 11.5T) than
filters that more exactly compensate for a phase
response proportional to 1/f, it is also possible to
use more elaborate acausal phase compensation filters
with an even shorter preresponse of around 3z or 4z
(corresponding typically to a preresponse of around 10
or 15 msec for a loudspeaker cut off frequency of 50
Hz).
Referring to Fig. 37a, the impulse response of the
bass phase correction filter described above therefore
corresponds generally to a time reversed version of
the all pass (i.e. phase only) part of the Bessel
correction filter described above, and thus has the
general form of an exponential attack of infinite
length prior to the "t - 0" or main term of the
impulse response. Truncating this infinite
preresponse would lead to ripples in the phase
response, but would also lead to ripples in the
amplitude response so that the filter would no longer
W09Z/~0876 ~~~$~:'~O PCT/GH9~/-
- 54 -
be an all pass filter. However, as noted above,
truncation of extremely low magnitude terms in the
impulse response is generally acoustically
acceptable.
In a preferred embodiment, however, we provide a new
method of truncating the preresponse of an all pass
correction filter of this type, whilst still
maintaining its amplitude response intact. This
enables the realisation of a filter having a shorter
bulk delay (i.e. preresponse). This is achieved by
employing a filter which corresponds to a cascade of
the above described filter and a further all pass
filter which has the effect of truncating the
preresponse; since both filters are all pass, the
filter corresponding to their cascade must also be all
pass and hence distortion of the amplitude response is
avoided.
A first, relatively crude, method of doing so employs
a causal all pass truncation filter as follows:
(g-z)(1-gnzn)z n~(1-gz)(1-gnz n) -
(z n-gn)(g-z)~(1-gnz n)~(1-gz)
WO 9Z/10876
PCT/GB91/02200
24~'~~.~0
- 55 -
where the value of n is selected such that gn is small
(say <0.1), the term (1-gnzn) is factorable, using
simple arithmetic, by the term (1-gZ), so that the
combined filter response is:
z n(g-z)(1+gz+g2z2+.....+gn-lzn-1)/(1_gnz'n)
In this filter, the denominator is causal and so is
the numerator. The impulse response of this filter is
indicated in Fig. 37b, and the preresponse will be
seen to be truncated to n samples. As a consequence
of the truncation, low level spaced components in the
post response are introduced; these render the post
response portion of the impulse response considerably
longer, but do not thereby extend the bulk delay of
the filter (which is dictated by the preresponse) and
can in practice readily be realised using a simple
recursive filter structure.
The factor (z-n-gn)/(1_gnz-n) _ z'n (1_gnzn)/(1_gnz-n)
produces an overall time delay z-n of n samples, plus
phase deviations of order ~2gn radians for small
values of n, since the numerator and denominator can
both be in error by up to ~gn radians.
A preferred implementation of this filter provides a
finite impulse response filter for implementing the
numerator (providing the bulk delay necessarv for
realising the preresponse) and a recursive filter for
realising the denominator, the two filters being
cascaded in series; as described above, the recursive
filter coefficients may be varied in use to vary the
phase correction.
WO 92/10876 ' '- ' ~ v PCT/GB91/02200
- 56 -
Whilst this technique of reducing the preresponse does
so without changing the amplitude response of the
filter, in some applications the sharp step in the
impulse response may, as noted elsewhere in this
patent, be psychoacaustically audible. Accordingly, a
more preferred embodiment which avoids this will now
be described.
Referring to Fig. 37c, a smooth transition in impulse
response between the value at a sample -n of the
response of Fig. 37a and 0 at some sample -(m+n) may
be produced by averaging the n+1 impulse responses
corresponding to those which would be produced by
truncating the impulse response of Fig. 37a by
multiplying by a truncating all pass filter of the
above type in which n is replaced by (n+i), where i
is each integer from 0 to m. It would in principle be
possible to provide a bank of filters, each truncating
the impulse response at a value one sample different
to the others, between (-n) and -(n+n), and summing
their outputs. However, the same effect is achieved
by employing a more complex causal all pass truncation
filter:
( g-z) (1_~gn+~a.Z+n+j)z-n-m
i-y 7
(1_gz) (1_~gn+jajz_n_j)
j=o
The coefficients a~ are normalised to sum to unity, so
that the numerator is divisible by (1-gz); in one
example, all values of aj are equal to 1/(m+1), which
provides a smooth attack in the preresponse as
illustrated in Fig. 37c.
WO 92/176 ~ O' 9 819 0 PCT/GB91/02200
- 57 -
In this particular example the phase ripple resulting
is due to the factor:
(1-~gn+~a~zn+~)
(1_Egn+Ja z_(n+J))
and consequently decreases with frequency.
In general, it is found that acausal phase
compensation can acceptably deviate from being
proportional to 1/f within the audio band if the
deviation is less than about 0.1 radians above a
frequency corresponding to about twice the loudspeaker
bass cut off frequency, and if the phase deviation
decreases within increasing frequency f more rapidly
than 1/f (or, in general, some constant times 1/f).
Referring to Fig. 37c, in practice, the values of n
and m may be selected such that m - n/2, or
thereabouts, to give a fairly rapid but smooth fade in
to the impulse response. The selection of the values
of g, n and m is determined in part by the maximum
acceptable bulk delay (n+m) and in part by the maximum
acceptable phase ripples. Recalling that z, the time
constant of the all pass acausal filter the
preresponse of which (shown in Fig. 37a) is to be
truncated, is equal to 1/ 1 n
( -g), if, for example, g -
0.05 then n+m = 4.5z.
The above described technique of taking a first filter
having a predetermined amplitude and phase response
and exhibiting an impulse response with a substantial
preresponse, and then generating therefrom a second
filter having an abbreviated preresponse but
exhibiting the same amplitude response (at the cost of
WO 92/10876 ~ ~ ~ ~,1 ~ Q PCT/GB9~/OZZ00
_ 58 -
some phase distortion), by multiplying the first
filter by a causal all pass network, can be extended
to other problems than the present described context
of loudspeaker compensation. In general, the
inventive technique of so doing comprises providing
that the numerator of the truncating all pass filter
is such that it can be factored exactly by the
denominator of the first filter of the impulse
response for which it is desired to truncate. This
can be expressed in general as:
(Pk(z) (Qn+m)(z)z
(-z)k(Pk)(z 1) (Qn+m)(z 1)
where Pk and Qn+m are polynomials of degrees k and n+m
respectively. The first factor is a time reversed
(and hence acausal) kth order all pass whose phase
response is designed to be broadly proportional to 1/f
in the audio band above the loudspeaker cut off
frequency, and the second factor is an (n+m)th order
causal all pass network whose response comprises an
impulse of amplitude near unity plus relatively low
level re- and -1
p post-response tails, such that Pk(z )
factors Qn+m(z)z m n exactly. In general, the first
factor (Pk(z)/(-z) Pk(z 1) may be factored into
k terms of the form (gj-z)/(1-gjzj) (j - 1 to k)
whera gj is a complex valued factor,
and the second factor may be factored into k terms of
the form:
WO 92/~OS'16 PCT/GB91/02200
~2098~9a
- 59 -
"~' ~~-( n.~l
1-Eg a . z .~
C=o j J~~ J
1-' gJ aJz~n~ 1
for j = 1 to k, where for each j,
aj.l 1
and where nl + " .. nk = n
ml + .... mk = m
where n+m samples is the total latency or preresponse
of the overall product
Thus in general, a complex kth order acausal all pass
response Pk(z)/(-z)kPk(z 1) may have its preresponse
truncated by multiplying by an all pass factor which
is the product of k causal all pass factors each
having the effect of truncating one of the k first
order factors of (13) that kth order all pass
response.
Such a modified all pass compensation, having a
limited preresponse and latency, deviates from the
ideal phase response proportional to 1/f to a limited
degree, but still maintains the substantial benefits
of a phase compensation proportional to 1/f.
By reducing preresponse, and hence latency, to a
figure preferably below 50ms, the effect of time
delays causing loss of synchronisation between sound
and an associated picture can be minimised without
using a frame store or similar time delays for the
picture. Also, in studio monitoring applications, the
effect of any modification of a sound can be heard
WO 92/176 ~ ~ ~ ~ ~ ~ PCT/GB911A2~00 y
- 60 -
without an excessive time delay between adjusting a
control and hearing its effect.
Filter Power Limiter
It is of considerable importance that it should be
impossible for the filter S to boost bass frequencies
to a level where they might overload and ultimately
damage a loudspeaker. To ensure that this is
impossible, a preferred embodiment of the invention
includes a power limiter stage 63 following the filter
5. Where a separate low frequency equalizer filter 55
is provided, as shown in Figure 20, the limiter 63 is
provided following the filter SS.
Referring to Figure 21, the limiter 63 acts as a
variable gain in the filtered signal path, the gain
being unity for acceptable signal amplitudes. For
signal amplitudes which are considered unacceptable,
beyond a predetermined maximum threshold, the gain is
such that the signal is attenuated. The limiter could
merely comprise a clipping arrangement, but it is
preferred to provide a transfer characteristic of the
form shown in Figure 21, with a gain of unity and a
smooth transition above a first threshold T1 to a flat
characteristic at a second threshold T2. This reduces
the unacceptability of distortion introduced by the
limiter 63.
Rather than using a limiter responsive to the
instantaneous level of the signal, a variable gain
control circuit responsive to the signa' envelope
level may be employed, giving lower distortion.
WO 92/10876 . ~ ~ ~ ~ ~ ~ ~ PCT/GB91/02200
- 61 -
Test Signal
The operation of the test signal generator 8 in a
preferred embodiment will now be discussed. In
principle, the test signal generator 8 could generate
any type of signal having a predetermined response or
transfer function, and the response measured at the
microphone 7 could be divided by the signal response
to yield the response of the loudspeaker/room path.
However, processing is naturally much simpler if the
response of the test signal generated by the test
signal generator 8 is unity, i.e. evenly distributed
across the frequency spectrum.
Considering the problem in the time domain, the
simplest test signal is a single impulse; this enables
the impulse response of the signal path to be measured
directly. However, since the effect of the path is to
distribute the energy of the impulse over a
considerable time (up to several seconds), the
amplitude of the test impulse needs to be extremely
high which is undesirable with real amplifiers and
loudspeakers. Alternative test signals which have
greater energy but a similar frequency spectrum have
been developed; various types of pseudo-random
sequences are known on the one hand, and on the other
hand it is known to use a so called "chirp" signal
comprising a continuous signal with linearly rising
frequency, of the general form cos/sin (2 n Kt2)
as shown in Figure 22a and 22b. At an instant t the
instantaneous frequency of this signal is 2K.
Because the reverberation period of the room can be
long, it is necessary to wait for a settling period
after the frequency sweep has finished to make sure
that the room response has died down before commencing
W0 92/108?6 PCT/GB91fOZ200
~o~s.~ ~o
- 62 -
a second sweep. Typically, the waiting period can be
as long as seven times the length of the frequency
sweep period. This discrete frequency sweep signal is
therefore not ideal since considerable time is wasted
or, viewed in another way, the energy of the signal is
again dissipated over a long period.
An alternative to a discrete frequency sweep would be
to provide a signal which swept up in frequency and
then down again continuously as shown in Figure 22c.
One simple method of doing so would be by using a
continuously increasing frequency sweep of the form
cos (or sin) (nt2/n), in a sampled system where time
is sampled in steps of unity. Aliasing will occur
commencing at t=n/2, after which the instantaneous
frequency falls again to reach zero at t=n as shown in
Figure 22d.
A problem with each of these types of chirp test
signal is that to derive the complex Fourier transform
required for a complete amplitude and phase
description of the system response, it would be
necessary to generate a complex test signal e~ltZ/n.
Unfortunately, this is not physically possible; one
must use either a sine or cosine signal and process
the measured response appropriately.
Preferably, therefore, the test signal generator
according to the present invention in one aspect
generates a test signal c~ the form cos (or sin)
(nt2/n+nt/2n) as shown in Figure 22e and 22f. It is
easily shown that at t=0, this signal has a frequency
1/4n and a phase of zero. At t=n, the frequency
again is 1/4n, but the phase is n/2. In general,
the second n samples are a repeat of the
WO 92/10876 PGT/GB91/02200
2098190
- 63 -
first but with a phase shift of 90°, and the third n
samples are a repeat of the first but with a phase
shift of 180°. The fourth block has a phase shift
of 270°, and the fifth block of n samples repeats the
first.
This test signal therefore provides two quadrature
(i.e. sine and cosine) components from which the
complex Fourier spectrum can be reproduced, but does
so without a discontinuity so that it is unnecessary
to wait to allow reverberations to die away in between
the two quadrature components.
Another advantage is that since the signal over the
third block of n samples is the phase reversed version
of the signal over the first block of n samples,
subtracting the corresponding blocks of measured
signal samples will double the value of measured
signal components but any second order non-linearities
(produced, for example, by loudspeaker overloading at
low frequencies due to the voice coil travelling
outside the magnetic gap or rectification effects)
will be cancelled out. It is also demonstrable that
by similar processing the effects of third and fourth
order harmonic distortion can be reduced.
In general, the effects of high order harmonic
distortion can be reduced by using a test signal of
the form:
"~ cos ( rct2/n+2nt/qn+~ ) .
where ~ is any constant phase offset, and q is the
order of the harmonic to be cancelled and applying
appropriate processing to the received signal. Still
WO 92/10876 2 0 9 819 0 pL'f/GB91/02200
- 64 -
more generally, the term 1/q may be replaced by p/q,
where p and q are relatively prime integers.
An alternative signal having a similar effect has the
form cos (nt2*m/n), where m is an integer
relatively prime to n. Suppose, for example, n=1024
and m=5, the rate of increase of frequency will be
five times as fast as that of the signal of Figures
22a and 22b. At t=0, the signal frequency is zero,
but because m is not divisible into n, the next point
at which the signal passes through zero would occur
after a non integer number of samples (204.8). Even
interpolating between sample point 204 and 205, the
phase has not returned to zero. In fact, although
the frequency appears to repeat after 204.8 samples,
the phase does not repeat until 1024 samples. Because
the low frequency energy of the signal is distributed
over time compared to that of Figure 22a, there is
less low frequency non linear distortion.
Particularly useful values of m/n are those which are
furthest from being simple ratios (in other words are
highly incommensurable); the so called "golden ratio"
is one example of such a ratio, and others are
obtained from successive terms of a Fibonacci series.
Such ratios give rise to a test signal which
approaches the properties of a pseudo random signal,
which minimises the non linear distortion problem
referred to above.
Referring to Figure 23, one way of providing a test
signal generator 8 is to provide, in successive
addresses of a read only memory (ROM) 8a, the
successive signal values stored in digital form to be
output as successive time samples. The data bus of
WO 92/10876 ~ 'Q ~ 8 ~ 9 0 PCT/GB91f0?.200
- 65 -
the ROM 8a is connected to the digital output bus of
the signal generator 8, and the address bus of the ROM
8a is accessed by the output of an up-counter circuit
8b clocked by the system clock 8c so as to access
successively higher addresses within the ROM 8a. It
is unnecessary in practice to provide the counter
circuit 8b and clock 8c as separate circuit
components; they preferably form a part of any
suitable digital processor such as that which performs
the digital filtering, operating under a suitable
stored program. Similarly the ROM 8a may form a
partitioned area of a general purpose storage device
within the apparatus.
The above types of test signal are examples of a more
general type of test signal according to an aspect of
the invention. In the above test signals, a signal is
generated which has a periodically varying frequency
and a periodically phase, and the phase repetition
period exceeds the frequency repetition period so that
the coefficient calculator 6 can refer to several
measured signal portions which contain corresponding
frequency information, but are shifted one relative to
the other by predetermined phase increments. It will
be clear that there is in fact no need for the signal
to have a periodically varying frequency, provided the
signal is broad band {i.e. includes frequency
components across the range of interest) and is
periodically repeated; the above chirp signals are
special cases of this general class of signals.
Accordingly, in this aspect, referring to Figs. 38
and 39 the generator 8 comprises means 8d for
generating a reference test signal which is broad band
and means 8e for producing a time dependant phase
shift of the test signal 8d. The means 8d, 8e, could,
WO 92/ 1076 ~ ~ ~ ~ ~ ~ y PCT/GB91 /OZ~00 ~_
- 66 -
of course, be realised by a single look up table
embodying successive values of the phase shifted
reference signal, as is provided in Fig. 23.
The reference test signal generated by the signal
generator 8d could, as above noted, be a chirp signal
(i.e. a signal with a periodically varying frequency),
or it could be a Gaussian random signal or some other
white noise signal, or it could be a single impulse;
moreover, although these examples all have relatively
constant amplitude frequency components, it could be
any other signal provided that it includes frequency
components of known amplitudes across the frequency
band which the calculator 6 is to operate. The
reference signal generator 8d may produce a digital or
analog output.
Referring to Fig. 39, the phase shifter 8e may
comprise means 8f, 8g for generating a pair of signals
having a phase angle of 90 degrees between them, and
means (8h,8i,8j) for performing a time varying
rotation transformation on the signals, by multiplying
one by a time varying sine term and the other by a
corresponding time varying cosine term,and summing the
two at an adder 8j. It will usually be convenient
that the constant phase term "e" may be 0, so that one
of the signals produced by the means 8f, 8g
corresponds to the original signal from the signal
generator 8d.
If the signal from the signal generator 8d comprises
an analog signal, the means 8f, 8g may comprise a pair
of analog phase shift networks having outputs mutually
in quadrature; such networks generally have a
frequency dependency, which is dealt with (reversed)
by the reverse phase shifter 6a.
WO 92/10876 PCT/GB91/02200
209194
If the output of the signal generator 8d comprises a
series of digital samples, and the signal generator 8
includes a store dimensioned to hold samples for one
period of the reference signal, the phase shift means
8f may comprise digital means for performing a Hilbert
tranform to generate the phase shifted signal
therefrom.
Referring to Fig. 40, the reverse phase shifter 6a
may comprise means 6d, 6e for generating a pair of
output signals in quadrature; as with the phase
shifter 8e, one of the output signals may correspond
to the signal received from the system under test, or
alternatively there may be a constant phase shift a
common to both outputs (which need not be the same as
the constant phase shift, if any, introduced by the
means 8g, 8f in the phaser shifter 8e).
The reverse phase shifter 6a conveniently comprises
means 6f, 6g for producing a pair of quadrature phase
shifted output signals, corresponding to the
equivalent means 8f, 8g employed in the signal
generator 8, and cosine and sine generators 6h-6k by
which the outputs of the phase shift means 6f,6g are
multiplied to generate, as outputs 6d, 6e, a pair of
orthogonally reverse phase shifted signals, with phase
shifts (-~(t)), (90-~(t)).
The sine and cosine function generators 8h, 8i, 6h-6k
may all conveniently be provided as look up tables,
addressed by a clock signal as shown in Fig. 23, so as
to produce time varying digital output signals which
are then multiplied by the signals from the phase
shift means 6f, 6g or 8f, 8g.
The averager 6b comprises means for storing signal
WO 92/i0876 PCT/GB91/02200
samples from the reverse phase shifter 6a which
correspond to a complete repetition period of the
reference signal generated by the signal generator 8d.
Referring to Fig. 39, after a complete cycle or period
of the reference signal has been applied to the system
under test, at least one further such period is then
generated; although the reference signal produced by
the signal generator 8d is the same, it will have a
different phase shift due to the phase shifter 8e.
The samples corresponding to the second period, and as
many further periods are required, are then likewise
stored by the averager 6b.
Once the required number of periods of the reference
signal are completed, the corresponding samples in
each stored portion are averaged to form an average
stored portion. For instance, the first sample stored
from the first stored period of the reference signal
may be added to the first sample stored for the second
stored period of the reference signal and to the first
sample stored for each further stored period, so as to
derive an arithmetic mean value over different phase
shifts for the first sample, and likewise to derive
averaged sample values for the rest of the reference
signal cycle from the time aligned samples of the
first, second and further stored portions.
In fact, it may be convenient to form a running
average or a sum, by adding each reverse phase shifted
sample to a corresponding stored value from previous
reference signal periods, so that the averager 6b
needs only contain storage means dimensioned to hold
samples for a singal reference signal cycle. Equally,
however, other types of average than the arithmatic
mean could be employed.
WO 92/1?6 2 0 9 g 19 ~ rcr/cB9~/o2200
- 69 -
In a particularly preferred embodiment, the function
~(t) is selected such that the phase shift repeats
after an integer number of cycles of the reference
signal generated by the reference signal generator 8d;
where the phase returns to its initial value after a
number q of cycles, so that ~ = A+2npt/nq, the test
signal generator 6 is arranged to generate q cycles
(or an integer multiple thereof) and the averager 6b
is arranged to generate sequence of averaged sample
values from a corresponding number of cycles.
It can therefore be seen that each averaged sample
produced by the averager 6b corresponds to the corres-
ponding point in the reference signal, passed through
the system under test, averaged over phase shifts of
~+2n/q, ~+4n/q ... ~+2nr/q.
This can be shown to cancel second and higher order
harmonics, in exactly the same way as the above
described frequency swept chirp signal (which is a
particular case of this aspect of the invention).
An explanation of how this beneficial distortion
cancellation takes place is most easily described in
the frequency or Fourier domain. For convenience, if
n - 1 second and q = 10, the reference signal output
by the signal generator 8d comprises, as shown in Fig.
41a, harmonics at 1 Hz, 2Hz .... . Fig. 41b shows
that, if the orthogonally phase shifted outputs of the
phase shift means 8f, 8g are considered as real and
imaginary parts of a complex signal ('analytical
signal"), the negative frequency components of the
line spectrum are thus removed.
WO 92/10876 PCT/GH91./02200
__
- 70 -
Since the phase shift produced by the phase shifter 8e
repeats every 10 cycles (i.e. every 10 seconds) and
the phase shift produced by the multiplications with
the sine and cosine values produced by sine and cosine
multipliers 8h, 8i give a progressive phase advance,
the time varying phase shifts correspond to a
frequency offset of 0.1 Hz. Therefore, as shown in
Fig. 41c, the complex output phase of the sine and
cosine multipliers would be a phase shifted signal
having only positive frequency components. However,
since the sine and cosine components are added
together at the adder 8j to produce a real result, the
signal actually applied to the system under test is,
as shown in Fig. 41d, a signal having positive and
negative frequency components lines at frequencies of
+/- (n + 0.1 Hz).
If the system under test introduces harmonic
distortion into the test signal, the result is shown
in Fig. 41e; the line at 0.1 Hz has harmonics at 0.2
Hz and 0.3 Hz, etc; the line at 1.1 Hz gives rise to
harmonics at 2.2 Hz, 3.3 Hz, 4.4 Hz etc; the line at
2.1 gives rise to harmonics 4.2, 6.3 Hz etc, and so
on. Thus, it will be seen that the effect of applying
the phase shift to the reference signal is to generate
a signal in which the line spectrum components are no
longer harmonically related, so that the harmonics
introduced by distortion can be separated in the
frequency domain from the line spectrum of the test
signal.
Referring to Fig. 41f, if the two quadrature outputs
6d, 6e are taken as the real and imaginary components
of a complex measured signal, the effect is once more
to suppress negative frequency components. The effect
of the reverse phase shift here is to shift down the
WO 92/10876 2 Q 9 S 19 0 P~T~GBgl/42200
- 71 -
frequencies of all components by 0.1 Hz, so that the
spectral lines of the reference signal have returned
to 0, 1, 2, .... Hz and the distortion harmonics are
now at 0.1, 0.2 .... , 2.1, 3.2 ... Hz etc. Finally,
the averaging process performed by the averager 6c
eliminates all components (e. g. the distortion
introduced harmonics) except those at an integer
multiple of 1 Hz. The averaged signal samples can
then be used to find the impulse response of the
system under test, in the same manner as described
above, except that account must be taken of the fact
that the averaged signal frequency content has been
shifted down 0.1 Hz relative to the signal supplied to
the system under test.
For example, if the analyser 6c performs a Fourier
transform on the stored averaged signal samples, the
signal values at 0, 1, 2, 3 ... Hz are generated by
interpolation from the peaks derived from the
transform, which actually relate to test signal
frequencies of 0.1, 1.1, 2.1 ... Hz.
The transform coefficients thus derived are then
divided by the (known) coefficients corresponding to
the Fourier transform of the reference signal, so as
to deconvolve the impulse response of the reference
signal and leave that of the system under test.
Various further modifications to the above described
technique can be made. For example, although it is
preferred that the phase variation ~(t) is linear
(or at least monotonic) with time, other functions
could be employed although less smooth functions (for
example including steps) inevitably lead to some
extent to generation of false frequencies.
WO 92/10876 PCT/GB9ITQZ~O
:~ ~l '~~ ~ ~'
- 72 -
Further, the phase repetition period need not be an
exact multiple of the period of the reference signal;
if it is not, then the averagor 6b is arranged to
perform "ergodic" averaging over a sufficiently large
number of reference signal repetition cycles. The
averaging means 6c, in this embodiment, is arranged to
apply a windowing function to the samples prior to
averaging, so as to weight each sample by a windowing
constant; the shape of the windowing function is
preferably selected such that the sum of the windowing
constants applied to the samples which are averaged
together to produce a single averaged sample is unity.
Considering the received signal samples over the whole
plurality of reference signal cycles, the shape of the
windowing function is preferably a smooth curve
tapering to 0 at either end and rising to a maximum
towards the middle; one example of a windowing
function which satisfies this is a B-spline of higher
order (for example a cubic spline), having curve
control points ("knots") equally spaced at a distance
n samples (where n is the number of reference signal
repetition periods) from each other, convolved with a
rectangle function.
Rather than performing the above described averaging,
it would in principle be possible to separate the
distortion harmonics from the test signal harmonics by
employing a comb filter or the like.
MULTIPLE SPEAKER SYSTEMS
In the preceding description, the problem of
equalising one loudspeaker in an acoustic environment
has been described. However, at present many audio
reproduction systems provide two speakers la, lb,
whether or not the source material is also provided in
stereo, and it has been proposed to use a larger number
PCT/GB91/02200
....
WO 9Z/10876 2 0 9 $;~ 9 0
- 73 -
of speakers (for example, quadrophonic systems
employing four speakers to enhance the sound image.
If a separate equaliser filter is derived for each
loudspeaker/acoustic environment path, then .it is
likely that the overall delay in the filters will
differ such that the sound from different speakers
will arrive at the compensated zone at different
times, creating an undesirable echo and disrupting
the stereo effect. Some form of equalisation for each
loudspeaker which takes account of the equalisation
for other loudspeakers is therefore desirable.
Delay Equalisation
In one embodiment shown in Figures 24 and 25a, this is
provided by deriving, as above, a separate
compensating filter 5a, 5b for each
loudspeaker/environment path, and introducing into the
signal path pure delay stages 70a, 70b calculated so
as to align the time of arrival of the initial
transients of sound from each loudspeaker within the
compensated zone.
Calculating such a delay may be done, for example, by
providing a test signal from each loudspeaker la, lb
separately and timing the delay over each path to the
microphone 7; calculating the difference in times
between the longest and the or each shorter time; and
providing in the compensating filter for the or each
loudspeaker la, lb which gave a shorter arrival time a
delay stage 70a, 70b corresponding to its time
difference.
Since the compensation of the acoustic environment 2
is not linear phase, the group delay will differ with
the acoustic signal frequency. Although a single
W0 92/108'6 : , ; PCT/GB91/OZ~tltl _.
2o9s19~w
- 74 -
delay stage is reasonably effective in restoring the
stereo effect, the problem is not entirely eliminated
because, since the compensation of the acoustic
environment 2 is not linear phase, the group delay
varies with signal frequency.
For stereo systems, it is strongly preferred that the
acoustic environment compensation stage should have a
limited pre-response, since this should make the phase
response of the entire signal path somewhat more
linear with frequency and, since the signal paths
from the two loudspeakers deviate less from an ideal
response, they will be more similar to each other than
if minimum phase compensation for the acoustic
15~ environment were used.
In an alternative, and preferably additional, step,
the delays 70a, 70b are arranged to have a frequency
dependency so as to give substantially equal arrival
times to signals from the two loudspeakers la, lb
irrespective of signal frequency. This does not imply
that the signal path from each loudspeaker to the
listener position 3 is itself linear phase; merely
that the degree of deviation from linear phase is
essentially the same for each path.
The group delay as a function of frequency may simply
be determined by passing a plurality of test signals
of different frequencies through the combination of
the filter 5, loudspeaker 1 and acoustic environment 2
to the microphone 7, and measuring the time of flight
of each signal at each frequency for each loudspeaker.
Alternatively, a frequency swept test signal of the
kind discussed above may be employed. The group delay
is preferably derived over relatively broad frequency
WO 92/10876 PCT/GB91/02200
....
- 75 -
intervals; for example, one group delay value for each
1/3 of an octave.
Having derived the group delay at a number of
frequencies for each loudspeaker, the corresponding
delays for the loudspeakers are subtracted for each
frequency to give the inter-channel delay as a
function of frequency. The filter calculator 6 then
calculates the parameters of an all pass filter having
a group delay against frequency response such as to
substantially equalize the inter-channel delay, and
the delay 70a or 70b is replaced by an all pass filter
exhibiting this behaviour.
Matrix Compensating Filters
Referring to Figure 24, with polyphonic (e. g. stereo)
source material, the desired effect is that, for a
human head at a listening point 3 in an acoustic
environment, each ear should receive a predetermined
amount of signal from each loudspeaker la, lb, the
predetermined portion for the left ear of the left
hand loudspeaker should be greater than that for the
right ear, and vice versa.
The presence of the acoustic environment 2 can however
upset the proportions of the signals from the
respective loudspeakers which reach each ear and thus
the stereo sound image perceived by the listener. This
can be compensated by providing, in addition to
compensating filters in each of the loudspeaker paths,
filters 50a, 50b linking the two loudspeaker paths so
as to provide to each loudspeaker la, lb a filtered
proportion of the signal from the other loudspeaker
path as shown in Figure 26.
It may be convenient to position the filters 50a, 50b
WO 92/1087b ~ PCT/GB91/02200
~0981~~0
- 76 -
to filter the outputs of the filters 5a, 5b so that it
is unnecessary to include in the filters 50, 50b any
substantial element of loudspeaker correction
(assuming the loudspeakers la and lb to be matched, as
is usual. The combined filtering system 5a, 5b, 50a,
50b, may however be viewed as a matrix filter having
two inputs and two outputs.
Reverberation Reduction
A known technique of noise cancellation employs a
loudspeaker and a microphone positioned in close
proximity. The microphone receives sound representing
the sound incident upon the loudspeaker, and a
processing or filtering circuit produces a signal
supplied to the loudspeaker which is in antiphase to
the signal incident upon the microphone, so that the
loudspeaker signal cancels the incident signal. This
cancellation is effective over an area or volume around
the loudspeaker. This effect could be used to reduce
reverberations in acoustic environment, where the
loudspeaker is positioned at a reflecting surface so
that an incident wave is cancelled rather then being
reflected.
We have realised, that in such an application, a
separate microphone is unnecessary in use since the
signal incident upon the loudspeaker is in essence the
source signal filtered by the response of the acoustic
environment. Referring to Figure 27a, a cancellation
loudspeaker lc can therefore be provided within a room
connected via a cancellation filter 50c to the audio
source 4. With a single cancellation loudspeaker, the
signal to be produced by the loudspeaker lc should
correspond essentially to the signal received at lc as
processed by the filter path via the compensation
filter 5a, loudspeaker la and acoustic environment 2.
WO 92/108'76 2 0 9 S 19 0 PGT/GB91/02200
_ 77 _
As discussed above, the response of the loudspeaker
la is substantially compensated by the filter 5a; the
principal component of the filter 50c is therefore due
to the differences in response of the path through the
environment 2 to the zone 3 For which the filter 5a is
optimised and to the loudspeaker lc. One significant
component of this is a time of flight delay, since
the speaker lc operates to cancel sound reaching a
reflecting surface beyond the listening position 3.
In general, some or all loudspeakers la, lb, lc may
act both as sound reproducing loudspeakers and as
cancellation loudspeakers. These two functions are
however conceptually distinct as will be explained
below.
As stated above, we have found that long lasting
reverberations, even if of relatively low amplitude,
are noticable by the listener. When more than one
cancellation loudspeaker is employed, there is no
reason why the or each microphone used to derive the
parameters of the cancellation filters should be
positioned near the cancellation loudspeakers. What
is desired is to derive cancellation filters such that
the reverberations in the room perceived by a listener
within the compensation zone 3 are reduced. It might
therefore be thought that the best position for the
microphones is in or around the compensation zone 3.
However, we have found that whilst this will tend to
reduce the amplitude of early parts of the
reverberation envelope, it has significan~l;~ less
effect in reducing the long tail of the envelope which
is perceptually more noticable. We have found,
surprisingly, that it is preferable to position the
microphones in corners of the room and derive the
parameters of the cancellation filters to minimize the
WO 92/108"!6 PCT/GB91/02200
2098190
_ ,8 _
signals received by the mirophones at those
positions.
Both reproducing loudspeakers la and cancellation
loudspeakers lb and lc may be provided within a room,
although in general each loudspeaker may reproduce and
cancel sound. The audio source 4 is connected
directly to the reproducing speaker la and is
connected to the cancelling speakers lb and lc via
respective cancelling filters 50b and 50c. In
deriving the cancellation filters, four microphones 7a
- 7d are provided near the corners of the room,
although diametrically opposite corners of a cuboid
room contribute essentially identical information, so
no more than four microphones in corners are
necessary. If further microphones are available, they
may be positioned within the interior of the room. One
suitable location for the microphones 7a - 7d in
practice is physically within the housing of the
loudspeakers la - lc; with some moving coil
loudspeakers, the loudspeaker itself can be employed
as a microphone.
The first step is to measure the impulse response from
each of the loudspeakers la, lb, lc to each of the
microphones 7a - 7d. This is achieved by generating a
test signal through each of the loudspeakers la - lc
in turn, and digitising and storing the signal
received from each of the microphones 7a - 7d over a
relatively long period of up to a second or more.
Designating the impulse response of the path from the
reproduction microphone la as R1 and that
from the cancellation loudspeakers lb and lc T11 and
T12, the response at the microphone 7a to an
impulse test signal is R1+T11*F1+T12*F2' where F1 and
WO 92/10896 PCT/GB9~f~22~
_ 79 _
F2 are the filter impulse responses (for an FIR
filter, the coefficient sets) of the cancellation
filters 50b, 50c. Equivalent equations can be
constructed for the signals received by each of the
other microphones. The impulse responses R and T have
already been measured. By using the actual impulse
responses devised from the microphones 7a - 7d, the
coefficient calculator 6 derives values of impulse
responses F1, F2 of filters 50b, 50c which result in
the lowest squared amplitude of the signals which
would arise at the microphone positions and hence the
lowest amount of audio energy in the room.
Since it is desired to reduce the later parts of the
envelope so as to reduce the decaying tail of the
reverberation, the filter coefficents may be
calculated in such a way that minimizing the amplitude
of these later portions of the reverberation is given
greater weight than minimising the earlier portions.
A test signal is supplied to the room by test signal
generator 8 via the or each reproducing loudspeaker
la. The response measured at the speakers 7a - 7d is
digitised and stored by the coefficient calculator 6,
to give a sequence of samples lasting up to one second
or more from each microphone. If the test signal was
not an impulse response, the transfer function of the
test signal is deconvolved with the measured signal
values to yield for each microphone a corresponding
series of impulse response samples. For simplicity,
in the following, a sampling rate of lkHz is
assumed.
WO 921i~76 ~ ~ ~ ~ ~ ~ ~ PCT/~B9~f022A0
- 80 -
Referring to Figure 28, a first set of, say, sixty
impulse response samples are read from the buffer
memory containing the measured responses for each
microphone. The total number of such data is then
4x60=240. Preferably the first samples of the
measurad impulse responses are not taken into account
at all in deriving the filter coefficients, so as to
avoid distorting the early part of the room response.
For example, the first set may be the sixty samples
from 40msecs to 100msecs after the initiation of the
test signal.
Using the known stored values of R and T, the
coefficient calculator 6 then calculates a first set
of transversal filter coefficients (for example, the
first 30) for each of the filters 50b, 50c so as to
minimise the least mean squared amplitude value (i.e.
the power or energy) of the signal which would be
measured by the microphone 7a - 7d with the subsequent
coefficients set to zero; this is straight forward
since 240 data are available for solving 60 unknowns,
and any standard method for solving a linear least
squares problem of this kind may be employed (for
example, normal equations, Gram-Schmit
Orthogonalization, Householder Transformation, Givens
Rotation etc.).
The result is that a first set of coefficients for
each of the cancellation filters which reduce the
energy within the impulse response of the acoustic
environment 2 (as measured at the four microphone
positions 7a - 7d) at a later time have been
derived.
WO 92/10876
PGT/GB91/02200
~.
- gl _
The next step is to calculate the next filter
coefficients (i.e. those occuring later in the impulse
response at the cancellation filters) from a later
portion of the measured impulse responses from the
microphone 7a - 7d. Preferably, this is achieved by
selecting the next set of sixty measured impulse
response samples for each microphone 7a - 7d so as to
overlap the first set; for example, the second set may
be samples between t=50msecs and 110msecs.
The first ten coefficients derived for each filter are
correspondingly fixed, and the next set of two hundred
and forty measured signal data are used to derive a
further set of thirty coefficients (the eleventh to
fortieth coefficients) for each of the filters 50b,
50c. Once all the coefficients (for example, sixty
coefficients) of each filter have been derived, the
process may if desired be repeated, using the just
derived coefficient values rather than zero as the
starting values for coefficients. Once the
coefficient values have converged (that is, the
difference between values calculated between a
calculation cycle and the preceding cycle is less than
a predetermined level) the coefficent values are
supplied to the cancellation filters 50b, 50c for
subsequent reproduction.
As stated above, each of the cancellation filters 50b,
50c is derived to includes a substantial delay such
that the cancellation filter exhibits no substantial
response before sound from the reproducing loudspeaker
la has reached the cancellation loudspeaker. It is
therefore possible to combine cancellation filters
50b, 50c with compensation filters 5 of the type
discussed above, most of the response of which occurs
prior to that of the cancellation filters. To avoid
WO 92/10876 PCT/GB91/02200
'098190
- 82 -
conflicts between the two separate filtering
processes, however, it may be desirable to restrict
the acoustic environment equalisation portion of the
filter 5 to relatively high frequencies and the
response of the cancellation filters 50 to relatively
low frequencies.
Crossover Equalisation
As stated above, the crossover network of the
loudspeaker 1 is generally an analogue filter circuit.
In achieving desired amplitude characteristics, the
effect of the crossover network is to introduce
substantial phase distortions. We have found
surprising increase in psycho-acoustic acceptability
of a signal when a digital filter calculated to
linearise the phase distortions due to the crossover
network is employed. Since such a filter needs to be
acausal, it is best realised as a transversal filter,
for example a digital FIR filter.
To derive such a filter, the crossover network of the
loudspeaker 1 is disconnected and its impulse response
is measured by supplying an electrical signal to the
input and summing the outputs as shown in Figure 29.
Ideally, if the overall amplitude of the crossover
network were essentially flat, the impulse response
would contain substantially only phase information.
To provide a filter which when cascaded with the
crossover network will result in a linear phase
system, it would thus merely be necessary to reverse
the measured impulse response so that the last
coefficient of the measured response becomes the first
coefficient of the compensating filter response, as
shown in the Figure 30.
Of course, this method has the effect of doubling the
WO 92/1A876 ~ ~ ~ ~ ~ ~ ~ PGT/GB91/02200
- 83 -
size of amplitude variations in the actual crossover
network response; if the ripples in the amplitude
response are substantial, it is preferred to derive
the phase spectrum or all pass component of the
crossover network response and equalize only that.
Alternatively, the response of the whole loudspeaker
unit including acoustic portions may be equalized over
the crossover frequency band.
Once the coefficients have been derived, a
corresponding filter can be manufactured either as an
analogue shift register (such as a charge coupled
device) with the filter coefficients as tap values
realised as suitably valued resistors, or by a digital
signal processing device of any suitable commercially
available type. A preprogrammed filter suitable for
use with one particular type of loudspeaker may be
provided, or coefficients required to characterise
several different types of crossover network may be
provided, to be selected by a user to match his
loudspeaker.
Automobile Compensation
Referring to Figure 31, an automobile is an example of
an acoustic environment the response of which can be
characterised in advance. In other words, all cars of
a particular model will have equivalent loudspeaker
mounting positions, (usually) equivalent loudspeakers,
equivalent dimensions, and equivalent materials. It
is therefore possible to measure (or even calculate)
the loudspeaker and environment compensations
necessary for any loudspeaker/car combination in
advance, and omit from the apparatus according to this
embodiment the test signal generator 8, microphone 7
and coefficient calculator 6.
WO 92/10876 PCT/GB91/02200
- 84 -
The filter 5 is permanently configured to provide
compensation for the type of car and loudspeaker for
which it is provided. The compensation zone for which
the filter 5 is designed to correct the car
environment to may be a single zone around head height
at the driving seat position. Alternatively, the zone
may encompass all the passenger positions at head
height.
Since the presence of passengers in the car not only
effects the choice of zone for which the filter 5
should compensate but also effect the response of the
car environment itself (possibly quite radically), in
a modification, the filter 5 may be configured to 2 or
more settings corresponding to different numbers of
persons - for example, a "driver only" setting where
the coefficients of the filter 5 are derived to
compensate a zone around the driver and in such a way
as to take account of the presence only of the driver
in the environment, and a "passenger plus driver"
setting in which the coefficients of the filter 5 such
as to correct over a volume including the driver and
passenger seats, and the acoustic environment for
which the coefficients were derived takes account of
the presence of a number of passengers.
The filter S is provided as a separate unit to
accompany a compact disc player or other audio sound
source 4.
Audio High Fidelity Reproduction A paratus
Referring to Figure 32, in one embodiment, apparatus
suitable for use with a predeternlined type of
loudspeaker comprises a unit 100 comprising digital
and analogue input ports 101, 102; digital and
analogue monitor outputs 103, 104 and a pair of
WO 92/10876 PCT/GB91/02200
2U~~1~0
- 85 -
analogue loudspeaker outputs 105, 106. Also provided
on the unit are a volume control 107, a switch 108 for
selecting between filtering and measuring the acoustic
environment response; and a status display 109.
Referring to Figure 33, the digital input 101 is
connected to a digital format converter 110 arranged
to convert the digital signal to a standard format
(the SPDIF format). Separate inputs for different
types of digital signal (e.g. from a DAT source or a
compact disc) may be provided.
The format converted digital signal is supplied to a
digital signal processor device 111 comprising, for
example, a TMS 320 C25 processor device. The elements
of such a device are indicated schematically in Figure
34; it generally comprises a program ROM llla, and a
data RAM lllb connected via address and data buses
(not shown) to processing elements including a
multiplyer lllc, arithmetic logic unit llld and
accumulator llle. Predetermined data (relating, for
example to the loudspeaker response) is held in ROM,
and program ROM llla includes sub-routines for
performing operations such as fast Fourier transform
operations (on blocks of, for example, 1024 signal
values) and finite response or infinite impulse
response filtering operations according to
coefficients derived and stored in the data RAM
lllb.
The analogue input port 102 is connected, via a buffer
amplifier 112, to one input terminal of the switch
108. When "filter" mode of switch is selected, the
input analogue signal is routed via switch 108 to an
analogue to digital converter 113 having a higher
resolution (for example, 18 bits). The digitized
WO 92/10876 PCT/~GB91/02~111
~ o~sme
- 86 -
signal sample train may then be quantized, with
dithering of the least significant bit to reduce the
number of bits if necessary to, say, 16 by a
quantizer 114.
A switch 115, which may be set responsively to a jack
inserted into one of the sockets 101 or 102, selects
between the digital input and the digitised analogue
input signal to be supplied to the data input bus of
the digital signal processing device 111. The output
of the digital signal processing device 111 is
converted to an analogue signal by a digital to
analogue converter 116, buffered by a buffer amplifier
117 and supplied, via the volume control potentiometer
107, to the loudspeaker output socket 105 or 106
(Figure 33 shows only one loudspeaker channel).
The output of the digital signal processor 111 is
supplied, via a digital format converter 118, as a
digital output. The digitised analogue input is also
supplied as a digital output via a digital format
converter 119 to the digital output port 103.
The digital signal processor 111 performs the function
of the filter 5 when the switch 108 is set to filter
mode and the functions of the test signal generator 8
and coefficient calculator 6 when the switch 108 is
set to "measure" mode. A controller 120 comprising a
micro-processor or micro-controller device is provided
to sense the position of the switch 108, and control
the operation of the digital signal processor lil in
response thereto. The controller 120 may also control
the status display 109 to inform the user of the
apparatus of its internal condition.
An external microphone 7 is connectable to a
W0 92/1U876
PGT/GB91/02200
- 87 _ , . . , .
microphone input port 121 routed to the analogue to
digital converter 113 via the other terminal of switch
108 when the switch is in the "measure" setting.
In operation, when first placed in an acoustic
environment it will be necessary for the apparatus to
measure the acoustic environment response. The status
display 109 may therefore prompt the user to set the
switch 108 to the measure setting (or alternatively,
the same information may be provided from an
instruction manual). After the microphone 7 has been
connected to the socket 121 and positioned at an
appropriate position in the room, the user sets the
switch 108 to the measure setting. This is sensed by
the controller 120 which sets the digital signal
processor 111 to function as the test signal generator
8 and coefficient calculator 6 by supplying an
instruction to execute an appropriate subroutine.
The subroutine causes the digital signal processor 111
to output a series of digital values corresponding to
a test signal, to be supplied to the loudspeaker 1,
whilst reading in and storing successive digitised
values from the microphone 7. After a measurement has
been taken at the microphone position (which typically
takes several seconds, to allow long room
reverberations to decay) the status display 109 is set
by the controller 120 to indicate that the measurement
is complete and that the user should move the
microphone to another point. Upon his doing so, the
process is repeated and the second point microphone
signal data are stored. After a predetermined number
of points, the controller 120 instructs the display
109 to indicate that measurements are complete. The
microphone 7 may then be un-plugged.
WO 9/10876 PCT/GB91/02200 .._
209~~90
_88_
The controller 120 then instructs the digital signal
processor 111 to execute a sub-routine to perform
coefficient calculation. The loudspeaker response
will be stored in a read only memory, and from this
S and the measured signals the digital signal processor
111 calculates the coefficients necessary to enable it
to filter an input audio signal. The controller 120
then releases the switch 108 into the filter mode
setting, instructs the digital signal processor 111 to
act as a digital filter using the derived
coefficients, and indicates on the status display 109
that the apparatus is ready for audio reproduction.
Other conventional features such as a direct signal
bypass path to the loudspeaker 1 (not shown) are also
provided. The controller 120 may be performed by the
digital signal processor 111 executing a supervisory
routine if so desired.
Audio Visual Reproduction
When the filter 5 is acausal, as it will be when
linear phase compensation of the loudspeaker is
employed, the filter 5 will produce a significant
signal delay. When reproducing audio material which
has an associated video picture (e.g. replaying a
video tape or disc) this will result in loss of
sychronisation between the sound and pictures; this is
very noticable and annoying to a viewer. In an
embodiment of the invention for use in replaying audio
visual material, shown in Figure 35 there is therefore
provided a video delay 501 of selectable length, the
length being set by a control signal from the
coefficient calculator 6 to match the delay of the
filter 5. Any convenient form of delay line may be
employed; if the signal is received in digital form
WO 92/10876 . ~ 0 9 819 ~ P~T~~B9~/02200
_ 89 _
the delay may comprise a digital frame buffer and
associated addressing logic.
Modifications
various modifications to the embodiments disclosed may
be made without departing from the scope of the
invention. In particular, it will be realised that
the particular order of operations shown in the
various flow charts is by way of example only;
operations which are by their nature linear may be
combined and their order altered without affecting the
result. Further, each operation of multiplication in
the frequency domain may be if necessary replaced by
an operation of convolution in the time domain,
although in general such convolution operations
require greater numbers of arithmetic operations.
Although the invention has been described particularly
with reference to digital transversal or fininte
impulse response filters, it is equally possible to
realise the invention using analogue transversal
filters of the charge coupled device or similar type.
Likewise, infinite impulse response or recursive
filter may be used to implement the invention;
algorithms are known for generating suitable
parameters of an infinite impulse response filter from
those of a finite impulse response filter and vice
versa.
One economical way of realising the filter 5 shown in
Figure 3o is as a recursive filter 500b comprising a
finite impulse response filter in a feedback path, the
recursive filter 500b having a minimum phase response,
and an acausal transversal filter 500a having a
response which includes all other parts of the
correction response. When linear phase loudspeaker
WO 92/10876 " PCT/GB91/02200
2098190
- 90 -
correction is combined with minimum phase room
correction, the filter SOOa will comprise the
loudspeaker compensation and the filter 500b the room
compensation. However, when the room compensation is
non minimum phase, the all pass elements of the room
compensation can be provided by the transversal filter
SOOa (or may alternatively be provided by an
additional recursive all-pass filter).