Note: Descriptions are shown in the official language in which they were submitted.
CA2ii1432
SPECIFICATION
TITLE OF THE INVENTION
UNDERWATER DETECTION SYSTEM
FIELD OF THE INVENTION
This invention relates to an underwater detection system
which can determine carrier frequencies (including angular
frequencies) of ultrasonic signals-arriving from a wide
area of search and, more particularly, to an under<aater
detection system capable of presenting detected targets in
different colors depending on their moving velocities in -
accordance with the measured carrier frequencies, for
example .
BACKGROUND ART
Conventional sonars which present detected echoes in
accordance with echo level information have such drawbacks
as:
1. Information on relative echo intensities would be
lost due to signal saturation phenomenon;
2. Low-level signals would be masked, or hidden, by
high-level signals and become impossible to distinguish;
and
3. Nothing could be distinguished from echo signals
having the same intensity level.
Various improvements have so far been made to overcome
these problems, including the use of a sonar receiver
-1-
CA2ii7432
having a wide dynamic range, provision of an automatic
gain control (AGC) and development of new signal
processing techniques. Despite such efforts, if there is
no level difference in received signals as stated in point
3 above, it is by no means possible to discriminate
between them by using signal level information alone.
Should there exist a school of swimming fish, ultrasonic
echoes' returned from the fish school are shifted in
frequency due to the so-called Doppler effect. If this
shift in frequency (or in phase), known as the Doppler
shift, can be detected without jeopardizing the sonar's
ability to provide high-speed scanning (or real-time
processing) and a wide searching area as well as its
bearing and range resolutions, it would be possible to
discriminate true targets among ultrasonic echoes from
fixed targets such as the sea bottom. It would also be
possible to recognize differences in moving velocities of
fish schools, resulting in a significant improvement in
target discriminating capabilities. For this reason,
certain types of conventional sonars provide the ability
to determine amounts of Doppler shifts (refer to Japanese
Patent Publication No. 57-29975, for example).
Those conventional systems, however, have just been able
to measure amounts of Doppler shifts of ultrasonic echoes
arriving from only one particular direction and not
provide high-speed measurement capabilities for Doppler
shifts of ultrasonic echoes arriving from all directions.
-2-
CA 02117432 2002-11-25
This is the reason why there has not been available yet a
sonar capable of presenting moving velocities of
underwater targets based on frequency information. It
has long been desired therefore to develop a system that
can provide real-time measurements of removing velocities
of multiple fish schools throughout ~~ wide searching
area.
SZTMMARY OF THE INVENTION
This invention is directed to solve the aforementioned
problems of the conventional systems. Accordingly, it is
an object of the invention t.o provi.c~e an underwater
detection system which can derive frequency information
from received echoes at high speed and present the
frequency information in a manner which would enhance
target discriminating capabilities.
An underwater detection system according to a first
aspect of the invention comprises a carrier frequency
measuring circuit including ultrasonic. receiving means
for receiving ultrasonic signals arriving from a wide
searching area whiled rotat:.ing a first ultrasonic
receiving beam accompanied by a second ultrasonic
receiving beam, wherein the second ultrasonic receiving
beam is delayed by a fixed angular displacement f~
relative to the first ultrasonic receivirug beam; detector
means for detecting individual signals picked up by the
two ultrasonic receiving beams produced by the ultrasonic
_ 3 ._
CA 02117432 2002-11-25
receiving means; delay means for delaying the signal
picked up by the first ultrasonic receiving beam, which
precedes the second ultrasonic x-eceiving beam by a time
period T due to the angular displacement 8, by the same
time period t at an output stage of the ultrasonic
receiving means or the detector means; phase difference
calculating means for determining the phase difference
between the two signals detected by thE:~ detector means;
and calculating means for calculating carrier frequency f
of the received ultrasonic signals from the phase
difference determined by the phase difference calculating
means in accordance with the equation f - Llyr/ (2rc-r); a
frequency/color conversion circuit for reading out
specific color data depending on individual values of
measured carrier frequencies f; and a display unit for
presenting the color data.
According to the underwater detecticyn system of the
first aspect, the carrier frequency measuring circuit
causes the first ultrasonic receiving beam to scan
through the wide searching area followed by the second
ultrasonic receiving beam with the fixed angular
displacement 8. The signal picked up by the first
ultrasonic receiving beam which precedes the second
ultrasonic receiving beam by the time period i
corresponding to the angular displacement 8 is delayed by
the same time period z to eliminate the time lag between
-4-
CA 02117432 2002-11-25
the signals received by the two ultrasonic receiving
beams. Then, the phase difference c:,alculating means
determines the phase difference O~f between both signals,
and the carrier frequency f of the received ultrasonic
signals is calculated from the phase difference Ayr in
accordance with the equation f - ~y~~'(2~-r). Operating
principles of the carrier frequency measuring circuit and
circuit examples thereof will be described later in this
specification.
The carrier frequency f thus obtained includes a
Doppler frequency attributed to the relative velocity
between the target, or the source of the ultrasonic
signals, and own ship. With this arrangement, it would
be possible to obtain information on they target velocity
relative to own ship from the value of the carrier
frequency f. Color data corresponding to the carrier
frequency f is read out from the frequency/color
conversion circuit and presented on the display unit in
the form of a target velocity picture.
An underwater detection system according to a second
aspect of the invention comprises, in addition to the
carrier frequency measuring circuit of ~..he first aspect,
a variance calculating circuit for deriving variance data
indicating the degree of variations in ~:arrier frequency
f fed from the carrier frequency measuring circuit; a
variance/color conversion circuit fear reading out
- 5-
CA 02117432 2002-11-25
specific color data depending on individual values of
variance data; and a display unit for presenting the
color data.
According to the underwater detection system of the
second aspect, variance data representatiTre of the degree
of frequency (velocity) v.:~riatioms is determined from
individual carrier frequen~~ies obta.i:necl by the carrier
frequency measuring circuit and presented on the display
unit in the form of a variance data pa.cture which is
useful for discriminating fish species.
An underwater detection system accox-ding to a third
aspect of the invention is constructed in the same
fashion as the underwater detection system of the first
aspect, further comprising the variance calculating
circuit of the second aspect and a frequency-
variance/color conversion circuit fc~r reading out
specific color data depending on indi~,ridual values of
measured carrier frequencies f and variance data.
According to the underwater detection system of the
third aspect, data on one specific color is read out from
the frequency-variance,~co:l.ox~ conversion ~::a.rcuit depending
on the values of each measured carrier frequency f and
variance data and presented on the display unit. With
this arrangement, it is possible to know target velocity
levels (derived from carrier frequencies) and variations
in target velocities (derivE:d from variance data).
--6-
CA 02117432 2002-11-25
An underwater detection system according to a fourth
aspect of the invention comprises, in addition to the
carrier frequency measuring circuit of °~he first aspect,
a filter-amplitude/color conversion circuit for selecting
from amplitude data derived from the signals detected by
the detector means only such amplitude data that lie
within a desired frequency range and then reading out
specific color data depending on individual values of the
selected amplitude data; and a display unit for
presenting the color data.
According to the underwater detection system of the
fourth aspect, a filtering function of the filter-
amplitude/color conversion circuit makes it possible to
color-convert only such amplitude data that lie within a
desired frequency range. This frequency range may be
selected with reference to the carrier frequency f, for
example, so that only such amplitude data found only
within the frequency range are color'-cornverted to reject
interference from signals of other frequency bands.
Alternatively, by allowing color conversion of only such
signals exceeding a specified frequency (velocity), it
becomes possible to d=Lscriminate between moving objects
and stationary objects, by which images of the sea bottom
or surface, for example, can be eliminated on the display
unit.
CA 02117432 2002-11-25
In executing the convers~i.on into color data, the color
conversion circuits of the aforementioned underwater
detection systems may utuili~~e amplitude information
included in input data as a reference ors described in a
fifth aspect of the invention and convert only such input
data that exceed a specified amplitude revel. With this
arrangement, it is possible to eliminate low-level
signals caused by unwanted noise, for example, from on-
screen presentation.
An underwater detection system according to a sixth
aspect of the invention is constructed in the same
fashion as the underwater detection system of the first
aspect, further comprising storage means for storing
individual carrier frequencies f fed from the carrier
frequency measuring circuit; a designating unit for
specifying a desired area on the display unit; data
readout means for reading out data on carrier frequencies
f from such memory locations of the storage means that
correspond to the area specified by the <designating unit;
a frequency histogram generator for generating a
histogram upon determining the distribution of carrier
frequencies f based on the data read out by the data
readout means; and display means fox presenting the
histogram.
_g_
CA 02117432 2002-11-25
According to the underwater detection system of the
sixth aspect, a desired area is specified on an amplitude
level picture (which shows color--coded amplitude
information) or on the aforernentianed target velocity
picture presented on t:he display unit and the frequency
distribution is determined from the carxier frequencies f
read out from the specified ax.°ea. With this arrangement,
the histogram representing the frequency distribution can
be displayed in a spec:i.fied location on ,rue display unit.
According to a seventh aspect of the invention, it is
possible to simultaneously display more than one picture
such as the aforementioned target velocity picture and
variance data picture on one display unit, one picture on
the upper half and the other picture on the lower half of
the screen, for example. This arrangement allows for a
direct comparison between two different pictures, which
would serve to further enhance target discriminating
capabilities.
An underwater detection system according to an eighth
aspect of the invention comprises, in addition to the
carrier frequency meas~.zring circuit of the first aspect,
an over-the-ground ship velCacity compensation circuit for
calculating carrier frequerxcy fe repre~~entative of the
over-the-ground velocity o.f a target itself by
subtracting frequency f1 attributed to the over-the-
ground ship velocity i=rom each carrier frequency f fed
_. g _
CA 02117432 2002-11-25
from the carrier frequency measuring circuit.
According to the underwater detect:ic~n system of the
eighth aspect, it is possible to determine the carrier
frequency fe representative of the over-the-ground
velocity of the target itself by subtracting (Doppler)
frequency fl attributed ~o the aver-t:he-ground ship
velocity from the carrier frequency f fed from the
carrier frequency measuring circuit.
An underwater detection system according to a ninth
aspect of the invention comprises, in addition to the
carrier frequency measuring circuit of ~.he first aspect,
a through-the-water ship velocity compensation circuit
for calculating carrier frequency fw representative of
the through-the-water velocity of a target itself by
subtracting frequency f2 attributed to the through-the-
water ship velocity from each carrier frequency f fed
from the carrier frequency measuring ci:r:::~L:it.
According to the underwater detection system of the
ninth aspect, it is possible to determine the carrier
frequency fw representative of the ~::.hrough-the-water
velocity of the target itself by subtracting (Doppler)
frequency f2 attributed to the through-the-water ship
velocity from the carrier frequency f fed from the
carrier frequency measuring circuit.
-10-
CA 02117432 2002-11-25
In one feature of an underwater detection system
according to a tenth aspect of the invention, it is
possible to determine the frequency f1 attributed to the
over-the-ground ship velocity by breaking down a Doppler
frequency corresponding to the over-the-ground ship
velocity acquired from such external equipment as a
navigational aid into each individual azimuthal
component.
In another feature of an underwater detection system
according to an eleventh aspect of the invention, it is
possible to determine the frequency f2 attributed to the
through-the-water ship velocity by l.~reaking down a
Doppler frequency corresponding to the through-the-water
ship velocity acquired from such external equipment as a
water current measuring apparatus into each individual
azimuthal component,
In another feature of an underwater detection system
according to a twelfth aspect of the invention, the
frequency fl attributed to the over-the-ground ship
velocity is determined for each horizontal direction by
once storing individual carrier frequencies f fed from
the carrier frequency measuring circuit into a frame
memory, specifying a desired readout area of the frame
memory, and sequential:Ly reading out carrier frequencies
f from the specified readout area in a predefined order
of memory addresses.
CA 02117432 2002-11-25
In another feature of a~ underwater detection system
according to a thirteenth aspect of tree invention, the
frequency fl attributed to the over-the-ground ship
velocity is determined by reading out carrier frequencies
f for individual hori:~antaL c:~irections by the method of
the twelfth aspect, estimating a cosine curve from the
read data with the bearing taken an the horizontal axis,
and reading out again carrier frequencies f for
individual horizontal directions with reference to the
estimated cosine curve.
In a further feature of an underwater detection system
according to a fourteenth aspect of the invention, whole
carrier frequencies f derived from one transmission cycle
can be stored in the frame memory and simultaneously
compensated with the frequency f1 attributed to the over-
the-ground ship velocity.
In a still further feature of an underwater detection
system according to a fifteenth aspect. oaf the invention,
individual carrier frequencies f sequentially fed from
the carrier frequency measuring circuit can be
compensated on a real-time basis with the frequency fl
attributed to the over--the-ground ship v~:locity.
In another feature of an underwater detection system
according to a sixteenth aspect of th~~ invention, the
frequency f2 attributed to the through-the-water ship
velocity is determined for each horizontal direction by
-12-
CA 02117432 2002-11-25
once storing individual carrier frequen<aies f fed from
the carrier frequency measuring circuit into a frame
memory, specifying a desired readout area of. the frame
memory, and sequentially reading out carrier frequencies
f from the specified readout area in a predefined order
of memory addresses in a similar readout method to that
of claim 12.
In another feature of an underwater detection system
according to a seventeenth aspect of i~Lie invention, the
frequency f2 attributed t~.~ the through-the-water ship
velocity is determined by estimating a c=osine curve from
the data read out for individual horizontal directions
with the bearing taken on the horizontal axis, and
reading out again carrier frequencies f for individual
horizontal directions with reference to the estimated
cosine curve in a similar readout method to that of the
thirteenth aspect.
In a further feature of an under~wate:r detection system
according to an eighteenth aspect of the invention, whole
carrier frequencies f derived from one t=ransmission cycle
can be stored in the frame memory and simultaneously
compensated with the frequency f2 attributed to the
through-the-water ship veloc=ity in a simi:Lar way to that
of the fourteenth aspects .
-13 w
CA 02117432 2002-11-25
In a still further feature of an underwater detection
system according to a nineteenth aspect. of the invention,
individual carrier frequencies f sequentially fed from
the carrier frequency measuring circuit can be
compensated on a real-time basis with the frequency f2
attributed to the through-the--water sh:i_p velocity in a
similar way to that of the fifteenth aspect.
An underwater det:ectican system according to a
twentieth aspect of the invention is constructed in the
same fashion as the underwater detection systems of the
eighth to nineteenth aspects, further comprising a
frequency/color conversion circuit for reading out
specific color data depending on the value of each
carrier frequency fe representative of the over-the-
ground velocity of the target itself or each carrier
frequency fw representative of the through-the-water
velocity of the target itself; and a display unit for
presenting the color data.
According to the underwater detection system of the
twentieth aspect, each carrier frequency fe
representative of the over-the-ground velocity of the
target itself or each carrier frequency fw representative
of the through-the-water velocity of t:Yie target itself
would be shown in a color corresponding to the frequency
value in the form of a targE:t velocity picture.
-14-
CA 02117432 2002-11-25
An underwater detection system according to a twenty-
first aspect of the invention is constri,zcted in the same
fashion as the underwater detection systems of the eighth
to nineteenth aspects, further comprising a
frequency/color conversion circuit for reading out
specif is color data depending on t.hEvalue of each
compensated carrier frequency fe representative of the
over-the-ground velocity of the target or each
compensated carrier frequency fw representative of the
through-the-water velocity of the target and also
depending on whether the Doppler frequency shift is
positive or negative; and a display un:i.t for presenting
the color data.
According to the underwater detection system of the
twenty-first aspect, data on one specific: color is read
out and displayed on a target velocity ~~icture depending
on the value of each compensated carrier frequency fe
representative of the over-the-ground velocity of the
target or each cornpensated carrier frequency fw
representative of the through.-t.he-water velocity of the
target and also depending on wheth~:r such carrier
frequency fe or fw, whichever applicable, is higher or
lower than the transmitted frequenc~~r. With this
arrangement, it is possible to know over-the-ground or
through-the-water target ~re7.ocity levels and target
moving directions from the target velocity picture.
CA 02117432 2002-11-25
In another feature of an underwater detection system
according to a twenty-second aspect of the invention, the
color data of the twenty-first aspect fox a plurality of
colors may classified into cool and warm color groups,
for example, depending on whether each carrier frequency
fe or fw, whichever applicable, is higrcer or lower than
the transmitted frequency, with specific:: colors assigned
in accordance with individual values of carrier
frequencies fe or fw in both the cool. and warm color
groups. With this arrangement, it is possible to know
target velocity levels and moving directions from each
individual display color.
An underwater detection system according to a twenty-
third aspect of the invention is constructed in the same
fashion as the underwater detection systems of the eighth
to nineteenth aspect:s, further comprising variance
calculating means for deriving variance data indicating
the degree of variations in compensated ~~arrier frequency
fe representative of the over-the-ground velocity of each
target or compensated ~:ar:riE~r frequency fw represerutative
of the through-the-water velocity of eacxn target.
An underwater detection system accarding to a twenty-
fourth aspect of the invention. is constr~,icted in the same
fashion as the underwater detection system of the twenty-
third aspect, further comprising a variance/color
conversion circuit for' rear ing out spec~i.fic color data
-:16-
CA 02117432 2002-11-25
depending on individual values of variance data; and a
display unit for presenting true color data.
According to the underwater detect:ic:~n system of the
twenty-fourth aspect, a var~.ance data picture can be
presented to indicate the vvariance in ~::arrier frequency
fe representative of the over-t:he--ground velocity of the
target itself or compensated carrier frequency fw
representative of the through-t.he-water velocity of each
target itself.
An underwater detection system according to a twenty-
fifth aspect of the invention i s constructed in the same
fashion as the underwater detection system of the twenty-
third aspect, further comprising a frequency-
variance/color conversion circuit for reading out
specific color data depending on individual values of
compensated carrier frequencies fe or fw and variance
data.
According to the underwater detection system of the
twenty-fifth aspect, specific color data corresponding to
individual values of comperaated carrier frequencies fe
or fw and variance data are read oat. With this
arrangement, it is possible to know the over--the-ground
or through-the-water velocity leve~.s of targets
themselves as well as their moving directions.
CA 02117432 2002-11-25
An underwater detectian system according to a twenty-
sixth aspect of the invention is c.onstri.rcted in the same
fashion as the underwater detection systems of the eighth
or ninth aspect, further comprising a filter-
amplitude/color conversion circuit for selecting from
amplitude data derived fronu the signals detected by the
detector means only such amplitude data chat lie within a
desired frequency range and then reading out specific
color data depending on individual values of the selected
amplitude data; and a display unit fo:r presenting the
color data.
According to the urzderw~~ter detection system of the
twenty-sixth aspect, it becomes pos~;ible to reject
interference from signals of other frequency bands and to
discriminate between moving objects and stationary
objects as described in connection with the underwater
detection system of the fourth aspect.
In executing the conversion into aolo~- data, the color
conversion circuits of the aforementioned underwater
detection systems may utilize amplitude information
included in input data in an underwater detection system
according to a twenty-seventh aspect of the invention and
convert only such input data that exceed a specified
amplitude level. with this arrangement; it is possible
to eliminate low-level signals caused by unwanted noise,
for example, from on-screen presentation.
_1g_.
CA 02117432 2002-11-25
An underwater detection system according to a twenty-
eighth aspect of the invention is constructed in the same
fashion as the underwater detection systems of the
twentieth aspect, further comprising storage means for
storing compensated carrier frequencies fe representative
of over-the--ground target velocities or compensated
carrier frequencies fw representative caf through-the-
water target velocities; a designating unit for
specifying a desired area on the display unit; data
readout means for reading out carrier frequency data from
such memory locations of the storage means that
correspond to the area specified by the designating unit;
a frequency histogram generator fo~~ generating a
histogram upon determyning the distribution of carrier
frequencies based on the data read out by the data
readout means; and display means for presenting the
histogram.
According to the underwater detection system of the
twenty-eighth aspect, a desired area is specified on a
ship-velocity-compensated amplitude level picture twhich
shows color-coded amplitude information) or target
velocity picture presented on the disp~l.ay unit and the
frequency distribution is determined from the carrier
frequencies f read out from the specified area. With
this arrangement, the histogram representing the
frequency distribution can be displayed in a specified
_ -L ~ ....
CA 02117432 2002-11-25
location on the display unit.
According to a twenty-ninth aspect of the invention,
it is possible to simultaneously display more than one
picture such as the aforementioned ship-velocity-
compensated target velocity pi<vtvire and variance data
picture on one display un~.t, one pic:t~zre on the upper
half and the other picture on the lower half of the
screen, for example. This arrangement. allows for a
direct comparison between twa different pictures, which
would serve to further enhance target discriminating
capabilities.
According to a thirtieth aspect of true invention, the
color conversion circuit described in any of the first to
fourth, twentieth to twent~rl-second and twenty-fourth to
twenty-sixth aspects may be configured with a read-only
memory (RON) storing color data corresponding to
individual values of input data.
An underwater detection system according to a thirty-
first aspect of the invention comprises the carrier
frequency measuring circuit of the first- aspect, Doppler
measuring means and a 'velocity vector generating circuit.
In an underwater detection system according to a
thirty-second aspect of the invention, the moving
direction of a water current or fish school in each
arbitrarily sleeted fractional. area i.s displayed.
_2p...
CA 02117432 2002-11-25
An underwater detection system according to a thirty-
third aspect of the invention comprises ultrasonic signal
transmission means, ultrasonic echo signal receiving
means, Doppler measuring means and a velocity vector
generating circuit.
In an underwater detection syster~l according to a
thirty-fourth aspect of t:he invention, the point and the
velocity of the system of the thirty-third aspect are
expressed in polar coordinates.
In an underwater detection system according t.o a
thirty-fifth aspect of the inventian, the point and the
velocity of the system of the thirty-third aspect are
expressed in rectangular coordinates.
In an underwater detection s~~rstem according to a
thirty-sixth aspect of the invention, the moving
direction and velocity level of a water current or fish
school in each arbitrarily selected fractional area are
displayed.
According to a thirty-seventh aspects of the invention,
the ultrasonic receiving means of the underwater
detection system described in any o~ the first to
thirtieth aspects is configured with a pr:~ir of ultrasonic
transducer elements which are rotated mechanically.
According to a thirty-eighth aspect of the invention,
the ultrasonic receiving means of the underwater
detection system described in any of the first to
_a
~, o a. -
CA 02117432 2002-11-25
thirtieth aspects include; a plurality of ultrasonic
transducer elements arranged in a c-ircular array, selects
a predefined number of adjacent transducer elements while
shifting the selection in sequential str.ps by electrical
switching, produces the first ultrasonic receiving beam
by synthesizing the phases of signals received by each
selection of transducer elements, and further produces
the second ultrasonic receiving beam ~~eparated by the
angular displacement E3 from the first ultrasonic
receiving beam in a similar manner.
According to a thiz~ty--ninth aspect of the invention,
the ultrasonic receiving means of the underwater
detection system described in any of the (first to
thirtieth aspects includes a plurality of ultrasonic
transducer elements arrangeca in a linear array, selects a
predefined number of adjacent transducer elements while
shifting the selection in sequential steps by electrical
switching, produces tree first ultrasonic receiving beam
by synthesizing the phases of signals received by each
selection of transducer: elements, and further produces
the second ultrasonic receiving beam :separated by the
angular displacement E3 from the first ultrasonic
receiving beam in a similar manner.
According to a fortieth aspect of the invention, the
carrier frequency measuring circuit desc~i~ibed in any of
the first to thirtieth and thirty-second aspects includes
-~Ob-
CA 02117432 2002-11-25
scanning means for steering tile first and second
ultrasonic receiving beams switchably from full-circle
scanning to sector scanning operation. With this
switching function, its is pos~;ible to provide a higher
sampling rate and consequent resolution enhancement.
According to a foray-first aspect of the invention,
the carrier frequency measuring circuit described in any
of the first to thirtieth and thizwty--second aspects
further comprises second delay means which x-egards the
first and second ultrasonic: x:-eceiving beams as having a
mutual angular displacement of 2~c - 8 and introduces a
time delay T2 corresponding to the angular displacement
2~ - A into the signal received by one ultrasonic
receiving beam which precedes the other ultrasonic
receiving beam by T2; second phase difference calculating
means for determining the phase difference ,~y' between
the signal outputted from the second deJ.ay means and the
signal received by the ather ultrasonic receiving beam;
and frequency calculating means for calculating carrier
frequency f 2 - Dy'/(2~cr2 ) f rom t hey phas a d i f f erence Dyr' and
outputting a true carrier frequency at which the carrier
frequency f and the carrier frequency fu coincide with
each other.
When the phase difference d~ determine=d by the carrier
frequency measuring circuit exceeds 2;c, there arises the
folding (or zero resetting) pherxomenon in angular
-<Oc-
CA 02117432 2002-11-25
frequency. As a :result, a plurality of carrier
frequencies, fl to f4 for example, will be found within
the system frequency bandwidth, making it impossible to
find out a unique caurier fx.~ecxuency. If the value of
phase difference is lessened to avoid zero resetting of
the angular frequency, it would be possible to determine
a unique carrier frequency f2', for example, but its
accuracy would not be good enough. Nevertheless, it is
possible to determine one s~cc.u.rate carrier frequency f2
among the four carrier frequencies fl to f4 by comparison
with the carrier frequency f2'.
Accordingly, in the arrangement of the forty-first
aspect of the invention there are established two
different phase differences H and 2~ - H with the two
ultrasonic receiving beams and the carrier frequency is
determined from these t:wo pr~ase differences.
According to the arrangement of a forty-second aspect of
the invention, there are established tw~:> different phase
differences H and 2~t + H with the two ultrasonic receiving
beams. Also, according to the arrangement of a forty-
third aspect of the invention, there are established two
-2,Od-
CA2ii7432
different phase differences A and 2rr with the two
ultrasonic receiving beams.
BRIEF DESCRIPTION OF THE DRAWINGS
Figure 1 is a diagram showing a first principle adopted
in carrier frequency measuring circuits according to the
present invention;
Figure 2 is a timing chart showing operation of two
ultrasonic receiving beams formed by the arrangement of
Figure 1;
Figure 3 is a block diagram of a carrier frequency
measuring circuit based on the first principle utilizing a
pair of rotating ultrasonic transducer elements;
Figure 4 is a block diagram of a carrier frequency
measuring circuit employing matched filters instead of a
quadrature detector of Figure 3;
Figure 5 is a block diagram of a carrier frequency
measuring circuit which performs the function of the
circuit of Figure 3 with just a single ultrasonic
transducer element;
Figure 6 is a block diagram of a carrier frequency
measuring circuit employing a plurality of ultrasonic
transducer elements arranged in a circular array;
Figure 7 is a block diagram of a carrier frequency
measuring circuit employing matched filters instead of a
quadrature detector of Figure 6;
Figure 8 is a block diagram of a carrier frequency
-21
CA2ii7432
measuring circuit employing phase synthesis circuits
instead of the quadrature detector of Figure 6;
Figure 9 is a circuit diagram of the phase synthesis
circuits of Figure 8;
Figure 10 is a circuit diagram of a phase difference
calculating circuit having a modified circuit
configuration from those employed in the above carrier
frequency measuring circuits;
Figure 11 is a block diagram of a carrier frequency
measuring circuit employing a random access memory (RAM)
for data storage and a central process-a unit (CPU) for
data readout instead of a delay circuit of Figure 8;
Figure 12 is a block diagram of a carrier frequency
measuring circuit which produces a single ultrasonic
receiving beam using the circuit of Figure 6;
Figure 13 is a block diagram of a carrier frequency
measuring circuit which produces a single ultrasonic
receiving beam using the arrangement of Figure 8;
Figure 14 is a block diagram of a carrier frequency
measuring circuit employing a RAM for data storage and a
CPU for data readout instead of the delay circuit of
Figure 13;
Figure 15 is a diagram showing a second principle
adopted in carrier frequency measuring circuits according
to the present invention;
Figure 16 is a block diagram of a carrier frequency
measuring circuit based on the second principle;
-22-
CA2ii7432
Figure 17 is a diagram showing power spectrums obtained
by a power spectrum calculating circuit and phase spectrum
calculating circuit of Figure 16;
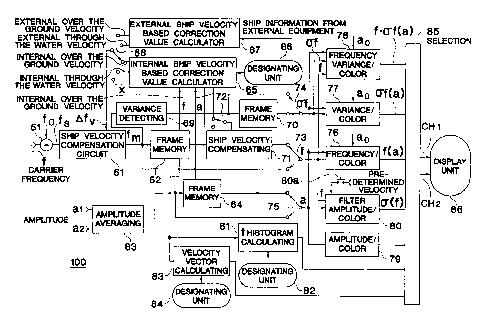
Figure 18 is a block diagram of a ship velocity
compensation/display circuit shown as one embodiment of
the invention;
Figure 19 is a diagram illustrating a search point
tracking pattern formed when an ultrasonic receiving beam
is rotated;
Figure 20 shows address maps of frame memories employed
in Figure 18;
Figure 21 is a display example presented on a display
unit of Figure 18;
Figure 22 is a diagram depicting an example of color
conversion performed by a frequency/color conversion
circuit of Figure 18;
Figure 23 is a control block diagram of a variance
calculating circuit employed in Figure 18;
Figure 24 is another control block diagram of the
variance calculating circuit employed in Figure 18;
Figure 25 is a diagram showing a display example where a
histogram is inset within a target velocity picture
presented on the display unit;
Figure 26 is a diagram showing addresses within a frame
memory corresponding to an area specified in Figure 25;
Figure 27 is a diagram illustrating a display example
where an amplitude level picture and a target velocity
-23-
ca2~~7432
picture presented simultaneously;
Figure 28 is a diagram showing the timing of detecting
arriving echoes when the ultrasonic receiving beam is
rotated throughout a full circle;
Figure 29 is a diagram showing the timing of detecting
arriving echoes when the ultrasonic receiving beam is
rotated throughout a half circle;
Figure 30 is a diagram showing.a relationship between
detected phase differences 4~ and corresponding angular
carrier frequencies w;
Figure 31 is a diagram showing the bandwidths of. four
angular carrier frequencies w1 to w4 obtained within a
system frequency bandwidth as a result of zero resetting
of the phase difference 4~ shown in Figure 30;
Figure 32 is a diagram showing the bandwidth of an
angular carrier frequency w5 obtained within the system
frequency bandwidth when the zero resetting shown in
Figure 30 is avoided;
Figure 33 is a diagram showing two phase differences
obtained with two ultrasonic receiving beams;
Figure 34 is a control block diagram showing a circuit
configuration for obtaining two phase differences with two
ultrasonic receiving beams;
Figure 35 is a diagram illustrating how a three-
dimensional velocity vector is obtained;
Figure 36 is a diagram illustrating how velocity vectors
are obtained for a desired three-dimensional area;
-24-
CA2ii7432
Figure 37 is a three-dimensional velocity vector
diagram;
Figure 38 is a two-dimensional velocity vector diagram;
and
Figure 39 is a diagram showing an example of velocity
vector presentation on the display unit.
DESCRIPTION OF THE EMBODIMENTS
An underwater detection system according to the
invention comprises a carrier frequency measuring circuit
50 for measuring the carrier frequency and a signal
processing circuit 100 connected to the carrier frequency
measuring circuit 50. A first principle upon which
carrier frequency measurement is based will be explained
at first, referring to Figure 1.
In Figure 1, there are shown two ultrasonic receiving
beams P and Q formed respectively by ultrasonic transducer
elements 1p and 1q. Accordingly, the two ultrasonic
receiving beams P and Q scan through surrounding water at
the same speed around the center of rotation O,
maintaining a constant angular separation of A in the
horizontal plane. As a result, the ultrasonic receiving
beams P and Q would individually receive ultrasonic echo
signals arriving from one direction (y-direction in this
example) with a constant time difference z as can be seen
in Figures 2(a) and 2(b). It is to be noted here that the
rotary motion of the ultrasonic transducer elements 1p and
-25-
..y
CA2ii7432
1q that produce the ultrasonic receiving beams P and Q
causes the Doppler effect on the ultrasonic signals
arriving from targets.
An ultrasonic signal p(t) picked up by the ultrasonic
receiving beam P which precedes the ultrasonic receiving
beam Q by time t in angular position is given by the
following equation:
p(t) - S(t).cos{wt + a + m(t) + (3} :.............. (1)
where S(t) represents the amplitude of the ultrasonic
signal determined by directional characteristics of the
ultrasonic receiving beam P and the speed of b~_m scanning
in the horizontal plane while cos{wt + a + m(t) + (3}
accounts fcr the phase of the ultrasonic signal, w being
the angular carrier frequency of the ultrasonic signal
arriving from a target, a being the initial phase of the
arriving ultrasonic signal, (3 being a displacement of
signal phase that occurs in a receiver system, and m(t)
denoting a phase shift caused by the Doppler effect as the
ultrasonic receiving beam P receives the ultrasonic signal
while rotating. It would therefore be understood that
m(t)=0 when the ultrasonic receiving beams P and Q are not
rotating or when the receiving beam (P in this case) is
moving in the x-direction which is perpendicular to the y-
direction. In equation (1) above, wt + a gives the phase
of the incident ultrasonic signal while m(t) + (3 denotes a
phase shift .caused by the scanning of the ultrasonic
receiving beam P.
-26-
C,~ 2 i i 7432
Regarding an input signal q(t) picked up by the
ultrasonic receiving beam Q, the phase of the incident
ultrasonic signal is wt + a which is same as in the case
of the ultrasonic signal picked up by the ultrasonic
receiving beam P. However, the change in phase that
occurs due to the rotational scanning of the ultrasonic
receiving beam Q is m(t - z) + (3. Thus, the input signal
q(t) of the ultrasonic receiving beam Q is expressed by
the following equation:
q(t) = S(t - z)~cos{wt + a + m(t - z) + (3}........ (2)
To eliminate the effect of time difference z caused by
the scanning of the two ultrasonic receiving beams P and
Q, a corresponding time delay i is introduced into the
signal p(t) of equation (1), as shown in Figure 2(c). A
resultant signal pz(t) is then rewritten as
pt(t) = S(t - z)~cos{w(t - z) + a + m(t - z) + (3}
= S(t - z)~cos{wt + a + m(t - z) + (3 - arc} .. (3)
As is apparent from a comparison between equations (2)
and (3), the phase difference A~ between the received echo
signals q(t) and pz(t) becomes A~ = we = 2nfz. Thus,
carrier frequency f of the received echo is
f = 4~/(2~)..................................... (4)
From equation (4) above, it would be recognized that the
phase difference a~ is directly related to the carrier
frequency f of the ultrasonic signal arriving from a
target.
It would also be recognized that since the time
-27-
CA2ii74~2
difference z has a known value, the carrier frequency f of
the received ultrasonic signals can be determined from
equation (4) if the phase difference ~~ between the two
signals q(t) and pz(t) is obtained.
Since the phase difference 0~ is measurable only within
a maximum range of 2rr, the carrier frequency f is
calculated from the following equation if the value ors lies
outside the range [-n, n]:
w = g{~y - g(wtx~z)}/z + cutx
where g is a function for converting angles beyond the
limits of [-rr, rr] into this range [-rr, rr], and tho term
wtx gives the angular freque:~cy of a transmitted
ultrasonic signal.
Now, examples of the carrier frequency measuring circuit
50 according to the aforementioned first principle will be
described in the following.
CIRCUIT EXAMPLE 1
Referring to Figure 3, a transmitting transducer 101
emits an ultrasonic pulse signal in wide searching
directions in response to a timing signal fed from a
controller 102. A receiving transducer 1 contains a pair
of ultrasonic transducer elements 1p and 1q and, as
already discussed in connection with Figure l, these two
transducer elements 1p and 1q, constantly maintaining a
predefined relative angular displacement of A from each
other, are mechanically rotated in a horizontal plane at a
fixed speed around a reference point. This causes the
-28_
CA2iii432
receiving beams P and Q formed respectively by the
transducer elements 1p and 1q to scan underwater in a
horizontal plane. The effect of this dual-beam scanning
is that an ultrasonic echo arriving from one direction is
received by the individual transducer elements 1p and 1q
and resultant signals p(t) and q(t) are outputted with a
certain time interval. More specifically, signal q(t)
obtained by the transducer element 1q is outputted with a
time lag of z compared to signal p ( t ) obtained by the
transducer element 1p.
Indicated by the reference numerals 2p and 2q are
preamplifiers for amplifying echo signals received by the
ultrasonic transducer elements 1p and 1q, respectively;
indicated by the reference numeral 3 is a delay circuit
for introducing the aforementioned time delay z in the
signal received by the transducer element 1p in order to
eliminate the time lag between the two input signals due
to the angular separation between the transducer elements
1p and 1q; and indicated by the reference numeral 5 is a
quadrature detector for separately detecting quadrature
components of the individual signals p(t) and q(t)
obtained by the scanning of the receiving beams P and Q
formed respectively by the transducer elements 1p and 1q.
The quadrature detector 5 incorporates a pair of reference
signal generators 4c and 4s for producing reference
signals with a mutual phase difference of 90°, four
multipliers 6p1, 6p2, 6q1 and 6q2 for multiplying the
-29-
CA2ii7432
received signals by the reference signals fed from the two
reference signal generators 4c and 4s, and four low-pass
filters 8p1, 8p2, 8q1 and 8q2 for eliminating harmonic
components contained in detected signals which are
outputted by the individual multipliers 6p1, 6p2, 6q1 and
6q2.
The received echo signals fed into the quadrature
detector 5 have a mutual phase difference caused by the
Doppler effect on ultrasonic echoes from targets. A phase
difference calculating circuit indicated by the reference
numeral 12 calculates this phase difference from detected
signals pzc(t)', pzs(t)', qc(t)' and qs(t)' obtained by
quadrature detection. More specifically, a processor 13
determines the phase angle of the received signal p(t) by
calculating tan-1{pzs(t)'/pic(t)'} while a processor 14
determines the phase angle of the received signal q(t) by
calculating tan-1{qs(t)'/qc(t)'}. Then, a subtracter 15
calculates the phase difference ~~ between the two
received signals. As will be discussed later, indicated
by the reference numeral 18 is a calculating circuit for
calculating the carrier frequency based on the phase
difference between the two received signals detected by
the phase difference calculating circuit 12.
Now, operation of the circuit of Figure 3 will be
explained in further detail.
The transmitting transducer 101 emits an ultrasonic
pulse signal and the two ultrasonic transducer elements 1p
-30-
CA2ii7432
and 1q that constitute the receiving transducer 1 are
rotated in a horizontal plane at a fixed speed while
maintaining the predefined separation angle 0 as depicted
in Figure 1. When an ultrasonic echo signal arrives from
one particular direction, it is received by the individual
ultrasonic transducer elements 1p and 1q that from
respective ultrasonic receiving beams. Here, the
resultant echo signals p(t) and q(t) are given by
equations (1) and (2). These signals p(t) and q(t) are
amplified by the preamplifiers 2p and 2q. Of these two
signals, the received signal p(t) is _retarded by +t,e delay
circuit 3 by the aforementioned time difference z and the
resultant signal pz(t) is given by equation (3). The
received signals pz(t) and q(t) are then inputted to the
multipliers 6p1-6p2 and 6q1-6q2 of the quadrature detector
5, respectively.
On the other hand, the reference signal generators 4c
and 4s of the quadrature detector 5 output reference
signals coscuot and sinwot, respectively, both having the
same center frequency with the transmitted ultrasonic
frequency but with a mutual phase difference of 90°. One
of these reference signals, coswot, is sent to the
multipliers 6p1 and 6q1 while the other reference signal,
sinwot, is sent to the multipliers 6p2 and 6q2.
Consequently, the four multipliers 6p1, 6p2, 6q1 and 6q2
output signals given by equations (5) through (8) below,
respectively:
-31-
CA2ii7432
pzc(t) = pz(t)~coswot
_ {S(t - z)/2}(cos{w(t - z) + a + m(t - z) +
R + wot} + cos{w(t - z) + a + m(t - i) +
(3 - wot}] ............................... (5)
pzs(t) = pz(t)~sinwot
_ {S(t - z)/2}[sin{w(t - z) + a + m(t - z) +
(3 + wot} - sin{w(t - z) + a + m(t - z) +
(3 - wot}] ............................... (6)
qc(t) = q(t)~coswot
_ {S(t - z)/2}[cos{wt + a + m(t - z) +
(3 + wit} + cos{wt + a + ."( t - ~) +
(3 - wot}] ............................... (7)
qs(t) = qc(t)~sinwot
_ {S(t - z)/2}[sin{wt + a + m(t - t) +
(3 + wot} - sin{wt + a + m(t - i) +
(3 - wot}] ............................... (8)
As harmonic components are filtered out from the above
signals by the low-pass filters 8p1, 8p2, 8q1 and 8q2 in
the succeeding stage, the quadrature detector 5 outputs
the following signals:
pzc(t)' _ {S(t - z)/2}~cos{(w - wa)t + a +
m(t - z) + ~ - an} ..................... (9)
pzs(t)' _ {S(t - z)/2}sin{(w - wo)t + a +
m(t - z) + (3 - cuz} .................... (l0)
qc(t)' _ {S(t - z)/2}~cos{(w - wo)t + a +
m(t - z) + [3} ......................... (11)
qs(t)' _ {5(t - z)/2}sin{(w - wo)t + a +
-32-
CA2ii7432
m(t - z) + R} ......................... (12)
The individual signals pic(t)', pzs(t)', qc(t)' and
qs(t)' obtained by quadrature detection are then delivered
to the phase difference calculating circuit 12.
In the phase difference calculating circuit 12, the
phase angle of one received signal p(t) is obtained
through the arithmetic operation tan-1{pis(t)'/pic(t)'}
performed by the processor 13 while the phase angle of the
other received signal q(t) is obtained through the
arithmetic operation tan-1{qs(t)'/qc(t)'} performed by the
processor la. mhen, the subs=~oter 15 per-ors
subtraction operation to obtain the phase difference ~~
between the two received signals.
As the value of the phase difference, 0~, is sent to the
calculating circuit 18, it calculates the carrier
frequency f using equation (4) mentioned earlier. On the
other hand, the output signals qc(t)'= C and qs(t)'= D of
the quadrature detector 5 are sent to a detector 111 to
calculate amplitude al by the operation (C2 + D2)1/2.
Also, the output signals pzc(t)' and pzs(t)' of the
quadrature detector 5 are sent to a detector 112 to
calculate amplitude a2 in a similar manner.
CIRCUIT EXAMPLE 2
In the description of individual circuit examples to
follow hereunder, circuit elements performing the same
functions as shown in Figure 3 will be designated by the
same reference numerals.
-33-
CA2ii7432
Figure 4 is a circuit example employing matched filters
instead of the quadrature detector 5 of Figure 3. A pair
of ultrasonic transducer elements 1p and 1q are
mechanically rotated at a constant speed around a
reference point along the same trajectory in one direction
while maintaining a constant time lag z in phase angle.
Signals p(t) and q(t) picked up by the ultrasonic
transducer elements 1p and 1q are sent to a pair of
matched filters 30p1 and 30p2 and another pair of matched
filters 30q1 and 30q2 via antialiasing filters 106 and
107, respectively. The individual matched filters 30p1,
30p2, 30q1 and 30q2 are configured by finite impulse
response (FIR) type digital filters.
As already described, since the ultrasonic receiving
beams P and Q formed respectively by the two ultrasonic
transducer elements 1p and 1q scan underwater, ultrasonic
signals arriving from targets are shifted in frequency due
to the Doppler effect. Consequently, signals p(t) and
q(t) obtained by the ultrasonic receiving beams P and Q
become as expressed by equations (1) and (2). These
received signals are linear frequency-modulated (FM)
signals of which frequencies vary with the lapse of time.
Accordingly, receiving beams are created by way of phase
synthesis, or phased array technique, using matched
filters (refer to Japanese Patent Publications No. 57
40664 and No. 63-249071) which have reversed time
characteristics (impulse responses) with respect to the
-34
CA2ii7432
received signals p(t) and-q(t). In other words, the time-
sequentially obtained received signals p(t) and q(t)
having a mutual phase difference are individually
multiplied by certain carrier signals to cause phase
shifts in such a manner that the received signals p(t) and
q(t) are aligned in phase. Then, the received signals are
added together.
More specifically, there are provided four matched
filters 30p1, 30p2, 30q1 and 30q2, which are set so that
impulse response hc(t) of the matched filters 30p1 and
30q1 becomes
hc(t) = cos{wa(-t) - m(-t)}..................... (13)
and impulse response hs(t) of the matched filters 30p2 and
30q2 becomes
hs(t) = sin{wa(-t) - m(-t)}..................... (14)
where wa is the known angular carrier frequency of an
ultrasonic signal produced by a detected target or the
angular carrier frequency of a searching pulse signal
emitted by the transmitting transducer 101.
With the individual impulse responses set as described
above, the received signals that have passed through the
individual matched filters 30p1, 30p2, 30q1 and 30q2
become as follows if the value wa is close to the detected
angular frequency w:
vpc(t) _ {s' (t)/2}~cos{wt + a + m(t) + (3} ....... (15)
Vps(t) _ {S' (t)/2}sin{wt + a + m(t) + (3} ....... (16)
Vqc(t) _ {S'(t - z)/2}~cos{wt + a + m(t - z) + (3} (17)
-35-
cat ~ i 7~~32
Vqs(t) _ {S'(t - z)/2}-sin{wt + a + m(t - z) + (3} (18)
where S'(t) _ (AT/2)-sinc(NO-Tt/2)
sinc(x) = sinx/x
m(t) _ -(1/2)-u0tz
(3 = kOr
p0 = kOrws2
A(t) = amplitude of received signal
T = time duration for which impulse response
characteristic is defined
r = radius of scanning of ultrasonic receiving
beams
ws = angular velocity of scanning of ultrasonic
receiving beams
k0 = constant
a = initial phase of arriving ultrasonic signal
Since the signals Vpc(t) and Vps(t) are delayed by a
predefined time period i, these signals become as follows:
Vp-zc(t) _ {S' (t - z)/2}-cos{wt + a + m(t - z) +
(3 - we}] ............................ (15)'
Vp-zs(t) _ {S' (t - i)/2}-sin{wt + a + m(t - z) +
(3 - wz}] ............................ (16)'
Here, a delay circuit 10 is formed by shift registers.
It is to be noted that equations (15)' and (16)' are
equivalent to previously mentioned equations (9) and (10)
while equations (17) and (18) are equivalent to previously
mentioned equations (11) and (12), respectively.
Accordingly, the individual signals Vp-zc(t), Vp-zs(t),
-36
CA2ii7432
Vqc(t) and Vqs(t) have basically the same phase angles as
the signals pzc(t)', pzs(t)', qc(t)' and qs(t)' obtained by
quadrature detection described referring to Figure 3.
Signal processing in succeeding stages is performed in a
similar manner as shown in Figure 3 and the angular
carrier frequency w of the ultrasonic signal arriving from
a target is calculated.
Although the delay circuit l0 is provided in a stage
following the matched filters in the circuit example
described above, it may be provided in a stage preceding
the matched filters. In the lane= case; it wo~~ld be
possible to reduce the number of internal circuit elements
of the delay circuit l0.
CIRCUIT EXAMPLE 3
According to the aforementioned circuit examples, there
are provided a pair of ultrasonic transducer elements 1p
and 1q, and the angular carrier frequency w of the
ultrasonic signal produced by a target is determined from
the signals picked up by the ultrasonic receiving beams P
and Q which are formed by the ultrasonic transducer
elements. It is also possible to determine the carrier
frequency f with a single ultrasonic transducer element
1p. Specifically, a single ultrasonic receiving beam P
formed by the ultrasonic transducer element 1p is rotated
at a fixed period z0 and the carrier frequency f is
determined based on signals received in a current
rotational cycle and a preceding rotational cycle of beam
-37-
CA2ii7432
scanning. Shown in Figure 5 is an example of this type of
carrier frequency measuring circuit, which is advantageous
in that the circuit configuration can be made much
simpler.
CIRCUIT EXAMPLE 4
Referring now to Figure 6, there is shown a receiving
transducer 1' configured with an array of 120 ultrasonic
transducer elements s equally spaced around the circular
surface of the array, for example. A pair of switching
circuits 7p and 7q individually select 30 each adjacent
transducer elements s at a time among the 120 transducer
elements s arranged in an annular array, shifting the
selection of transducer elements in sequential steps
around the array. Two groups of 30 transducer elements s
selected from the 120 transducer elements s by the
switching circuits 7p and 7q are separated from each other
by a sector angle of 90°. Controlled by the switching
circuits 7p and 7q, signals received by individual groups
of 30 transducer elements s are sent to phase synthesis
circuits 9p and 9q, respectively. Then, two ultrasonic
receiving beams are formed by the phase synthesis circuits
9p and 9q by way of phase synthesis. Furthermore, the
operation of the two switching circuits 7p and 7q is
controlled in such a manner that they would select
individual groups of transducer elements with a time delay
corresponding to the already mentioned time difference z.
As the two ultrasonic receiving beams are rotated
-38-
CA2ii7432
underwater with a constant time difference of z, two
signals p(t) and q(t) having a mutual phase difference of 0
are obtained as in the case of the circuit example shown
in Figure 3.
The succeeding circuit configuration of Figure 6 is the
same as shown in Figure 3. An advantage of the
configuration of Figure 6 which is based on electric beam
forming and scanning-technique is- that the ultrasonic
receiving beams can be rotated at a higher speed compared
to the method of Figure 3 in which a pair of receiving
beams formed by two separate ultrasonic transducer
elements are scanned by mechanically rotating the
ultrasonic transducer elements.
CIRCUIT EXAMPLE 5
Shown in Figure 7 is a circuit example employing matched
filters 30p1, 30p2, 30q1 and 30q2 instead of the
quadrature detector 5 of Figure 6. Unlike the switching
circuits 7p and 7q of Figure 6, switching circuits 7p' and
7q' of this example scan through all 120 transducer
elements s one after another and individually deliver
received signals to the matched filters 30p1, 30p2, 30q1
and 30q2. In this matched filter type circuit example,
individual signals successively fed in time sequence are
processed so that ultrasonic receiving beams are created
by way of phase synthesis.
CIRCUIT EXAMPLE 6
Shown in Figure 8 is a circuit example employing phase
-39
CA2ii7432
synthesis circuits instead of the quadrature detector 5 of
Figure 6.
These phase synthesis circuits 9p1, 9p2, 9q1 and 9q2
each comprise a phase shifter 20 for shifting the phase of
a reference signal fed from an unillustrated oscillator by
specified amounts, multipliers 221-22n for multiplying
individual received signals fed from a switching circuit
7p or 7q by phase-shifted reference signal-inputs from the
phase shifter 20, an adder 24 for adding outputs of the
multipliers 221-22n and a filter 26 for removing harmonic
components contained in an output of the adder 2a, as
shown in Figure 9.
In the phase synthesis circuits for cosine components
and sine components, designated by the reference numerals
9p1 and 9q1, phase synthesis of individual received
signals is performed as their internal multipliers 221-22n
multiply the individual outputs of the switching circuit
7p or 7q by reference signals cos(wOt + A1) to
cos(wOt + 8n) fed from the phase shifter 20. On the other
hand, in the phase synthesis circuits for cosine
components and sine components, designated by the
reference numerals 9p2 and 9q2, phase synthesis of
individual received signals is performed as the individual
outputs of the switching circuit 7p or 7q are multiplied
by reference signals sin(wOt + A1) to sin(wOt + 8n) fed
from the phase shifter 20, all with a phase shift of 90°
from the above-mentioned reference signals.
-40-
Ca2ii7432
Output signals of the phase synthesis circuits 9p1 and
9p2 are delayed by delay circuits lOpl and 10p2. Outputs
of the delay circuits lOpl and 10p2 together with outputs
of the phase synthesis circuits 9q1 and 9q2 are the same
as given by equations (9) to (12) described earlier.
Signal processing in succeeding stages is performed in a
similar manner as the second embodiment (circuit example
2) in order to measure the angular carrier frequency (w -
w0). Since the angular frequency w0 is already known, it
is easy to calculate the carrier angular frequency w, and
then the carrier frequency f, of the incident ~trasonic
signal
The phase synthesis circuit depicted in Figure 9 employs
as means for introducing phase delays the multipliers 22,
phase shifter and oscillator to indirectly shift the
signals picked up by the corresponding ultrasonic
transducer elements. In a varied form of circuit
configuration, there may be provided a delay circuit
comprising inductors and capacitors to directly introduce
necessary time delays to the signals received by the
transducer elements.
Furthermore, instead of the phase difference calculating
circuit 12 employed in the aforementioned circuit
examples, there may be provided a phase difference
calculating circuit 12' having a configuration as shown in
Figure 10.
With this phase difference calculating circuit 12', the
-41
CA 2 i i 7432
phase difference cui between the received signals p(t) and
q(t) obtained from ultrasonic echoes picked up by the two
ultrasonic transducer elements 1p and 1q or by the array
of ultrasonic transducer elements s is expressed by the
following equation, by using signals obtained by
quadrature detection:
tan cuz = {pzs(t)'~qc(t)' + pzc(t)'~qs(t)'}
/{pzc(t)'.qc(t)' + pzs(t)'~qs(t)'} ....... (19)
Accordingly, individual multipliers 12p1, 12p2, 12q1 and
12q2 calculate the values of pzc(t)'~qc(t)', pzs(t)'~qs(t)',
pzs(t)'~qc(t)' and pzc(t)'~qs(t)', respectively, and adders
14p and 14q in a succeeding stage calculate the following
sums: pzc(t)'~qc(t)' + p-cs(t)'~qs(t)' = A, pzs(t)'~qc(t)'
+ ptc(t)'~qs(t)' = B, respectively. Subsequently, a
processor 16 calculates the value of tan-1(B/A) from the
outputs A and B of the two adders 14p and 14q. From the
above operations, tan-1(B/A) = cui = 4~r, which gives the
phase difference A~ between the signals p(t) and q(t)
received by the ultrasonic transducer elements 1p and 1q.
CIRCUIT EXAMPLE 7
Figure 11 shows another circuit example which employs a
memory 42 and a central processing unit (CPU) 44 for
reading out data content of the memory 42, instead of the
delay circuit 10 of Figure 8. Furthermore, the circuit of
Figure 11 comprises processors 16p and 16q for detecting a
phase difference immediately following the phase synthesis
circuits 9p1, 9p2, 9q1 and 9q2.
-42-
CA2~i7432
The memory 42 readily stores data on amounts of phase
angles 6i(t) and Ai(t - z) mutually related by the time
difference i applied to the ultrasonic receiving beam P
when it is scanned (where i = 1 to n, n = the number of
division of the full-circle angle 360°).
Signals 0p(i) and 6q(i), corresponding to the amounts of
phase angles, obtained by the individual processors 16p
and 16q are digitized by analog-to-digital (A/D)
converters 40p and 40q, respectively. The digitized
signals 6p(i) and Aq(i) are then entered into the memory 42
as address data. Subsequently, data on amounts of pha4 a
angles 8i(t) and 6i(t - z) are read from the memory 42 and
based on these data the CPU 44 reads out the value of
phase difference 4~ = 6i(t) - Ai(t - z). Further, the
calculating circuit 18 calculates the value of carrier
frequency f.
CIRCUIT EXAMPLE 8
It is to be recalled that in the circuit example of
Figure 5 two receiving beams having a mutual phase
difference are produced by successively rotating a single
beam formed by a single ultrasonic transducer element 1p.
It is also possible to achieve the operation of two
receiving beams having a mutual phase difference by
successively rotating a single beam formed by a circular
array of ultrasonic transducer elements s as shown in
Figure 6, for example. Figure 12 shows a circuit
configuration based on this type of beam forming, which is
-43
CA 2 i i ?432
advantageous in that the circuit configuration can be much
simplified. This beam forming technique can also be
applied to the circuit examples of Figures 7 and 8. Shown
in Figure 13 is circuit example 9 obtained by applying
this beam forming technique to the circuit configuration
of Figure 8. Further, Figure 14 shows circuit example 10
which would be obtained by moving the delay circuit 10 of
Figure 13 to a succeeding stage of the phase difference
calculating circuit 12. What is characteristic of the
circuit configuration of Figure 14 is that it requires
only one delay circuit 3. Although the receiving
transducer 1' shown in Figures 6 to 1l employs an annular
array of multiple ultrasonic transducer elements s, it is
also possible to arrange a plurality of ultrasonic
transducer elements s to form a linear array. With this
linear array receiving transducer, the switching circuit
switches the individual ultrasonic transducer elements s
in such a manner that a single.receiving beam or a pair of
receiving beams having a mutual angular separation of Az
are produced by way of phase synthesis. The single or
dual receiving beams thus produced are steered and the
angular frequency w of the ultrasonic carrier is obtained
in a similar way as previously described.
Referring now to Figure 15, a second principle upon
which carrier frequency measurement is based will be
explained in the following.
For the purpose of the following discussion, it is
-44-
CA2ii?432
assumed that there is a receiving transducer 1" aligned
with the x-axis of a two-dimensional plane (x, y) as shown
in Figure 15. The receiving transducer 1" is a linear
array constructed with a number of omnidirectional
ultrasonic transducer elements s arranged along the x-
axis, and a plane-wave ultrasonic signal that advances in
a direction intersecting the y-axis at a fixed angle 8
arrives upon the receiving transducer l".
Here, the ultrasonic signal p(x, y, t) that arrives upon
the receiving transducer 1" is expressed by the following
equation:
p(x, y, t) = p0~cos{xk~sinA + y~k~cos6 - wt} ..... (20)
where p0 represents the amplitude (sound pressure) of the
arriving ultrasonic signal while cos{xk~sin8 + y~k~cosA -
w~t} accounts for the phase of the ultrasonic signal, (x,
y) being coordinates, k being a wavelength constant
(= 2rr/~., where ~ is wavelength), to being the angular
carrier frequency of the arriving ultrasonic signal, and t
denoting time. In this argument it is assumed that the
initial phase of the arriving ultrasonic signal is 0 for
simplification. Thus, substituting y = 0, instantaneous
sound pressure on the x-axis is
p(x, t) = p0~cos(x~k~sin6 - wt) .................. (21)
If outputs of successive ultrasonic transducer elements
s are switched at a constant speed u, position x of a
currently selected transducer element is given by
x = u~t ......................................... (22)
-45-
CA2iii432
Substituting equation (22) into equation (21),
p(t) = p0~cos~(u~k~sin6 - w)~t} ................... (23)
If the receiving transducer 1" produces an output signal
v0 when it receives an ultrasonic signal having the sound
pressure p0, receiving sensitivity G of the receiving
transducer 1" is G = v0/p0. Accordingly, output signal
v(t) derived from ultrasonic input signal p(t) is given by
G~p(t). Since v(t) is proportional to p(t), equation (23)
can be rewritten as
v(t) = v0~cos{(u~k~sinA - w)~t} ................... (24)
It would be noticed from equation (24) above that this
expression gives a transducer output signal equivalent to
what would be obtained when a single ultrasonic transducer
element s receives the incident ultrasonic signal while it
is moved along the x-axis at the constant speed u.
Here, the spatial frequency of v(t) is given by the
equation 2rrf = wk~sin6 - w. Deriving power spectrum by
performing Fourier transform of v(t), and knowing the
values of u, k, w and G, it is possible to calculate the
arrival angle 8 and amplitude p0 of the ultrasonic signal
arriving upon the receiving transducer 1".
Next, based on equation (22), the following discussion
deals with a process in which outputs of successive
ultrasonic transducer elements s are switched at a
constant speed a with a time delay of fit.
Position x of a currently selected transducer element is
expressed by
-46-
CA2ii7432
x = u.(t - 4t) .................................. (25)
Substituting the above into equation (21),
p(t) = p0.cos{u.(t - ~t).k~sin6 - w).t}
=p0~cos{(u.k.sinA - w).t - u.~t.k~sin8} ....... (26)
Expressing the signal received and outputted by each
ultrasonic transducer element s by v(t), equation (26) can
be rewritten as
v(t) = v0.cos{(u.k~sin8 - w)~t - u.~t.k.sinB} ....... (27)
On the other hand, if the received signal v(t) given by
equation (24) is delayed by as much as 4t, a resultant
signal v(t-fit) is
v(t - fit) = v0~cos{(u~k~sin0 - w)~(t - 0t)}
= v0.cos{(u.k~sin8 - w).t - u~4bk.sin0
+ w.Ot}.............................. (28)
Thus, the phase difference ~~ between the received
signal v(t) of equation (27) and the received signal v(t -
4t) of equation (28) is
y~ = w.~t ....................................... (29)
From equation (29) above, it is apparent that the phase
difference ~~ is related to the angular carrier frequency
w of the ultrasonic signal arriving from a target.
Here, the time difference 4t may be selected so that it
coincides with the time interval at which a cyclical
switching sequence of the ultrasonic transducer element s
of the receiving transducer 1" is repeated. Since the
time difference ~t is known in this case, carrier
frequency f is derived from the following equation upon
-47-
cat ~ i 732
calculating the value of phase difference 4~:
f = A~l(2rrOt)................................... (30)
Then, Doppler shifts caused by a moving target can be
detected from changes in carrier frequency f.
According to the invention, Fourier transform of the
received signal v(t - fit) given by equation (28) and the
received signal v(t) given by equation (27) is executed to
obtain their phase spectrums. Phase difference 4iU is
calculated by executing subtraction between the phase
angles of both signals for every spatial frequency
component. Each value of phase difference WU is divided
by Ot to convert it into corresponding angular frequency
w, from which carrier frequency f of the ultrasonic signal
can be determined for every spatial frequency component
2rcf (or for every arrival angle 8 of the ultrasonic
signal).
Now, examples of carrier frequency measuring circuits
50' according to the aforementioned second principle will
be described in the following.
CIRCUIT EXAMPLE 11
Referring to Figure 16, the receiving transducer 1" of
this example comprises a number of ultrasonic transducer
elements s arranged to form a linear array and these
ultrasonic transducer elements s are switched at regular
repetition intervals Ot. Indicated by the reference
numeral 202 is a multiplexer for switching received signal
outputs of the individual ultrasonic transducer elements
-48-
CA2ii7~32
s; indicated by the reference numeral 204 is a filter for
eliminating switching noise contained in a multiplexed
received signal outputted by the multiplexer 202;
indicated by the reference numeral 206 is an analog-to-
digital (A/D) converter; and indicated by the reference
numeral 208 is a Fourier transform circuit for executing
Fourier transform of the digitized received signal.
Indicated by the reference numeral 210 is a power
spectrum calculating circuit for calculating power
spectrum of the received signal based on the results of
Fourier transform executed by the Fo~: rier tra_n_sf_-
circuit 208; and indicated by the reference numeral 212 is
a coordinate conversion circuit for converting values of
spatial frequency 2nf taken on the axis of abscissas of
the power spectrum into values of arrival angle A of
ultrasonic signals arriving upon the receiving transducer
1".
Indicated by the reference numeral 214 is a phase
spectrum calculating circuit for determining the phase
spectrum of the received signal based on the results of
Fourier transform executed by the Fourier transform
circuit 208; and indicated by the reference numeral 216 is
a phase difference calculating circuit for calculating
values of phase difference ~~ by executing subtraction
between the phase angles of signals received in a current
scanning cycle and a preceding scanning cycle of the
ultrasonic transducer elements s for individual spatial
-49-
CA2ii7432
frequency components based on phase spectrum obtained by
the phase spectrum calculating circuit 214. In this
circuit example, the phase difference calculating circuit
216 comprises a buffer memory 218 and a subtracter 220.
Indicated by the reference numeral 222 is a conversion
circuit for converting values of spatial frequency f into
values of arrival angle 8 of ultrasonic signals arriving
upon the receiving transducer 1". Further, indicated by
the reference numeral 224 is a carrier frequency
calculating circuit for calculating carrier frequencies f
of ultrasonic signals arriving from t~aA+s based on phase
differences 4~ obtained for individual spatial frequency
components of successively received signals.
The following discussion deals with the operation of an
underwater detection system having the above-described
configuration, focusing particularly on how it determines
arrival angle 8 and amplitude p0 of an ultrasonic signal
arriving from targets as well angular carrier frequency w
of the ultrasonic signal.
As the ultrasonic transducer elements s that construct
the receiving transducer 1" are sequentially switched at
regular repetition intervals ~t by the multiplexer 202,
they receive, or scan, ultrasonic signals arriving from
underwater targets. After switching noise has been
removed by the filter 204, signals picked up by the
individual ultrasonic transducer elements s are digitized
by the A/D converter 206 and the Fourier transform circuit
-50-
CA2ii7432
208 performs Fourier transform. Then, the results of
Fourier transform are sent to both the power spectrum
calculating circuit 210 and phase spectrum calculating
circuit 214.
The power spectrum calculating circuit 210 calculates
power spectrum based on the results of Fourier transform,
with spatial frequency 2rrf of the received signal taken on
the axis of abscissas and output vC of the received signal
taken on the axis of ordinates as shown in Figure 17(a).
Next, the coordinate conversion circuit 212 converts
values of spatial frequency 2lLf taken on the axis of
abscissas of the power spectrum into values of arrival
angle 0 of the ultrasonic signal arriving upon the
receiving transducer 1" and outputs the latter values.
More specifically, spatial frequency 2rrf of the received
signal v(t) is given by 2rrf = u~k~sin0 - w as shown in
connection with equation (24). Since u, k and cu are
known, it is possible to translate the spatial frequency
2rrf into the arrival angle 8 of the ultrasonic signal
arriving upon the receiving transducer 1". It would
therefore be understood that instantaneous arrival angles
(81 and 82 in this example) of the ultrasonic signal with
respect to the receiving transducer 1" and corresponding
output levels v01 and v02 (which depend on the amplitude
p0 of the ultrasonic signal) can be calculated.
On the other hand, the phase spectrum calculating
circuit 214 gives phase spectrum based on the results of
-51-
C,~2i 17432
Fourier transform, with spatial frequency 2rrf of the
received signal taken on the axis of abscissas and phase
of the received signal taken on the axis of ordinates as
shown in Figure 17(b).
Phase spectrum data (shown by solid lines in Figure
17(b)) obtained in a current scanning cycle of the
ultrasonic transducer elements s is transmitted to the
subtracter 220 as well as to the buffer memory 218. At
this point, phase spectrum data (shown by dashed lines in
Figure 17(b)) obtained in a preceding scanning cycle of
the ultrasonic transducer elements s is read from the
buffer memory 218 and sent to the subtracter 220. The
subtracter 220 performs subtraction between phase angles
of two successively received signals, 1.e., the signal
obtained in the current scanning cycle (corresponding to
v(t) of equation (27) ) and the signal obtained in the
preceding scanning cycle (corresponding to v(t - 4t) of
equation (28)), for individual spatial frequency
components (2rrf1 and 2rrf2 in this example). Phase
difference values 0~1 and A~2 are calculated in this
manner.
Subsequently, the conversion circuit 222 converts
individual spatial frequencies 2rrf1 and 2nf2 into
corresponding arrival angles A1 and A2 of the ultrasonic
signal arriving upon the receiving transducer 1". Then,
the carrier frequency calculating circuit 224 divides
phase differences A~1 and A~2 of individual input signals
-52
CA2 i i 7~'r32
by ~t to calculate carrier frequencies fl and f2 of
ultrasonic signals incident at respective arrival angles 81
and A2 as shown by equation (30).
Although the aforementioned circuit example is provided
with the carrier frequency calculating circuit 224 for
calculating angular carrier frequency w, it is possible to
omit the carrier frequency calculating circuit 224 and
directly utilize the phase difference signal A~ outputted
by the unit conversion circuit 222 in a case where
different colors are used to represent amounts of angular
frequency w, for example. This is because, as is apparent
from equaticn (29), there is the relationship cuxpip, with
the scanning repetition interval 4t of the ultrasonic
receiving beam preset to a fixed value, which means that
the phase difference 4~ contains in itself information on
the carrier frequency f.
Furthermore, although the aforementioned circuit example
is provided with the filter 204 so that signals received
by the individual ultrasonic transducer elements s are
inputted without intermission, it is also possible to
prevent intermittent inputs of received signals in an
alternative manner. One of such alternative arrangements
is disclosed in Japanese Patent Publication No. 63-7350,
for example, in which signals received by two adjacent
ultrasonic transducer elements s are inputted
simultaneously, weighted individually by a conversion
circuit and then added together so that the received
-53
CA2ii7432
signals can be successively inputted even when the
individual ultrasonic transducer elements s are switched
in sequence.
In the above-described carrier frequency measuring
circuit, ultrasonic signals arriving from a wide area are
picked up by receiving beams formed at different times to
determine their carrier frequencies. In an alternative
arrangement, multiple receiving beams directed in every
direction of a wide area may be readily formed in order
that ultrasonic signals arriving from all directions can
be detected by the individual receivs-a beams and ~h~-r
carrier frequencies can be determined.
Figure 18 is a block diagram of a ship velocity
compensation/display circuit 100, shown as one embodiment
of the invention, to be connected in a succeeding stage of
any of the various examples of the carrier frequency
measuring circuit 50 described above.
Using input carrier frequency f0 of an ultrasonic
transmit signal and carrier frequency f fed from the
carrier frequency measuring circuit 50, a subtracter 51
performs the operation fs = f - f0 to determine Doppler
frequency shift (velocity) fs.
Since the Doppler frequency shift fs thus obtained
provides relative velocity data as viewed from own ship,
it is possible to determine whether a target is
approaching to or going away from own ship, which would
serve as useful information for collision avoidance. It
-54
CA2ii7432
is also important, however, to obtain information on the
absolute moving velocity of the target itself assuming
that own ship is not moving. This is accomplished by
compensating the Doppler frequency shift fs against own
ship's velocity (which may be an over-the-ground or
through-the-water velocity). (This process is called ship
velocity compensation.) Ship velocity compensation
circuits 61 and 71 are provided for this purpose. The
ship velocity compensation circuit 61 makes ship velocity
compensation by subtracting Doppler frequency shift ~fv
attributed to the ship's velocity tove_r-the-gro»-~ o=-
through-the-water) detected by a later-described circuit
65 or by external equipment from the Doppler frequency
shift fs time-sequentially obtained by the subtracter 51.
Indicated by the reference numeral 62 is a frame memory
for storing corrected values of Doppler frequency shift fm
obtained after the ship velocity compensation process.
The frame memory 62 is constructed in such a manner that
one frame of echo data (frequency fm) derived from one
transmission cycle can be written simultaneously and these
data are updated with new data derived from each
successive transmission cycle.
The ship velocity compensation circuits 61 and 71 are
configured with a ROM. These circuits are configured in
such a manner that when data on the Doppler frequency
shift fs is fed from the subtracter 51 and data on the
Doppler frequency shift ~fv (fl or f2) attributed to the
-55
CA2ii7432
over-the-ground or through-the-water ship velocity is fed
from an internal ship velocity based correction value
calculator 65 or external ship velocity based correction
value calculator 67, a specific signal corresponding to a
corrected Doppler frequency is transmitted.
Indicated by the reference numeral 63 is an amplitude
averaging circuit for calculating mean value a of echo
signal amplitudes al and a2 obtained by the carrier
frequency measuring circuit 50. If only one echo signal
amplitude value is inputted, the amplitude averaging
circuit 63 automatically outputs that value. ?~dicated by
the reference numeral 64 is a frame memory for storing
data on average amplitude a obtained by the amplitude
averaging circuit 63. The Doppler frequency shift fs and
average amplitude a obtained from the same search point
(same sound source) via the carrier frequency measuring
circuit 50 are written in the same addresses of the frame
memories 62 and 64, respectively. The internal ship
velocity based correction value calculator 65 is intended
to calculate the Doppler frequency shift ~fv attributed to
the over-the-ground or through-the-water ship velocity as
a correction value to be applied to the ship velocity
compensation circuit 61 from the aforesaid Doppler
frequency shift fm. Specifically, the internal ship
velocity based correction value calculator 65 reads out
data from such an area of the frame memory 62 that is
specified by a readout area designating unit 66 and
-56-
CA2ii7432
calculates Doppler frequency shifts 4fv (fl or f2)
attributed to the over-the-ground or through-the-water
ship velocity.
As will be discussed later, the internal ship velocity
based correction value calculator 65 contains a processing
unit for calculating Doppler frequency shifts fl or f2
attributed to the over-the-ground or through-the-water
ship velocity for individual horizontal directions, a
memory unit comprising, for example, 360 memory elements
for storing the Doppler frequency shifts fl or f2 and a
readout unit for successively reading oat~ the stored
Doppler frequency shifts fi or f2 and outputting them to
the ship velocity compensation circuit 61. The readout
area designating unit 66 selects whether to read out the
Doppler frequency shifts fl or f2 attributed to the over-
the-ground or through-the-water ship velocity.
Furthermore, the internal ship velocity based correction
value calculator 65 obtains amplitude data a of echoes
from the same sound source as the Doppler frequency shifts
fl or f2 read out from the frame memory 62 by reading out
data from the same memory area of the frame memory 64 as
specified for the frame memory 62 by the readout area
designating unit 66. The amplitude data a (hereinafter
referred to as the amplitude associated with the frequency
data) is used to give specific weights (or thresholds)
when calculating a ship velocity based correction value.
The external ship velocity based correction value
-57-
CA2 i . ;~'~
calculator 67 derives a correction value ~fv to be applied
to the ship velocity compensation circuit 61 from the
over-the-ground ship velocity fed from external equipment
(e.g., a system comprising a GPS receiver and a
gyrocompass) or from the through-the-water ship velocity
fed from other external equipment (e. g., a water current
measuring apparatus). More specifically, using externally
entered over-the-ground or through-the-water velocity
information, the external ship velocity based correction
value calculator 67 calculates an over-the-around or
through-the-water ship velocity component in tse d;= ection
of a sound source from which a particular carrier
frequency f has been obtained, and then derives a Doppler
frequency shift ~fv (fl or f2) corresponding to the ship
velocity component. The over-the-ground ship velocity and
through-the-water ship velocity obtained by the internal
ship velocity based correction value calculator 65
(hereinafter referred to as the internal over-the-ground
and through-the-water ship velocities, respectively) and
the over-the-ground ship velocity and through-the-water
ship velocity acquired by the external ship velocity based
correction value calculator 67 (hereinafter referred to as
the external over-the-ground and through-the-water ship
velocities, respectively) give rise to Doppler frequencies
fl and f2. Either fl or f2 is then chosen by a select
switch 68 and transmitted to the ship velocity
compensation circuit 61. When the select switch 68 is
-58-
CA2ii7452
switched to a unconnected terminal x, the ship velocity
compensation circuit 61 does not make any compensation.
In this case, the ship velocity compensation circuit 61
outputs the input data as it is and the frame memory 62
stores raw, or unprocessed, data.
When interfaced with a GPS (Global Positioning System)
receiver and a gyrocompass, for example, the external ship
velocity based correction value calculator 67 transmits
Doppler frequency shifts fl induced by the over-the-ground
ship velocity. On the other hand, when interfaced with a
water current measuring anoaratus wh; ch m~=~,:res water
current velocities by transmitting and receiving an
ultrasonic signal, the external ship velocity based
correction value calculator 67 transmits Doppler frequency
shifts f2 induced by the through-the-water ship velocity.
The external ship velocity based correction value
calculator 67 contains a processing unit for calculating
Doppler frequency shifts fl or f2 attributed to the over-
the-ground or through-the-water ship velocity, a memory
unit comprising, for example, 360 memory elements for
storing the Doppler frequency shifts fl or f2 and a
readout unit for successively reading out the stored
Doppler frequency shifts fl or f2 and outputting them to
the ship velocity compensation circuit 61.
It is possible to know irregularities in target
velocities by determining a variance of Doppler frequency
shifts fm obtained by the ship velocity compensation
-59-
CA2 . ,~
I I I l
circuit 61. A variance calculating circuit 69 is provided
for this purpose. Variance values obtained by the
variance calculating circuit 69 are stored in a frame
memory 70 which has the same structure as~the frame memory
62.
The ship velocity compensation circuit 61 compensates
Doppler frequency shifts on a real-time basis as they are
outputted from the subtracter 51 whereas the ship velocity
compensation circuit 71 compensates one frame of raw data
once stored in the frame memory 62. Indicated by the
reference numeral 72 is a select switch for choosing
whether to use the internal over-the-ground ship velocity
o r internal through-the-water ship velocity for
compensation. Indicated by the reference numeral 73 is a
select switch for choosing Doppler frequency shifts fm
outputted from the ship velocity compensation circuit 61
in real time or frequency data f outputted from the ship
velocity compensation circuit 71 with one-frame delay.
Also, a select switch 74 chooses variance values outputted
from the variance calculating circuit 69 in real time or
variance data once stored in the frame memory 70.
Similarly, a select switch 75 chooses amplitude values
outputted from the amplitude averaging circuit 63 in real
time or amplitude data once stored in the frame memory 64.
The select switches 73-75 are interlocked in operation.
So far described in connection with Figure 18 is circuitry
concerned with ship velocity compensation. Now, display
-60-
LAL I . j'~, .,,
circuitry will be explained in the following.
Indicated by the reference numeral 76 is a
frequency/color conversion circuit for representing
frequency data chosen by the select switch 73 in different
colors depending on frequency values. In this color
conversion process, amplitude data a associated with
individual frequency data f received via the select switch
75 are used as threshold values. Indicated by the
reference numeral 77 is a variance/color conversion
circuit for representing variance data of chosen by the
select switch 74 in different colors deoendina ~~ v=~;ance
levels. In this color conversion process, amplitude data
a associated with individual variance data are used as
threshold values. Indicated by the reference numeral 78
is a frequency-variance/color conversion circuit which
converts each combination of frequency and variance data
into a corresponding color referring to both data.
Indicated by the reference numeral 79 is an
amplitude/color conversion circuit for generating a color-
coded picture in accordance with amplitude data a.
Indicated by the reference numeral 80 is a filter-
amplitude/color conversion circuit for producing a color
signal corresponding to amplitude data a if associated
frequency data f falls within a specified frequency range,
a background color signal if associated frequency data f
lies outside that frequency range.
The frequency/color conversion circuit 76 acquires a
-61
,.
;..
..,a.! I. ~~~
Doppler frequency shift signal of an echo signal if it
falls within a signal level range established based on a
signal fed from a signal level range setter, and converts
the acquired signal into a color-coded signal
corresponding to the frequency of the signal. Comprising
a ROM prestoring a particular relationship between
frequencies and various colors, the freguency/color
conversion circuit 76 transmits color-coded signals
corresponding to frequency signals delivered via the
select switch 73.
The variance/color conversion circuit 77 aca»'res
variance data of an echo signal if it fails within a
signal level range established based on a signal fed from
a signal level range setter, and converts the echo signal
into a color-coded signal corresponding to the variance
data of the echo signal. Comprising a ROM prestoring a
particular relationship between variance data and various
colors, the variance/color conversion circuit 77 transmits
color-coded signals corresponding to variance data signals
delivered via the select switch 74.
The frequency-variance/color conversion circuit 78
generates a color-coded signal corresponding to the
frequency and variance of an echo signal if it falls
within a signal level range established based on amplitude
data a, Doppler frequency shift signal f, variance data
and a signal fed from a signal level range setter. The
frequency-variance/color conversion circuit 78 comprises a
C ;a ~ l l % v-
't J
ROM prestoring a particular relationship between
combinations of frequency and variance data and various
colors.
The filter-amplitude/color conversion circuit 80
acquires an amplitude signal of an echo signal if its
Doppler frequency shift falls within a frequency range
established based on a signal fed from a frequency range
setter; and converts the acquired amplitude signal into a
color-coded signal corresponding to the amplitude.
Comprising a filter which will pass the amplitude signal
when a Doppler frequency shift signal fed +hre,_ah the
select switch 73 falls within tie set frequency range and
a ROM prestoring a particular relationship between signal
levels and various colors, the filter-amplitude/color
conversion circuit 80 transmits color-coded signals
corresponding to amplitude signals delivered via the
select switch 75.
The amplitude/color conversion circuit 79 comprises a
ROM prestoring a particular relationship between signal
levels and various colors.
In the above-described color conversion processes
performed by the conversion circuits 76-78, amplitudes a
of input data to be converted are referenced and only
those input data that lie within the desired amplitude
range established by the signal level range setters are
subjected to conversion.
Indicated by the reference numeral 81 is a frequency
-63-
CA2ii7432
histogram generating circuit for generating a histogram
representing a frequency distribution based on the
frequency data fed from the frame memory 62; and indicated
by the reference numeral 82 is a designating unit for
specifying and entering a desired searching area.
Indicated by the reference numeral 83 is a velocity vector
generating circuit for determining a velocity vector for
an area specified via a designating unit 84 based on the
frequency data fed from the frame memory 64. Further,
indicated by the reference numeral 85 is a selection
circuit which makes a selection among output sign=~= of
the aforementioned circuits and transmits selected
signals) to a display unit 86.
Now, ship velocity compensation will be described in the
following. First, consideration is given to a case where
one frame of data is once memorized and then compensated
all together. (This type of compensation is hereinafter
to as collective compensation.) In this case, the select
switch 68 is switched to its unconnected terminal x so
that Doppler frequencies fs are stored in the frame memory
62 without any compensation, and the select switches 73-75
are set to the positions shown by solid lines in Figure
18.
In an under4vater detection sonar, an ultrasonic beam
spreading in a cone-shaped form as illustrated in Figure
19 is transmitted toward the sea bottom by the
transmitting transducer 101 shown in Figure 3 and
-64
cazr i ia~2
resultant echoes are detected by the receiving transducer
1 which is rotated or scanned in operation. This means
that the receiving transducer 1 scans through search
points located along a spiral pattern on the conical
surface as shown in Figure 19. Data sequentially acquired
with this form of scanning are written in the frame memory
62 without any compensation in this case. The frame
memory 62 has a two-dimensional structure (which is same
as the structure of the other frame memories) as shown in
~;;., , _
Figure 20, where the bearing is taken in the horizontal
direction and the range (or depth) is t ~n ~_ th_e
vertical direction. The acquired data are successively
written in one line after another of the memory structure,
starting from the upper-left memory location and
proceeding toward the lower-right memory location.
Referring to Figure 20, data written in memory area X was
derived from an early part of echoes (i.e., echoes from
shallow water) received after one transmission, and it
follows that this portion of data represents the Doppler
frequency shift f2. On the contrary, data written in
memory area Y was derived from an later part of echoes
(i.e., echoes from a bottom at a greater depth) received
after the transmission, and it follows that this portion
of data represents the Doppler frequency shift f1. These
memory areas X and Y are specified by the readout area
designating unit 66 in this embodiment. In a modified
arrangement, the memory area Y may be automatically
-65-
CA2117432
determined depending on the bottom depth and tilt angle (~
shown in Figure 19) of a transmitted ultrasonic beam.
Although it has been assumed in the foregoing description
that the carrier frequency measuring circuit 50 produces a
fixed tilt angle, modification is possible to allow for a
varying tilt angle. Specifically, in the configuration of
Figure 3 employing a pair of ultrasonic transducer
elements 1p and 1q which are rotated mechanically, it is
possible to obtain a desired tilt angle by varying their
orientations. Also, in the configuration of Figure 6
emp' c-=7 a circ~~l ar array of ~ltrscaic try-r~_
elements which are switched electrically to perform beam
scanning, it is possible to obtain a desired,tilt angle by
way of phase synthesis, which would be accomplished by a
plurality of receiving transducers 1' stacked vertically
to construct a cylindrical transducer array with phase
shifts applied to.columns of transducer elements in every
azimuthal direction. Of course, when an ultrasonic
receiving beam is aimed in a horizontal direction (i.e.,
tilt angle zero), there will be no return echo from the
sea bottom and it is impossible to obtain Doppler
frequency shifts fl originating from the over-the-ground
ship velocity. In such a case, an over-the-ground ship
velocity obtained from an external source is used as will
be explained later.
Referring to Figure 20, stored in a memory area
corresponding to the range between 0 an f is a carrier
-66
CA2117432
signal of frequency f0 transmitted by the transmitting
transducer 101. This 'is because a small part of the
transmitted signal leaks through a trap circuit for
transmit/receive switching (unillustrated) and is detected
by the receiving transducer 1. It follows that the
frequency f0 read from this memory area is delivered to
the previously described subtracter 51 as a correction
signal. With this configuration, adverse effects that may
result from variations due to frequency drift of a
transmitting crystal oscillator, phase errors in the
receiver circuitry or variations s-n a sampling f-~n»~ncy
are canceled out and it would be possible to obtain
accurate Doppler frequency shifts fm.
Depicted in Figure 21 is an example of presentation
obtained with the above configuration, where detection
results are displayed in a polar coordinate form around
own ship at the central point O. The area between radial
ranges r1 and r2 represents data within memory area X
while the area between radial ranges r3 and r4 represents
data within memory area Y. As radii r are specified by
the readout area designating unit 66, it is possible to
obtain individual Doppler frequency shift data attributed
to over-the-ground and through-the-water ship velocities
from memory locations of the frame memory 62 illustrated
in Figure 20.
Doppler frequency shifts fl(j) and f2(j) attributed to
internal over-the-ground and through-the-water ship
-67-
~~2117432
velocities in each individual direction are obtained by
averaging data read from the memory areas x and Y along
the range axis (D(j, k): k = p to q for over-the-ground
ship velocity; k = g to h for through-the-water ship
velocity) in every horizontal direction (D(j, k): j = 0 to
m), substituting the data into equations (31) and (32).
q
~A(j. k)~D(j. k)
f1(7) = k p
H
~A(j, k)
k=p
or, substituting A(j, k) = 1,
a
~~(j. k)
fl(J) = kh-g+i ............................... (31)
h
~.A(J~ k)~D(J~ k)
k=g
f2(j) = h
~A(j, k)
k=g
or, substituting A(j, k) = 1,
g
k>
f2(J) = kq p+1 ............................... (32)
If the select switch 72 is set at the internal over-the-
ground ship velocity position as shown in Figure 18,
Doppler frequency shift data fl for compensation by the
over-the-ground ship velocity is sent to the ship velocity
compensation circuit 71. In this case, Doppler frequency
shift fe showing the over-the-ground velocity of a target
is obtained by subtracting Doppler frequency shift fl(j)
-68-
ca2> > X432
attributed to the over-the-ground ship velocity in a
direction corresponding to every raw data D(j, k) (where
j = 0 to m; k = 0 to n) read from the frame memory 62.
Thus,
fe(j, k) ° D(j. k) - fl(j)...................... (33)
Contrarily, if the select switch 72 is set at the
internal through-the-water ship velocity position, Doppler
frequency shift fw showing the through-the-water velocity
of a target is obtained by subtracting Doppler frequency
shift f2(j) attributed to the through-the-water ship
velocity in a direction co_rresnen~sna to every r-~~~ ~-+a
D(j, k) (where j = 0 to m; k = 0 to n) read from the frame
memory 62. Thus,
fw(j, k) = D(j, k) - f2(j)...................... (34)
According to the above-described collective
compensation, correction data fl(j) and f2(j) are obtained
after acquiring one frame of data D(j, k) and the whole
frame of data D(j, k) are compensated with the correction
data. In this compensation process, there arises a time
delay equal to one transmission cycle. Described next is
a ship velocity compensation process where obtained data
is successively compensated. (This type of compensation
is hereinafter referred to as sequential compensation.)
In the case of sequential compensation, the select
switch 68 is set at the internal over-the-ground or
through-the-water ship velocity position while the select
switch 73 is set at the position shown by a dashed line in
-69-
Ca2117432
Figure 18. (The interlocked select switches 74 and 75 are
also set at the positions shown by dashed lines.) Doppler
frequencies fs time-sequentially supplied from the
subtracter 51 are compensated in real time by the ship
velocity compensation circuit 61 and compensated data are
stored in the frame memory 62 while they are outputted
directly to the frequency/color conversion circuit 76 via
the select switch 73.
If the select switch 68 is set at the internal through-
the-water ship velocity position, carrier frequency data f
already compensated with a correction value f2(n-~? __ a
sequentiaiiy stored in the frame memory 62 starting from
its upper-left memory location as already described
referring to Figure 20. When carrier frequency data f
affected by the through-the-water ship velocity have been
stored up to the memory area X, f2(j) is calculated by
substituting those data into equation (32). Then, adding
the previous correction value f2(n-1](j) to f2(j), the sum
f2[n] = f2(j) + f2(n-1](j) is sent to the ship velocity
compensation circuit 61 as new correction data.
Accordingly, Doppler frequency shifts fs compensated with
the new correction data are that part of input data which
occur after the memory area X shown in the address map of
Figure 20 and input data occurring up to the memory area X
are compensated with correction data obtained previously
(i.e., one transmission cycle earlier).
On the contrary, if the select switch 68 is set at the
-70-
~A2117432
internal over-the-ground ship velocity position, the
internal ship velocity based correction value calculator
65 calculates Doppler frequency shift fl to be used as
correction data based on the over-the-ground ship velocity
when frequency data have been stored up to the memory area
Y shown in Figure 20. Accordingly, Doppler frequency
shifts fs compensated with the new correction data are
that part of-input data which occur after the memory area
Y shown in the address map of Figure 20 and input data
occurring up to the memory area Y are compensated with
correction data obtained in a a=ece irg tran~m;~~;cn
cycle. It would be understood from the above discussion
that although the sequential compensation method provides
corrected measurement data on a real-time basis,
correction data used for ship velocity compensation is not
derived from the latest measurement data. Nevertheless,
there is formed a data correcting loop and correction data
is continually updated so that reasonably accurate, real-
time ship velocity compensation can be expected from the
sequential compensation method.
In the collective compensation and sequential
compensation methods so far described, the ship velocity
compensation/display circuit 100 compensates input data by
using correction data derived from its own input data.
Described below is a external compensation method in which
ship velocity compensation is performed by the use of ship
velocity information obtained from external equipment.
-71-
02117432
This compensation method is useful when the over-the-
ground or through-the-water velocity can not be obtained
internally due to unfavorable measuring conditions, for
example.
If the select switch 68 is set at the external over-the-
ground ship velocity position, over-the-ground ship
velocity V1 (in horizontal direction 8) and ship's heading
a are entered from external equipment comprising a GPS
receiver and a gyrocompass, for example,'into the external
ship velocity based correction value calculator 67. Then,
using the over-the-ground ship velocity Vl, the ext~--~a~
ship velocity based correction value calculator 67
calculates an over-the-ground ship velocity component
V1(j) for each individual horizontal direction from
equation (35) below:
V1(j) = Vl~cos(a + 2rrj/m - A) ................... (35)
where j = 0, 1, 2 ... m.
A subsequent mathematical operation derives a Doppler
frequency fl(j) corresponding to the over-the-ground ship
velocity component V1(j) taken in each individual
horizontal direction. Using the Doppler frequency fl(j)
as correction data, the ship velocity compensation circuit
61 calculates a Doppler frequency shift fe(j, k) of a
target echo due to the over-the-ground ship velocity from
previously described equation (33) and the Doppler
frequency shift fe(j, k) is sent to the select switch 73.
If the tilt angle is (3, the over-the-ground ship velocity
-72-
~A2117432
component V1(j) becomes
V1(j) = Vl~cos(a + 2rrj/m - 0) x cosy ............ (36)
If the select switch 68 is set at the external through
the-water ship velocity position, through-the-water ship
velocity V2 is entered from external equipment comprising
a water current measuring apparatus, for example, into the
external ship velocity based correction value calculator
67. A through-the-water ship velocity component V2(j) for
each individual horizontal direction is derived from the
through-the-water ship velocity V2 in a manner similar to
what was explained already and a DnouL-r fre~,~oncv fly s
corresponding to the through-the-water ship velocity
component V2(j) is calculated. Then, a carrier frequency
fw(j, k) of a target echo attributed to the through-the-
water ship velocity is calculated using equation (34).
The external compensation method described above enables
real-time ship velocity compensation (hereinafter referred
to as real-time compensation) since instantaneous ship
velocity information is fed from external equipment.
Now, an alternative method of calculating Doppler
frequency shifts fl and f2 will be described in the
following.
Doppler frequency shifts fl and f2 attributed to over-
the-ground and through-the-water ship velocities obtained
for individual horizontal directions from equations (31)
and (32) should vary in accordance with a cosine curve as
expressed by equation (35) in theory, but in actuality
-73-
w. _ .~.. _
ca z > > 7432
they do not follow the cosine curve pattern as a result of
noise, for example, and accurate frequency shift data is
unobtainable in certain cases. Using fl and f2 values
given by equations (31) and (32), it is possible to
estimate cosine curves which allow more accurate
estimation of fl and f2.
To estimate a cosine curve from Doppler frequency shifts
fl obtained from equation (31), V(j) is expressed as
v(j) = V~cos(2rrj/m - A) ......................... (37)
where j = 0, 1, 2 .., m. Using equation (37), V and 8
which min;m;ze the sum Q of sauares of c3iFFeronces aiv~=
by equation (3Fs) below are obtained:
Q = ~cuj{V1(j) - fl(j&2 ............:............ (38)
p
q
where wj is a weight function expressed by ~ A(j, k) of
k=p
equation (31), for example.
Substituting results of the above operation into (36), a
cosine curve can be estimated. This cosine curve is used
to calculate fl(j) for ship velocity compensation. Also,
f2(j) is estimated in a similar way.
Doppler frequency shifts fe and fw (hereinafter referred
to as frequency data f) corrected against over-the-ground
(or through-the-water) ship velocities in any of the
above-described compensation modes (collective and
sequential compensations) are delivered to the
frequency/color conversion circuit 76 via the select
switch 73. Using individual values of the frequency data
-74
0 2117432
f, it is possible to determine the over-the-ground (or
through-the-water) velocity components (hereinafter
referred to as velocity) of targets in the direction of
own ship as well as their moving directions (i.e., whether
they are approaching or receding from own ship). Based on
such information, the frequency/color conversion circuit
76 performs a conversion of data into 8 colors according
to a scheme shown in the Table below for simultaneous
presentation of moving velocities and directions of
targets on the display unit 86.
Also used in the above-described ce~or converts,-
process is amplitude data a associated with the frequency
data f. Delivered via the select switch 75, the amplitude
data a defines an amplitude range, and only that part of
the frequency data f limited by the amplitude range goes
through the color conversion process. Similar amplitude
range limitation is done in color conversion processes
performed by the variance/color conversion circuit 77 and
frequency-variance/color conversion circuit 78 as well.
Table 1
Moving velocity: High 0 High
Moving direction: (Approaching) (Not moving) (Receding)
8-bit data: 0 ......... 128 ......... 255
Displayed color: Brown Red Orange Yellow Green Blue Purple Deep blue
According to the above Table, if a target is stationary,
it appears as yellow or green. If the target is
approaching, it is painted in a warm color such as brown,
-75
red or orange depending on its moving velocity whereas if
the target is receding, it is shown in a cool color such
as deep blue, purple or blue depending on its moving
velocity. To allow for clear discrimination between
moving targets and stationary targets, color assignments
may be modified so that stationary targets are represented
by a grayish color, for instance.
Furthermore, when using 16 display colors, intermediate
colors may be inserted between the above-mentioned color
assignments. For 16-color presentation, the frequency
data f which is typically expressed by 8-bit data (256
steps) .-«ust be converted into 4-bit data (16 steps).
Conversion of the 8-bit data into color codes is typically
performed using a linear function as depicted by a line L1
in Figure 22. Alternatively, color conversion may be
accomplished in accordance with a parabola L2 or an
exponential curve L3 shown in Figure 20 so that a certain
velocity range is enhanced or suppressed. Whichever
conversion scheme is used, information about a
relationship between 8-bit data and color codes is read
from a ROM which stores a color assignment data.
The following discussion deals with variance. As
already mentioned, information on moving velocities of a
fish schools acquired through an analysis of fish echo
frequencies is useful for fishing operation using a sonar
or an echo sounder. The moving velocity of a fish school
accounts for the average velocity of individual fish in
-76-
CA2117~32
the school. It is to be noted that variations (or
deviations) in the moving velocities of individual fish in
the school also provide important information for
recognition of the fish school itself and determination of
fish species and lengths. Furthermore, knowing velocity
deviations would help discriminate a swarm of underwater
targets from absolutely stationary obiects (e.g. sea
bottom). Circuit configuration of the variance
calculating circuit 69 which is intended to derive
variance data from the distribution of the aforementioned
carrier frequency data f will be descried i.~ +h~
foilowinQ.
Referring to Figure 23, Doppler frequency shifts fm fed
from the ship velocity compensation circuit 61-of Figure
18 are converted into angular frequencies cu by an angular
frequency calculating circuit 151. Next; an averaging
circuit 152 calculates an average angular frequency
(hereinafter written as cu), which is delivered to an
adding input of a summing circuit 153. On the other hand,
unaveraged angular frequencies cu are retarded by a delay
circuit 154 by a time period equivalent to a delay time
occurring in the averaging circuit 152 before they are
delivered to a subtracting input of the summing circuit
15 3 . The output I w - cu ~ ( or I w - cu ~ Z ) of the summing
circuit 153 is smoothed out by a smoothing circuit 155 to
obtain a variance af. In the averaging process performed
by the averaging circuit 152, input data may be weighted
_77_
CA2117432
with amplitudes a to produce a weighted average.
Figure 24 shows an alternative circuit configuration of
the variance calculating circuit 69. Doppler frequency
shifts fm are converted into angular frequencies w by an
angular frequency calculating circuit 161. An averaging
circuit 162 calculates an average angular frequency
(hereinafter written as w) and a squaring circuit 163
calculates its square (w)2. On the other hand, a squaring
circuit 164 calculates squares w2 of angular frequencies w
and an averaging circuit 165 averages these squares w2.
Then, a summing circuit 166 performs a subtraction w2
(w)~ to co~ain a variance af.
The variance calculating circuit 69 calculates the
variance of Doppler frequency shifts fm (raw data in
collective compensation, corrected data in sequential
compensation and real-time compensation) outputted from
the ship velocity compensation circuit 61 as described
above. The variance data thus obtained is transmitted to
the select switch 74 while it is written in the frame
memory 70. The variance data coming directly from the
variance calculating circuit 69 or read from the frame
memory 70 is delivered to the variance/color conversion
circuit 77 via the select switch 74. At this point, color
data is read from a conversion data ROM which is similar
to the already described one in accordance with individual
variance values and the display unit 86 presents a color-
coded variance data picture.
_78_
caz> > 7432
As the frequency-variance/color conversion circuit 78
converts each combination of frequency data f and variance
data of into a corresponding unique color, it is possible
to simultaneously evaluate the frequency and variance from
one picture presented on the display unit 86. An example
of color conversion scheme is shown in the Table below.
When the variance is small, the presentation is
successively changed in the order of red, ...gray,... and
blue corresponding to the maximum approaching velocity,
minimum (zero) velocity and maximum receding velocity,
respectively, and as the va,-;ance grows ~-r_°_-, ere~.w ~_
mixed to these colors at an increasingly higher ratio.
Table 2
Moving velocity: High 0 Hiah
b
Moving direction: (Approaching) (Not moving) (Receding)
(Small variance) Red ....:.... Gray ......... Blue
Displayed
color:
(Large variance) Yellow ......... Green ......... Cyan
The filter-amplitude/color conversion circuit 80 is
provided with a filtering function to permit color
conversion of only such input data of which frequencies
fall within a desired frequency range. This frequency
range is determined with reference to Doppler frequency
shifts fm. If it is set to the system frequency bandwidth
of the underwater detection system, for example, amplitude
data a found only within this frequency range are color-
_79_
02117432
converted, in which case interference from signals of
other frequency ranges would be rejected. Alternatively,
by allowing color conversion of only such signals
exceeding a specified frequency (velocity), influence of
stationary targets such as the sea bottom can be
eliminated.
The following discussion deals with a histogram
presentation. Figure 25 shows an example of a target
velocity picture produced by the frequency/color
conversion circuit 76 as presented on the display unit 86.
It is assumed that targets T1 to T3 a_rP r~-+~c+~d at
present. If an operator wants to know a frequency
(velocity) distribution of the target T1; he should enter
parameters to specify an area (i.e., bearing limits 01-02
and range limits rl-r2) where the target T1 is displayed
via the designating unit 82. As a result, the frequency
histogram generating circuit 81 reads frequency data f
from a memory area S (corresponding to the operator-
specified area) of the frame memory 62 as depicted in
Figure 26 and a frequency distribution is derived from the
frequency data f. Then, a histogram representing the
frequency distribution is displayed as shown in a display
window W in Figure 25.
In the various forms of presentations described above,
Doppler frequency shifts fm compensated against own ship's
velocity are adopted as input data for the frequency/color
conversion circuit 76 and other circuits 77, 78, 81, 83.
-80
~A2117432
In an alternative approach, Doppler frequency shifts fm
uncompensated against own ship's velocity may be adopted
as input data. In this case, the select switch 68 should
be set to its unconnected terminal x and raw data
outputted from the ship velocity compensation circuit 61
or stored in the frame memory 62 should be used as input
data.
The ampiitude/color conversion circuit 79 converts its
input data into different colors depending on amplitude
levels to produce an ordinary amplitude level picture.
In the aforementioned disolav exa=enle . +h~ sWac~~on
circuit 85 selects one of the outputs of the individual
conversion circuits 77-80, frequency histogram generating
circuit 81 and velocity vector generating circuit 83 and
the display unit 86 presents a single picture (single
display mode). In a varied form of presentation, the
display unit 86 may simultaneously present an amplitude
level picture 86a fed from the amplitude/color conversion
circuit 79 on an upper half of the screen and a target
velocity picture 86b fed from the frequency/color
conversion circuit 76 on a lower half of the screen
(combination display mode), as shown in Figure 27, for
instance. This arrangement allows for a direct comparison
between two different pictures, which would serve to
further enhance target discriminating capabilities:
Now, the following discussion deals with a technique for
increasing the resolution.
-81-
a
CA211~~432
Generally, the system resolution for distinguishing
between adjacent target echoes depends on the scanning
speed of the ultrasonic receiving beam. However, there is
a limit to the effort to achieve higher scanning speeds
due to limitations in processing speeds of later-stage
electric circuitry. Referring to Figure 28, an arrow Y
shows the direction of an ultrasonic receiving beam formed
by-the receiving transducer 1' of Figure 6, for example.
Here, it is assumed that each successive rotation of the
ultrasonic receiving beam Y takes 80 msec. Provided that
the ultrasonic receiving beam Y has detected a= echo at
time t1 in the direction of the arrow, it would detect a
succeeding echo 80 msec later, or at time t3, in the same
direction as shown in Figure 29. It would be understood
from the above consideration that the ultrasonic receiving
beam Y can just detect arriving echoes at 80 msec
intervals in each direction, which means that there are
certain losses of echo information.
One approach to solve the above problem is to control
the switching circuits 7p and 7q to have them switch the
ultrasonic transducer elements s in such a way as to
provide a narrower searching area as shown in Figure 29,
where half-circle scanning is performed instead of full-
circle scanning. This arrangement would reduce echo
detecting intervals to 40 msec, resulting in twice as high
a sampling rate. In this case, the system resolution is
also doubled because an echo arriving at time t2 can
-82-
CA2117432
additionally be detected. Further, if the searching area
is narrowed to a 45° sector, the echo detecting intervals
become 10 msec, which would serve to increase the system
resolution 8 times as high as obtained with full-circle
scanning. Detailed echo information can be obtained by
increasing the resolution in the above manner. This would
permit an enlarged presentation of detection results,
making- it possible to further enhance target
discriminating capabilities.
In the system of Figure 3, for example, the phase
difference detecting circuit 12 calcu?atA.s +h~ phase
Q_=_erence G'lE1 (0=G'l~=21L~ ~"Jet?T2cu tW0 Signals uc~cv:vcd by a
pair of ultrasonic receiving beams which are separated by
an angular deviation of 8 (which corresponds to a time
difference z) from each other. As is apparent from the
relationship G~ = ww, the phase difference 4~ is
proportional to the angular carrier frequency w as shown
by line L1 in Figure 30. However, the phase difference G~.
outputted from the phase difference calculating circuit 12
can just take values within the range OsG~s2rr. Therefore,
when the phase difference G~ reaches 2rr with the increase
in the angular carrier frequency w, the phase difference
G~ returns to zero and then increases again along line L2.
The phase difference G~ varies periodically thereafter
along lines L3, L4 and so on. It would therefore be
recognized that when the outputted phase difference G~
equals n, for example, it is not possible to determine
-83-
ca2o o ~43z
whether the actual angular carrier frequency is w1, w2,
w3, w4 or else. One approach to eliminate this ambiguity
is to reduce the value of z so that zero resetting of the
phase difference ~~ could be avoided as shown by line Ln.
This approach will make it possible to determine a unique
angular carrier frequency w5 corresponding to each
individual value of the phase difference ~~. However, as
will be discussed later, a smaller value of z would act to
increase errors contained in the obtained angular carrier
frequency cu5, making accurate measurement results
='a~aable.
This invention employs the foiiowing method to solve the
above problem.
A plurality of angular carrier frequencies wx resulting
from the zero resetting of the phase difference 4~ when
there is a time difference of -c1 between angular positions
of the two ultrasonic receiving beams are given by the
following equation:
wx = 4~1/tl ~ n(aril)............................ (39)
where arcl = 2n/zl.
Substituting ~~1 = ~~10 + 4~1 (where ~~10 and 4~1 are a
true value and an error of ~~1, respectively),
wx = 0~10/Z + p~l/z1 t n(cucl) ................... (40)
Here, it is assumed that four angular carrier
frequencies w1, w2, w3 and w4 have been found within the
system frequency bandwidth as illustrated in Figure 31.
The individual angular carrier frequencies wx are shown
-84-
ca 2 > > 7432
with certain widths in Figure 31. This is because they
contain certain errors expressed by the second term
(4~1/tl) of the right side of equation (40).
Angular carrier frequency w5 which would be obtained
when the time difference between the two ultrasonic
receiving beams is set to an appropriate value i2 (<zl) to
avoid zero reset points is given by the following
equation:
w5 = 4~2/z2..................................... (41)
Substituting A~2 = A~20 + p~2 (where A~20 and A~2 are a
true value and an error of A~, respectively),
ca,~5 = f.~y;20/t + nW2/z2 ........................... 42
( I
In this case, a unique value of the angular carrier
frequency w5 can be determined within the system frequency
bandwidth as illustrated in Figure 32. The angular
carrier frequency w5 thus obtained also contains an error
expressed by the second term of the right side of equation
(42). This error (~~2/z2) is larger than the
aforementioned error (A~1/il) since the value z2 is smaller
than the value i1. Thus, although a unique value of the
angular carrier frequency w5 can be determined using a
smaller time difference z2, an exact value is not
obtainable yet.
However, it would be recognized from a comparison
between Figures 31 and 32 that among the four angular
carrier frequencies w1, w2, w3 and w4, the true value is
w3 as it alone is contained in the span of the angular
-85-
~A 211 X432
carrier frequency w5. Specifically, the angular carrier
frequency w3 can be determined to be true by passing each
combination of the angular carrier frequencies of Figures
31 and 32 through an AND gate.
To obtain two different time differences z1 and z2 (<zl)
with the two rotating ultrasonic receiving beams P and Q,
a time difference resulting from the angular deviation A
between the two beams should be z2 and a time difference
resulting from the remaining angle (2rr - 0) should be z1,
as shown in Figure 33. Alternatively, the longer time
difference z1 should be made equal to Tfs or Tfs + i2,
w:~ere Tfs is the period ~ rotation of the individual
beams.
Figure 34 shows a circuit example which can realize the
above arrangement. Although the circuit example of Figure
34 is typically applicable to a matched filter type
carrier frequency measuring circuit shown in Figure 4 or
7, it is also applicable to other types of carrier
frequency measuring circuits. In Figure 34, there are
additionally provided a phase difference calculating
circuit 12' and a delay circuit 10 for introducing a time
delay of i1 or Tfs before the phase difference calculating
circuit 12'. Furthermore, there is provided a select
switch 300 for selecting inputs to the phase difference
calculating circuit 12' depending on whether the delay
time of the delay circuit 10' is set to z1 or Tfs. As
already described, a unique, but not so accurate, angular
-86-
CA2117432
carrier frequency w' is obtained within the system
frequency bandwidth from phase difference 0~ outputted
from the phase difference calculating circuit 12 of which
inputs involve a smaller time difference z2. On the other
hand, a plurality of angular carrier frequencies tux are
obtained from phase difference A~' outputted from the
phase difference calculating circuit 12' of which inputs
involve a larger time difference z1 or Tfs.
A non-ambiguity frequency calculating circuit 301
calculates a unique angular carrier frequency w, or
carrier freauency f; from each comb~ation ef nh=~~
d1f-fc~c.~..25 ..~s't'i and ~1~' by ll5ing tile above-deSCTi u' a
technique. Indicated by U1 and U2 are smoothing circuits
for averaging successive phase difference values 4~ and
4~' outputted from the phase difference calculating
circuits 12 and 12', respectively. This averaging process
serves to increase the measuring accuracy.
In the above-described embodiments, carrier frequency
data is converted into a Doppler frequency shift signal by
the use of a subtracter before executing various
operations such as ship velocity compensation and variance
assessment. In a modified form of.embodiment, it is
possible to execute these operations on the carrier
frequency data without converting it into a Doppler
frequency shift signal.
Although the above-described embodiments utilize a
Doppler frequency shift signal and carrier frequency data,
-87-
~A2117432
it is obviously possible to utilize an angular Doppler
frequency shift and angular carrier frequency data
instead.
Now, operation of the velocity vector generating circuit
83 will be explained in the following.
Referring to Figure 35, there is shown a perpendicular
coordinate system x-y-z. It is assumed that there is a
target moving at a relative velocity of Vo centering close
around point P(x, y, z) which is located at a horizontal
angle a relative to the x-direction, a tilt angle (3, and a
distance r from an observati~ nn;nt t~kP= at the o_r;ain
O. Iri the following discussion, underscores are used to
denote vectors. The velocity Vo has a direction defined by
a horizontal angle Ao from the x-axis and a tilt angle Bo.
Individual coordinates of the point P(x, y, z) and
velocity Vo(XO, Yo, Zo) can be expressed as follows using
their polar coordinates (r, a, (3) and (Vo, Ao, Bo):
x = r~cos(3 cosa
y = rcos[3 sing
z = rsin(3 ......................... (43)
XO = Vo~cosBo cosAo
Yo = Vo~cosBO sinAo
Zo = Vo~sinBO ......................... (44)
It is assumed that an ultrasonic pulse is emitted from
the observation point O, a return echo from the target at
point P is picked up by a directional receiving beam
aligned in the direction of line OP, and the distance r
-88-
CA2117432
and Doppler frequency shift are calculated. Velocity
v(OP, Vo) obtained from the Doppler frequency shift is a
projection of the velocity Vo upon the line OP. Thus,
v(OP, vo) = vo~(OP/r) _ (xxo + yYO + zzo)/r....... (45)
where underscores are used to denote vectors and OP/r is a
unit vector.
Substituting equations (43) and (44) into equation (45),
v(OP, Vo) = Vo(cosBocosAOCOS(3cosa +
cosBO sinAO cos(3 sina + sinBO sin(3 ) . . . . ( 46 )
Since v is a function of the directional components a, ~3
of the receiv,'_ag beam and the rel at-ve vA1 ors tv Ve =-~
directional components Ao, Bo of the target, equation (46)
is rewritten as follows:
v(a, ~3, Vo, Ao, Bo) = Vo(cosBOCOSAocos(3cosa +
cosBOSinAOCOS(3 sina + sinBosin~) .... (47)
In equation (57), beam direction parameters a, (3 are
known quantities while target velocity parameters Vo, Ao,
Bo are unknowns.
Should there exist targets distributed in other than the
direction of line OP, moving at the same velocity Vo, their
velocities v could be derived in a similar manner from
echo data picked up by a plurality of receiving beams
directed in other than the direction of line OP. Then, a
set of equations (47) having different values of
parameters (V0, a and (3) would be produced. Values of Vo,
Ao and Bo will be obtained by solving this set of
equations. This is the basic principle implemented in a
-89
CA2117432
water current measuring apparatus operating with three or
four beams. Adapting this principle, the invention
employs the following technique: A number of velocities v
(a, (3, Vo, Ao, Bo) are obtained for different values of a
and (3. Regarding these velocities v as data derived from
model equation (47), an estimation of model parameters is
made using the least squares method to determine target
velocities Vo, or VO, Ao and Bo.
Referring now to Figure 36, it is assumed that velocity
information v and echo intensity information a on targets
throughout a fall circle ar~»n~ ~h~ obse=va~?~n point O
have been obtained in 2rr/N steps of horizontal angle, 2n/M
steps of tilt angle, and Dr steps of radial range. The
velocity data and echo intensity data are expressed as
v(i, j, k) and am(i, j, k), respectively, where i, j and k
designate polar coordinates a = (2rr/N)i, (3 = (2rr/M)j and
k = 4rk of each individual data point, respectively.
Provided that observation is possible all around the
observation point O, i, j and k are integers within the
following ranges:
i = 0 to (N - 1)
j = -M/4 to M/4
k = 1, 2, 3, ...
Here, the probability that any targets having the same
velocity will be found at a data point (i, j, k) is
denoted by the expression w(i, j, k). A method of
detern~ining the probability w will be described later.
-90-
CA2117432
If targets located in an area containing small cubic
segments shown in Figure 36 (i = i1 to i2, j = j1 to j2,
k = k1 to k2) are supposed to have the same velocity, w(i,
j, k) = 1 within that area while w(i, j, k) = 0 outside
the area. To fit measurement data v(i, j, k) to model
equation (47), a and (3 of equation (47) are transformed
into discrete values in steps of 2n/N and 2rrlM,
respectively. Thus,
y(i, j) = Vo(cosBO-cosAo-cos(2n/N)i~cos(2rr/M)j +
cosBO-cosAo-sin(2rr/N)i-cos(2rr/M)j +
sinBO-sin( 2rr/M) j )
= a-cos(ir~/iv')i-ccs(2ri/M)j + b-sin(2rr/N)i-
cos(2rr/M)j + c~sin(2rr/M)j.............. (48)
where a = VocosBo-cosAo, b = VocosBO-sinAO, c = VosinBO .. (49)
y(i, j) thus obtained is used as a fitting model.
Here, the difference between measurement data and the
fitting model is defined as follows:
Q ~, ,~,r ~, (v(l~ 7. k) - Y(l~ 7))z-w(1. 7. k) ~. (50)
k i j
Solving simultaneous equations
aQ/aa = 0, dQ/ab = 0, aQldc = 0.................. (51)
estimates a', b' and c' of a, b and c that minimize the
value of Q are obtained. with the substitution of these
estimates into equation (49), estimates Vo', Ao' and Bo' of
the supposedly same velocity will be obtained.
To determine the previously mentioned probability w,
there are available various procedures, of which one
-91-
CA2117432
example is described in the following.
(1) In the case of a sonar, for instance, an area (il-
i2, jl-j2, kl-k2) is roughly specified by manual operation
referring to a picture showing echo intensity information.
Probability w(i, j, k) = 1 is assigned to such data points
that produce echo intensities am(i, j, k) exceeding a
given threshold level within the specified area while
probability w(i, j, k) = 0 is assigned to all other data
points. This method is suited to such cases where the
moving velocity of a fish school or large-sized fish is to
be detPrTnined.
(2) it is assi.,~med that w(i, j, k) = am(i, j, k) within
the above-mentioned area and w(i, j, k) = 0 outside the
area.
(3) The whole measurement area is predivided into
several subareas and probabilities w(i, j, k) are assigned
to individual subareas in accordance with the method of
(1) or (2) above.
(4) If it is desired to determine the current (or flow
velocity of sea water) within a specified area, a
threshold is used in an opposite manner. That is,
probability 1 is assigned to data points producing echo
intensities below a certain level within the specified
area while probability 0 is assigned to all other data
points within the area as well as to the outside of that
area.
If it is possible to consider that target velocity Vo has
-92-
CA2117432
no vertical component (that is, there is no vertical
movement) as in the case of water currents or fish
schools, the foregoing discussion can be simplified in the
following manner.
Substituting Bo = 0, equations (47) to (51) are rewritten
as follows:
v(a, (3, Vo, Ao) = Vo(cosAO cos(3 cosa +
sinAO cos(3 sina) . . . . . . . . . . . . . . . . ( 52 )
y(i, j) = a~cos(2rr/N)i~cos(2rr/M)j + b~sin(2rr/
N)i~cos(2n/M)J) ....................... (53)
a = Vo~cosAo, b = Vo~sinAO........................ (541
(v(1' j' k) - Y(1' j))''w(i' J' k) ~~ (55)
k i j
aQ/aa = o, aQ/ab = o ............................ (5s)
Now, it is possible to derive target velocity parameters
(Vo' and Ao' in this case) from estimates a' and b'.
If the receiving beam tilt angle (3 is fixed ((3o),
equations (52) to (56) become
v(a, (30, Vo, Ao) = Vocos(3o(cosAO cosa +
sinAosina) ................... (57)
y(i) = a~cos(2n/N)i + b~sin(2rr/N)i ............... (58)
a = Vocos(3cosAO, b = Vo~cos(3sinAo................. (59)
Q ~ ~ (v(i, k) - y(i))2'w(i, k).............. (60)
k i
aQ/aa = o, aQ/ab = o ............................ (s1)
Then, target velocity parameters Vo' and Ao' can be derived
from estimates a', b' and X30.
If it is desired to reduce computational complexity,
-93
CA2117432
velocity v(i, j, k) may be averaged in the k-direction
with weight w(i, j, k); then, the velocity would be
expressed as va(i, j). If the tilt angle is fixed to (30,
velocity va(i, k) may be averaged with weight w(i, k);
then, the velocity would be given by va(i). With the
substitution of these simplified expressions of target
velocity, equations (55) and (60) become as follows,
respectively,-
Q ~ ~ (va(i, J) - Y(1. J))z'wa(l. 7)......... (62)
_ i j
Q = ~ (va(i) - y(i))2'wa(i) .................... (63)
where wa(i, j) and wa(i) are probabilities averaged in the
k-direction, or they may take the value 1 or 0 depending
on whether the sum of w(i, j, k) as added in the k-
direction is larger than a given threshold.
Examples of velocity vector presentations obtained by
the above-described procedure will be described in the
following.
Figure 37 is a three-dimensional presentation of target
velocities obtained with varying tilt angles (3. Figure 38
is a two-dimensional presentation of horizontal target
velocity components taken from just a single layer (of a
given depth) of Figure 37. Although a vector diagram
similar to Figure 38 would be obtained when the tilt angle
(3 is fixed, water depth will increase as the radius of
picture coverage around own ship (denoted by a small
triangle 4) becomes larger in this case (refer to Figure
-94
CA2117432
19).
Figure 39 is a diagram showing a velocity vector
represented by an arrow Y1 as obtained by averaging
velocities measured within a target T4 which is contained
in an area (designated Zl) specified via the designating
unit 84 referring to the picture presented on the display
unit 86. In Figure 39, there is shown a water current
velocity vector Y2 for an area Z2 enclosed by concentric
circles.
Advantages of the velocity vector presentatio=~ of the
present invention ~ as ~bows. ch~"~a +here ~v~=- =
fis'.~.~, school directly below the bottom of own ship, its
echo will act as unwanted noise in a conventional water
current measuring apparatus. According to the invention,
amplitude information is used to discriminate between
reflections from the surrounding water mass and fish
school so that it would be possible to present water
current velocity data unaffected by fish echoes.
Furthermore, it would be possible to measure water current
velocities in a surface layer by setting a small
transducer tilt angle.
EFFECTS OF THE INVENTION
As described above, this invention makes it possible to
quickly measure carrier frequencies of ultrasonic echoes
arriving from a wide searching area and provide target
velocity information in relation to own ship through an
-95
CA21~7~32
analysis of the measured carrier frequencies. To add, a
color presentation of the target velocity information
provides a solution to such problems of conventional
signal level pictures as the loss of relative signal level
information due to saturation phenomenon, masking of weak
echoes by strong echoes and inability to distinguish
between signals having the same level.
In one aspect of the invention, information on
variations in individual target velocities is provided in
addition to the target velocity picture. This information
1s lmOOrt3Rtf01 reCO_n~tl0n Of f;ch c,r_hpplc a,=.1
determination of fis:. species and lengths.
In another aspect of the invention, target echo
information can be compensated with own ship's over-the-
ground or through-the-water velocity so that it becomes
possible to obtain information on over-the-ground and
through-the-water target velocities, enabling more
positive recognition of fish schools.
In still another aspect of the invention, data sampling
intervals can be shortened by choosing a sector scanning
pattern instead of full-circle scanning of an ultrasonic
receiving beam so that targets can be detected at a higher
resolution.
In a further aspect of the invention, two different
phase differences are derived from the angular deviation
between two ultrasonic receiving beams and the carrier
frequency is calculated from the two phase differences so
-96-
CA2117~32
that the carrier frequency can be determined with a high
accuracy.
In a still further aspect of the invention, either two-
or three-dimensional distribution of velocity distribution
can be determined from velocity vectors individually
calculated for arbitrarily selected fractional areas so
that it is possible to know true movements of a fish
school. Also, as a fish school in a slant direction of
own ship can be detected, it is possible to know its
velocity even when the ship is not located J;;~t above the
fish school.
-96/1-