Note: Descriptions are shown in the official language in which they were submitted.
z1~~1~~
- 1 -
A HIGH PRECISION RF VECTOR ANALYSIS SYSTEM BASED ON
SYNCHRONOUS SAMPLING
BACKGROUND OF INVENTION
Field of the Invention
The invention relates to a system for
accurately measuring the amplitude and relative phase
of RF signals. More specifically, the invention
relates to such a system which is based on synchronous
sampling.
A) Operation of a conventional vector analyzer
Basically, a vector analyzer is a system
which is used to measure the complex amplitude (i.e.
the amplitude and relative phase) of one or more
signals in the frequency domain. It is the basis for
instruments such as vector network analyzers, vector
voltmeters and modulation analyzers. Conventionally,
a vector analyzer uses a heterodyne technique, R.A.
Witte and J.W. Daniels, "An advanced 5 Hz to 200 MHz
network analyzer", Hewlett Packard Journal, pp. 4-16,
Nov. 1984: the signals to be processed, whose
frequency fIN may be any value inside the working
range of the instrument, are first converted to a
fixed intermediate frequency fIF by mixers. The
mixers are non-linear devices with two input ports
(IN, LO) and one output port (IF) configured in such
a
way as to produce an output signal at the frequency f
IF through the relation
- 1 -
fIF-~(fIN-mfLO) (1)
where fL0 is the frequency of the signal applied at
the LO port. m is an integer equal to 1 for
fundamental mixing and greater than 1 for "harmonic
mixing". Using a bandpass filter at the IF port, the
analyzer can be tuned to a frequency fIN by applying
the appropriate LO frequency such that eq. (1) is
satisfied.
The system is arranged to be linear with
respect to the input IN, so that the amplitude and
relative phase of the input signals are preserved by
this mixing process. The resulting IF signals are
filtered, amplified and generally frequency converted
again, and finally go to a synchronous detector for
quadrature and phase demodulation. Sweeping, i.e.
tuning the analyzer at a frequency which changes over
time, is accomplished by sweeping fL0 in such a way
that fIF is constant.
Some of the most important specifications
for today's vector analyzers are its drift (or
stability) and dynamic linearity. Other parameters
which affect the accuracy of the instrument such as
load match errors and frequency response errors are
effectively cancelled out by normalization,
calibration and vector correction techniques
implemented in software. In practice the linearity is
- 2 -
21~~ x.'74
- 3 -
limited by the IF chain and the synchronous detector,
and is generally about 0.02dB for available commercial
instruments. In the case of drift, it is mostly due
to the variation in the transfer function of the mixer
with temperature and aging, and typical values are
0.01 to 0.05 dB.
Our analyzer uses synchronous sampling
rather than harmonic mixing to make the frequency
conversion to a fixed IF frequency. Using this
technique, we show that it is possible to improve the
dynamic linearity and stability, at the expense of
other factors which are not critical for many
applications, such as measurement speed and spurious
signal rejection.
B) Sampling techniques
Sampling systems were introduced for the
observation of high speed repetitive signals, N.S.
Nahman, "The Measurement of Baseband Pulse Rise Times
of Less than 10-9 Second" Proceedings of the IEEE,
Vol. 55, No. 6, June 1967, pp. 855-864. In these
systems, a sampling gate, usually made of high speed
Schottky diodes, is used to take a quasi-instantaneous
snapshot of the input voltage at the time it receives
a "sampling strobe". By taking a series of such
samples over time it is possible to reconstruct the
input waveform, provided it is repetitive and some
known time relationship exists between the sampling
- 3 -
214 ~ ~.'~
- 4 -
strobe and the signal. The main interest of these
techniques is that only the sampling gate determines
the equivalent bandwidth of the system. The rest of
the circuitry only has to process low frequency
signals, contrary to a real time instrument. Some
sampling systems now have over 30 GHz equivalent time
bandwidth and around 1 psec time resolution.
Depending on the specific time relationship
required by the instrument between the signal to
acquire and the sampling strobe, we distinguish
between three types of sampling techniques:
- Sequential sampling: the signal to be
measured goes to a trigger unit in addition
to
being applied to the sampling gate. When
the
system is ready to take a sample, it will
wait
until a trigger event occurs. The sampling
strobe will be sent a given delay later by
the
sampling system; in order to get the
complete
waveform the delay is increased slightly for
each sample. This technique is often used
f or
TDR (Time Domain Reflectometry) systems.
- 4 -
- 5 -
- - Random sampling: the sampling strobe is
issued at a constant rate fS independent of
the signal characteristics. When a trigger
event occurs the time between it and the
next
sampling strobe is measured accurately and
this value is used to compute the time index
for preceding and succeeding samples. When
a
sufficiently high number of trigger events
have occurred the time indexes will be
nearly
evenly distributed over the complete range
from 0 to 1/fS, in which case the waveform
can
be displayed with sufficient resolution.
Many
modern digital oscilloscopes use random
sampling to achieve a "repetitive bandwidth"
greater than their real time sampling rate.
- Synchronous sampling: is defined as a
technique wherein the sampling strobe is
applied at a constant fS and the input
signal
has a repetition frequency fIN which possess
a
known mathematical relationship with fS. It
- 5 -
- 6 -
is not necessary to be concerned about
triggering, as a known synchronism exists
between each sampling strobe and the input
signal. Although not explicitly mentioned,
it is used in special applications such as
those found in N.D. Faulkner and E.V.
Mestre,
"Subharmonic sampling for the measurement of
short-term stability of microwave
oscillators", IEEE Trans. Instr. Meas., Vol.
IM-32, pp. 208-213, March 1983 and P.A.
Weisskopf, "Subharmonic sampling of
microwave
signal processing requirements", Microwave
Journal, pp. 239-247, May 1992.
Synchronous sampling has many resemblances
to harmonic mixing: even the circuits of a harmonic
mixer and a sampling gate may share some common
points. The differences that exist are: 1) the
excitation of a sampling gate is generally at a much
lower frequency than that of a harmonic mixer (fS<fLO~
and, more important 2) the output signal of a harmonic
mixer is a continuous time signal whereas the output
of a sampling gate is a sequence of samples.
Although B. Gestblom, "The sampling
oscilloscope in dielectric frequency domain
spectroscopy", J. Phvs. E: Sci. Instrum., Col. 15, pp.
- 6 -
2~.t~ ~~'~~
_7_
- 87-90, 1982 and R.H. Cole, "Bridge sampling methods
for admittance measurements from 500 KHz to 5 GHz",
IEEE Trans. Instr. Meas., Vol IM-32, pp. 42-47, March
1983, have discussed the use of sequential sampling
oscilloscopes for complex amplitude measurement in the
frequency domain for simple systems, the present
invention provides much more functionality in terms of
automation, accuracy and effectiveness.
SUMMARY OF INVENTION
In the present invention, the signals to be
measured, whose frequencies are fIN, are brought to
sampling gates which receive a sampling command at a
frequency fS. This sampling frequency fS is generated
by a sampling strobe synthesizer (SSS) using frequency
synthesis techniques applied to a master reference
clock. The same reference frequency will be used by
the external signal source which provides an
excitation to the measured system. This is to ensure
that the input signals to be measured have a frequency
fIN which is linked to fS by an exact relationship as
is required for synchronous sampling, as discussed
above.
The main object of the invention is to
create an RF vector analyzer of high stability and
linearity, to be used as the basis for a high
precision wide band network analyzer or other kind of
RF electrical parameter measurement.
_ 7 _
214~~~~
_$_
Another object of the invention is the
creation of an RF vector analyzer which requires a
minimum of critical RF components to define its
performance.
Another object of the invention is the
creation of an RF vector analyzer which minimally
loads the signals to measure so that buffers, which
inevitably introduce drift and non-linearities, are
not needed for measurements in a high impedance
environment.
Another object of the invention is the
creation of an RF vector analyzer which can be tuned
at harmonics or sub-harmonics of the main frequency of
the input signals, so that complete characterization
of non-linear devices such as large signal amplifiers
can be made.
The operating principles put in use in our
invention are particularly effective for instruments
whose frequency range is situated between 100 KHz and
10 GHz or more. Aspects of the present invention are
set out in Applicant's article entitled "A High-
precision RF Vector Analyser Based on Synchronous
Sampling", IEEE Transactions on Instrumentation and
Measurement, Vo. 43, No. 2, April 1994.
In accordance with a particular embodiment
of the invention there is provided an RF/microwave
amplitude and phase measurement system comprising:
_ g _
~i~fil~~
- 9 -
a sampling system comprising a plurality of
sampling gates, each sampling gate having an input
terminal, an output terminal and a control terminal;
a sampling strobe synthesizer having an
output terminal connected to the control terminals of
said sampling gates;
a discrete time signal processor (DTSP)
having a plurality of input terminals, respective ones
of the output terminals of said sampling gates being
connected to respective ones of the input terminals of
said DTSP, said DTSP also including a like plurality
of channels, each channel being associated with a
respective input terminal of said DTSP, and a
plurality of output terminals;
a reference clock;
wherein:
signals to be measured are connected to a
respective one of said input terminals of said
sampling gates;
the sampling gates and the sampling strobe
synthesizer being used in a synchronous sampling mode
for frequency conversion and domain conversion;
the outputs of the sampling system comprise
sequences of samples or discrete time signals where
each sample represents the value of the input voltage
at the sampling instant, the discrete time signal
having a number of samples per cycle T (i.e. a period)
_ g _
21~6~.~~
- 10 -
equal to a fraction of the fractional part of the
input frequency divided by the sampling frequency, the
function giving the following equation:
1
= fra fIN for all fra fIN <_0 . 5 ; otherwise
T _ _
fs fs
T 1 fr'a f IN
fs
where T is equal to the period of the discrete time
signals;
fIN is equal to the frequency of the input
signals;
fg is equal to the sampling frequency;
the "frac" operator means the fractional
part of its argument;
the sampling frequency being obtained by
frequency synthesis techniques applied by the sampling
strobe synthesizer to the output of the reference
ClOCk;
the outputs of the DTSP comprising, for each
channel, the real and imaginary part of the signal
input on that channel.
- 10 -
- 11 -
BRIEF DESCRIPTION OF DRAWINGS
The invention will be better understood by
an examination of the following description, together
with the accompanying drawings, in which:
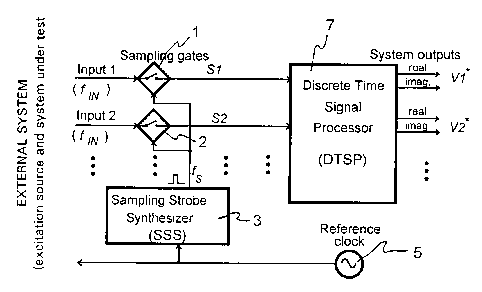
FIGURE 1 is a block diagram of a vector
analyzer which uses synchronous sampling for frequency
conversion and domain (continuous time to discrete
time) conversion.
FIGURE 2 is a block diagram of a vector
analyzer similar to that of Figure 1 but where
feedback is used to the sampling gates.
FIGURE 3 is a flowgraph showing the signal
processing done by the discrete time signal processor.
FIGURE 4 is a block diagram showing our
implementation of the discrete time signal processor.
FIGURE 5 is the complete block diagram of
the preferred embodiment of the invention.
- 11 -
- 12 -
FIGURE 6 is the circuit diagram of the
sampling section showing the sampling gate and
associated circuitry.
FIGURE 7 is the block diaaram of the
preferred embodiment for the sampling strobe
synthesizer.
FIGURE 8 shows one embodiment of an output
synthesizer for providing an excitation signal to the
system under test and specially adapted to work with
the preferred embodiment of the invention.
FIGURE 9 is a timing diagram useful in
understanding the operation of the circuit illustrated
in Figure 6.
- 12 -
2~~~1'l~
- 13 -
DESCRIPTION OF PREFERRED EMBODIMENTS
Referring to Figure 1, it can be seen that
input signals 1, 2,... are applied to sampling gates
l, 2,.... The opening and closing of the gates are
controlled at a sampling frequency fS, and the
sampling frequency fS is generated by a sampling
strobe synthesizer (SSS) 3 using frequency synthesis
techniques on the output of master reference clock 5.
The outputs of the SSS are applied to the control
terminals of the sampling gates 1, 2,...
The outputs S1, 52,... of the sampling gates
are applied to inputs of discrete time signal
processor (DTSP) 7.
The output signals of the sampling gates,
consisting of sequences of samples, are considered as
discrete time signals and it can be shown that these
sequences are periodical with a period (i.e. a
unitless period being the number of samples per cycle)
T given by the following equation:
1
T-~a fIN (2)
fs
where the "frac" operator stands for the fractional
part of its argument. Discrete time filtering and
phase sensitive detection can then be done by a
- 13 -
~1~~~.'~~:
- 14 -
discrete time signal processor (DTSP) 7 which will
deliver two outputs per channel representing the
complex amplitude of the input RF voltages V*, for
example the real part and imaginary part as shown in
Figure 1. Thus the synchronous sampling process can
be viewed as a frequency conversion (fIN to 1/T) and
domain conversion process (continuous time to discrete
time). In our system it plays a role similar to that
of the harmonic mixing process of the conventional
analyzer. Also, the DTSP processor plays the role of
the IF chain and phase sensitive detector, while the
sampling strobe synthesizer is equivalent to the local
oscillator.
As was the case with the heterodyne
analyzer, it is better from a practical point of view
if the signal processor operates on fixed frequency
signals. Furthermore, it is desirable that the period
T of the series is an integer, as it does simplify
considerably the design of the DTSP. As a result,
tuning of the analyzer is preferably done by adjusting
fS in such a way that eq. (2) is satisfied. For this
purpose, the SSS is controlled by a digital control
unit 19 as shown in Figure 5. It can be shown that
the required value for fS given the desired period T
is
- 14 -
~~~61'~~.
- 15 -
fs = F~' (3)
X ~ /T
where X is a positive integer whose value is chosen
according to the following equation:
fs max/
_ /T
X=int f"" +1
fs max
The "int" operator means truncation of its
argument to an integer, and fsmax is the maximum
sampling frequency permitted by the DTSP. As a
typical example, with fSmax=50 KHz and T=256, for an
input frequency of 100 MHz an adequate value of X is
2000 and the required sampling frequency fS is 50 KHz
minus 0.097656 Hz. To cover an input frequency range
of 100 KHz to 2 GHz, X will take the values ranging
from 2 to 4000 and fS will span from 33.355 to 50 KHz.
It is noted that the output signal of the
sampling gates has a real time frequency of fS/T which
changes for different input frequencies; only the
frequency of the discrete time signal is constant for
different input frequencies. The choice of an
- 15 -
z~~s~~~
- 16 -
appropriate period T for the discrete time signal is a
compromise between the performance in regard to
harmonic rejection, the measurement speed and the
complexity of the DTSP. Powers of two between 16 and
4096 are probably the most useful values in every
situation.
It is also contemplated, in accordance with
the invention, to use feedback at the sampling gates
in such a way that the output signals are the result
of the comparison between the feedback voltage F1,
F2,... and the instantaneous RF voltage S1, 52,..., as
shown in Figure 2. Most sampling gate topologies have
a polarization or feedback input and the circuitry
associated with the sampling gate actually delivers a
signal which is proportional to the difference between
the sampled RF voltage and the voltage applied at the
feedback input. Since in the present case is known to
produce periodic series, it is possible to predict
sample values for the next period of the discrete time
signal and to apply corresponding voltages at the
feedback inputs. The objective is to reach a steady
state after the first few cycles of the process so
that the output signals of the sampling section are
zero, except for some possible noise. After a few
cycles the feedback signals F1, F2,... will converge
to an exact representation of the input waveforms.
The output signals Sl, 52,... from the sampling gates
- 16 -
- 17 -
are now considered to be error signals. Figure 3
represents a simple flowgraph to be implemented by the
DTSP to generate the required F1, F2,... signals and
to measure the complex amplitudes. If no feedback is
used, then the delay element 8 may be removed.
The benefit of this technique is that the
variation in the transfer function of every component
in the chain from the RF inputs to the feedback
signals F1, F2,... will not affect the results, in the
same way that a properly designed feedback control
system will be insensitive to perturbations and
variations in the direct chain. Particularly
important, the gain of the sampling gate is one
parameter whose variations will not affect the system.
This implies higher compression levels or greater
dynamic range, and better drift characteristics.
Another way to look at this technique is to consider
that for each sample, the system compares the value of
the estimation and the actual sample value. On
subsequent cycles it will adjust this estimation so as
to minimize the error signal.
Another benefit of synchronous sampling with
feedback is that when a steady state is reached, no
energy is needed from the measured signal. This
translates to a higher effective input impedance for
the analyzer which can be put to good use for special
applications.
- 17 -
' - 18 -
As shown in Figure 4, one implementation of
the DTSP 7 consists of using analog to digital
converters (A/D) 101, 103, digital to analog
converters 105, 107 (D/A), and a digital signal
processor (DSP) 109. Each sample of the signals S1,
S2,... is digitized and the resulting sequences of
numbers represent the digital signals Sdl, Sd2,...
These digital signals have the same properties as the
discrete time signals S1, 52,... except for the
presence of quantization noise which can be made
negligibly small if enough bits are used to represent
them. They are processed by the DSP according to the
same flowgraph of Figure 3, in digital form. The DSP
generates the digital signals Fdl, Fd2,... which are
converted to discrete time signals F1, F2,... by D/A
converters for feedback purposes. The measurement
results V1*, V2*,... are in digital form. The main
advantages of working with digital signals is
elimination of drift, added flexibility, and, when
properly implemented, negligible systematic errors.
In particular detector circularity errors, which are
phase dependent amplitude errors, can be made
insignificant.
A complete block diagram of the system based
on the principles described above is shown in Figure
5. It includes: a two channel sampling system 15
having a 3 dB bandwidth of 2 GHz; a converter section
- 18 -
2i4~i'~~
- 19 -
17 comprising one 12 bits D/A converter with a full
scale range of ~512 mV and one 9 bits A/D converter
for each channel; a digital unit 19 which fulfills the
role of main controller, digital signal processor and
IEEE488 bus interface; a sampling strobe synthesizer
21 which can tune the system at every frequency
produced by the accompanying output synthesizer; and
an output synthesized signal source 23 covering the
frequency range from 10 KHz to 500 MHz with four
digits of resolution at any frequency and with
programmable output power from -20 to +10 dBm.
Sweeping is done by sequentially stepping through a
user selected number of output frequencies.
The digital unit is based on a MC68000
microprocessor operating at 8 MHz, along with 16 KB of
EPROM and 512KB of RAM. It handles all the chores of
system control, DSP algorithms and IEEE488
communications. Every subsystem is linked to the
digital unit through an internal bus comprising 16
data lines, 14 control lines and 5 power lines. DSP
algorithms are implemented by highly optimized
routines with a loop time of 40 ,sec, resulting in a
maximum permitted sampling rate fSmax equal to 25 KHz.
Actually, the algorithms are somewhat more elaborate
than what is shown in Figure 3, as it includes non-
linear adaptive filtering to speed up the convergence
process and sophisticated initialization procedures
- 19 -
znsl7~
' - 20 -
that help reduce the sweep time for successive sweeps.
Higher values of fSmax are desirable to get shorter
measurement time for a given signal to noise ratio.
Several possibilities exist to attain that objective;
the most simple one would be to upgrade the design of
the digital unit to work at a higher clock speed, such
as 16 MHz, in which case fSmax becomes equal to 50
KHz. A more aggressive way would be to use a
dedicated DSP chip such as a member of the Motorola
DSP56000 family, in which case fSmax could be well
over 200 KHz.
No user interface has been provided; our
analyzer is intended to be part of a larger system
comprising a computer which implements the required
functionality of a measurement system with its user
interface. This computer interacts with the analyzer
through the IEEE488 bus by using a communication
protocol consisting of a command set and defined
output formats. The only direct control the user has
on the analyzer is setting the IEEE488 bus address
through DIP switches and a reset button.
At the heart of the analyzer is the sampling
system 15 as it contains the sampling gates which
defines the most important performance parameters of
the analyzer. Figure 6 shows the schematic diagram
for one channel.
- 20 -
' - 21 -
The sampling gate is made of Schottky diodes
D1, D2, D3 and D4 in surface mount packages. A four
diodes bridge topology is used because of its better
isolation compared to a two diodes gate. The bridge
is normally reverse biased at approximately 2.2 V by
the action of current sources I1, I2, and a string of
four Schottky diodes D5, D6, D7 and D8. The
polarization voltage Vp is applied at the mid point of
the diode string and the effect of operational
amplifier A1 is to keep the output side of the bridge
at that same potential. At the sampling instant the
bridge is briefly turned on by the current injected at
nodes B+ and B- from the differential pair of
transistors Q1 and Q2. If there is a voltage
difference between the input and output of the bridge,
a current will flow in the holding capacitor C1. The
total charge gained or lost in C1 after completion of
sampling is approximately 0.02 pC per mV of voltage
difference. This charge is converted to a voltage by
A1 and then amplified.
Sampling occurs when the sampling system
receives a sampling command. The sampling command is
applied to a circuit identified as "Pulse Shaper" in
Figure 6. Every signal involved in the pulse shaper
are digital ECL level signals, so a logical 0 is
represented by a voltage of approximately -1.7 V and a
logical 1 by -0.8 V. The pulse shaper comprises a
- 21 -
- - 22 -
buffer 111 having complimentary outputs. One output
of the buffer 111 is applied directly to one input of
an OR gate 113 with complementary output, and the
other output goes to an RC 115 network and then to a
second input of the same OR gate 113. The function of
the RC network is to introduce a small delay (about
1.5 nsec) from the negative output of the buffer to
the second input of the OR gate. When the signal fg
(sampling command) is low or high, the output of the
OR gate is high because at least one of its input is
high (logical 1). But when fg switches from high to
low, both inputs of the OR will be low for a brief
moment because of the delay introduced by the RC
network, at which time the output of the OR gate will
be low before returning high when this delay is
elapsed. The operation may be best understood with
the help of the timing diagram given in Figure 9.
Thus the output of the OR gate is a pulse
approximately 1.5 nsec wide. This pulse drives the
microwave transistor pair Q1-Q2, resulting in
temporary forward biasing of the bridge by 7.5 mA.
Through careful construction we were able to
get 2 GHz bandwidth, 2 mVrms equivalent input noise
and less than 15 mV kickout at input. These figures
do not represent state of the art; 10 GHz bandwidth
can easily be attained using hybrid technology, and
over 30 GHz with GaAs monolithic circuits. It is
- 22 -
214~~'~~
- 23 -
sufficient however to obtain interesting
characteristics for our analyzer over the 10 KHz to
500 MHz frequency range.
Not shown in Figure 6 is the fact that the
current sources can be trimmed, as is the offset
voltage of A1. They are adjusted so as to compensate
for the bridge imperfect balance, in order to minimize
charge injection at the RF input and the peak
amplitude of the coupled sampling pulse. Also,
damping resistors are included at various places in
the circuit to minimize ringing due to parasitic
impedances. The number of channels can be increased
simply by duplicating the circuits of Figure 6, except
for the pulse shaper.
An efficient way we found to obtain the
required relationship between fs and fIN (eq. (3))
consists of deriving both of them from a 200 - 500 MHz
synthesized signal that we call fR and restrict the
input frequency to values that can be expressed by
fIN fRlD (5)
where D is a positive integer. Eq. (3) then becomes
- 23 -
- 24 -
f. (6)
__ R
DX ~ D~T
When D/T is an integer, fS can be obtained
by simple digital frequency division of fR using
programmable counters. When it is not, as is most
often the case, fractional division must be done. To
do this, a M/M+1 type counter is used along with a
digitally controlled analog time interpolator. The
counter is set to count by a number M which is
M=DX+int~~~ (7)
and the digital unit maintains an accumulator A which
is incremented by the quantity (D modulo T) at every
sample. When the accumulator reaches a value greater
than T, the M+1 input of the counter is activated and
T is subtracted from the accumulator. In this way,
the total number of additional cycles of fR to produce
T samples is (D modulo T), which is exactly what is
required to satisfy eq. (6) when averaged over T
samples.
Should the sampling strobe be taken directly
from the counter, fs would have instantaneous
frequency fluctuations which would show up as sampling
- 24 -
- 25 -
Should the sampling strobe be taken directly
from the counter, fS would have instantaneous
frequency fluctuations which would show up as sampling
phase errors that are specially harmful for small
values of D. Rather, the counter drives a time
interpolator that inserts a delay ranging from 0 to 5
nsec before producing the sampling strobe. At every
sample the delay is set to a value proportional to the
value contained in accumulator A times fR by the
digital unit. This results in elimination of sampling
phase errors.
This technique of fractional frequency
division is similar to the technique of fractional-N
frequency synthesis. The difference is that we use
time interpolation rather than phase interpolation.
Figure 7 shows the block diagram of the
sampling strobe synthesizer. The signal fR is
generated by a phase locked loop (PLL) consisting of
oscillator 24, phase detector 25, loop filter 27, VCO
29 and divider 31, and spans the range 200 - 500 MHz
with a resolution of 100 KHz. This defines the
relative frequency resolution of the instrument to
nearly four digits because of eq. (5). This also
dictates a frequency settling time constant of 100 ~.
sec, since the bandwidth of a PLL cannot be more than
a few percent of the reference frequency. Higher
- 25 -
- 26 -
resolution could be attained by using a multiloop
approach or fractional-N synthesis.
The signal fR goes to the M/M+1 counter 33.
The value M can be programmed within the range 512 to
65535. This counter is designed using a combination
of ECL and HCMOS circuits. The time interpolator 35
comprises a current switch made of high speed bipolar
transistors, a timing ramp defined by a current source
and a capacitor, a comparator and a 10 bits digital to
analog converter. The delay may be programmed with a
resolution of 5 psec and is linear to better than 50
psec. The total time fitter of the system is about 30
psec rms.
Although not necessarily part of the vector
analyzer, our system includes an output synthesizer to
generate an excitation signal to the external system
under test which illustrates how to attain the
condition of eq. (5). Figure 8 shows the block
diagram of the 10 KHz to 500 MHz output synthesizer.
The total frequency range is divided into five bands;
the four highest bands are obtained through frequency
division by 1, 2, 4 or 10 of fR using prescalers 37,
39 and 41 followed by low pass filters 43, 45 and 47
to remove harmonics. The lowest band, which covers 10
KHz to 25 MHz, uses an arbitrary waveform generator
architecture where an 8 bits D/A is fed by data from a
RAM 49 containing a sine approximation. Address for
- 26 -
214 6 ~.'~ ~:
- 27 -
the RAM 49 is provided by a counter 51 clocked at f
R/10. One output cycle is composed of n points, where
n can take the values 2, 4, 10, 20 and so on. Table I
shows the characteristics for each band.
The output of RAM 49 is connected to a
terminal of multi-position switch SW1. The outputs of
filters 43, 45 and 47 are fed to different positions
of the same switch. The frequency fR is also fed to a
different position of switch SW1.
Wiper W of SW1 is then connected to one
input of modulator 53. The other input of the
modulator 53 is fed, through D/A converter 55 from the
digital control. The output of the modulator is fed
to amplifier 57 to the output of the system.
This architecture may appear complicated
compared to using a heterodyne band for the low
frequencies as do most wideband synthesizers.
Remember, however, that eq. (5) must be satisfied for
our system. Also this architecture has the advantage
of a constant relative frequency resolution over the
complete frequency range, compared to a constant
absolute resolution for a heterodyne type synthesizer.
Another advantage is that there is virtually no non-
harmonic spurious signal generation. Finally, with
present state of the art technology, arbitrary
waveform generation could be done to 500 MHz, and with
dedicated integrated circuits this would result in a
- 27 -
2145~'~~:
_ - 28 -
very small number of components. This would also make
it possible to test components with complex waveforms
so as to simulate real life operation.
The main characteristics of the outbut
synthesizer are:
- harmonics: -40 dBc up to 6 MHz, -25 dBc up
to
500 MHz;
- amplitude: -20 to +10 dBm, ~2dB accuracy;
- frequency switching speed: frequency
settles
exponentially with a 100 ,sec time constant
(determined by the reference synthesizer);
initial frequency error is at most 2.5 times
the final frequency.
- 28 -
21~fi~'~~
- 29 -
TABLE I
CHARACTERISTICS OF EACH BAND OF THE OUTPUT SYNTHESIZER
Band Output ResolutionNumber Value
number freq. (KHz) of of D
(sub band)range (MHz) data (Eq.
points (5))
1 200 - 500 100 - 1
2 100 - 250 50 - 2
3 50 - 125 25 - 4
4 20 - 50 10 - 10
5 1 10-25 5 2 20
5 2 5-12.5 2.5 4 40
5 (3? 2 - 5 1 10 100
5 4 1 - 2.5 0.5 20 200
5 5 0.5 - 1.250.25 40 400
5 6 0.2 - 0.5 0.1 100 1000
5 7 0.1 - 0.250.05 200 2000
5 8 0.05 - 0.025 400 4000
0.125
5 9 0.02 - 0.01 1000 10f00
0.05
5 10 0.01 - 0.005 2000 20000
0.025
Frequency range extension to 1 or 2 GHz could be
accomplished by using frequency doublers and
increasing the number of inputs for the multiplexer of
Figure 7.
- 29 -
- - 30 -
A summary of the main characteristics which
have been measured for the analyzer are:
Dynamic range: +/-512 mV, + 4.2 dBm into 50
ohm.
Measurement time: 20 msec per frequency to
1 min.
Noise floor: decreases as the square root
of the measurement time from 60 ~.Vrms ( -71 dBm into 50
ohm) for 20msec to 2 ~,Vrms (-101 dBm into 50 ohm) for
20 sec. measurement. Noise free dynamic range is 82
dB for 0.1 sec. measurement.
Dynamic accuracy: better than 0.01 dB for
smaller than 150 mVrms input (-3.5 dBm).
Drift: 0.0001 dB 10 KHz to 5 MHz.
0.002 dB at 100 MHz
0.004 dB at 200 MHz
0.01 dB at 500 MHz
from ambient temp. constant to +/-2C.
Although particular embodiments have been
described, this was for the purpose of illustrating,
but not limiting, the invention. Various
modifications, which will come readily to the mind of
one skilled in the art, are within the scope of the
invention as defined in the appended claims.
- 30 -