Note: Descriptions are shown in the official language in which they were submitted.
. ~.
~A21 60093
The present invention relates generaiiy to
avionics and sensors for monitoring aircraft flight
parameters. More particularly, it relates to methods
and apparatus for three-dimensional flight parameter
analysis, monitoring, acting on, and control based upon.
in-flight measuring, and comparing of air pressures
acting on various surfaces of an aircraft and
controlling the aircraft in relation to same.
CA 02160093 2006-11-06
CA?16GG93
-z-
Ataospheric pressures actir.g upon the variaus
surfaces of an aircraft ara determinative of the
performance of aircraft. Indeed, flignt itself is
predominantly a funat:ion of the interaction of the
aircraft outer surfaces with air. For example, lift is
caused by the differential between air pressure acting
on the upper and lower surfaces of the aircraft wings
in the wind stream.
For these reasons, the aircraft and airline
industries have dedicated large amounts of time and
money to develop means for monitoring flight
performance and detecting lift-robbing winq
contaminants, such as anti-icing fluids, ice, wind
shear, microbursts and other adverse air conditions.
Examples of such systems and apparatus are described in
United States Patent Nos. 3,691,356; 4,110,605;
4,490,802; 4,728,951; 4,775,118; 4,837,695; 4,843,554;
4,980,833 and 5,047,942
In spite of the importance of air pressure
acting on the surface of an aircraft, none of the
references disclose a method or apparatus to directly
measure or analyze the actual pressures acting on the
surface of an aircraft.
In addition, no system or apparatus utilizes
pressure development data in conjunction with Advanced
Flight Control Systems (A.FCS) to control the aircraft
or transmit this data to ground persannei for
evaluation of flight perfor.nance and abnormalities in
pressure development.
The present invention is provided to solve
these and other problems.
Y 1
CA2160093
According to a primary aspect of the
invention, the actual air pressure acting on the outer
surfaces of an aircraft during operation is measured.
Other aspects of the invention include, measuring and
monitoring the actual air pressure acting at the
surface of the aircraft, in substantially real-time
during the flight and using the measured air pressure
values to monitor and control flight conditions.
Still other aspects of the invention, include
measuring an actual air pressure differential acting
between the air pressure acting on two outer surfaces
of an aircraft during operation is measured. Another
aspect of the invention, measuring and monitoring the
actual air pressure differential measurements in
essentially real-time during the flight.
According to another aspect of the invention,
the measured air pressure differential values are used
to monitor and control flight conditions. For example,
according to another aspect of the invention, the
actual air pressure differential between the air
pressure acting on the upper surface of a wing portion
and the air pressure acting on the lower surface of the
wing portion. This differential pressure measurement
corresponds to the lift encountered by that wing
portion. The lift values can then be monitored and
used to control flight.
According to yet another aspect of the
invention, the actual air pressure differential is
measured between the static air pressure within an
unpressurized area of the aircraft, such as the cargo
bay of the fuselage, and the air pressure acting at or
near a stagnation point of the leading edge of any
other surface of the aircraft, such as the leading ed3e
of the winq, or the leading edge of the nose cowl, or
the leading edge of the tail fin. These differential
CA2160093
4 -
values are monitored and can be used to determine the
air speed and air direction and to control flight as
discussed in more detail below.
According to another aspect of the invention,
methods and apparatus are provided for measuring the
actual air pressures and the actual air pressure
differentials. For example, according to one aspect of
the invention, small openings or ports are provided in
the skin of the aircraft. The ports are connected by
an air pressure conduit to a means for sensing a
pressure and providing a signal related to the
pressure. The ports are permeable by air and sensitive
to the air pressure changes associated with flight at
aircraft standstill to subsonic, supersonic and
hypersonic speeds. At the same time, theses ports are
provided with means to deter access through the port of
extraneous matter such as water and its vapor,
lubrication and deicing fluids, and particulates.
Means are also provided to prevent icing of the port
and to decontaminate the port; for example, a port
heater and a sump volume is provided in a preferred
embodiment. Preferably, the ports are flush with the
outer surface of the aircraft so'as not to cause local
drag or other flow stream defects which could effect
measurements or cumulatively effect flight efficiency.
Means for assessing the signal and reporting data are
operatively connected to the pressure sensing means.
Means are provided for reaorting the data optionally to
the flight crew or to the aircraft's other flight
control and monitoring systems or both.
In another aspect of the invention a matrix
of ports and corresponding sensors are provided and the
air pressures are measured and selectively compared
with respect to each other to optionally assess two or
three dimensional components of the air pressures
acting over the aircraft at one time.
- !~
cA21 Go093
-
It is also contemplated that the conduit
leading from the ports to the air pressure sensors can
also he connected in either serial as opposed to
discrete parallel connection. For example, the serial
connection would provide an air pressure manifold with
numerous ports contributing-to a total manifold
pressure.
Methods and apparatus are also provided for
using the air pressure measurements for controlling
flight. For example, according to other aspects of the
invention, a method of using the air pressure
measurements is to measure the actual air pressure
during a first flight condition, then record or store
the measured actual air pressure data for the first
condition.. Then, measure the air pressure during a
second flight condition and compare the measurements
from the first and second flight conditions during the
second flight as the second flight measurements are
developed. Preferably, the first flight condition is
an acceptable one, such as a clean wing condition,
proper lift, no wing defects, no wind shear, etc.
According to another method of the invention,
flight control is accomplished by calculating values
from the measured air pressures or measured pressure
differentials. For example, if one can measure air
pressures in real time, one can determine many things
about the aircraft performance through comparative
mathematical analysis. If, for instance, one has the
air speed and knows the pressure reading at two
precisely selected locations on the wing and what
position the flight control surfaces are in, then
determining the correct angle of attack is a relatively
easy task. So is it easy to surmise as to the actual
margin to stall that the wing has remaining to operate
in.
CA2160093
- 6 -
other aerodynamic performance data can be
deduced from this type of accurate real-time data
acquisition and analysis. It would be possible te
establish a program sub-routine that could identify
wind shear and surmi=e its potential impact on the
aircraft's flight path. This could be accomplished
before the air crew is even aware that they have
encountered a wind shear. In such a situation, it
would be possible to integrate this aerodynamic
performance monitoring capability with the aircraft's
automated flight controls, so as to ameliorate the
effects of the shears, thereby lessening the potential
for disaster somewhat. This would be particularly true
in the presence of a side shear occurring at low
I.evels.
Further, it would be possible through
integration to determine if the correct landing and
takeoff configurations had been implemented early on.
The accident at Detroit, where the crew inadvertently
did not extend the flaps during their takeoff roll,
would be clearly and instantaneously identifiable to
such a system as the present invention.
Further, by actually measuring the impact of
side slip foices as forces rather than deviations from
a charted course shiuld significantly enhance enroute
fuel economies. The ability of certain high-
performance aircraft to operate closer to the margin
during takeoff and climb maneuvers would also
significantly impact fuel consumption figures.
Additional benefits that might be expected to
eventually be derived from the incorporation of the
invention into the flight management and control
systems are a far better judgment as to the respective
engine performance during everyday flights compared to
the normal baseline for such an engine. Should the
engine begin to falter, the technology of the present
CA2160093
7 -
invention should prove to be a valuable tool for
monitoring the fall-off in performance, so that quick
remedial actions may be taken.
It is the proven ability of the invention to
accomplish this type of data acguisition and analysis
in virtual real-time that makes it such an important
and significant addition to the world of advanced
avionics.
Certainly, the technology of the present
invention can greatly speed normal development testing
of either aircraft modifications or of new aircraft.
Further, it is possible to more precisely affix the
cause of an accident if one has better aerodynamic
performance data from which to study the accident from
the aircraft's perspective.
Apparatus according to the invention is
designed to measure in virtual real-time the
aerodynamic performance in such a manner that all of
the above, and many more things, can be done
automatically, or at least provide the flight crew with
time critical data and analysis materials, so that they
can better perform their assigned tasks.
Other advantages and aspects of the present
invention will become apparent upon reading the
following description of the drawings and detailed
description of the invention.
e 4
0,421 b0093
- 8
FIG. 2 is a top view showing an array o[ lift
and press::re sensor mechanisms spaced across the wings
and tail sections of an aircraft.
FIG. 2 is a cross-sectional view of a wing
showing leading edge, trailing edge and middle pressure
sensor mechanisms.
FIG. 3 is an enlarged top sectional view of a
leading edge or trailing edge sensor housing containing
a piezoelectric differential pressure sensor mounted on
a circuit board.
FIG. 3A is an enlarged top sectional view of
a middle sensor mounted on a circuit board.
FIG. 4 is an enlarged sectional view of a
pressure.sensor chamber mounted to an upper lift
surface of the aircraft.
PIG. 5 is an enlarged sectional view of a
pressure sensor orifice mounted to a lower lift surface
of the aircraft.
FIG. 6 is a diagram showing sixteen sensor
output leads connected to a digitizer.
FIG. 7 is a diagram showing data flow from a
central processing unit to on-board memory banks.
FIG. 8 shows a diagram showing a lift curve
of an aircraft during takeoff when the wings are clean,
when rime ice is present, when a fluid contaminant is
present, and when the leading edge has been roughened
by attaching sandpaper to a leading edge of the wing.
FIG. 9 is a diagram showing data routings
after the data is processed by a central processing
unit.
FIG. 10 shows a SOLA screen display of a -
normal aircraft lift pattern during sustained level
flight.
e '.
CA2160093
9 -
BIG. 11 is a cross-sectional plan view of a
wing embodying air pressure sampling ports, according
to one embodiinent of the invention.
PIG. 12 is a perspective cut-awav view of the
wing section of PIG. 11, showing a leading edge
sampling port.
FIG. 13 is a partial cross-sectional, partial
exploded side view of a sampling port, according to the
present invention.
FIG. 14 is an exploded view of the sampling
port of PIG. 13.
FIG. 15 is a side view, in partial ghost
cross-section, showing the sampling port mounted in a
skin of an air foil.
FIG. 16 is a perspective view of an air
pressure differential sensor cell of the piezoelectric
type.
FIG. 17 is a perspective view showing in
ghost and cut-away the preferred placement of sensor .
ports, according to one embodiment of the present
invention.
FIG. 18 is a plan view of one embodiment of a
human-readable warning and control screen.
FIG. 19 is a top view of a Beech Craft Baron
embodying air pressure-measuring devices, according to
the invention.
FIG. 20 is a graph entitled "Lift Effect Due
To Simulated Frost-Ground Test," disclosing data and
data formats according to an aspect of the invention.
FIG. 21 is a graph entitled "Flight Test-
System Reference Speeds," disclosing data and data
formats according to an aspect of the invention.
PIG. 22 is a graph entitled "Flight Test-
Local Lift," disclosing data and data formats according
to an aspect of the invention.
CAZ f 6ao93
-
FIG. 23 is a graph entitled "Flight Test-
System Reference Speeds," disclosing data and data
formats according to an aspect of the invention.
FIG. 24 is a graph entitled "Flight Test-
Local Lift," disclosing data and data formats according
to an aspect of the invention.
FIG. 25 is a graph entitled "Flight Test-
System Reference Speeds," disclosing data and data
formats according to an aspect of the invention.
FIG. 25 is a graph entitled "Flight Test-
Local List," disclosing data and data formats according
to an aspect of the invention.
FIG. 27 is a graph entitled "Flight Test-
System Reference Speed," disclosing data and data
formats according to an aspect of the invention.
FIG. 28 is a graph entitled "Flight Test-
Local Lift," disclosing data and data formats according
to an aspect of the invention.
FIG. 29 is a graph entitled "Flight Test-
System Reference Speeds," disclosing data and data
formats according to an aspect of the invention.
PIG. 30 is a graph entitled "Flight Test-
Local Lift," disclosing data and data formats according
to an aspect.of the invention.
FIG. 31 is a graph entitled "Flight Test-
System Reference Speeds," disclosing data and data
formats according to an aspect of the invention.
FIG. 32 is a graph entitled "Flight Test-
Local Lift," disclosing data and data formats according
to an aspect of the invention.
FIG. 33 is a graph entitled "Flight Test-
System Reference Speeds," disclosing data and data
formats according to an aspect of the invention.
FIG. 34 is a graph entitled "Flight Test-
Local Lift," disclosing data and data formats according
to an aspect of the invention.
OA-Z1b0093
- 11 -
FIG. 35 is a graph entitled "Local Lift-Left
Wing 2" Strips 100 Grit Sand on LE," ciisclosing data
and data fcriaats according to an aspect of the
invention.
FIG. 36 is a graph entitled "Local Lift-Left
Tail 2" Strips 100 Grit Sand on LE," disclosing data and data formats
according to an aspect of the
invention.
FIG. 37 is a graph entitled "Local Lift-Left
Wing 2" Strips 100 Grit Sand on LE," disclosing data
and data formats according to an aspect of the
invention.
PIG. 38 is a graph entitled "Local Lift-
Flight Test," disclosing data and data formats
according to an aspect of the invention.
.
12 CA2160093
- -
Whi1e this invention is susceptible of
embodiment in many different forms, there is shown in
the drawings and will herein be described in detail
preferred embodiments of the invention with the
understanding that the present disclosure is to be
considered as an exemplification of the principles of
the invention and is not intended to limit the broad
aspect of the invention to the embodiments illustrated.
Accordingly, FIGS. 1-10 disclose a preferred
method and apparatus defining a system for measuring
and analyzing lift contemporaneously before and during
flight. FIGS. 11-38 disclose other preferred methods
and apparatus defining a system for determining
measurinq and monitoring lift, air speed and direction,
and flight parameters which can be calculated or
otherwise determined from and in connection with data
from the system. While development is still ongoing,
it is believed the preferred embodiments can provide
real time analysis of a variety of performance and
safety related items among the systems features are the
following: ice detection - both in air and on the
ground; stall margin analysis - actual measurement of
margins to stall; wind shear analysis and amelioration;
side slip; wind impact analysis - on ground and in the
air; fought monitoring - both atmospheric and
performance related; enhanced CAT-3 performance;
critical systems backup; sophisticated data acquisition
of virtually all aircraft related performance
indicators; contaminant or structural impairments to
lift; airframe modification analysis and data
acquisition; airspeed indications; and, attitude
monitoring. Enhanced margins of safety are also
possible during CAT-3 instrument approaches.
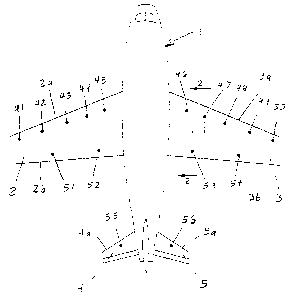
FIG. 1 shows an aircraft 1 with two wings 2
and 3 and two tail sections 4 and S. The wings and
-----
13 CA2 160093
- -
tail sections 2-5 comprise the lift surfaces or
airfoils of the aircraft. As shown in FIG. 2, each
airfoil 2-5 has an upper lift surface 12 and a lower
lift surface 14.
The aircraft 1 is equipped with an array of
sixteen lift sensor mechanisms 41-56 located in
airfoils 2-5 for measuring lift. Ten sensors 41-50 are
located near leading edges 2a and 3a of wings 2 and 3:
Four sensors 51-54 are located near the trailing edges
2b and 3b of wings 2 and 3. Two sensors 55 and 56 are
located near the.leading edges 4a and Sa of the tail
sections 4 and 5. Although sixteen lift sensors are
shown, it should be understood that more or fewer
sensors could be used and the placement of the sensors
may vary for a particular aircraft. In addition,
although the sensor mechanisms 41-56 are shown and
described as being in communication with both upper and
lower lift surfaces 12 and 14 to measure the pressure
differential between those surfaces, it should be
understood that the broad aspect of the invention could
utilize only the upper lift surfaces 12, with the
pressures for the lower lift surfaces 14 being provided
by some other means, such as a hypothetical data base.
The aircraft 1 is also equipped with an array
of twenty-four pressure sensor mechanisms 141-164
located in airfoils 2-5 for measuring the pressures
acting on these surfaces. Pressure sensor mechanisms
141-164 are similar to the lift sensor mechanisms 41-56
except that they communicate with only one surface 12
or 14. Sixteen sensors 141-148 are located inside a
middle portion of the wings 2 and 3. Eight sensors
141-148 communicate with the upper lift surfaces 12 and
Eight sensors 149-156 communicate with the lower lift
surfaces 14. Eight pressure sensors 157-164 are also
located inside a middle portion of the tail, sections 4
and 5 of the aircraft. Four sensors 157-160
Ca2160093
14 -
communicate with the upper surfaces 12 and four sensors
161-164 communicate with the lower surfaces 14.
Although tc:nty-four pressure sensors are shown, it
should be understood that more or fewer sensors could
be used and the placement of the sensors may vary for a
particular aircraft. In addition, although pressure
sensor mechanisms 141-164 are shown and described as
communicating with lift surfaces 12 and 14, it should
be understood that these sensors could communicate with
non-lift surfaces such as the nose, fuselage or rudder
of the aircraft.
As shown in FIGS. 2-5, each lift sensor
mechanism 41-56 comprises a pressure sensor 60, a
circuit board 70, a housing 80, upper and lower tubes
90 and 100, an upper chamber 110 and a lower orifice
120. The actual pressure being exerted on upper lift
surface 12 is communicated through chamber 110 and tube
90 to one side 62 of sensor 60. The actual pressure
being exerted on lower lift surface 14 is communicated
through orifice 120 and tube 100 to a'second side 63 of
sensor 60. In this way, sensor 60 measures the actual
differential pressure between upper and lower lift
surfaces 12 and 14.
As shown in FIG. 2, each sensor mechanism 41-
56 and 141-164 is mounted inside airfoils 2-5. An
internal mount protects sensor 60 and circuit board 70,
does not alter the desired shape of lift surfaces 12
and 14 and provides installation flexibility.
Installation flexibility is important because there are
typically only a minimal amount of available locations
for mounting pressure sensor mechanisms 41-56 inside
airfoils 2-5.
As shown in FIGB. 3 and 3a, lift sensor 60
and pressure sensor 61 are preferably standard
meteorological piezoelectric sensors. Sensors 60 and
61 have a voltage outaut in the range of about 1-5
CA 02160093 2006-11-06
CA2160093
- 15 -
volts for a change in differential pressure of about 5
T
psi. These sensors are sold by Foxbureau-ITC,M Inc., of
San Jose, California as Model No. 2010. Similar
sensors are also available from Aerospace Systems of
Mesa, Arizona.
Sensors 60 and 61 are mounted on circuit
board 70 which receives and modifies the output of the
sensors. Circuit board 70 converts the typically
nonlinear sensor output to a smooth linear signal and
may amplify the output of the sensor. Sensors 60 and
61 and circuit board 70 run off a 24 volt power supply
and draw an average of about 50-60 milliwatts to
facilitate hook up to a typical aircraft electrical
system. The voltage drop across positive output lead
74 and negative output lead 75 of sensor 60 provides a
measurement of the differential pressure or lift
between upper and lower surfaces 12 and 14. The
voltage drop across positive output lead 74 and
negative output lead 75 of sensor 61 provides a
measurement of the pressura acting on upper surface 12
or lower surface 14. The negative output lead 75 of
each sensor mechanism 41-56 and 141-164 is connected to
a common ground.
Housing 80 encloses and protects sensor 60 or
61 and circuit board 70. Housing 8o has a volume of
about one and a half cubic inches as sensor 60 or 61
and circuit board 70 are commercially available in
miniaturized form. Tubes 90 and 100 fit through a pair
of holes in the housing 8o. A heater (not shown) may
be provided to heat housing 80 to ensure that sensor 60
or 61 and circuit board 70 remain at a substantially
constant temperature. Maintaining a constant
temperature is important because a typical commercial
airplane experiences temperatures of about -40 F to
about 1106F. Such temperature changes could affect the
voltage output of sensor 60 or 61 and circuit board 70.
CA21 60093
- 16 -
Each heater should draw about 10 watts of power to
facilitate connection to the aircraft electrical
system.
As shown in FIGS. 2-5, upper and lower tubes
90 and 100 communicate pressure from chamber 110 and
orifice 120 to opposite sides 62 and 63 of pressure
sensor 60 respectively. The sides 62 and 63 of sensor
60 are provided with nipples 64 and 65 for receiving an
end of tubes 90 and 100. Tubes 90 and 100 are flexible
and have an inside diameter of about 1/64 inch to
facilitate ease.of installation and minimize potential
clogging. Sensor 61 is similar to sensor 60 except
that only one nipple 64 or 65 is provided. This nipple
is connected to a single tube 90 or 100, and
communicates with a single chamber 110 or orifice 120.
As shown in FIG. 4, chamber 110 is mounted
flush with upper lift surface 12, and does not alter
the desired shape of the airfoil. A number of vent
holes 112 are laser drilled into a 0.85 inch diameter
titanium disk that forms the top of chamber 110. A
array of 144 holes 112 expose the inside of chamber 110
to the external pressure acting on upper lift surface
12. Each hole 112 is about 0.001 inch in diameter
inhibit water vapor and debris from entering the
chamber and clogging the sensor mechanism. A nipple
114 is provided for attaching an end of tube 90 to
chamber 110. Chamber 110 may also be heated to
facilitate self cleaning.
As shown in FIG. 5, orifice 120 is mounted to
lower lift surface 14, preferably directly below
chamber 110. One end 122 of orifice 120 is exposed to
the pressure acting on lower lift surEace 14. An other
end 124 of orifice 120 is adapted to securely receive
an end of lower tube 100.
As shown in FIG. 1, lift sensor mechanisms
41-50 are located near the leading edges 2a and 3a of
CA2160093
17 -
wings 2 and 3. Because a large amount of lift is
generated near the leading edges of the wings, a sma11
change in lift can be detected by sensors 41-56. Only
the chambers 110 need be located near leading edges 2a
and 3a of wings 2 and 3. For a typical airfoil, the
best results are achieved when the chambers 110 are
located in front of the first pressiure spike line of
wings 2 and 3. This spike line typically occurs at an
apex 15 of upper lift surface 12 for a high percentage
wing and more toward the leading edge 2a and 3a for a
low percentage wing.
Lift sensors 41-50 measure the actual
differential pressure between upper and lower lift
surfaces 12 and 14. These sensors 41-50 also monitor a
lift pattern being generated across wings 2 and 3.
Five sensor mechanisms 41-45 are located on the left
wing 2 and five sensor mechanisms 46-50 are located on
the right wing 3. Sensing mechanisms 41-45 and 46=50
are preferably spaced equidistantly across wings 2 and
3 respectively. Sensing mechanisms 41-45 of wing 2 can
be compared to sensing mechanisms 46-50 of wing 3 to
ensure an equal amount of lift is produced by each
wing.
Four lift sensing mechanisms 51-54 are also
located near the trailing edges 2b and 3b of wings 2
and 3. These sensing mechanisms 51-54 monitor stall.
Inner trailing edge sensing mechanisms 52 and 53 should
be located approximately 30-35% down the wing from the
fuselage, but outside the engine nacelle. Outer
trailing edge sensing mechanisms 51 and 54 should be
Iocated approximately 60-70% down the wing.
Two lift sensing mechanisms 55 and 56 are
located near the leading edges 4a and 5a of tail
sections 4 and 5. One sensing mechanism is located on
each tail section. The tail sensing mechanisms 55 and
56 monitor lift production of the tail sections 4 and 5
Ca21b0093
18 -
and detect icing or other contaminants effecting these
lift surfaces. Tail leading edge sensors 55 and 56 can
also be use'. in combination with wing leading edge
sensors 41-50 to monitor for-to-aft lift distribution.
A crew can use this for-to-aft lift information to make
appropriate adjustments and maximize flight
performance.
Pressure sensing mechanisms 141-156 are
located in the middle portion of wings 2 and 3.
Sensing mechanisms 141-148 measure the pressure acting
on the upper wing surfaces 12, and sensing mechanisms
149-156 measure the pressure acting on the lower wing
surfaces 14. Four additional sensors 152-156 are also
located on the upper and lower surfaces of tail
sections.4 and 5.
Pressure sensors 141-156 can be used to
compare the pressures acting on one surface of the
aircraft with the pressures acting on another surface.
For example, the pressures acting on the lower surface
14 of wing 2 can be compared to the lower surface of
wing 3 or the lower surface of tail 4 to ensure proper
wing balance and for-to-aft balance is being attained
respectively. Pressure sensing mechanisms 141-156 can
be particularly useful in balancing the aircraft to
accommodate for cross winds. These sensing mechanisms
141-156 can also be used to detect unusual pressures
acting on the surface of the aircraft, such as those
produced by updrafts, downdrafts, wind shears and
microbursts.
As shown in FIG. 6, the positive output lead
74 of each lift sensor mechanism 41-56 is connected to
a digitizer board 150. The positive output lead 74 of
each pressure sensor mechanism 141-164 may be connected
to the same or a separate digitizer board (not shown).
Positive lead 74 transmits an analog voltage signal
produced by sensor 60 or 61 and circuit board 70.
i t
CA"2160093
19 -
Digitizer 150 converts the analog signal to a digital
output for use by a central processing unit or computer
200. A separate digitizer board (not shown) may also
be used for receiving and digitizing airspeed, airfoil
and atmospheric condition data. This data must
correspond to the real time pressure or lift
measurements of voltage output leads 74. The central
processing unit 200 can compare the actual pressure or
lift measurements of one surface of the aircraft (eg.,
wing 2) to the actual pressure or lift measurements of
another surface of the aircraft (eg., wing 3 or tail
section 4) to determine whether balanced flight is
being achieved.
FIG. 7 shows that the central processing unit
200 communicates with several memory devices 210 and
220. Hypothetical pressure and differential pressure
measurements are stored in both of these memory devices
210 and 220. An actual pressure or differential
pressure measurement can then be compared with the
hypothetical pressure of differential pressure
measurement to determine whether proper pressure and
lift is being developed for a given the aircraft
airspeed and atmospheric conditions.
Every type of aircraft will have its own
unique pressure and lift development characteristics.
In fact, it is believ2d that even individual aircraft
of the same type do not generate exactly the same
actual pressure and lift development data under the
same conditions. Consequently, hypothetical data must
be gathered by a test plane for each type of aircraft.
The test plane is loaded with a System For Onboard Lift---
Analysis (SOLA) and run through a series of test
flights to gather clean wing pressure and differential
pressure measurements corresponding to various speeds
and other aircraft flight and atmospheric conditions.
Abnormal pressure and differential pressure
(
. =
CA2160093
20 -
measurements can be produced through wind tunnel tescs
or mathematical calculation or extrapolation.
Hypothetical data is collected during all phases of
normal flight, such as taxiing, takeoff, climb, cruise,
let down, approach, landing and roll out.
The hypothetical database relates actual
pressure and pressure differential measurements to
corresponding pressure and lift measurements for
similar speed, aircraft and atmospheric conditions.
Other relevant aircraft condition data may include flap
and slat position, angle of attack, landing gear
position, etc. Atmospheric condition data may include
altitude, wind speed, wind direction, etc. Some
factors may be important to one or more phases of
flight but not the others. Of these conditions,
aircraft speed is believed to be the most critical to
evaluating proper lift development.
Actual pressure and differential pressure
measurements are also gathered during all phases of an
actual flight. The computer 200 gathers, compares and
stores 100 actual pressure or differential pressure
measurements every second during critical stages of
flight or when an anomaly condition is detected.
During noncritical stages of flight actual data is
gathered, compared and stored at a slower rate.
Only a certain narrow range of acceptable
pressure and differential pressure measurements will be
selected. Deviation from the acceptable range of lift
production will trigger an instant analysis of the
problem which will mathematically define the possible
cause of the unacceptable readings. Typically this is
a simple matter of division in that all contaminants
tested have a unique finger print (i.e., on an 18%
thickness to chord ratio wing, a clean wing reading is
100%, type II fluid contamination is 92-95%, rime ice
63-72% clear ice or mixed ice in excess of 1/32 inc.
~
. =
CA216QQ93
21 -
typically falls below 60%) wind related problems such
as wind shear, microburst, cross winds, etc. all
present equ--ily recognizable variations in sensor to
sensor wing to wing only for-to-aft readings as well.
Pressure and differential pressure measurements for
these recognized abnormal conditions would be stored in
one of the two databases or memory devices 210 or 220.
Actual pressure and differential pressure
measurements are also used to compile actual optimal
pressure and differential pressure measurements for
later use. Actual optimal data is preferably stored in
a separate database from the hypothetical optimal data.
Actual optimal data is specific to the particular
aircraft in which SOLA is installed, and is updated
each flight. The computer 200 will use actual optimal
data as a primary source of reference for comparing
actual pressure data to determine if an abnormal
pressure, pressure pattern, lift or lift pattern
condition exists.
FIG. 8 is a graph showing lift development
for wind tunnel tests performed on a SOLA equipped
aircraft. As can be seen from the graph, SOLA is
capable of distinguishing an optimal clean wing
pressure differential from anomalous ice, fluid
contaminant pressure differentials. As can readily be
seen from FIG. 8, distinctions between proper and
improper lift development can be made at speeds well
under 30 miles per hour. Detection of an anomaly at a
low speed is particularly important because it enables
a pilot to detect an abnormality while taxiing or to
safely abort a takeoff.
FIG. 9 shows a very basic SOLA output chart.
The computer can be linked with several onboard
systems, so that pressure and lift development data can
be passed on to these systems. A flight deck display
300 monitors lift production visually. An example of a
\
CA2160093
22 -
display showing a normal lift pattern during sustained
flight is shown in FIG. 10. When an anomaly is
detected, the crew will be advised both audibly and
visually. In certain instances the crew may be advised
of the corrective action that can be taken.
An advanced flight control system (AFCS) 310
will likewise be appraised of the pressure and lift
data and any existing anomalies. It is believed that
computer programs can be developed to direct the AFCS
to react to anomalies as they are detected. This
ability to interact should greatly enhance the ability
of the aircraft to perfarm more efficiently and much
more safely than previously possible. Reaction times
will be measured in milliseconds rather than in seconds
during critical situations.
A flight data recorder 320 can likewise be
enhanced from a performance standpoint. Additional
vital information including low altitude readings can
be included as can a myriad of other vital statistical
data.
A sub-channel flight downlink 330 can also be
connected to the SOLA computer. This will enable a
ground crew to monitor flight performance data during
flight. It will also enable lift development data to
be safely stored in the event of an accident
As shown in FIG. 7, vital flight data is
stored in both temporary and permanent storage
facilities. SOLA preferably has a flash memory device
210 capable of storing 100 megabytes and an optical
memory device 220 write or read only memory (WORM)
capacity of storing nearly one billion bytes of data.
The flash memory device 210 will maintain flight data
on a flight by flight basis. The monitoring of the
aircraft's performance and any anomalies will be kept
on both mediums 210 and 220. An optical drive 220 will
act as an auxiliary flight data recorder and will keep
1 4
~ CA"1160093
23 -
only very select data from each flight. However, in
the event of a critical anomaly the optical drive 220
and flash memory 210 will keep very detailed analysis
of the event. The flash memory 210 will be very flight
intensive. The data on the flash memory 210 will
normally be erased after each flight cycle and begin to
accumulate new data as the next flight cycle begins.
In the event of a dangerous anomaly
occurrence, the wORM 220 will keep a highly detailed
account of the critical data as well as passing the
data on to the above systems 300-330. This permanent
stored data can backup the flight data recorder 320 in
the event of an emergency situation or an anomaly
occurrence. The optical disk medium 220 is not subject -
to the same ease of data loss as a typical hard drive
unit. Electromagnetic forces and shock will not have
nearly the effect on the optical unit 220 as they have
on a hard disk. The optical drives 220 can provide a
great deal of flight data to the airlines and the
manufacturers. The optical drives 220 can also be
easily removed for study or archival storage, and
replaced with a new one in a matter of seconds.
Considering all the available performance related
inputs available, this particular feature should prove
itself to be a very beneficial item when it comes to
both maintenance or operational reviewing.
in another embodiment of the present
invention a method and apparatus are employed where the
air pressure sampling ports are generally arranged in
groups of four with three sampling ports on the wing
and one reference port within the aircraft.
Specifically, FIGS. 11 and 12 show a wing section 400
with a leading-edge sampling port 410, a sampling port
420 on the lower surface of the wing and a sampling
port 430 on the upper surface of the wing 410. The
ports 420,430 are connected by tubing 530 to opposite
CQ2160093
24 -
sides of a differential pressure sensor, such as sensor
540 of FIG. 16. When a sensor 540 is connected to
sampling potts 420,430, a signal is generated which
relates directly to lift. A sampling port 440 (not
shown) is located within an unpressurized cargo bay of
the aircraft to provide a non-turbulent, ambient,
static air pressure sample for differential comparison
to the air pressure at the leading edge sampling port
410. It should be appreciated that the sampling port
is desirabiy as.close as is practical to the leading
edge stagnation point of the airfoil. In this way, the
sampling port 410 measure experiences total air
pressure. The sampling ports 410 and 440 are
connected, also by tubing, such as tubing 530 and 530A
respectively, to a differential sensor, such as sensor
540, as disclosed in FIG. 16. Thus, the sensor 540
provides an electric signal from electrical connectors
592, 594 relating to the difference between the total
air pressure acting on the outer surface of the
aircraft and the non-turbulent, ambieftt, static air
pressure. From this signal and the value for the
ambient density of the air, the aircraft's speed
relative to the air can be determined. Other data may
be determined from this measurement, as set forth
below.
FIGS. 11-15 disclose the structure of the
sampling ports 410-440. Because each of the sampling
ports 410-440 differ only in their location on the
aircraft, and are identical in structure general
reference in the Figures is only by reference number
410 and is generically referenced in the text below
where aporooriate as 410. In other areas in the text,
the reference 410 will refer to the port locations as
well.
As can be best seen in FIG_ 13-15, sampling
ports 410-440 replace existing screws or rivets that
CA2160093
25 -
are used to attach the aircraft skin 450 to the
framework of the aircraft (not shown).
In this embodiment, sampling ports 410-440
are made from an aircraft screw 460 with a head portion
470 and a threaded body 480. The head 470 and body 480
are hollowed out defining a--sampling port housing with
a sump chamber 490. The head 470 is configured to
accept a titanium disc-shaped cover 500 which is laser
drilled to have 0.002 inch holes defining a mesh 510.
Successful tests have been conducted with meshes of 1o0
to 250 holes. The mesh permits air to flow into the
chamber 490.
Inside the chamber 490 a hollow needle 520 is
provided to permit air flow to a tube, such as tube
530, which tube connects the sampling port 410 to a
pressure sensor 540 (as best disclosed in FIG. 16). A
lower end 525 of the needle 520 inserts into an end 535
of the tube 530. An elastically deformable gland 550
surrounds the tube and needle portions 525 and 535
respectively. When cooperating compression nut 560 is
threaded onto the body 480 of screw 460 the gland 550
serves to seal both the chamber 490 including sealing
around the needle and tubing portions 525, 535. This
latter seal helps to maintain the connection of the
tubing 530 to the sampling port 410. The needle 520
has an entrance opening 528 on a side thereof to help
prevent fluid or particulate contamination directed in
a straight line from the cover 500. The needle
entrance is also placed at an upper end of the needle
so as to extend above a bottom 529 of sump chamber 490.
In this way, the sump chamber can accumulate
contaminants without passing them into the entrance 528
of the needle and further contaminating the system.
A jacket nut 570 is threaded on the body 480
of screw 460 to secure the screw 460 into the airfoil
surface 450. The jacket nut 570 has an elongate
CA2I60093
26 -
configuration to provide more thread contact. The
jacket nut 570 also employs a tapered recess 575 to
matingly clamp a periphery 455 of opening 458 in the
airfoil skin 450 between the recess 575 and a tapered
portion 475 of screw head 470 as best disclosed in FIG.
15. As best disclosed in FIG. 15, the sampling port is
substantially flush with the airfoil surface 450. This
helps to eliminate drag and turbulence which could
affect flight and air pressure measurements. It should
also be noted that an extra thickness of airfoil skin
457 can be added to strengthen the sampling port
mounting. This doubling can also be accomplished by
positioning the port in an area where the aircraft skin
is already doubled.
Preferably the jacket nut 570 is wrapped by a
low voltage electric heater jacket (not shown). The
heater jacket keeps the titanium cover 500 from icing
over since it operates at 50 degrees C. In the event,
that the entire titanium cover 500 is covered by a
contaminant, the trapped residual air pressure within
the sampling port 410 usually blows the mesh 510 holes
clean as the aircraft gains altitude.
Contamination of the sampling port 410 is
deterred and prevented in several ways. First the
small diameter (0.002 inch) of the holes in the mesh
510 of port cover 500 itself deters fluid entry based
on surface tension of the fluid. Normal takeoff levels
of lift and speed sensing do not allow leeching of
water or Type II fluids at a rate sufficient to
contaminant the inner pickup unit during takeoff roll
or ascent to cruise altitude. if any fluid should
leech through it is typically evaporated by a
combination of its own vapor pressure at reduced
atmospheric pressure at a higher altitude, and the heat
from the jacket heater (not shown) which keeps the
sampling port 410 at about 50 degrees C. It has also
CA 02160093 2006-11-06
- 27 C~2160093
-
been observed that wind and vibration combine to
produce a very effective scrubber of the mesh 510.
Although many installation configu.:ations are
possible and desired dependinq on specific data
acquisition requirements, FIG. 17 shows at least five
groups 580, comprised of sampling ports 410-430 (and
reference ports 440 inside the aircraft), on each wing
and one group 580 on each side of the horizontal
stabilizer as a recommended installation.
Air pressure is transmitted from each of the --
sampling ports 410-440 through tubing, such as tubes
530 and 530A which are preferably a coated type tubing
such as Teflon,~ to a separate but identical
differential air pressure sensor, such as sensor 540.
Each sensor 540 comprises a cell 590 and a sensor board
(not shown) both of which are housed in a sensor
enclosure box 610 (as shown in FIG. 17). The sensor
enclosure 610 has an operational temperature range from
minus sixty to over one hundred (100) degrees C, and is
able to withstand a loading of plus or minus twenty
five times the force of gravity ("gll) . The enclosure
610 can be located in any protected area in the wing or
fuselage. Preferably they are located centrally in the
fuselage.
Electronic signals are sent from the sensor
cell 590 to the sensor board (not shown) and from the
sensor board electrical signals are sent to a computer
(not shown). A central processfnq unit of the computer
has a 486 processor with a two hundred megabyte hard
disk drive and operating speed of fifty megahertz. The
power supply is confiqured to meet all FM and ICAO
requirements and has an optional one hour battery pack.
For use in data acquisition there is an optional eight
hundred megabyte optical drive.
Information can be displayed or used in several
ways. The pilot can monitor the system output on an
1 '
CQ21b0093
-z8-
existing EFIS tube, an existing flight management
system display or a color liquid crystal dispiay can be
supplied to display the system data, or a warning board
611, such as shown in FIG. 18. Information from the
sensor board also be integrated into the stall warning
system, the de-ice/anti-ice systems, and the automatic
flight control systems.
Preferably, the system is used before the
takeoff roll by taking actual pressure readings on the
wing and tail surfaces to determine if there are any
lift-robbing wing contaminants such as ice or type II
fluids. By comparing clean wing data to contaminated
wing data, any contaminant that collects on the wings
is detectable by the system as a percentage of "lift
loss." Ice, frost, or Type II fluids generate their
own distinct pressure footprint which is
distinguishable by the system. When a predetermined
"Lift Loss" threshold has been met, the flight crew is
issued an advisory.
Examole I
A wing section was mounted on a road test
vehicle (now shown). Two sets of sampling ports 580
were mounted in the test wing (not shown),
approximately thirty inches apart.
The test vehicle was driven at thirty miles
per hour (30 mph) and then decelerated to twenty miles
per hour (20 mph). The system output is shown at
FIG. 20. The graph is a plot of real-time versus
measurements of the pressure differentials of the SOLA
ports, in pounds per square foot. The line labeled sP
indicates the section contaminated with a four inch by
eight inch (4" X 8") section of one hundred ( 100) grit
sandpaper. It is noted that, leading-edge applications
of 100 grit sandpaper are used in the industry to
represent the effects of one thirty second of an inch
(1/32") of rime ice build up. The line labeled CW
4 4
CA2160093
- 29 -
illustrates the results for the clean airfoil. The
wind on the test day was negligible. The speeds are
vehicle speeds, not airspeeds.
Examn3.e II
A Beech Craft Baron (BE-95 C55) was equipped
with six groups, identical to group 580, as shown in
FIG. 19. FIGS. 20-38 disclose graphs produced to
demonstrate some of the data acquisition capabilities
and the sensitivity of the system. Normal flight
maneuvers were flown to generate these graphs.
FIGS. 22, 24, 26, 28, 30, 32, 34, 36, and 38 are plots
of real-time versus pounds per square foot of pressure
differential between upper and lower ports. FIGS. 21,
23, 25, 27, 29, 31, 33, 35, and 37 are plots of real-
time versus system reference speed. The graph lines
are generally labeled 1-6 and as LW and RW for left and
right wings and LT and RT for left and right tail,
respectively.
To fully understand these Graphs 21-38and
better appreciate the type of information that can be
developed, a brief discussion on the aerodynamics of
this model of Beech Craft Baron (FIG. 19) is
appropriate. For instance, the lift produced on the
outboard left and right wings positions 1LW and 4RWare
not equal on the graphs. This is due to the
manufacturers design.
The test aircraft's wings are designed to
stall at the wing root trailing edge first. The
geometric angle of incidence or wing twist has been
adjusted by the manufacturer to give the pilot better
low speed controllability. The angle of attack at the
wing root is slightly greater than the wing tip. The
data indicates a greater amount of lift at sampling
port group 580 locations 2LW and 3RW. Also, group port
580 positions 2LW and 3RW are ldcated in an area with a
longer chord and thicker wing sections than those near
~ CAZ16aa93
30 -
the wing tips. This difference in lift can be seen
throughout the graphs showing lift. During takeoff and
landings, these readings appear to be exaggerated
because of variances in angle of attack.
on this aircraft, the descending blade is on
the right side of both engines, the prop,ellers are not
counter-rotating. This is aerodynamically significant
as evidenced by the measurements and data acquired by
the system. The descending blade of the propeller
normally produces more thrust than the ascendinq blade.
This causes the aircraft to attempt to turn left during
high power settings at low airspeeds. The pilot
counters this force by applying right rudder.
The manufacturer also designs the aircraft to
balance these forces. The aft main wing has a built-in
angle of incidence or wing twist to produce a slightly
greater amount of lift force on that side. The graphs
reflect this difference between the wings. The
horizontal stabilizer is also designed to counter the
propeller forces.
The effects of the controls, airspeed, angle
of attack, configuration, and aerodynamic environment
can easily be determined, as shown by the graphs. Many
of the fluctuations in speed and lift seen in the
graphs are caused by the aircraft seeking a point of
equilibrium. other fluctuations are due to ground
effect, turbulence, or pilot control input.
FIGS. 21 and 22 illustrate the data obtained
during a takeoff. The brakes were held while full
power was applied to both engines for 45 seconds.
First, acceleration of the air stream over the left and
right horizontal stabilizers (5LT and 6RT) is detected.
The brakes were then released and a gradual increase in
system reference speed on all four sampling ports 410
is seen on the wings at around 50-63 seconds. As the
pilot rotated the aircraft into a climb attitude, the
0A2160093
31 -
saeed readings on the port 2LW and 3RW dropped into a
negative system reference speed, seen at about 62-64
seconds.
Until approximately the 60 second mark, a steady
increase in all of the lift readings is detected. The
angle of attack is then increased by the pilot to
rotate the nose of the aircraft into the climb
attitude. This can be seen graphically as dramatic
increase in the lift readings. A general decrease in
all the lift readings occurs as the aircraft climbs out
of ground effect at about 65-68 seconds. The
horizontal stabilizer lift readings reverse at the 67
second reference point. This is indicative of the
right rudder input by the pilot to counter the left
turning tendencies of this aircraft during a stabilized
climb.
FIGS. 23 and 24 show an aileron and rudder
cross control maneuver which simulates the forward slip
procedure used for cross wind takeoff and landings.
First, the pilot applied left ailerons, rolling the
aircraft into a left bank. At the same time, right
rudder was applied to inhibit the aircraft nose from
changing direction at about 550-570 seconds. This
placed the aircraft in an out-of-trim condition that is
expected to cause an excessive amount of drag. This
was detected by the general decrease in all of the
system reference speeds as the maneuver is flown. The
measurements show the two reference speeds on the
horizontal stabilizer drop below the wing reference
speeds as the out-of-trim condition worsens. As the
pilot neutralizes the controls, the saeeds all return
to normal.
Next, right aileron is applied with left
rudder (at about 575-600 seconds). Again, a general
decrease in all reference speeds with the exception of
the right horizontal stabilizer is detected. This is
CA 02160093 2006-11-06
CA2160093
- 32 -
due to the built-in precluding of the test aircraft's
tail.
The lift readings on the main wing crossover
and back as the aircraft is banked left and right.
Comparinq the lift readinqs on the horizontal
stabilizer, the pilot applies right rudder, the lift
readings reverse and the differential margin of lift
production increases. When the pilot applies left
rudder, the differential margin of lift production
increases. Again, due to the test aircraft's precluded
tail, a crossover of lift does not occur at this point.
FIGS. 25 and 26 disclose graphs of left and
right engine power reductions to idle maneuvers. The
engines were throttled back individually to simulate an
engine failure. Due to the location of the tail ASDIS*
ports, the airflow from the propeller normally produces
horizontal stabilizer system reference speed readings
that are 10 - 15 mph faster than the reference speeds
on the wing.*ASDIS means Automated Sample Data Instrumentation System.
As the pilot reduces power on the left engine
to flight idle, the left tail system reference speed is
shown to transition from 175 mph to 150 mph -620 660
seconds). Initiall.y, as the enqine decelerates, the
propeller moves to flat pitch and causes an excessive
amount of drag. The pilot must contend with the
cumulative effects of a fifty percent loss in available
power, a dramatic rise in drag until the propeller is
feathered, and increased drag caused by the flight
controls during the effort to maintain control of the
aircraft. The system reference speeds all begin to
decrease. As the pilot re-applies the power on the
left engine, the left horizontal stabilizer reference
speed returns to normal (5LT). The pilot then reduces
the power on the riqht engine to fliqht idle and the
maneuver is repeated (690 730 seconds).
= CA2i60093
33 -
The lift on the wings also transitions as the
pilot banks the aircraft right and left :n the ef-'ort
to maintain directional control during engine power
reductions. The lift on the horizontal stabilizer also
transitions, with the directional control rudder
applications.
FIGS. 27 and 28 disclose the graphs of data
taken during a left and right forty five degree, steep-
bank turn. First, the pilot rolled the aircraft into a
left forty five degree steep-banked turn detected about
770-815 seconds. At this point, the pilot must pitch
the nose of the aircraft up to maintain altitude. The
graphs show, the decrease in all the speeds while the
turn is in progress. The system then indicates that,
all of the speeds then return to normal as the pilot
rolls the wings level. A right forty five degree
banked turn is then flown as detected at about 840-880
seconds. Again all the speeds are detected as
decreasing during the turn.
As shown by the graphs, all of the lift
readings increase during the turns. The aircraft
experiences additional "g" loading as the pilot pitches
up the aircraft to maintain altitude. The data can
then be used to calculate the "g" loading which in this
case is calculated at 1.35 "g."
FIGS. 29 and 30 disclose the graphs generated
through measurements during slow flight, power off
stall, flaps down and up, and gear down and up
maneuvers. The flaps and landing gear were selected
down and the aireraft stabilized in slow flight at 85
mph., indicated air speed ("IAS") as detected at about
937-1025 seconds. The speed readings on leading edge
sample port 410 position 2LW and 3RW is detected moving
into negative speed values at about 1035-1100 seconds.
At 1100 seconds, the power is reduced to idle
and an aerodynamic power-off stall is executed with the
~ CA2ib0093
34 -
gear and flaos down as detected by the system. The
pilot then repeated the stall, with the landing gear
and flaps in the up position as detected at about 1200-
1250 seconds. At high angles of attack, air
accelerates over the leading edge ports and creates a
low pressure area. Again, graphically, the
corresponding system reference speed is indicated as
negative speed values. It should also be noted that
during minimum controllable airspeed conditions, the
wing tips and horizontal stabilizer are operating at
normal system reference speeds.
The system has the ability to tell the pilot
how close the aircraft is to stall and when
controllability is about to be lost. Graphically,
system airspeed at 2LW and 3RW dump first. The
aircraft is in low-speed flight and completely
controllable. As 1LW and 4RW dump, the aircraft is
still flying, although it is on the edge of
controllability. When the horizontal stabilizer system
reference speeds 5LT and 6RT dump, the aircraft is
completely stalled and controllability has been
sacrificed.
As can be seen by the data, the system can
provide detailed and accurate real-time detection of
the onset of a stall condition. Because the turbulence
and attendant lift-loss leading to stall, begins at the
trailing edge of the wing and progresses forward to the
leading edge, it will be understood by those with skill
in the art that the more pairs of SOLA ports along the
chord or width of the wing as desired for more discrete
points of stall can be determined. In other words, the
added sensors will give a finer increment of detection.
However, it will also be understood that, based upon
the known aircraft design, fewer ports are needed
because the wing portions where stall most likely is
predictable.
~ CA2160093
35 -
FIGS. 31 and 32 disclose the data from
measurements taken during a left engine shut down and
feather maneuver. The pilot reduced the left engine
power to flight idle at 1360 seconds into the fiight as
detected by the system. Propeller drag increased and
the left horizontal stabilizer reference speed
decreases below the wing reference speeds. The engine
was then shut down and the propeller feathered (1380
seconds). The power reduction and drag increase causes
the speed to decrease from 175 mph to 150 mph.
The left engine was restarted and stabilized
at flight idle at 1520 seconds. The power on the left
engine was then increased to full power (1525 seconds).
As the pilot applies right rudder to maintain
directional control, transitions ara seen in lift that
occur on the horizontal stabilizer sampling ports
420,430 readings during engine shut down and restart as
shown at 5LT and 6RT on the graph.
FIGS. 33 and 34 are graphs generated from
data collected on a normal approach and landing
profile. At 1885 seconds, the flaps were selected to
the 15 degree down position. This can be clearly seen
on the chart. The landing gear was then selected down
at 1920 seconds and full flaps were selected at 2000
seconds. Power reduction to flight idle occurred at
2020 seconds. Ground effect was encountered at
approximately 50 feet above ground level (AGL) and can
be discerned on the liftchart between 2000 and 2020
seconds.
Again, the leading edge sample port 410
speeds on ports 2LW and 3RW become negative during
landing flair (2025 seconds). This change in the sign
of the speed is due to the position of the ports 410.
When the aircraft is at high angle of attack, air flows
across the port instead of flowing into it. This
causes a low pressure area at the port 410. The system
cA2 a 60047
=
- 36 -
software interprets this low pressure asa "negative
speed.
F=uS. 35, 36, and 37 disclose the data
measured on two accelerate-stop taxi maneuvers with
clean wing versus contaminated wings. These graphs
detect and record data from an acceleration to 60 mph
followed by closing the throttle and braking to a full
stop. Data collection ceased upon brake application.
The first run, indicated by the line labeled C, was
conducted with a clean wing. The second run, indicated
by the line labeled SP, was made with the airfoil
leading edge contaminated with two-inch wide strips of
100 grit sandpaper to simulate an accumulation of
frost.
Due to the application of the simulated frost
on the leading edges, the local lift readings indicated
losses of approximately 15-18 percent. The sandpaper
strip application covered 15 percent of the wing span.
The strips were placed on the wing and horizontal
stabilizer surfaces at locations inboard and outboard
of the ASDIS ports.
FIG. 38 discloses data taken from comparative
ground rolls. This demonstrates the ability of the
system to indicate at an early stage during the ground
roll that the wing may not generate necessary lift
levels when contaminated. The red line represents SOIA
measured lift levels during a takeoff executed right
the wing free of contaminants. The graph line
labeled C displays the results obtained with sandpaper
contamination applied to the right wing. The rotation
speed on the aircraft is typically 100 mph. The
contaminated wing was accelerated to 80 mph (at 65 sec
on this plot) and takeoff was then aborted. This same
speed was reached for the clean wing case at
approximately 20 sec on this plot. It can be clearly
seen that there existed a large lift degradation for
37 - C/12160093
the contaminated case (about 50%) at the close
to-rotation speed attained. Moreover, the system wculd
have indicated large lift losses due to the contaminant
early in the ground roll.
It should be appreciated that not all facets
of.the system's capabilities are detailed in the
forgoing exemplary embodiments. For example, the data
generated and displayed in the graphs can form the
basis for performance templates for comparison with
subsequent flight templates. Such templates can be
stored and compared as a function of time, speed,
flight maneuver or other desired criteria. The data
may also be used to derive other desired aerodynamic
data for monitoring and controlling flight.
. For example, the above described methods and
apparatus can also provide a unique testing format
which allows tests to be conducted in a real world
environment in which wing sections are temperature
controlled and run through test sequences outdoors in a
manner that closely approximates those encountered by
today's aircraft, which land with super-cooled fuel on-
board into a variety of temperature and humidity
conditions.
While the specific embodiments have been
illustrated and described, numerous modifications come
to mind without significantly departing from the spirit
of the invention and the scope of protection is only
limited by the scope of the accompanying Claims.
For example, it is believed that the
invention, operating through the Advanced Flight
Management and Control Systems, can detect and analyze
the impact of a wind shear as it occurs and then
operating through the AFMCS ameliorate the shears
impact safely, averting the potential for disastrous
incidents.