Note: Descriptions are shown in the official language in which they were submitted.
CA 0220S309 1997-06-02
--1--
A TECHNIQ~E FOR ~UBSTANTI~LLY ELIMINATI~G TEMPERATURE
IND~CED MEASUREMENT ERRO~S FROM A CORIOLI~ METER
This application is a divisional of Application
Ser. No. 2,113,165, filed July 2, 1992.
~ACKGROUND OF THE I~VE~TIO~
1. Field of the Invention
s
The present invention relates to apparatus and
methods for inclusion in, illustratively, a Coriolis mass
flow rate meter that substantially eliminate temperature
induced measurement errors which might otherwise be
produced by performance differences existing between two
separate input channel circuits contained in the meter.
2. Description of the Prior Art
Currently, Coriolis meters are finding
increasing use in a wide variety of commercial
applications as an accurate way to measure the mass flow
rate of various process fluids.
Generally speaking, a Coriolis mass flow rate
meter, such as that described in United States patent
4,491,025 (issued to J. E. Smith et al on January 1, 1985
and owned by the present assignee hereof -- hereinafter
referred to as the '025 Smith patent), contains one or
two parallel condùits, each typically being a U-shaped
flow conduit or tube. As stated in the '025 Smith
patent, each flow conduit is driven to oscillate about an
~ axis to create a rotational frame of reference. For a
U-shaped flow conduit, this axis can be termed the
bending axis. As process fluid flows through each
oscillating flow conduit, moveme~t of the fluid produces
reactionary Coriolis forces that are orthogonal to both
the velocity of the fluid and the angular velocity of the
CA 0220~309 1997-06-02
,
W093/nl~7~ ~CT/US92/05
--2--
conduit. These reactionary Coriolis forces, though quite
small when compared to a force at which the conduits are
driven, nevertheless cause each conduit to twist about a
torsional axis that, for a U-shaped flow conduit, is
S normal to its bending axis. The amount of twist imparted
to each conduit is related to the mass flow rate of the
process fluid flowin~ therethrough. This twist is
frequently measured using velocity signals obtained from
magnetic velocity sensors that are mounted to one or both
of the flow conduits in order to provide a complete
velocity profile of the movement of each flow conduit
with respect to either the other conduit or a fixed
reference. In dual conduit Coriolis meters, both flow
conduits are oppositely driven such that each conduit
oscillates (vibrates) as a separate tine of a tuning
fork. This "tuning fork" operation advantageously
cancels substantially all undesirable vibrations that
might otherwise mask the Coriolis force.
In such a Coriolis meter, the mass flow rate of
a fluid that moves through the meter is generally
proportional to the time interval (the so-called "~t"
value) that elapses between the instant one point
situated on a side leg of a flow conduit crosses a
pre-determined location, e.g. a respective mid-plane of
oscillation, until the instant a corresponding point
situated on the opposite side leg of the same flow
conduit, crosses its corresponding location, e.g. its
respective mid-plane of oscillation. For parallel dual
conduit Coriolis mass flow rate meters, this interval is
generally equal to the phase difference between the
velocity signals generated for both flow conduits at the
fundamental (resonant) frequency at which these conduits
are driven. In addition, the resonant frequency at which
each flow conduit oscillates depends upon the total mass
of that conduit, i.e. the mass of the conduit itself,
when empty, plus the mass of any fluid flowing
CA 0220~309 1997-06-02
'~093/01473 ~CT/US92/05
--3--
therethrough. Inasmuch as the total mass varies as the
density of the fluid flowing through the conduit varies,
the resonant frequency likewise varies with any changes
in fluid density and, as such, can be used to track
s changes in fluid density.
For some time, the art has taught that both
velocity signals are processed through at least some
analog circuitry in an effort to generate output signals
that are proportional to the mass flow rate of the
process fluid. In particular, the output signal
associated with each velocity sensor is ordinarily
applied through analog circuitry, e.g. an integrator
followed by a zero crossing detector (comparator),
ls contained within a separate corresponding input channel.
In this regard, see illustratively United States patents
4,879,911 (issued to M. J. Zolock on November 14, 1989),
4,872,351 (issued to J. R. Ruesch on October 10, 1989),
4,843,890 (issued to A. L. Samson et al on July 4, 1989)
and 4,422,338 (issued to J. E. Smith on Dec. 27, 1983)
-- all of which are also owned by the present assignee
hereof. While the various approaches taught in these
patents provide sufficiently accurate results in a wide
array of applications, the meters disclosed in these
references, as well as similar Coriolis meters known in
the art, nevertheless suffer from a common drawback which
complicates their use.
Specifically, Coriolis mass flow meters operate
by detecting what amounts to be a very small
inter-channel phase difference between the signals
produced by both velocity sensors, i.e. the ~t value, and
transforming this difference into a signal proportional
~ to mass flow rate. While, at its face, a at value is
obtained through a time difference measurement, this
value, in actuality, is also a phase measurement. Using
such a time difference measurement conveniently provides
CA 0220~309 1997-06-02
~093/01~7~ /u~
--4--
a way to accurately measure a manifestation of a phase
difference appearing between the velocity sensor signals.
In Coriolis meters currently manufactured by the present
assignee, this difference tends to amount to
s approximately l3olsec at maximum flow. Each input channel
in a Coriolis meter imparts some internal phase delay to
its input signal. While the amount of this delay is
generally quite small, it is often significant when
compared to the small inter-channel phase difference,
i.e. 1301sec or less, that is being detected. Currently
available Coriolis meters have relied on assuming that
each input channel imparts a finite and fixed amount of
phase delay to its corresponding velocity signal. As
such, these Coriolis meters generally rely on first
measuring, at a true zero flow condition occurring during
meter calibration, either the inter-channel phase
difference (at) or the indicated mass flow rate.
Subsequently, while metering actual flow, these meters
will then subtract the resulting value, in some fashion,
from either the measured at or mass flow rate value, as
appropriate, in order to generate an ostensibly accurate
mass flow rate value for the process fluid then flowing
therethrough.
Unfortunately, in practice, this assumption has
proven to be inaccurate. First, not only does each input
channel often produce a different amount of internal
phase delay with respect to the other, but also the phase
delay that is produced by each channel is temperature
dependent and varies differently from one channel to the
other with corresponding changes in temperature. This
temperature variability results in a temperature induced
inter-channel phase difference. Because the measured
phase difference (~t) that results from actual flow
through the meter is relatively small, then an error in
the measured phase difference between the velocity
signals and attributable to the temperature induced
CA 0220~309 1997-06-02
,
W~93/0:473 PCT/US~2/055
--5--
inter-channel phase difference can, in certain instances,
be significant. This error is generally not taken into
account in currently available Coriolis mass flow rate
meters. In certain situations, this error can impart a
noticeable temperature dependent error into mass flow
rate measurements, thereby corrupting the measurements
somewhat.
In an effort to avoid this error, one well
known solution in the art is to shroud an installed piped
Coriolis meter, including its electronics, with a
temperature controlled enclosure. This approach, which
prevents the meter from being exposed to external
temperature variations and maintains the meter at a
relatively constant temperature while it is in operation,
greatly increases the installed cost of the meter and is
thus not suited for every application. Hence, in those
applications where installed cost is a concern, this
approach is generally not taken. Specifically, in those
applications and particularly where the meter is to be
sited indoors and not exposed to wide temperature
variations, then the measurement error which results from
the temperature induced inter-channel phase difference,
while generally expected, tends to remain quite small and
relatively constant. As such, this error is usually
tolerated by a user. Unfortunately, in other
applications where the meter is not housed in a
temperature controlled enclosure, such as outdoor
installations where the meter is expected to experience
wide fluctuations in operating temperature, the error
generally varies and can become significant, and thus
needs to be taken into account.
Apart from errors arising from temperature
induced inter-channel phase differences, many currently
availa~le Coriolis mass flow rate meters also
disadvantageously exhibit an additional source of
CA 0220~309 1997-06-02
~-'U 'J~ jy~/~)5
--6--
measurement inaccuracy related to temperature. In
particular, Coriolis meters generally measure the
temperature of the flow conduit and, owing to changes in
flow conduit elasticity with temperature, accordingly
s modify a meter factor value based upon the current
temperature of the conduit. This meter factor, as
modified, is then subsequently used to proportionally
relate the inter-channel phase difference (~t) value to
mass flow rate. Flow conduit temperature is measured by
digitizing an output of a suitable analog temperature
sensor, such as a platinum RTD (resistive temperature
device), that is mounted to an external surface of a flow
conduit. The diqitized output usually takes the form of
a frequency signal, oftentimes produced by a
voltage-to-frequency (V/~) converter, that is totalized
(counted) over a given timing interval to yield an
accumulated digital value that is proportional to flow
conduit temperature. Unfortunately, in practice, V/F
converters usually exhibit some temperature drift which,
based upon the magnitude of a change in ambient
temperature, could lead to an error, amounting to as much
as several degrees, in the measurement of flow conduit
temperature. This error will, in turn, corrupt the mass
flow rate.
A solution proposed in the art to ostensibly
deal with temperature dependent variations in the
performance of the input channels of Coriolis meters is
taught in United States patent 4,817,448 tissued to J. W.
Hargarten et al on April 4, 1989 and also owned by the
present assignee hereof -- hereinafter referred to as the
'448 Hargarten et al pa~ent). This patent discloses a
two channel switching input circuit for use in a Coriolis
meter. In particular, this circuit includes a two-pole
two-throw FET (field effect transistor) switch located
between the outputs of the velocity sensors and the
inputs to both of the channels. In one position, the FET
CA 0220~309 1997-06-02
W~:) 93/01473 PCr/US92/05
switch connects the outputs of the left and right
velocity sensors to corresponding inputs of the left and
right channels, respectively; while in the opposite
position, these connections are reversed. The switch is
s operated to change its position at every successive cycle
of flow conduit movement. In this manner, the output of
each velocity sensor is alternately applied to both
channels in succession. Over a two cycle interval,
appropriate time intervals are measured with respect to
the velocity waveforms applied to both channels and then
averaged together to yield a single time interval value
~rom which errors attributable to each individual channel
have been canceled. This resulting time interval value
is then used in determining mass flow rate through the
meter.
While this solution does indeed substantially
eliminate temperature induced inter-channel phase
differences, it possesses a drawback which limits its
utility somewhat. Specifically, this input circuits in
the apparatus taught in '448 Hargarten et al patent do
not include integrators. Owing to the lack of any low
pass filtering that would have been provided by
integrators, these input circuits are therefore
susceptible to noise. Unfortunately, the switching
scheme taught in this patent does not permit integrators
to be included in the switched portion of the input
circuitry, hence requiring that, to provide noise
immunity, an integrator must be located after the FET
switch. Unfortunately, in this location, the phase delay
inherent in the integrator can not be readily
compensated, if at all. Inasmuch as the integrator
disadvantageously tends to provide the largest source of
phase delay in the input circuitry, inclusion of such an
integrator would add an error component, i.e. an
uncompensated phase delay, to the measured ~t values.
Moreover, this phase delay would also vary with
CA 0220~309 1997-06-02
~CT/~S92/~55
--8--
temperature changes. Consequently, the resulting
measured flow rate values would contain an error
component. Thus, it became apparent that the solution
posed in the '448 Hargarten et al patent has limited
applicability to relatively noise-free environments.
Therefore, a need exists in the art for a
Coriolis meter that provides accurate flow and flow rate
output values that are substantially insensitive to
ambient temperature variations and hence does not
appreciably exhibit adverse temperature affects an could
provide appreciable noise immunity. Such a meter should
possess negligible, if any, temperature induced
measurement inaccuracies over relatively wide variations
in ambient temperature thereby permitting the meter to be
used to provide highly accurate flow measurements in a
wide variety of applications and particularly without a
need to house the meter in a temperature controlled
enclosure. Advantageously, the increased measurement
accuracy provided by such a meter and the attendant
installed cost savings associated therewith would likely
broaden the range of applications over which such a meter
could be used.
CA 0220~309 1997-06-02
.
WO 93/(11473 PCT/US92/05584
_g _
SUM~ARY OF THE INVENTION
An object of the present invention is to
provide a Coriolis meter that provides accurate output
measurements that are substantially insensitive to
variations in ambient temperature.
A specific object is to provide such a meter
that substantially, if not totally, eliminates the need
for a temperature controlled enclosure.
Another specific ob~ect is to provide a
Coriolis meter in which the measured flow and flow rate
values do not contain appreciable error, if any at all,
that would otherwise result from switching transients
appearing in the input channels.
These and other objects are accomplished in
accordance with the teachings of my invention by cycling
the operation of each channel, particularly using a
relatively short period, between: (a) measuring the
internal phase delay of that channel and (b) measuring
raw flow based ~t value(s). The raw value(s) are then
compensated, typically by subtracting, the measured phase
delay value therefrom in order to yield a corrected
~t value. A current value mass flow rate is then
determined using the corrected rather than, as occurs in
the art, the raw ~t value(s).
Specifically~ the two identical input channels
(i.e. left and right), as commonly used in prior art
Coriolis flow meters, are replaced with two pairs of
input channels (i.e. pairs A-C and B-C) that permit the
current internal phase delay exhibited by each channel
pair to be measured. Each of the channel pairs is
operated to cycle between measuring its own internal
phase delay, i.e. a "zeroing" mode, and measuring ~t
CA 0220~309 1997-06-02
,
~'.'0 93/()147.~ PCl /l'S92/0~
--10--
values for actual flow conditions, i.e. a "measurement"
mode. Given the short cycle time, the current phase
delay value accurately reflects any temperature induced
changes then occurring in the performance of each channel
S pair. Once the current internal phase delay value is
known for each pair, that value is then used to correct
flow based ~t values subsequently produced by that pair
during its next measurement mode. Because the ~t flow
based measurements provided by each channel pair are
corrected for the current internal phase delay associated
with that particular pair, these ~t values do not contain
any appreciable temperature induced error components
regardless of the ambient temperature of the meter and
its variation. As such, a Coriolis meter constructed in
accordance with my invention, can advantageously be used
in environments with widely varying temperatures with
essentially no diminution in accuracy owing to
temperature changes.
In accordance with the teachings of a preferred
embodiment of my invention, my inventive flow measurement
circuit utilizes three separate similar input channels
(i.e. channels A, B and C) through which inter-channel
phase difference measurements are successively and
alternately ta~en for each of two pairs, i.e. pairs A-C
and B-C, of the three channels. Channel C serves as a
reference channel and is continuously supplied with one
of the two velocity waveform sensor signals, and
specifically for purposes of the preferred embodiment the
left velocity sensor signal, as its input signal. The
input to channels A and B is either the left or riqht
velocity sensor signals. While both the zero and
measurement modes involve measuring the inter-channel
phase difference in a pair of channels, the principal
distinction between the modes is that in the zero mode,
the same velocity sensor signal is applied to both
channels in that pair so that the resulting inter-channel
CA 0220~309 1997-06-02
WO 93/~147~ rCT/U592/05584
phase difference measurement provides a measurement of
the internal phase delay for that pair; while, in the
measurement mode, the left and right velocity signals are
applied to different corresponding channels in that pair
so as to provide a measurement, though uncorrected, of
the current flow based ~t value for subsequent use in
determining current mass flow and flow rate values.
Thouqh inter-channel phase difference (at) measurements
are taken during both modes, to simplify matters and
avoid confusion, I will distinguish between these values
in terms of their occurrence. I will henceforth refer to
those phase measurements which occur during the zero mode
as being inter-channel phase difference measurements and
those which occur during the measurement mode as being ~t
values.
Specifically, for any channel pair operating in
the zero mode, such as pair A-C, the same, i.e. left,
velocity sensor signal is applied to the inputs of both
channels in that pair. Inter-channel phase difference
measurements are then successively and repetitively taken
during a so-called "zeroing" interval with the results
being averaged during this interval. Ideally, if both of
the channels in this pair exhibit the same internal phase
delay, i.e. the phase delay through channel A equals that
of reference channel C, then the resulting inter-channel
- phase difference measurements will all equal zero.
However, in actuality, at any instant, all three channels
usually possess different internal phase delays.
Nevertheless, since the phase delay for each pair is
measured with respect to the same reference channel, i.e.
~ channel C, any differences in the phase delay between the
two pairs is caused by differences in the internal phase
delay occurring between channels A and B. Once the
3s "zeroing" interval has terminated, the input to the
non-reference channel in that pair is switched to the
other velocity sensor signal, i.e. the right velocity
CA 0220~309 1997-06-02
PC~/~'S92/05s84
-12-
sensor signal. A finite period of time, i.e. including a
so-called "switching" interval, is then allowed to expire
before that channel pair is operated in the "measurement"
mode during which flow based ~t values are measured. The
s switching interval is sufficiently long to enable all
resulting switching transients to settle out.
While one pair of channels, e.g. A-C, is
operating in its zero mode, the other pair, e.g. B-C, is
operating in its measurement mode in order to provide
continuous flow metering. For any channel pair, each
successive current flow based ~t value obtained during
its measurement mode is compensated by, typically
subtracting, the most recent value of the internal phase
lS delay that has been measured for this channel pair during
its preceding zero mode.
The time during which one channel pair operates
in the measurement mode, i.e. the measuring interval,
equals the entire time that the other pair operates in
the zero mode. This latter time includes the time during
which the latter channel switches its non-reference
channel input from the right to the left velocity sensor
signal, then performs zeroing, and finally switches its
non-reference channel input from the left back to the
right velocity sensor signal.
At the conclusion of the measurement interval,
the channel pairs simply switch modes, with
illustratively channel pair B-C initially switching its
non-reference channel input from the right to the left
velocity sensor signal, and channel pair A-C commencing
flow based at measurements. Once this input swi~ching is
complete, channel pair B-C then undertakes zeroing
followed by channel switching in the opposite direction
-- while channel pair A-C remains in the measurement
mode, and so on for successive cycles of operation.
CA 02205309 1997 - 06 - 02
W093t0l473 PCT/USg2/05
-13-
Furthermore, in accordance with my inventive
teachings, temperature induced errors in the temperature
measurement of the flow conduit provided through the RTD,
s and specifically associated with temperature drift in the
V/F converter, are also advantageously eliminated.
Specifically, to eliminate these errors, two reference
voltages, in addition to the RTD voltage, are selectively
and successively converted through the V/F converter into
lo frequency values, in terms of counts, and are then used
to define a linear relationship, specifically a
proportionality factor, that relates the counted
frequency value to measured flow conduit temperature.
Then, by simply multiplying the counted fre~uency value
for the RTD voltage by this factor, a value for the
corresponding measured flow conduit temperature results.
Inasmuch as the reference voltages do not appreciably
change, if at all, with temperature variations and are
each repetitively converted through the V/F converter at
a relatively short periodicity, on the order of
illustratively .8 seconds, any temperature drift produced
by the V~F is accurately reflected in the resulting
counted frequency values for the reference voltages
themselves. Since temperature drift equally affects the
counted values for both reference voltages and the RTD
voltage, but does not change the relationships
thereamong,- the proportionality factor when multiplied by
the counted frequency value for the RTD voltage produces
a true temperature value that is substantially
independent of any temperature drift produced by the V~F
converter. By eliminating temperature induced errors in
the measured temperature, the meter factor will be
appropriately modified in a manner that accurately
reflects changes in flow conduit temperature.
Furthermore, while my inventive meter
determines a current mechanical zero value (i.e. the zero
CA 0220~309 1997-06-02
,
U'093/~1~7~ ~'CT/~9Z/U55
-14-
flow offset value of the meter) based upon a number of no
flow at measurements taken during meter calibration, a
feature of my inventive meter is to use that value in
subsequently compensating actual flow measurements only
if the noise content of these no flow ~t measurements is
sufficiently low, otherwise that value is ignored. The
number of no flow ~t measurements is governed by any of
three factors: (a) whenever the standard deviation of
these measurements falls below a convergence limit, (b)
whenever a user manually terminates the mechanical zero
process, or (c) if a pre-defined maximum number of such
measurements has been taken.
BRIEF DESCRIPTION OF THE DRAWINGS
The teachings of the present invention may be
clearly understood by considering the following detailed
description in conjunction with the accompanying
drawings, in which:
FIG. l is an overall diagram of Coriolis mass
flow rate metering system S;
FIG. 2 depicts a high level block diagram of
well known meter electronics 20 shown in FIG. l;
FIG. 3 shows the correct alignment of the
drawing sheets for FIGs. 3A and 3B;
FIGs. 3A and 3B collectively depict a high
level block diagram of a preferred embodiment of flow
measurement circuit 30 according to my present invention;
FIG. 4 shows the correct alignment of the
drawing sheets for FIGs. 4A and 4B;
CA 02205309 1997-06-02
WO93/01473 PCT/~'S92/OS~
-15-
FIGs. 4A and 4B collectively depict a timing
diagram of the operations performed by channel pairs A-C
and B-C in flow measurement circuit 30 shown in FIGs. 3A
and 3B;
s
FIG. 5 depicts a state table of circuit 70 that
. is contained within flow measurement circuit 30 shown in
FIGs. 3A and 3B;
FIG. 6 shows the correct alignment of the
drawing sheets for FIGs. 6A and 6B;
FIGs. 6A and 6B collectively depict a
simplified flowchart of Flow Measurement Basic Main Loop
IS 600 that is executed by microprocessor 80 that is
contained within flow measurement circuit 30 shown in
FIGs. 3A and 3B;
FIG. 7 shows the correct alignment of the
drawing sheets for FIGs. 7A and 7B;
FIGs. 7A and 7B collectively depict a flowchart
of Zero Determination Routine 700 that is executed as
part of Main Loop 600 shown in FIGs. 6A and 6B;
2S
FIG. 8 shows the correct alignment of the
drawing sheets for FI~s. 8A and 8B;
FIGs. 8A and 8B collectively depict a flowchart
of Mechanical Zero Routine 800 that is executed as part
of Zero Determination Routine 700 shown in FIGs. 7A and
7B;
FIG. 9 diagrammatically shows the zeroing
3s operations that occur for each corresponding range in the
standard deviation, i.e. ~t~ ~f the measured ~t values
that are obtained during a mechanical zero process;
CA 0220~309 1997-06-02
W093/0l~73 ~CTt~lS92/~55
-16-
FIG. 10 diagrammatically shows the ranges of
acceptable and non-acceptable mechanical zero values; and
S FIG. 11 shows a flowchart of RTD Temperature
Processing Routine 1100 which is executed on a periodic
interrupt basis by microprocessor 80 that is contained
within inventive flow measurement circuit 30 shown in
FIGs. 3A and 3B.
To facilitate understanding, identical
reference numerals have been used, where appropriate, to
designate identical elements that are common to the
figures.
DETAI LED DESCRI PTION
After reading the following description, those
skilled in the art will readily appreciate that my
inventive technique can be incorporated within a wide
variety of circuitry that measures multiple inputs using
multiple analog input channels. Advantageously, use of
my invention substantially, if not totally, eliminates
errors that might otherwise arise from performance
differences occurring among the individual channels and
attributable to, for example, temperature, aging and/or
other phenomena that differently affect the analog
circuitry contained therein. Of course, such usage would
include any Coriolis meter regardless of whether that
meter is measuring flow, flow rate, density or other
parameter(s) of a process fluid. Nevertheless, for
purposes of brevity, my inventive input circuit will be
discussed in the context of a dual conduit (tube)
Coriolis meter that specifically measures mass flow rate
and totalized mass flow.
CA 0220~309 1997-06-02
W093/~1473 PCT/US92tO55
-17-
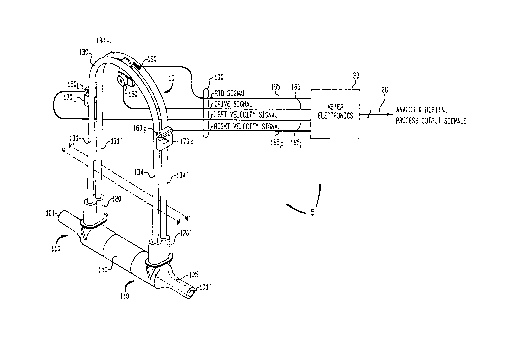
FIG. 1 shows an overall diagram of Coriolis
mass flow metering system 5.
As shown, system 5 consists of two basic
s components: Coriolis meter assembly 10 and meter
electronics 20. Meter assembly 10 measures the mass flow
rate of a desired process fluid. Meter electronics 20,
connected to meter assembly 10 via leads 100,
illustratively provides mass flow rate and totalized mass
flow information. ~ass flow rate information is provided
over leads 26 in frequency form and in scaled pulse form.
In addition, mass flow rate information is also provided
in analog 4-20 mA form over leads 26 for easy connection
to downstream process control and/or measurement
equipment.
Coriolis meter assembly 10, as shown, includes
a pair of manifolds 110 and 110'; tubular member 150; a
pair of parallel flow conduits (tubes) 130 and 130';
drive mechanism 180; a pair of velocity sensing coils
160L and 160R; and a pair of permanent magnets 170L and
170R. Conduits 130 and 130' are substantially U-shaped
and have their ends attached to conduit mounting blocks
120 and 120', which are, in turn, secured to respective
manifolds 110 and 110'. Both flow conduits are free of
pressure sensitive joints.
With the side legs of conduits 130 and 130'
fixedly attached to conduit mounting blocks 120 and 120'
and these blocks, in turn, fixedly attached to manifolds
110 and 110', as shown in FIG. 1, a continuous closed
fluid path is provided through Coriolis meter assembly
10. Specifically, when meter 10 is connected, via inlet
end 101 and outlet end 101', into a conduit system (not
shown~ which carries the process fluid that is being
measured, fluid enters the meter through an orifice in
inlet end 101 of manifold 110 and is conducted through a
CA 0220~309 1997-06-02
~'O9~/0147~ 1'CT/~IS92/055
-18-
passageway therein having a gradually changing cross-
section to conduit mounting block 120. There, the fluid
is divided and routed through flow conduits 130 and 130'.
Upon exiting flow conduits 130 and 130', the process
S fluid is recombined in a single stream within conduit
mounting block 120' and is thereafter routed to manifold
llO'. Within manifold llO', the flùid flows through a
passageway having a similar gradually changing
cross-section to that of manifold 110 -- as shown by
dotted lines 105 -- to an orifice in outlet end 101'. At
end 101', the fluid reenters the conduit system. Tubular
member 150 does not conduct any fluid. Instead, this
member serves to axially align manifolds 110 and 110' and
maintain the spacing therebetween by a pre-determined
lS amount so that these manifolds will readily receive
mounting blocks 120 and 120' and flow conduits 130 and
130'.
U-shaped flow conduits 130 and 130' are
selected and appropriately mounted to the conduit
mounting blocks so as to have substantially the same
moments of inertia and spring constants about bending
axes W-W and W'-W', respectively. These bending axes are
perpendicularly oriented to the side legs of the U-shaped
flow conduits and are located near respective conduit
mounting blocks 120 and 120'. The U-shaped flow conduits
extend outwardly from the mounting blocks in an
essentially parallel fashion and have substantially equal
moments of inertia and equal spring constants about their
respective bending axes. Inasmuch as the spring constant
of the conduits changes with temperature, resistive
temperature detector (RTD) 190 (typically a platinum RTD
device) is mounted to one of the flow conduits, here
conduit 130', to continuously measure the temperature of
the conduit. The temperature of the conduit and hence
the voltage appearing across the RTD, for a given current
passing therethrough, will be governed by the temperature
CA 0220~309 1997-06-02
,
~o93/nl473 PCT/US92/05~
--19--
of the fluid passing through the flow conduit. The
temperature dependent voltage appearing across the RTD is
used, in a well known method, by meter electronics 20 to
appropriately compensate the value of the spring constant
S for any changes in conduit temperature. The RTD is
connected to meter electronics 20 by lead l9S.
Both of these flow conduits are driven,
typically sinusoidally, in opposite directions about
their respective bending axes and at essentially their
common resonant frequency. In this manner, both flow
conduits will vibrate in the same manner as do the tines
of a tuning fork. Drive mechanism 180 supplies the
oscillatory driving forces to conduits 130 and 130'.
lS This drive mechanism can consist of any one of many well
known arrangements, such as a magnet mounted to
illustratively flow conduit 130' and an opposing coil
mounted to illustratively flow conduit 130 and through
which an alternating current is passed, for sinusoidally
vibrating both flow conduits at a common frequency. A
suitable drive signal is applied by meter electronics 20,
via lead 185, to drive mechanism 180.
With fluid flowing through both conduits while
these conduits are driven in opposing directions,
Coriolis forces will be generated along adjacent side
legs of each of flow conduits 130 and 130' but in
opposite directions, i.e. the Coriolis force generated in
side leg 131 will oppose that generated in side leg 131'.
This phenomenon occurs because although the fluid flows
through the flow conduits in essentially the same
parallel direction, the angular velocity vectors for the
oscillating (vibrating) flow conduits are situated in
opposite though essentially parallel directions.
Accordingly and as a result of the Coriolis forces,
during one-half of the oscillation cycle of both flow
conduits, side legs 131 and 131' will be twisted closer
CA 0220~309 1997-06-02
~ 93/0 1 47~ 1 / U~ ~/U~
--20--
together than the minimum distance occurring between
these legs produced by just the oscillatory movement of
the conduits generated by drive mechanism 180. During
the next half-cycle, the generated Coriolis forces will
s twist side legs 131 and 131' further apart than the
maximum distance occurring between these legs produced by
just the oscillatory movement of the conduits generated
by drive mechanism 180.
I0 During oscillation of the flow conduits, the
adjacent side legs, which are forced closer together than
their counterpart side legs, will reach the end point of
their travel, where their velocity crosses zero, before
their counterparts do. The time interval (also referred
to herein as the inter-channel phase difference, or time
difference or simply "~t" value) which elapses from the
instant one pair of adjacent side legs reaches their end
point of travel to the instant the counterpart pair of
side legs, i.e. those forced further apart, reach their
respective end point is substantially proportional to the
mass flow rate of the fluid flowing through meter
assembly 10. The reader is referred to United States
Patent 4,491,025 (issued to J. E. Smith et al on January
1, 1985) for a more detailed discussion of the principles
of operation of parallel path Coriolis flow meters than
that just presented.
To measure the time interval, Vt, coils 160L
and 160R are attached to either one of conduits 130 and
130' near their free ends and permanent magnets 170L and
170R are also attached near the free ends.of the other
one of the conduits. Magnets 170L and 170R are disposed
so as to have coils 160L and 160R located in the volume
of space that surrounds the respective permanent magnets
and in which the magnetic flux fields are essentially
uniform. With this configuration, the electrical signal
outputs generated by coils 160L and 160R provide a
CA 0220~309 1997-06-02
wn 93/0l~73 PCT/~S92/0~5
-21-
velocity profile of the complete travel of the conduits
and can be processed, through any one of a number of well
known methods, to determine the time interval and, in
turn, the mass flow rate of the fluid passing through the
meter. In particular, coils 160L and 160R produce the
left and right velocity signals that appear on leads 165L
and 165R, respectively. As such, coils 160L and 160R and
corresponding magnets 170L and 170R respectively form the
left and right velocity sensors. While at its face Vt
is obtained through a time difference measurement, Vt is
in actuality a phase measurement. Using a time
difference measurement here provides an accurate way to
measure a manifestation of the phase difference that
occurs between the left and right velocity sensor
signals.
As noted, meter electronics 20 accepts as input
the RTD signal appearing on lead 195, and the left and
right velocity signals appearing on leads 165L and 165R,
respectively. Meter electronics 20 also produces, as
noted, the drive signal appearing on lead 185. Leads
165L, 16SR, 185 and 195 are collectively referred to as
leads lO0. The meter electronics processes both the left
and right velocity signals and the RTD signal to
determine the mass flow rate and totalized mass flow of
the fluid passing through meter assembly lO. This mass
flow rate is provided by meter electronics 20 on
associated lines within leads 26 in analog 4-20 mA form.
Mass flow rate information is also provided in frequency
form (typically with a maximum range of o-1o KHz) over an
appropriate line within leads 26 for connection to
downstream equipment.
A block diagram of meter electronics 20, as
known in the art, is depicted in ~IG. 2. Here, as shown,
meter electronics 20 consists of flow measurement circuit
23, flow tube drive circuit 27 and display 29.
CA 0220~309 1997-06-02
~Y(.) Y;~ 4 1~ /U~
--22--
Flow tube drive circuit 27, depicted in FIG. 2,
provides an appropriate repetitive alternating or pulsed
drive signal, via lead 185, to drive mechanism 180. This
s circuit synchronizes the drive signal to the left
velocity signal which appears on leads 165L and 25. In
operation, circuit 27 maintains both flow tubes in
opposing sinusoidal vibratory motion at a fundamental
resonant frequency. As is known in the art, this
frequency is governed by a number of factors, including
various characteristics of the tubes themselves and the
density of the process fluid flowing therethrough. Since
circuit 27 is very well known in the art and its specific
implementation does not form any part of the present
invention, this circuit will not be discussed in any
further detail herein. In this regard, the reader is
illustratively referred to United States patents
5,009,109 (issued to P. Kalotay et al on April 23, 1991);
4,934,196 (issued to P. Romano on June 19, 1990) and
4,876,879 (issued to J. Ruesch on October 31, 1989) --
all of which are owned by the present assignee hereof and
describe different embodiments for the flow tube drive
circuit.
Flow measurement circuit 23 processes the left
and right velocity signals appearing over leads 165L and
165R, respectively, along with the RTD signal appearing
on lead 195, in a wel~ known manner, to determine the
mass flow rate and totalized mass flow of the process
fluid passing through meter assembly 10. The resulting
mass flow rate information is provided as a 4-20 mA
output signal over lead 263, for easy connection to
additional downstream process control equipment (not
shown), and as a scaled frequency signal over lead 262
3s for easy connection to a remote totalizer (also not
shown). The signals appearing on leads 262 and 263 form
part of the process signals that collectively appear on
CA 0220~309 1997-06-02
U'093/0l473 PCT/~S92/055
-23-
leads 26 shown in FIG. 1. Other leads (not specifically
shown) within leads 26 provide totalized flow
information, as well as other process parameters, in
digital form for connection to suitable display,
S telemetry and/or downstream processing equipment.
Inasmuch as the method through which flow
measurement circuit 23 generates mass flow and totalized
flow rate information is well known to those skilled in
lo the art, only that portion of its constituent electronics
that are germane to the present invention will be
discussed hereinafter. In this regard, measurement
circuit 23 contains two separate input channels: left
channel 202 and right channel 212. Each channel contains
an integrator and two zero crossing detectors. Within
both channels, the left and right velocity signals are
applied to respective integrators 206 and 216, each of
which effectively forms a low pass filter. The resulting
outputs of these integrators are applied to zero crossing
detectors (effectively comparators) 208 and 218, each of
which generates a level changes whenever the
corresponding integrated velocity signal exceeds a
voltage window defined by a small predefined positive and
negative voltage level, e.g. +v. The outputs of both
zero crossing detectors 208 and 218 are fed as control
signals to counter 220 in order to measure a timing
- interval, in terms of clock pulse counts, that occurs
between corresponding changes in these outputs. This
interval is the well known ~t value and varies with the
mass flow rate of the process fluid. The resulting ~t
value, in counts, is applied, in parallel, as input data
to processing circuitry 235. In addition, RTD 190 is
connected to an input of RTD input circuit 224 which
~ supplies a constant drive current to the RTD, linearizes
the voltage that appears across the RTD and converts this
voltage using voltage/frequency (V/F) converter 226 into
a stream of pulses that has a scaled frequency which
CA 0220~309 1997-06-02
~,093/01~7~ ~T/~S92/0
-24-
varies proportionally with any changes in RTD voltage.
The resulting pulse stream produced by circuit 224 is
applied as an input to counter 228 which periodically
counts the stream and produces a value, in counts, that
is proportional to the measured temperature. The
contents of counter 228 are also applied in parallel as
input data to processing circuit 235. Processing
circuit 235, which is typically a microprocessor based
system, determines the current mass flow rate from the
digitized ~t and temperature values applied thereto. In
this regard, the digitized temperature value is used to
modify a meter factor value based upon the current
temperature of the flow tubes and, by doing so, account
for changes in flow tube elasticity with temperature.
The meter factor, as modified, (i.e. a temperature
compensated meter factor -- RF) is then subsequently used
to proportionally determine the mass flow rate from the
current measured ~t value. Having determined the mass
flow rate, circuitry 235 then updates totalized mass flow
and also provides, for example, suitable mass flow rate
output signals over leads 26 for connection to local
display 29 and/or to downstream process control
equipment.
It is now become apparent that the analog
circuitry contained within the left and right channels
disadvantageously injects some error into the resulting
mass flow and mass f~ow rate values produced by
processing circuitry 235. Specifically, not only does
each input channel often possess a different amount of
internal phase delay with respect to t~e other, a~
measured from the input of an integrator to an output of
its zero crossing detectors, but also the phase delay
that is internally produced by each channel is
temperature dependent and often varies differently from
one channel to the other with corresponding changes in
temperature. As such, left channel 202 may, for example,
CA 02205309 1997-06-02
V 3~/u14~ '/ US92/05584
-25-
exhibit phase delay that has a different temperature
dependent variation than that exhibited by right
channel 212. This variability results in a temperature
induced inter-channel phase difference that manifests
S itself as an error component in the measured ~t value.
Because the ~t value that results from actual flow itself
through the meter is relatively small, this error
component can, in certain instances, be significant.
This error is generally not taken into account in
currently available Coriolis mass flow rate meters. In
certain situations, particularly where the meter is
situated in an outdoors environment and subjected to wide
temperature fluctuations, this error can impart a
noticeable temperature dependent error into mass flow
rate measurements, thereby corrupting these measurements
somewhat.
Now, apart from temperature dependent errors in
the measured ~t value, the temperature measurement
circuitry itself imparts an additional source of
temperature induced measurement error into the mass flow
and flow rate values produced by processing circuitry
235. In this regard, V/F converter 226 contained within
RTD input circuit 224 exhibits, as do nearly all such
converters, measurable temperature drift. This drift,
based upon the magnitude of a change in ambient
temperature, may lead to an error, amounting to as much
as several degrees, in the measurement of the flow
conduit temperature. This error will, in turn, lead to
errors in the modified meter factor which, in turn, will
also corrupt the mass flow rate and totalized mass flow
values.
To eliminate the deficiencies associated with
Coriolis meters known in the art and particularly those
containing circuitry typified by flow measurement
circuit 23, I have developed a technique for use in the
CA 0220~309 1997-06-02
~'093/0147
-26-
flow measurement circuit of a Coriolis meter that
advantageously renders the mass flow and mass flow rate
values produced by the meter substantially insensitive to
temperature changes thereby improving their overall
s accuracy.
Specifically, in accordance with the teachings
of my present invention, the two identical input channels
(i.e. left and right), as commonly used in prior art flow
measurement circuits, are replaced with two pairs of
input channels (i.e. pairs A-C and B-C) that permit the
phase delay exhibited by each channel pair to be
measured. Once the current value of the phase delay is
known for each channel pair, that value is subsequently
used to correct flow based at values subsequently
measured by that channel pair. Since each of the channel
pairs is operated to cycle, on a relatively short period,
between measuring its own internal phase delay, i.e. a
"zeroing" mode, and measuring ~t values for actual flow
conditions, i.e. a "measurement" mode, the current phase
delay value accurately reflects any temperature induced
changes then occurring in the performance of each channel
pair. Because the ~t flow based measurements provided by
each channel pair are corrected for the current internal
phase delay associated with that particular pair, these
at values do not contain any appreciable temperature
induced error components regardless of the ambient
temperature of the meter and its variation. As such, a
Coriolis meter constructed in accordance with my
invention, can advantageously be used in environments
with widely varying temperatures with essentially no
diminution in accuracy owing to temperature changes.
In particular, my inventive flow measurement
circuit utilizes three separate similar input channels
(i.e. channels A, B and C) through which inter-channel
phase difference measurements are successively and
CA 0220~309 1997-06-02
PCr/l~'S92/055
-27-
alternately taken for each of two pairs, i.e. pairs A-C
and B-C, of the three channels. Channel pair A-C
contains channels A and C; while channel pair B-C
contains channels B and C. Channel C serves as a
reference channel and is continuously supplied with one
of the two velocity waveform sensor signals, and
specifically for purposes of the preferred embodiment the
left velocity sensor signal, as its input signal. The
input to channels A and B is either the left or right
lo velocity sensor signals. While both the zero and
measurement modes involve measuring the inter-channel
phase difference in a pair of channels, the principal
distinction between the modes is that in the ~ero mode,
the same, i.e. left, velocity sensor signal is applied to
both channels in that pair so that the resulting
inter-channel phase difference measurement provides a
measurement of the internal phase delay for that pair;
while, in the measurement mode, the left and right
velocity signals are applied to different corresponding
channels in that pair so as to provide a measurement,
though uncorrected, of the current flow based at value
for subsequent use in determining current mass flow and
flow rate values. Though inter-channel phase difference
(at) measurements are taken during both modes, to
simplify matters and avoid confusion, ~ will distinguish
between these values in terms of their occurrence. Thus,
I will henceforth refer to those phase-measurements which
occur during the zero mode as being inter-channel phase
difference measurements and those which occur during the
zero mode as being ~t values. Also, both the
inter-channel phase difference measurements and the at
values for any channel pair will be collectively and
hereinafter referred to as timing measurements.
.
Specifically, for any channel pair operating in
the zero mode, such as pair A-C, the same, i.e. left,
velocity sensor signal is applied to the inputs of both
CA 0220~309 1997-06-02
PCT/US92/~55
-28-
channels in that pair. Inter-channel phase difference
measurements are then successively and repetitively taken
during a so-called "zeroing" interval with the results
being averaged during this interval. Ideally, if both of
s the channels in this pair exhibit the same internal phase
delay, i.e. the phase delay through channel A equals that
of reference channel C, then the resulting inter-channel
phase difference measurements will all equal zero.
However, in actuality, at any instant, all three channels
lo usually possess different internal phase delays.
Nevertheless, since the phase delay for each pair is
measured with respect to the same reference channel, i.e.
channel C, any differences in the phase delay between the
two pairs is caused by differences in the internal phase
delay occurring between channels A and B. Once the
"zeroing" interval has terminated, the input to the
non-reference channel in that pair is switched to the
other velocity sensor signal, i.e. the right velocity
sensor signal. A finite period of time, i.e. including a
so-called "switching" interval, is then allowed to expire
before that channel pair is operated in the "measurement"
mode during which flow based ~t values are measured. The
switching interval is sufficiently long to enable all
resulting switching transients to settle out, e.g. for
their amplitude to decay below a pre-defined level.
While one pair of channels, e.g. A-C, is
operating in its zero mode, the other pair, e.g. B-C, is
operating in its measurement mode. For any channel pair,
each successive measured flow based ~t value that is
obtained during its measurement mode is compensated by,
typically subtracting, the most recent value of the
internal phase delay that has been measured for this
channel pair during its preceding zero mode.
The time during which one channel pair operates
in the measurement mode, i.e. the measuring interval,
CA 0220~309 1997-06-02
~Os3/nl473 PCl't~'S92/05
-29-
equals the entire time that the other pair operates in
the zero mode. This latter time (i.e. the "zero"
interval) includes the time (i.e. the "switching"
interval) during which the latter channel switches its
non-reference channel input from the right to the left
velocity sensor signal, then performs zeroing (during a
so-called "zeroing" interval), and finally switches its
non-reference channel input from the left back to the
right velocity sensor signal. Note that the zero
interval includes both two switching intervals and a
zeroing interval.
At the conclusion of the measurement interval,
the channel pairs simply switch modes, with
illustratively channel pair B-C initially switching its
non-reference channel input from the right to the left
velocity sensor signal, and channel pair A-C commencing
flow based ~t measurements. Once this input switching is
complete, channel pair B-C then undertakes zeroing
followed by channel switching in the opposite direction
-- while channel pair A-C remains in the measurement
mode, and so on for successive cycles of operation.
After a channel pair has completed the latter switching
operation but before commencing its operation in the
measurement mode, that channel can, if desired, undertake
measurements of flow based at values for a finite period
of time, hereinafter.referred to as the "active"
interval, which, to-simplify implementation, has a
duration equal to the "zeroing" interval. Since both
channels can simultaneously provide flow based ~t values
during the "active" interval from both velocity sensor
signals, then, ideally, in the absence of any noise,
isolated perturbations or differences between the
internal phase delays associated with the pairs of
channels, the same ~t values should be produced by both
channels. ~ence, as an added check, one or more of the
measured flow based ~t values obtained from each channel
CA 0220~309 1997-06-02
WO93/01~7~ 1'CT/US92/U55
-30-
pair during the "active" interval can be compensated by
the most recent value of the measured phase delay for
that pair to yield corresponding pairs of corrected ~t
values. The two values in each such pair could then be
S compared against each other. A sufficient discrepancy
between the values in any of these pairs would generally
signify an error condition.
Inasmuch as channel switching only occurs on
the channel pair opposite from that which is being used
to provide flow based measurements, any switching
transients (and noise associated therewith) are
effectively isolated from and advantageously do not
corrupt the flow and flow rate measurements. Moreover,
lS by allowing an appropriately long switching interval to
expire even before zeroing begins, the switching
transients advantageously do not affect the internal
phase delay measurements for the channel pair being
zeroed. As such, the performance of a Coriolis meter
that utilizes my invention is substantially, if not
totally, immune from input switching transients and the
like.
The specific length of time of the switching
and zeroing intervals is not critical. However, since
switching transients die out rather quickly and
additional averaging generally provides increased
accuracy for the internal phase delay measurements, the
switching interval is typically set to be much shorter
than the zeroing interval. In this regard, the switching
interval, as measured in tube cycles, may last for
illustratively 16-32 such cycles, while the zeroing
interval may be set to consume upwards of illustratively
2048 such cycles.
Furthermore, in accordance with my inventive
teachings, temperature induced errors in the temperature
CA 0220~309 1997-06-02
WO93/01473 1'~ 'S92/0~5
-3l-
measurement of the flow tube provided through the RTD,
and specifically associated with temperature drift in the
V/F converter, are also advantageously eliminated.
Specifically, to eliminate these errors, two reference
s voltages in addition to the RTD voltage are selectively
and successively converted through the V/F converter into
frequency values, in terms of counts, and are then used
to define a linear relationship, specifically a
proportionality factor, that relates the counted
frequency value to measured flow tube temperature. Then,
by simply multiplying the counted frequency value for the
RTD voltage by this factor, a value for the corresponding
measured flow tube temperature results. Inasmuch as the
reference voltages do not appreciably change, if at all,
with temperature variations and are each repetitively
converted through the V/F converter at a relatively short
periodicity, on the order of illustratively .8 seconds,
any temperature drift produced by the V/F is accurately
reflected in the resulting counted frequency values for
the reference voltages themselves. Since temperature
drift equally affects the counted values for both
reference voltages and the RTD voltage, but does not
change the relationships thereamong, the proportionality
factor when multiplied by the counted frequency value for
the RTD voltage produces a true temperature value that is
substantially independent of any temperature drift
produced by the V/F converter. By eliminating
temperature induced errors in the measured temperature,
the meter factor will be appropriately modified in a
manner that accurately reflects changes in flow tube
temperature.
A. Hardware Description
With this description in mind, a high level
block diagram of a preferred embodiment of inventive flow
measurement circuit 30 is collectively depicted in FIGs.
CA 0220~309 1997-06-02
W093/Ot47~ PCT/~S92/05
-32-
3A and 3B, for which the correct alignment of the drawing
sheets for these figures is shown in FIG. 3.
In essence, flow measurement circuit 30
contains an input multiplexor and three similar input
channels -- one of which is reference channel C, a finite
state machine with associated timing counters, and a
microcomputer system. The inputs to the two
non-reference channels A and B are selected, through the
multiplexor, by the finite state machine, as it cycles
through its various states. The outputs from the three
channels are applied to the counters in order to generate
the timing measurements, i.e. the inter-channel phase
difference measurements and the ~t values, for each of
the two channel pairs A-C and B-C. The timing
measurements provided by these counters along with the
state information from the finite state machine are
supplied to the microcomputer which, in turn, determines
current corresponding values of mass flow rate. In
addition, the RTD output and two reference voltages are
sequentially converted into corresponding frequency
values, through an appropriate input switch, V/F
converter and associated circuitry, and counted through a
timing counter associated with the finite state machine.
The resulting counts therefor are then supplied by this
counter to the microcomputer for its use in properly
modifying the meter factor.
Specifically, as depicted, flow measurement
circuit 30 contains three similar input channels 44, 54
and 64, also respectively referred to herein as Channels
A, C and B. in addition, this flow measurement circuit
also contains multiplexor 31, circuit 70, analog switch
35, reference voltage generator 39, RTD input circuit 42,
microcomputer 80, output circuitry 90 and input
circuitry 95.
CA 0220~309 1997-06-02
~'093/01~7~ ~Cr/~'S92/05
-33-
RTD input circuit 42, shown in FIGs. 3A and 3B,
performs the same functions and contains essentially the
same circuitry as RTD input circuit 224 shown in FIGs. 2A
and 2B and discussed above.
S
Each of channels A and B, of which channel A is
illustrative, contains input analog circuitry, which is
simply represented as an amplifier connected to a level
detector. With respect to channel A, amplifier 46
provides appropriate input filtering of the left velocity
sensor signal, level shifting and amplification of the
resulting shifted signal. Level detectors 48,
effectively a windowing comparator, provides a level
change on its output signal whenever the output signal
produced by amplifier 46 increases above or decreases
~elow a small fixed positive and negative voltage. In
this regard, each of these channels provides essentially
the same functions as corresponding circuitry in flow
measurement circuit 23 shown in FIG. 2. Channel C shown
in FIGs. 3A and 3B contains circuitry represented by
amplifier 56 and level detector 58. Reference channel C
is ~uite similar to channels A and B with the exception
that level detector 58 contains a single level detector,
rather than a windowing comparator, to detect whenever
the output signal from amplifier 56 exceeds a small
positive voltage level. Multiplexor 31, which is
illustratively formed of three separate 2-to-1
multiplexors selectively routes either the left velocity
sensor signal appearing on lead 165L or the right
velocity sensor signal appearing on lead 165R to the
input of each of the three channels. In this regard, the
left and right velocity sensor signals are applied to the
first (Ao~ Bo and C0) and second (Al, B1 and B1) inputs,
respectively, of multiplexor 31. The status of select
signals S0, Sl and S2 specifies whether the right or left
velocity sensor signal is applied to the three separate
(OA~ OB, and ~C) outputs of the multiplexor. Select
CA 0220~309 1997-06-02
~'093/01473 ~CT/US9'/~5
-34-
signals 33, formed of signals RPO_A and RP0 B connected
to select inputs S0 and Sl, cause the multiplexor to
separately route either the left or right velocity sensor
signals as the inputs to channels A and B, respectively;
5 while grounded select signal S2 causes multiplexor 31 to
continuously route the left velocity sensor signal
appearing on lead 165L to the input of reference channel
C. Select signals 33 are set by control logic 72 in
circuit 70 to perform appropriate input switching.
Circuit 70 contains control logic 72 and timing
counters 74, 76 and 78. Circuit 70, preferably formed of
a single application specific integrated circuit, is
essentially a finite state machine that def~nes a
periodic and repetitively occurring sequence of timing
intervals and accompanying states. During each such
timing interval, externally applied input signals can
start and stop an appropriate timing counter. At the
conclusion of that interval, the contents of that timing
counter can be read in parallel form for subsequent use.
As this circuit applies to flow measurement circuit 30,
timing counters 74 and 76,~grouped together as counters
75, are used to determine the timing measurements for
channel pairs A-C and B-C, respectively. Timing counter
78 is used to count the frequency value produced by RTD
input circuit 42 for a selected analog input signal
applied thereto through switch 35. This counter is reset
by control logic 72 prior to each conversion interval by
applying an appropriate signal being applied to lead 79.
Control logic 72 is formed of well known combinatorial
and other logic. After having been initialized with the
duration, in tube cycles, of the zeroing and switching
intervals, the control logic generates select signals
over leads 33 to operate multiplexor 31 to select and
3s route the proper waveform sensor signals to the inputs of
either channel A or B, as appropriate, such that the
channel pairs are repetitively and oppositely cycled
CA 0220~309 1997-06-02
PCT/~'S92/0
-35-
through their zero and measurement modes. In addition,
control loqic 72 also generates appropriate control
signals which, when applied via leads 77 and 79, properly
reset counters 76 and 74 for each timing interval. In
addition, the control logic generates, on leads 34,
appropriate select signals to the control input (C) of
analog switch 35. These select signals cause the switch
to route a particular one of its input voltages, namely
the RTD voltage appearing on lead 195 or one of two
lo re~erence voltages (vrefl or Vref2 which are
illustratively 1.9 and zero volts, respectively) to an
input of RTD input circuit 41 for subsequent conversion
by V/F converter 41 situated therein. Reference voltage
vrefl is supplied, via lead 38, from reference voltage
generator 39 which itself contains a well known highly
stable voltage source that exhibits negligible drift with
temperature variations. As will be discussed hereinbelow
and particularly with reference to RTD Temperature
Processing Routine 1100 (discussed in conjunction with
FIG. 11), the V/F converter is operated to perform a
conversion every .1 seconds with each of eight analog
voltages (of which only those three that are relevant to
the present invention being specifically shown and
discussed herein) applied to the inputs (Io, I1 and I2
for the three voltages shown) of analog switch 35 being
selected, on a time staggered basis, once every .8
seconds for conversion into a corresponding fre~uency
value. Control logic 72 specifies which one of the input
voltages to analog switch 35 is to be selected at any one
time. The states of circuit 70 are described in
considerable detail below in conjunction with state
table 400 and timing diagram 500 which are respectively
shown in FIGs. 4 and 5.
As circuit 70 cycles through its different
states -- of which there are eight in total, this circuit
writes the value of its current state into an internal
CA 0220~309 1997-06-02
~'093/0147~ 1)CT/~'S92/~5
-36-
register (not shown) which, when accessed by
microcomputer 80, applies this value onto leads 85. The
microcomputer then reads this value which, in turn,
permits it to appropriately process the counted values
provided by counters 75 and 78, via corresponding
internal registers (not shown) and leads 87 and 88.
Leads 87 supply raw timing measurements, designated
RAW_RATE_A and RAW_RATE_B, to microcomputer 80 for
channel pairs A-C and B-C, respectively. Depending upon
the mode in which each channel pair is operating,
RAW_RATE A and RAW_RATE B will each provide, in terms of
counts, a single inter-channel phase difference
measurement or a single at value for each channel pair.
Leads 88 provide the microcomputer with the counted
frequency measurement data for the RTD and reference
voltages. In addition, logic 72 also writes a value into
another internal register (not specifically shown) which
specifies which analog voltage is then being selected by
analog switch 35 for conversion by RTD input circuit 42.
This value is also read, via leads 85, by microcomputer
80.
Furthermore, the microcomputer applies
appropriate signals onto leads 84 to control the overall
operation of circuit 70. The microcomputer also provides
appropriate address signals, via leads 82, to designate
to control logic 72 a specific internal register from
which the microcomputer is to read data or into which it
will write data.
The microcomputer is also connected, via leads
9l and 93, to respectively well known output circuitry 90
which provides a number of standard outputs (such as
illustratively a display interface(s), communication
ports, 4-20mA output lead 263 and scaled frequency output
lead 262) over leads 26, and to well known input
circuitry 95 which provides the meter with interfaces to
CA 0220~309 1997-06-02
PCT/~Ss2/0
-37-
a number of well known input devices (such as switches,
user keypads, communication ports and the like).
Microcomputer 80 utilizes any one of many well
s known commercially available microprocessors (not
specifically shown) along with sufficient random access
memory (RAM) 83 for data storage and sufficient read only
memory (ROM) 86 for program and constant storage.
Inasmuch as this program utilizes an event-driven task
architecture, a database is implemented within the
microcomputer to facilitate easy transfer and sharing of
measured and calculated data among the various tasks.
Based upon its input information, specifically the timing
measurements, containing the inter-channel phase
IS difference measurements and ~t values for each pair of
channels, and the counted frequency data along with the
state information -- all of which are supplied by circuit
70, microcomputer 80 appropriately corrects the measured
~t values produced by each channel pair to account for
the measured internal phase delay therefor, determines an
accurate temperature compensated meter factor and
thereafter, using the corrected at values and this
factor, determines the current mass flow and mass flow
rate values -- all of which is discussed in greater
detail below in conjunction with Flow Measurement Basic
Main Loop 600 shown in FIGs. 6A and 6B, Zero
Determination Routine 700 shown in FIGs. 7A and 7B,
Mechanical Zero Routine 800 shown in FIGs. 8A and 8B, and
RTD Temperature Processing Routine 1100 shown in FIG. 11.
To provide a thorough understanding of the
interactions between circuit 70 and microcomputer 80,
this discussion will now address timing diagram 400 and
state table 500 shown in FIGs. 4A, 4B and 5 which
35 collectively detail the functions provided by circuit 70
and their temporal relationship. To facilitate
CA 0220~309 1997-06-02
PCT/~!S92/055
-38-
understanding, the reader should simultaneously refer to
FIGs. 4A, 4B and 5 throughout the following discussion.
Timing diagram 400 shown in FIGs. 4A and 4B
s defines the normal sequential modal operations for each
of the channel pairs and the temporal relationships
therebetween.
As described above, each of the channel pairs,
A-C and B-C, operates in either a measurement mode or a
zero mode. While one channel pair operates in the
measurement mode, the other operates in the zero mode
with these operations reversing at the end of these
modes. The duration of each of these modes (the "modal"
interval) is always the same, i.e. time "t". In this
regard, zero mode 410 for channel pair A-C and
measurement mode 420 for channel pair B-C simultaneously
operate, as do measurement mode 440 and zero mode 450,
zero mode 470 and measurement mode 480 for channel pairs
A-C and B-C, respectively. Arrows 430, 460 and 490
signify mode reversal between the channel pairs at the
conclusion of three successive modal intervals.
Channel C is continuously supplied with the
left (L) velocity sensor signal and serves as the
reference channel with respect to which the internal
phase delay of each of the other two channels is
continually measured. However, the input signals applied
to non-reference channels A and B are switched, depending
upon the mode of corresponding channel pair A-C and B-C,
between the left and right (R) velocity sensor signals
with phase difference measurements being taken for each
different input configuration to yield inter-channel
phase difference measurements or at values for each pair.
In particular, while a channel pair operates in
the measurement mode, the non-reference channel in that
CA 0220~309 1997-06-02
WO93/0147~ PCT/US92/05
-39-
pair, e.g. channel A for pair A-C, is supplied with the
right velocity sensor signal and measurements are made of
the inter-channel phase difference occurring for that
pair. These measurements provide raw flow based ~t
S values. These measurements occur throughout the entire
time "t" that the channel exists in the measurement mode.
During this time, these measurements are provided to the
microcomputer for subsequent processing into
corresponding mass flow rate values.
By contrast, four separate functions are
performed in the following sequence for any channel pair,
e.g. pair B-C, during its zero mode: (a) switching the
input for the non-reference channel in that pair from the
right to the left velocity sensor signal during the
switching interval, (b) providing measurements of the
internal phase delay for that channel pair (i.e.
"zeroing") during the zeroing interval, (c) switching the
non-reference channel input back to the right velocity
sensor signal again during a switching interval, and (d)
permitting that pair to be "active" for a zeroing
interval during which measurements of flow based ~t
values can be made. Since the opposite channel pair,
e.g. pair A-C, will be actively measuring flow based ~t
values during its measurement interval while channel pair
B-C is active, both channels are able to concurrently
provide flow based ~t values for the same velocity sensor
- signals during this "active" interval. If additional
error checking is needed, the microcomputer can process
the measurements provided by the "active" channel pair
and compare the resulting corrected ~t values against
those being provided using the other channel pair. A
sufficient discrepancy therebetween would generally
- indicate an error condition.
As illustratively shown in FIGs. 4A and 4B,
each switching interval is 16 tube cycles in duration,
CA 0220~309 1997-06-02
~'0 93/0l47~ ;'JZ/U55
--40--
while each zeroing interval occurs over 2048 successive
tube cycles. Accordingly, time "t" formed of two
interleaved switching and zeroing intervals occurs for
4128 tube cycles. During meter initialization,
5 microcomputer 80, shown in FIGs. 3A and 3B, loads the
durations, in terms of tube cycles, of the switching and
zeroing intervals into circuit 70 and specifically
control logic 72 therein.
As shown in state table 500 depicted in FIG. 5
for circuit 70, this circuit, in normal operation,
continuously cycles through eight states in sequence,
illustratively designated as states 26, 46, 26, 66, 6A,
6C, 6A and 6E -- of which two states, i.e. states 26 and
15 6A, are repeated.
Each of these states exists for a fixed
duration, either the switching interval or the zeroing
interval. During all eight states, the left velocity
20 sensor signal is continuously applied to the input of
reference channel C.
For the first four states (states 26, 46, 26
and 66), channel pair A-C operates in the measurement
25 mode (hereinafter referred to as the channel A
measurement mode) while channel pair B-C concurrently
operates in its zero mode (hereinafter referred to as the
Channel B zero mode). Throughout the channel A
measurement mode, circuit 70 generates a low level on
30 multiplexor select signal RPO_A such that the right
velocity sensor signal is continuously applied to the
input of channel A. During this mode, as indicated by
the letter "X", channel pair A-C provides flow based ~t
values and hence serves as the measuring channel pair.
35 In addition, at the beginning of state 26, circuit 70
commences the beginning of the channel B zero mode by
initially applying a high level to multiplexor select
.
CA 0220~309 1997-06-02
,
W093/01473 ~'CT/~S92/055
-41-
signal RPO B in order to first switch the channel B input
from the right to the left velocity sensor signal. This
commences Channel B Switching state 26 during which
channel pair B-C undertakes no measurements but merely
s affords an adequate period of time, i.e. switching
interval tSW, for all switching transients and similar
perturbations on channel B to settle out. Once this
state is completed, circuit 70 invokes Channel Pair B-C
Zeroing state 46. During state 46, which lasts for
zeroing interval tZERo, inter-channel phase difference
measurements are continually made by circuit 70 for
channel pair B-C. These measurements are read and
averaged by the microprocessor to yield a measurement, in
counts, of the internal phase delay for that channel
pair. At the conclusion of the zeroing interval, Channel
B Switching state 26 re-occurs to switch the input of
channel B from the left velocity sensor signal back to
the right velocity sensor signal. To do so, circuit 70
generates a low level on multiplexor select signal RPO_B.
Again, this state, during which no measurements are made
on channel pair B-C, remains in existence for the
switching interval in order to allow all switching
transients and the like on channel B to settle out. At
the conclusion of state 26, Both Channels Active state 66
occurs for a zeroing interval during which both channels
are "active" and flow based ~t measurements can be made,
if desired, through channel pair B-C in addition to those
measurements simultaneously occurring through channel
pair A-C. At the conclusion of state 66, states 6A, 6C,
6A and 6E occur in sequence which merely provide the same
operations but on the opposite channel pairs. All the
states then repeat in seriatim, and so on.
B. Software Description
With the above understanding in mind, the
discussion will now address various aspects of the
CA 0220~309 1997-06-02
.
4-7~ l'Cr/~S92/055
-42-
software executed by microcomputer 80 shown in FIGs. 3A
and 3B. Inasmuch as the microcomputer performs a number
of well known administrative and control functions which
are not relevant to the present invention -- such as
s providing a database manager and an appropriate operating
system environment for a task based application program,
then, to simplify the following discussion, all of these
functions and the accompanying software therefor have
been omitted herefrom.
FIGs. 6A and 6B collectively depict a
simplified flowchart of Flow Measurement Basic Main Loop
600; the correct alignment of the drawing sheets for
these figures is shown in FIG. 6. This routine provides
the basic flow measurement functions.
Upon entry into routine 600, execution proceeds
to block 610 which reads current raw phase difference
measurement data (RAW_RATE A and RAW RATE_B) and state
information from circuit 70. Depending upon the current
- mode of each channel pair, RAW_RATE_A and RAW_RATE_B will
each provide, in counts, either a single interchannel
phase difference measurement or a single ~t value. After
block 610 executes, block 620 is executed. This block
executes Zero Determination Routine 700 which, in
response to the raw phase difference measurements and
state information and as discussed in detail below,
processes the phase difference data for the channel pair
that is currently operating in the measurement mode as a
flow based at value and processes the phase difference
data for the other channel pair as an inter-channel phase
difference measurement. This measurement is used by this
routine to determine the electronic zero value for that
latter channel pair. The electronic zero consists of two
values, namely the internal phase delay, expressed in the
same counts as ~t, associated with each of the two
channel pairs. Thereafter, routine 700 determines the
CA 0220~309 1997-06-02
W093/01473 ~'CT/~'S92/05
-43-
mechanical zero for the Coriolis meter. The mechanical
zero is an offset value in the at measurements that is
obtained, as described below, during a zero flow
condition occurring during meter calibration. After
S these operations are completed, routine 700 then corrects
the current ~t value measured for the channel pair
operating in the measurement mode by the mechanical zero
for the meter and by the most current electronic zero
value for that pair -- this electronic zero value having
been previously determined while that pair was last
operating in its zero mode.
After routine 700 has fully executed, execution
proceeds from block 620 to 630. The latter block, when
executed, filters the corrected ~t value produced by
block 620 through a double pole software filter to remove
noise and the like thereby yielding a current filtered ~t
value. Execution next proceeds to block 640 which
calculates the current volumetric and mass flow rates
using the current filtered ~t value and the temperature
corrected rate factor. This temperature factor is
updated on a periodic basis through RTD Temperature
Processing Routine 1100 which, as described in detail
below, executes on an interrupt basis.
Upon completion of block 640, block 650 is
executed. This latter block tests the volumetric and
mass flow rate values against corresponding low flow
(cutoff) limit conditions and, if these conditions are
met, temporarily sets the volumetric and mass f low rates
to zero. Thereafter, execution proceeds to block 660
which, when executed, stores the current volumetric and
mass flow values in the database for subsequent use, such
as for periodic updating of the displays, totalized flow
readings and/or meter outputs. Execution then loops back
to routine 610 and so on.
CA 0220~309 1997-06-02
,
PCI /US92/05~8
-44-
A flowchart of Zero Determination Routine 700
is collectively depicted in FIGs. 7A and 7B for which the
correct alignment of the drawing sheets is shown in FIG.
7. This routine contains four separate sections:
Electronic Zero Determination Routine 710, Electronic
Zero Compensation Routine 760, Mechanical Zero
Determination Routine 780, and Mechanical Zero
Compensation Routine 790. As generally discussed above,
routine 700, specifically through routine 710, determines
the current flow based at value for the channel pair
currently operating in the measurement mode and
determines the current electronic zero value for the
other channel pair operating in its zero mode. Routine
760 compensates each current measured ~t value from the
channel pair operating in the measurement mode by the
most recent electronic zero value for that channel.
Routine 780 determines the mechanical zero for the meter.
Finally, routine 790 corrects the flow based ~t value for
the current channel pair operating in its measurement
mode by the mechanical zero value for the meter.
Specifically, upon entry into routine 700 and
specifically into routine 710, execution first proceeds
to decision block 703. This block determines whether the
value of variable STATE indicates that channel pair A-C
is zeroing, i.e. the state of circuit 70 is given by the
value "6C" (see FIG. 5). This value is provided by
circuit 70 upon inquiry by microprocessor 80 (see FIGs.
3A and 3B). In the event that this state is now
occurring, then execution proceeds, via the YES path
emanating from decision block 703 as shown in FIGs. 7A
and 7B, to block 706. This latter block, when executed,
updates the value of a totalized rate variable
(TOTAL RATE) with the current value of RAW_RATE_A. As
will be seen at the conclusion of the zeroing interval,
this totalized rate value is set equal to zero. Next,
block 709 is executed to set the state of a temporary
CA 0220~309 1997-06-02
~0 93tO1473 PCr/~'S92/05~8
--45--
flag (TEMP_STATE) to a value (ZEROING CHANNEL A) that
signifies that channel pair A-C is presently undergoing
zeroing. Once this occurs, execution proceeds to block
712 to merely increment the value of a loop counter
S (COUNTER) by one. Execution then proceeds to decision
block 730. Alternatively, in the event that the current
value of variable STATE indicates that channel pair A-C
is not zeroing, then execution proceeds, via the NO path
emanating from decision block 703, to decision block 715.
10 The latter decision block tests the state of the
temporary flag to determine if zeroing has just
terminated for channel pair A-C, i.e. whether the value
of this flag still equals ZEROING_CHANNEL A. In the
event that zeroing has just terminated for this channel
15 pair, then decision block 715 routes execution, via its
YES path, to block 718. This latter block, when
executed, calculates the electronic zero value for
channel pair A-C, i.e. ELECT_ZERO_A, as a simple average
value of the separate measurements that have been
20 totalized, specifically the value of the variable
TOTAL_RATE divided by the contents of loop counter
COUNTER. Once this has occurred, execution proceeds to
block 721 which sets the value of the temporary flag to
another value, here NOT_ZEROING_CHANNEI,_A, that signifies
25 that channel pair A-C is not undergoing zeroing.
Thereafter, execution proceeds to block 724 which merely
resets the values of both the loop counter and the
totalized rate variable to zero. Execution then proceeds
to decision block 730. Alternatively, execution also
30 proceeds to this decision block, via the NO path
emanating from decision block 715, in the event that
channel pair A-C has not been and has not just completed
zeroing.
Blocks 730 through 751 provide the same
operations as do blocks 703-724 but for determining the
value of the electronic zero for channel pair B-C, i.e.
CA 0220~309 1997-06-02
,
W093/01~7~ ~CT/~'S92/05
-46-
ELECT_ZERO B. Specifically, decision block 730
determines whether the value of variable STATE indicates
that channel pair B-C is zeroing, i.e. the state of
circuit 70 is given by the value "46" (see FIG. 5). In
the event that this state is now occurring, then
execution proceeds, via the YES path emanating from
decision block 730 as shown in FIGs. 7A and 7B, to
block 733. This latter block, when executed, updates the
value of the totalized rate variable, TOTAL_RATE, with
the current value of RAW RATE_B. As will be seen at the
conclusion of this zeroing interval, this totalized rate
value is set equal to zero. Next, block 736 is executed
to set the state of the temporary flag, TEMP STATE, to a
value (ZEROING_CHANNEL_B) that signifies that channel
pair B-C is presently undergoing zeroing. Once this
occurs, execution proceeds to block 739 to merely
increment the value of the loop counter, COUNTER, by one.
Execution then proceeds to routine 760. Alternatively,
in the event that the current value of variable STATE
indicates that channel pair B-C is not zeroing, then
execution proceeds, via the NO path emanating from
decision block 730, to decision block 742. The latter
decision block tests the state of the temporary flag to
determine if zeroing has just terminated for channel
pair B-C, i.e. whether the value of this flag still
equals ZEROING_CHANNEL_B. In the event that zeroing has
just terminated for this channel pair, then decision
block 742 routes execution, via its YES path, to block
745. This latter block, when executed, calculates the
electronic zero value for channel pair B-C, i.e.
ELECT_ZERO_B, as a simple average value of the separate
measurements that have been totalized, specifically the
value of the variable TOTAL_RATE divided by the contents
of loop counter COUNTER. Once this has occurred,
execution proceeds to block 748 which sets the value of
the temporary flag to another value, here
NOT_~EROING_CHANNEL_B, that signifies that channel
CA 0220~309 1997-06-02
~'093/01~3 I'CTt~S92/05
-47-
pair B-C is not undergoing zeroing. Thereafter,
execution proceeds to block 751 which merely resets the
values of both the loop counter and the totalized rate
variable to zero. Execution then proceeds to routine
s 760. Alternatively, execution also proceeds to this
routine in the event that channel pair B-C has not been
and has not just completed zeroing, i.e. via the N0 path
emanating from decision block 742. At this point,
routine 7lO has completed execution. Inasmuch as one of
the channel pairs is operating in its zero mode at any
one time, then the current value of the corresponding
variable ELECT ZER0 A or E~ECT ZER0 B is being determined
at that time with the appropriate steps, as described
above, being executed therefor.
Electronic Zero Compensation Routine 760 merely
corrects (compensates) the current at measurement by the
electronic zero value for the particular channel pair
that produced that measurement. Specifically, upon entry
into this routine, execution proceeds to decision block
763 which, based upon whether channel pair B-C or channel
pair A-C is currently operating in its measurement mode,
respectively routes execution to block 767 or 769. In
the event that execution is routed to block 767, then,
this block, when executed, subtracts the electronic zero
value for channel pair B-C from RAW_RATE_B and stores the
result in variable ~t. Alternately, if execution is
routed to block 769, then, this block, when executed
subtracts the electronic zero value for channel pair A_C
from RAW_RATE_A and stores the result in variable ~t.
After either block 767 or 769 has executed, execution
proceeds to Mechanical Zero Determination Routine 780.
Routine 780 determines the current value
3s mechanical zero value for the meter. Specifically, upon
entering routine 780, execution proceeds to decision
block 781. This block, when executed, determines if a
CA 0220~309 1997-06-02
~'O93/0147~ ~CT/~'S9~/05
-48-
current mechanical zero value is to be found. As noted
above, a mechanical zero is determined under no flow
conditions during meter calibration. If meter
calibration is currently being performed and if a user
s indicates that no flow is occurring by depressing an
appropriate pushbutton on the meter electronics, then
decision block 781 routes execution, via its YES path, to
block 784. This latter block executes Mechanical Zero
Routine 800, as discussed in detail below, to determine
the current mechanical zero value (MECH_ZERO) for the
meter. Once this value has been determined, execution
proceeds to Mechanical Zero Compensation Routine 790.
Execution also proceeds to routine 790, via the NO path
emanating from decision block 781, in the event that
meter calibration is not occurring or if it is that the
user has not specified that no flow is occurring.
Mechanical Zero Routine 790 contains block 792,
which, when executed, merely subtracts the current
mechanical zero value, MEC~ ZERO, from the value of
~ariable at with the result being a corrected at
measurement which will be subsequently filtered and used
by main loop 600 (specifically blocks 630 and 640 therein
as shown in FIGs. 6A and 6B) to determine the current
value for mass flow rate. Once block 792 has executed,
execution exits from routines 790 and 700, as shown in
FIGs. 7A and 7B, and returns to Flow Measurement Basic
Main Loop 600.
To simplify the software, routine 700 does not
include appropriate software for determining
corresponding corrected at values for both channel pairs
during each "active" interval and, as discussed above,
comparing the results to detect sufficient discrepancies
therebetween and system errors associated therewith.
Routine 700 can be readily modified by any one skilled in
the art to include this software.
CA 0220~309 1997-06-02
U093/nl~7~ PCT/~S92/05
-49-
FIGs. 8A and 8B collectively depict a flowchart
of Mechanical Zero Routine 800; the correct alignment of
the drawing sheets for this figures is shown in FIG. 8.
As discussed above, routine 800 determines the current
value for the mechanical zero of the meter. In essence
and as discussed above, the current value of this zero is
determined by first calculating the standard deviation,
~t, ~f the ~t values obtained for a no flow condition
during meter calibration. This standard deviation
provides a measure of the noise appearing on the at
measurements at a no flow condition. Only if the noise
is sufficiently low, i.e. the value of the standard
deviation is below a minimum threshold value, will the
most recent value for the mechanical zero be updated to
reflect its current value; otherwise, this current value
will simply be ignored. The number of measured ~t values
used in determining the standard deviation is governed by
any one of three criteria: (a) when the "running"
standard deviation decreases below a convergence limit,
(b) a user terminates the mechanical zeroing by
depressing an appropriate pushbutton, or (c) if a
pre-defined number of measured at values has been taken.
In addition, appropriate limits checks are made to ensure
that the current value of the mechanical zero lies within
pre-defined bounds prior to replacing its most recent
value with its current value.
Specifically, upon entry into routine 800,
execution proceeds to decision block 803. This block,
when executed, tests the status of a flag (ZERO STATE) to
specify whether the process of determining a mechanical
zero is currently occurring. This flag is set by
appropriate software (not shown) to commence this
process. In the event that this process is underway,
decision block 803 routes execution, via its YES path, to
block 806. This latter block, when executed, updates the
CA 0220~309 1997-06-02
.
~ ~ /US92/05584
--50--
value of a totalized variable (ZERO_TOTAL) with the
current at value. As will be seen later, this totalized
value is set equal to zero at the conclusion of the
zeroing interval. Once block 806 has executed, execution
proceeds to block 809 to increment the contents of a loop
counter, ZERO COUNT, by one. Thereafter, execution
proceeds to decision block 820. Alternatively, if a
mechanical zero value is not currently being determined,
i.e the status of the ZERO STATE flag is now not active,
then execution proceeds, via the NO path emanating from
decision block 803, to block 812. This latter block
resets the ZERO_STATE flag to the active state, sets the
values of both the ZERO_TOTAL and loop counter ZERO_COUNT
to zero, and set the value of variable, MIN_STD_DEV, to a
large predefined number (the exact value of which is not
critical as long as it is well in excess of the expected
value of the standard deviation). Thereafter, block 816
is executed to reset all the error flags that are
associated with the mechanical zero process. After this
occurs, execution proceeds to decision block 820.
. .
Decision block 820, when executed, determines
whether a minimum number of measured ~t values has
occurred to determine a mechanical zero value -- i.e.
specifically whether the current value of loop counter
ZERO_C0UNT exceeds a predefined minimum value,
MIN ZERO_COUNT which typically equals the decimal value
"100". In the event that an insufficient number of ~t
values has occurred, then execution exits from routine
800, via path 872 and N0 path 822 emanating from decision
block 820. Alternatively, if a minimum number of at
values has occurred, then decision block 820 routes
execution, via its YES path, to block 823. This latter
block, when executed, updates the standard deviation, ~,
of the ~t values that have been currently measured
thusfar for use in determining a mechanical zero value
and stores the result in variable STD_DEV. Once this
CA 0220~309 1997-06-02
U'093/01~,~ PCT/~S92/055
-51-
occurs, execution proceeds to decision block 826 which
tests the resulting standard deviation value against a
minimum value therefor. In the event that the resulting
standard deviation is less then the minimum value,
decision block 826 routes execution, via its YES path, to
block 829. This latter block calculates a temporary
current value for the mechanical zero (MECH_ZERO_TEMP) as
being an average of the totalized ~t values obtained
thusfar during the current mechanical zero process, i.e.
the value of ZERO TOTAL divided by the contents of loop
counter ZERO COUNT. Once this occurs, block 829 sets a
minimum standard deviation value equal to the current
value of the standard deviation. By doing so, the
minimum value of the standard deviation that has been
determined thusfar for this current mechanical zero
process will always be used, in the manner discussed
below, to determine whether the current value of the
mechanical zero is too noisy and hence unacceptable.
Once block 829 fully executes, execution proceeds to
decision block 832. Alternatively, execution also
proceeds to this decision block, via the NO path
emanating from decision block 826, in the event that the
current value of the standard deviation now equals or
exceeds its minimum value.
25 .
At this point, up to three separate tests are
undertaken in seriatim through decision blocks 832, 836
and 840 to determine if a sufficient number of measured
~t values has been taken to determine the current
mechanical zero value. Such measurements continue until
a sufficient number has occurred. In particular,
decision block 832 determines whether the current value
of the standard deviation is less than a convergence
limit. In this case, if the standard deviation has been
falling with successive ~t values and has falien below a
predefined limit value, then it is very unlikely that any
additional measurements will adversely impact the
CA 02205309 1997-06-02
.
93/01~7~ PCT/~S92/05
-52-
mechanical zero value. Accordingly, if the standard
deviation has decreased in this manner, than decision
block 832 routes execution, via its YES path, to decision
block 843. Alternatively, if the current value of the
standard deviation is still higher than the convergence
limit, then execution proceeds, via the N0 path emanating
from decision block 832, to decision block 836. This
latter decision block determines whether the user has
depressed a pushbutton or otherwise provided an
appropriate indication to the meter to terminate the
current mechanical zero process. In the event that the
user terminated this process, then decision block 836
routes execution, via its YES path, to decision block
843. Alternatively, if the user has not terminated the
current mechanical zero process, then decision block 836
routes execution, via its NO path, to decision block 840.
Decision block 840, when executed, determines whether a
maximum number, MAX_COUNT, of the measured ~t values has
just occurred. In the event that this maximum number of
measurements, e.g. 2000 measurements, has occurred, then
decision block 840 routes execution, via its YES path, to
decision block 843. Alternatively, if the maximum number
of such measurements has not occurred, then execution
exits from routine 800, via NO path 841 emanating from
decision block 840 and via path 872, in order to
appropriately process the next successive ~t measurement.
At this point in routine 800, a current value,
though temporary, for the mechanical zero has been
determined based upon a sufficient number of successive
at measurements. Decision blocks 843, 846 and 849 now
determine whether this mechanical zero value lies within
predefined limits, e.g. illustratively +3~sec, and
whether this mechanical zero value is relatively noise-
free. Specifically, decision block 843 determines
whether the current temporary mechanical zero value is
less than a lower limit, i.e. illustratively -3~sec. In
CA 0220~309 1997-06-02
093/0l47~ ~CT/~'S92/055
-53-
the event that this limit is negatively exceeded, then
decision block 843 routes execution, via its YES path, to
block 854. Since this signifies an error condition,
block 854, when executed, sets the value of an
s appropriate error flag, i.e. MECHANICAL ZERO TOO LOW, to
true. Alternatively, if the lower limit is not
negatively exceeded, then decision block 843 routes
execution, via its N0 path, to decision block 846. This
latter decision block determines whether the current
temporary mechanical zero value is greater than an upper
limit, i.e. illustratively +3~sec. In the event that
this limit is positively exceeded, then decision block
846 routés execution, via its N0 path, to block 859.
Since this signifies an error condition, block 859, when
executed, sets the value of an appropriate error flag,
i.e. MECHANICAL ZER0 T00 HIGH, to true. The upper and
lower +3~sec limit values were determined empirically as
being those values within which all no-flow based at
values should lie for meters that are currently
manufactured by the present assignee. Alternatively, if
neither of these limits is exceeded, then decision block
846 routes execution, via its N0 path, to decision block
851. This latter decision block determines whether the
temporary mechanical zero value is sufficiently
noise-free, i.e. whether all the successive ~t values
that are utilized to generate this value possess less
than a given variability, by comparing the present
minimum standard deviation value against a limit equal to
a preset integer multiple ("n") of, typically twice, the
convergence limit.
In this regard, the most repeatable value for
the mechanical zero tends to occur when the standard
deviation reaches its minimum value. It appears that
3s this occurs because the measured at values will be
corrupted by periodic noise, such as 60 Hz hum and its
harmonics, that beats against the sampling rate of the
CA 0220~309 1997-06-02
WO93/(~l~7~ PCr/~'S92/0
-54-
velocity sensor signals (i.e. counters 75 are read once
every tube cycle) thereby creating beat frequencies that
appear in the measured ~t values. In normal operation, I
expect that some noise of this type will always be
s present, though the amplltude of the noise will usually
vary from one installation to another. For the range of
meters manufactured by the present assignee, the velocity
signals have fundamental frequencies in the range of
30-180 Hz. The amplitude of the beat frequencies will be
lo lowest when the noise is in-phase with this sampling rate
and will increase as the noise gets progressively
out-of-phase with the sampling rate thereby leading to
increased variability and error in the measured no flow
at values. Hence, the minimum value of the standard
1~ deviation is used to determine whether the resulting
mechanical value will be too noisy. Specifically, if
decision bloc~ 851 determines that the minimum standard
deviation exceeds the limit of "n" times the convergence
limit, then the current temporary mechanical zero value
is simply too noisy and is ignored. Since this signifies
an error condition, decision block 851 routes execution,
via its YES path, to block 862. This latter block, when
executed, sets the value of an appropriate error flag,
i.e. MECHANICAL ZERO TOO NOISY, to true. Alternatively,
if the minimum standard deviation is sufficiently low,
hence indicating that the temporary mechanical zero
value, is relatively noise-free, then decision block 851
routes execution, via its NO path, to block 865. This
latter block updates the mechanical zero value,
MECH_ZERO, as being equal to the value of the temporary
mechanical zero, MECH_ZERO_TEMP. Once block 854, 859,
862 or 865 has executed, execution proceeds to block 870
which, in turn, sets the state of flag ZERO_STATE to
inactive to reflect that the mechanical zero process has
been terminated and is now not in progress. Once this
occurs, execution then exits from routine 800.
CA 02205309 1997 - 06 - 02
~'093J~1473 PCT/~'S~2/055
-55-
Having described the mechanical zero process,
FIG. 9 diagrammatically shows the associated zeroing
operations that occur for each corresponding range in the
standard deviation, ~t, that can be obtained during this
process. Specifically, whenever the value ~f ~t lies
within region 9lO and hence is less than the convergence
limit (l), zeroing immediately ~tops and the resulting
mechanical zero value is accepted. ~or any value Of ~t
lying within region 920 and hence greater than the
convergence limit but less than "n" times that limit,
zeroing continues until a maximum number, as given by the
value of variable MAX_COUNT, of at measurements has
occurred. This number, in tube cycles, defines a maximum
~ zeroing interval. For any value Of ~t that lies within
region 930 and hence exceeds "n" times the convergence
limit, zeroing immediately halts. The associated current
mechanical zero value is simply ignored in favor of its
most recent value.
FIG. lO diagrammatically shows the ranges of
acceptable and non-acceptable mechanical zero values. As
shown, erroneous mechanical zero values are those which
lie either within region 1020 and hence are negatively
greater than the negative limit of -3~sec or those which
lie within region 1030 and are positively greater than
the positive limit of +3~sec. If the mechanical zero is
- determined as having any of these values, that value is
simply ignored. Only those values for the mechanical
zero that lie within region lOlO and hence are situated
between the negative and positive limits are accepted.
FIG. ll shows a flowchart of RTD Temperature
Processing Routine llOO. As discussed above, this
routine operates on a periodic interrupt basis, every
.8 seconds, to provide a digitized flow tube temperature
value that is essentially insensitive to temperature
drift of the RTD and, using that value, calculates a
CA 0220~309 1997-06-02
~'~'1 /U~Y '/U~
-56-
current value for the temperature compensated meter
factor (RF). This value is then stored in the database
within the microcomputer for subse~uent use by routine
600 in determining a current mass flow rate value.
s
~ pon entry into routine 1100, execution
proceeds to block 1110. This block, when executed,
causes analog switch 35 to route the RTD voltage to the
input of V/F converter 41 (see FIGs. 3A and 3B) for
subsequent conversion. To specifically effectuate this,
microprocessor 80 applies suitable address and control
signals, via leads 82 and 84, to circuit 70 and
particularly to control logic 72 situated therein. These
signals, in turn, instruct that logic to apply the
lS appropriate select signals over leads 34 to the analog
switch. After this occurs and an appropriate counting
interval has elapsed, block 1110, shown in FIG. 11, reads
the contents of counter 78, shown in FIGs. 3A and 3B,
which contains a counted value proportional to the
frequency converted analog RTD voltage. Thereafter, as
shown in FIG. 11, execution proceeds to block 1120. This
block, when executed, filters the contents that have been
read from counter 78 through a two-pole software filter
and stores the resulting filtered value in temporary
variable V T0 F.
After this occurs, block 1130 is executed which
eliminates a zero offset value from the filtered value to
yield a current frequency value, CURRENT_FREQ. This zero
offset value, FREQ_AT_OV, is a non-zero filtered counted
frequency output value produced by the V/F converter with
a zero input voltage (Vref1) applied thereto.
Thereafter, block 1140 is executed to calculate a
proportionality factor, FREQ_PER_C, that specifies the
number of counts per degree C. This factor is simply
given by the difference in the filtered counted values
for two reference voltages (Vref1 and vref2 which are
CA 0220~309 1997-06-02
~093/0l473 PCT/~S92/05
-57-
illustratively ground potential and l.9V, respectively)
divided by the decimal number "380". Since the counted
frequency values for both reference voltages are obtained
essentially contemporaneously with any change in the flow
s tube temperature, then any temperature drift produced by
the V/F converter will inject an essentially equal error
component into both of these counted values. Inasmuch as
the proportionality factor is calculated using the
difference between these counted values rather than the
magnitude of either value alone, the value of the
proportionality factor will be essentially unaffected by
any shift in the counted V/F output attributable to
temperature drift. The zero offset value (FREQ AT OV)
and the filtered counted l.9V reference value
(FREQ AT l.9V) are both determined on a periodic
interrupt basis, again every .8 seconds, by another
routine not shown. This routine, which would be readily
apparent to anyone skilled in the art, causes circuit 70
to apply appropriate select signals to the analog switch
to first route on a time staggered basis either the
ground potential (Vrefl) or l.9V (vref2) to the input of
V/F converter 41, and then se~uentially count the
frequency value produced therefrom and thereafter read
and filter this value and store the filtered results.~5
once the proportionality factor has been
determined-by block 1140, execution proceeds to block
1150. This block calculates the current temperature
(TEMP) sensed by the RTD by dividing the current
fre~uency value by the proportionality factor.
Thereafter, execution proceeds to block 1160 which
calculates the temperature compensated meter factor RF
using a meter factor value and the current temperature
value. For a Coriolis meter, its meter factor is a known
3s constant that is determined empirically during
manufacture. Once this temperature compensated meter
factor is calculated, it is stored in the database for
CA 0220~309 1997-06-02
"'093/01~73 1'CT/US92/055
-58-
subsequent use in determining mass flow rate. Execution
then exits from routine 1100.
Those skilled in the art will now certainly
S realize that although both channel pairs are operated in
parallel, such that one pair is operating in its zero
mode while the other pair is operating in its measurement
mode, these channel pairs could be sequentially operated.
In this instance, an operating channel pair would
lo function in its zero and/or measurement modes while the
other channel pair remained in a standby status. The
channel pairs could then periodically switch from
operating to standby status at the conclusion of each
mode or after the operating channel pair sequentially
lS undertook both its zero and measurement modes. Since,
with sequential operation, one channel pair is always in
the standby status at any one time, then, to simplify the
circuitry, one channel pair rather than two could be used
with that one pair always operating and continuously
cycling between its measurement and zero modes. In those
instances when the one effectively operating channel pair
is undertaking its zero mode, no flow measurements would
then be being made. Accordingly, an assumption, in lieu
of actual flow measurements, would need to be made
regarding the flow that is occurring during that time.
Hence, by eliminating continuous flow measurements, the
use of effectively only one operating channel pair at any
one time in a Coriolis flow meter -- regardless of
whether the meter contains only one physical channel pair
that is cycled between its two modes or two pairs with
one such pair being inactive at any one time, may provide
flow measurements that are somewhat inaccurate. By
contrast, since my inventive flow measurement circuit 30
always has one channel pair that, during normal flow
metering operations, is actively measuring actual flow at
any time, the meter provides very accurate flow
CA 0220~309 1997-06-02
WO93/01473 PCT/US92/055
_59 _
measurements at the expense of a slight increase in
circuit complexity.
Furthermore, although an "active" interval has
been provided within the zero mode for any channel pair
during which, for example, dual flow measurements and
inter-channel pair comparisons thereof could be made,
this interval could be eliminated, if needed, with no
adverse affect on meter accuracy. In fact, doing so
lo could either be used to shorten the duration of the zero
mode by one zeroing interval (i.e. the time during which
the channel pair would otherwise operate in the "active"
interval) or lengthen the time during which that channel
pair is actually zeroing by appropriately increasing the
number of internal phase delay measurements that are to
be taken then.
Also, those skilled in the art recognize that,
although the disclosed embodiment utilizes U-shaped flow
conduits, flow conduits (tubes) of almost any size and
shape may be used as long as the conduits can be
oscillated about an axis to establish a non-inertial
frame of reference. For example, these conduits may
include but are not limited to straight tubes, S-shaped
conduits or looped conduits. Moreover, although the
meter has been shown as containing two parallel flow
tubes, embodiments having a-single flow tube or more than
two parallel flow tubes -- such as three, four or even
more -- may be used if desired.
Although a single embodiment of the invention
has been shown and described in detail herein, many other
varied embodiments that still incorporate the te~chings
of the present invention can be readily fabricated by
those skilled in the art.