Note: Descriptions are shown in the official language in which they were submitted.
CA 02210325 1997-07-10
wo 96/25091 PCT/US95ll557
METHOD AND APPARATUS FOR CALCULATING BLOOD
P~ESSURE
BACKGROUND OF TB INVENTION
SThe present invention relates to systems for measuring arterial
blood prcssu~c. In particular, the invention relates to a method and ~dlU5
for measuring arterial blood ~ S~Ul~ in a relatively continuous and non-invasive
anner.
Blood p~SSUl'~. has been typically measured by one of four basic
10 m~thods: invasive, oscillometric, ~lscu1t~tory and tonometric. The invasive
mPtho~l, otherwise known as an arterial line (A-Line), involves insertion of a
needle into the artery. A tr~n~ducer con~ ~ by a fluid column is used to
determine exact arterial l)~es~ure. With proper insLI.~ nt~tion~ systolic, mean
and tli~ctolic ~)lGS~ulc may be dl;lelll~ih~ed. This method is difficult to set up,
15 is eYpencive and involves m~lic~l risks. Set up of the invasive or A-line
method poses problems. 12~son~ncP often occurs and causes significant errors.
Also, if a blood clot forrns on the end of the c~th~ter, or the end of the catheter
is located against the arterial wall, a large error may result. To elimin~t~. orreduce these errors, the set up must be adjusted frequently. A skilled m~clic~l
20 practitioner is required to insert the needle into the artery. This contributes to
the expense of this method. Medical complications are also possible, such as
infection or nerve damage.
The other methods of measuring blood pressure are non-invasive.
The oscillometric method measures the amplitude of ~lCS5ulc oscillations in an
25 infl~tçd cuff. The cuff is placed against a coo~ldting artery of the patient and
thereafter ~lcs~ulized or infl~t~d to a predetermined amount. The cuff is then
~1çfl~t~ slowly and the ~res~ule within the cuff is continually monitolcd. As
the cuff is deflated, the ~le.~:~ulc within the cuff exhibits a pressure versus time
waveform. The waveform can be sepa.dled into two components, a decaying
30 component and an oscil1~ting component. The decaying component l~lcsenl-,
CA 02210325 1997-07-10
WO 96/25091 PCT/US95/lS579
the mean of the cuff plcsaùlc while the o~~ tin~ co,.,po"ent rcp.esellla the
cardiac cycle. The osc~ tin~ col..~ne.ll is in the form of an envelope starting
at zero when the cuff is infl~t~l to a level beyond the patient's systolic bloods~ulc and then increasing to a peak value where the mean pressure of the
S cuff is equal to the patient's mean blood p,essurc. Once the envelope increases
to a peak value, the envelope then decays as the cuff ~Icaaulc continues to
decrease.
Systolic blood p~c5aufe, mean blood ~ ,Saulc and diastolic blood
~,~ssulc values can be o~ined from the data obtained by monitoring the
10 pf"esaure within the cuff while the cuff is slowly defl~t~. The mean blood
pl~S~ value is the ~lGSsulc on the decaying mean of the cuff pl~;~aulc that
corresponds in time to the peak of the envelope. Systolic blood p~csaul~_ is
generally esli...~t~d as the p~cSaulc on the decaying mean of the cuff prior to the
peak of the envelope that co--~ ~nds in time to where the amplitude of the
15 envelope is equal to a ratio of the peak amplitude. Generally, systolic bloodprcssulc is the ~lcsaur~ on the decaying mean of the cuff prior to the peak of
the envelope where the amplitude of the envelope is 0.57 to 0.45 of the peak
amplitude. Similarly, diastolic blood presaulc is the plesaurc on the decaying
mean of the cuff after the peak of the envelope that col.~s~ollds in time to
20 where the amplitude of the envelope is equal to a ratio of the peak amplitude.
Generally, diastolic blood ~-cs .u-c is conventionally estim~t~l as the pressureon the decaying mean of the cuff after the peak where the amplitude of the
envelope is equal to 0.82 to 0.74 of the peak amplitude.
The auscultatory method also involves inflation of a cuff placed
25 around a coopcl~Ling artery of the patient. Upon inflation of the cuff, the cuff
is permitted to deflate. Systolic p~essulc is in~ t~d when Korotkoff sounds
begin to occur as the cuff is defl~t~d. Diastolic l,lcsaure is in~lic~t~ when the
Korotkoff sounds become muffled or diadp~ar. The auscultatory method can
only be used to determine systolic and diastolic l.ç~saulcs.
CA 02210325 1997-07-10
WO 96/25091 PCT/US95/15579
~ eAUse bo~h the oscillometric and the All~cultAtory metho~
require inflation of a cuff, p~ ing frequent ,lleasul~llents is ~liffi~-l1t The
frequency of ll.e~ur~ cnl is limited by the time l~ùilc;d to comfortably inflatethe cuff and the time .~qui.~d to deflate the cuff as measu.~...enls are made.
S l~u~ the cuffis inflAt~ around a relatively large area sulloul~ding the artery,
inflation and ~eflAtic)n of the cuff is unco,..ro,~ble to the patient. As a result,
the os~illom~tric and the ~ cultat~ry m~tho ls are not suitable for long periodsof le~LLi~e use.
Both the oscillometric and ~ll~llltatory methods lack accuracy and
10 con~i~tency for det~ lining systolic and ~ tolic ~ ul~ values. The
oscillometric method applies an ~I,.L~ ratio to d~ ...ine systolic and diastolicpl'~,s~ure values. As a result, the oscillometric method does not produce blood
p~ u~c values that agree with the more direct and generally more accurate
blood ~ ,S~ul~, values oblained from the A-line m~thod. Furthermore, because
the signal from the cuff is very low co-ll~ued to the mean p~ C of the cuff,
a small amount of noise can cause a large change in results and result in
inaccurate ~-leasured blood p.es~ul~ values. Similarly, the ansc~ltAtQry method
l'~Uil~,S a judgm~nt to be made as to when the KGIOIkOfr sounds start and when
they stop. This ~etection is made when the Kor~korr sound is at its very
lowest. As a result, the AuscultAtQry method is subject to inaccuracies due to
low signal-to-noise ratio.
The fourth method used to determine arterial blood lJfeS~ul'e has
been tonometry. The tonometric method typically involves a trAn~ducer
including an array of pressure sensitive elem~nt~ positioned over a superficial
artery. Hold down forces are applied to the trAn~ducer so as to flatten the wallof the underlying artery without occluding the artery. The pressure sensitive
J elem~nt~ in the array typically have at least one ~lim~onsiQn smaller than the
lumen of the underlying artery in which blood pres~ule is measured. The
trAn~duc~r is positioned such that at least one of the individual pressure sensitive
CA 02210325 1997-07-10
WO 96/25091 PCT/US95115579
P4mPnt~ is over at least a portion of the underlying artery. The output from
one of the ~lt~Ul'~ sensitive elemPnt~ is sel~P~t~Pd for moni~o,i,lg blood ~ sSU~G.
The pn,ia~ule measured by the SPl~P~t~Pd ~l~s~llle sensitive element is depen~lP-nt
upon the hold down pres~u,e used to press the tr~n~ucPr against the skin of the
S patient. These tonometric systems measure a reference ~,es~ directly from
the wrist and correlate this with arterial PIGS~U1~. However, because the ratio
of ~iei,~u,~ outside the artery to the pÇ~S~ul~ inside the artery, known as gain,
must be known and co~ , tonGlllGLIic Sy~lGlllS are not reliable. Furthermore,
if a patient moves, recalibration of the tonometric system is required because the
10 system may eYrPriencP a change in gains. Rec~l~ the accuracy of these
tonometric systems depçn~lc upon the accurate positioning of the individual
p,es~u~e sensitive PlemPnt over the underlying artery, pl~r~mPnt of the
t~n~ucP-r is critical. Consequently, pl~mPnt of the tr~n~ cer with these
tonometric systems is time-con~ming and prone to error.
The oscillometric, ~ ult~tory and tono,-,cllic methods measure
and detect blood P1GSSU1G by sensing force or displ~cPmPnt caused by blood
p~essulG pulses as the underlying artery is co~ ,essed or fl~tten~Pd. The blood
p,es~u~e is sensed by measuring forces exerted by blood pressure pulses in a
direction perpendicular to the underlying artery. However, with these methods,
20 the blood pressure pulse also exerts forces parallel to the underlying artery as
the blood pressure pulses cross the edges of the sensor which is pressed againstthe skin overlying the underlying artery of the patient. In particular, with theoscillometric and the auscultatory methods, parallel forces are exerted on the
edges or sides of the cuff. With the tonometric method, parallel forces are
25 exerted on the edges of the tr~n~uc~r. These parallel forces exerted upon thesensor by the blood p,essu,~ pulses create a pressul~ gradient across the
~r~s~ule sensitive elements. This uneven ~lcssule gradient creates at least two
dirre~ellt p-~s~u,es, one l"~s~ure at the edge of the pres~u,~ sensitive elementand a second IllC:~iUle directly beneath the l~r~,s~ul~ sensitive element. As a
CA 02210325 1997-07-lO
WO 96/25091 PCT/US95/15579
result, the oscillometric, ~ cult~ts~ry and tonometric methods produce
inaccurate and incor~ tPnt blood ples ,ur~ ~,leas.~le-n~ tc.
SUMMARY OF TH~ INVF~TION
The present invention is an improved method for dc~ll,l;nil~g
5 blood p~,S~ul~ of an artery having a pulse. As a varying p,~u~ is applied to
the artery, p~es~un, waveforms are sensed to produce sensed ~l~s ,ur~ wave~orm
data. The sensed pressure waveform data are then analyzed to derive waveform
.~...-,h-~. One or more blood ~ Ul~, values are derived based upon the
waveform p~r~m~ters.
BRIEF DESCRIPl~ON OF I~DE DR~VINGS
FIG. 1 is a pel~ i.Je view of a blood pres~ure monilolhlg
system having a sensor assembly ~loullled upon the wrist of a patient.
FIG.2is a side view of the wrist assembly of the blood pr~s~.lr~
mon;lo~;ng system of FIG. 1.
FIG. 3is an end view of the wrist assembly.
FIG. 4 is a cross-~tion~l view of the wrist assembly.
FIG. 4A is an Pyp~n~led cross-s~tion~l view of the sensor
interface along section 4A--4A of FIG. 4.
FIG. S is a top view of the wrist assembly and cylinder of the
20 system of FIG. 1.
FIG. 6is a bottom view of the wrist assembly and cylinder with
a portion removed.
FIG. 7 is an electric~l block diagram of the blood pressure
monitoring system of FIG. 1.
FIG. 8 is a front elevational view of a monitor of the blood
pressure monitoling system of FIG. 1.
FIG. 9is a graph illustrating blood pressure waveforms.
FIG. 10is a graph illustrating a curve fit from points taken from
the waveforms of FIG. 9.
WO96/2S091 CA 02210325 1997-07-10 PCT/US95/15579
FIG. 11 is a graph illustrating a u~ cted and scaled waveform
taken from the waveforms of FIG. 9.
DETAILED DESCRIPIION OF THE PREFERRED EMBODIMENTS
I. OVF~VIEW
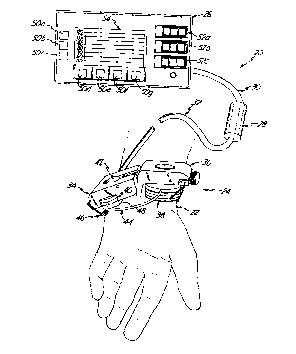
S FIG. 1 ill~ Ps blood ~lessul~ .no~ o~ g system 20 for
measuring and displaying blood ~ ur~ within an underlying ar~ry within
wrist 22 of a patient. Monilo~ g system 20 insludes wrist assembly 24,
monitor 26, cylinder 28, cable 30 and cable 32.
Wrist assembly 24 is mounted on wrist 22 for applying a varying
hold down pleS;~ul~ to an artery within wrist, and for sensing blood plcs~ule
waveforms produced in the artery. Wrist assembly 24 includes swivel mount
34, hold down assembly 36, sensor interface assembly 38, waveform l l~,s~ur~
tr~n~ducer 40, hold down ~leSSule tr~n~ cPr 42, conn~;Lion tube 44, wrist
mount 46 and wrist pad 48.
Cylinder 28, under the control of monitor 26, supplies fluid
pressure through cable 32 to wrist assembly 24 to produce the varying hold
down pl~,SSUlC. Cylinder 28 includes a movable piston which is driven by
stopper motor or linear actuator.
Electrical energization to wrist assembly 24 and l,lessure
waveform sensor signals to monitor 26 are supplied over electrical conductors
e~terlding between monitor 26 and wrist assembly through cable 30, cylinder 28
and cable 32. Drive signals to cylinder 28 are supplied from monitor 26
through electrical conductors within cable 30.
Monitor 26 receives the l.rcs~ulc; waveform sensor signals from
wrist assembly 24, digitizes the signals to produce pressure waveform data for
a plurality of beats, and ~.Ç,l--ls waveform analysis on the data. The
waveform analysis extracts a plurality of waveform p~r~meters, which
preferably include waveform shape, relative ~mrlitude and gain parameters.
From the waveform parameters, monitor 26 calculates or otherwise derives
CA 02210325 1997-07-10
WO 96/250gl PCTIUS9511SS79
blood plcS~ulc values, such as mean blood p~ ulc~ r~ tolic blood ~lGS~ul~
and systolic blood p~ ulc. Monitor 26 then displays the derived blood
p~u~e values.
As shown in FIG. 1, ~,-or,ik)l 26 incl~-des control ~wilches or
input keys 50a-SOg, digital displays 52a-52c and display screen 54. Input keys
50a-50c comprise hard keys for controlling luo~ r 32. Input keys SOd-SOg
consist of sor~w~uc pro~r~mm~hle keys which are adaptable for various
fimotionc Digit.al displays 52a-52c cQ~ lly display systolic, .ii:~Ctc)lic and
mean blood plCS~ul~, r~ ely. Display screen 54 displays the blood
0 pfeS~ure pulse waveforms and plo~ s to guide the ope.dtor.
In op~ tion~ sensor interface assembly 38 is positioned over the
radial artery. Wrist mount 46 ...~ c the position of wrist as~mbly 24
inclu(ling ~nsor interface as~mbly 38 on wrist 22. In respon~ to fluid
~CS;!iUl'~, supplied from cylinder 28 through cable 32, hold down assembly 36
15 applies force and moves sensor interface assembly 38 to vary the pl'~S~U
applied to wrist 22 above the radial artery.
As this ~JlC:i~iUrC iS varied, distinct arterial plCS~ulc waveforms are
exhibited by the blood p~CS~ulc pulse within the underlying artery. Each
waveform collc~ ds to a cardiac cycle. Each arterial pl~ iUlC waveform or
20 shape is ob~illed by sensing and m~curing ~ UI~,S exhibited by the pulse of
the underlying artery versus time during an individual cardiac cycle. Arterial
pl'eSSUl'c applied to sensor interface assembly 38 and is transferred as a fluidp~CSsulc from interface as~mbly 38 to waveform pressure tr~n~CluCer 40
through tube 44. The electrical sensor signals from tr~n~ducer 40 are supplied
25 to monitor 26 for ~ iti7~tion and analysis.
The amplitude of each sensed waveform is a function of the
applied pl'cS~ul'c applied to the artery by ~nsor interface assembly 38 and the
amplitude of the arterial pulse. The shape characteristics of at least one
waveform and other parameters derived from the sensed waveforms are used by
WO96/25091 CA 02210325 1997-07-10 PCTIUS95115579
digital signal l)roces~ g Ci~ ' of monitor 26 to dGl~l,nine systolic, mean and
diastolic preS:iUrG. The calculated pres~.l~s are displayed by displays 52a-52c
and display screen 54.
II. WRIST ASSEMBLY 24
Wrist assembly 24 is shown in further detail in FIGS. 2-6.
Swivel mount 34 and hold down assembly 36 are side-by-side, and are pivotally
co~ ~iLed by swivel joint 60. Swivel mount 34 carries tr~n~duc~rs 40 and 42
and wrist pad 48. Sensor interface assembly 38 is pivotally conl~ecled to and
is po~itione~l below hold down assembly 36. Wrist mount 46, which includes
flexible wrist band 62 and wire loops 64 and 66, is conn~t~l between an outer
end of swivel mount 34 and teeter mount 68 at an opposile outer end of hold
down assembly 36.
FIG. 2 is a side elevational view illustrating wrist assembly 24 in
greater detail. Swivel mount 34 is a U-shaped body. Swivel joint 60 is formed
by a socket 70 of swivel mount 34 and swivel ball 72 of hold down assembly
36. Socket 70 extends into a çh~nne] within the U-shaped configuration of
swivel mount 34 and is sized for receiving swivel ball 72 which projects from
an inner end wall of hold down assembly 36. The ball socket swivel joint
provided by ball 72 and socket 70 permit swivel mount 34 and hold down
assembly 36 to rotate and pivot in virtually any direction so as to better conform
to wrist 22. To aid in pivoting swivel mount 34 with respect to hold down
assembly 36, swivel mount 34 includes an arcuate or beveled lower edge 74
along its inner end. Beveled edge 74 permits hold down assembly 36 to pivot
downward so as to wrap around wrist 22 (or alternate anatomy) of a patient.
Swivel mount 34 further includes a tightening screw 76 which
extends across swivel mount 34 ~dj~cent socket 70 and ball 72. Tight~ning
screw 76 ~~ s socket 70 of swivel mount 34 to be tighten~d about ball 72 so
as to increase friction between socket 70 and ball 72 to adjust the level of force
n~ s~ry to readjust the positioning of swivel mount 34 and hold down
CA 02210325 1997-07-10
WO 96t25091 PCT/US9S115579
assembly 36. Unti~htenin~ screw 76 ~,~ ls ball 72 to be released from socket
- 70 such that hold down assembly 36 and sensor interface~ assembly 38 may be
embled from swivel mount 34.
FIG. 3 is a end elevational view of blood pl~,s;~ul'e mOni~i~lg
5 system 20 of FIG. 1, illustrating teeter mount 68 in greater detail. As shown
by FIG. 3, teeter mount 68 includes fulcrum 80 and ti~htPnin~ screw 82.
Fulcrum 80 is generally a triangular shaped ~ ,.hel having two ol,~)o~ng
slanted top surfaces. Fulcrum 80 is coupl~d to loop 66 and therehy to wrist
band 62. Fulcrum 80 teeters about hold down assembly 36 and pel,l,its loop 66
10 and wrist band 62 to be adjustably po~iti~n~ so as to better confo"., to wrist
22. Ti~hte-nin~ screw 82 eYtends ~,rvuE;I, fulcrum 80 and threadably en~es
hold down assembly 36. Ti~htenin~ screw 82 ti~ht~nc fulcrum 80 against hold
down assembly 36 so that the position of fulcrum 80 may be friction~lly set.
In FIG. 3, fulcrum 80 is shown in a middle position, and can be rotated either
15 a clockwise or coun~r~lockwise direction as nfflled.
Wrist assembly 24 stably and securely positions sensor interface
assembly 38 over the underlying artery of the patient. Swivel mount 34 may
be rotated and pivoted in practically all directions about socket 70 and ball 72.
Furthermore, teeter mount 68 ~llllils wrist band 62 to be teelcrcd or adjusted
20 so as to better conrc,llll with wrist 22 of the patient. Wrist band 62 wraps
around wrist 22 to secure sensor interface assembly 38 and wrist pad 48
Pnt wrist 22 of the patient. Re~u~e sensor interface assembly 38 is more
securely and stably positioned above the underlying artery of wrist 22, patient
movement is less likely to reposition sensor interface assembly 38. As a result,25 sensor interface assembly 38 can be reliably located over the underlying artery
so that more accurate and conci~tent blood pressure measurements may be taken.
As shown in FIG. 4, swivel mount 34 caITies waveform ~CS~ul.,
~n~ducer 40, hold down ple~:iulc tr~n.~ucer 42, and wrist pad 48. Waveform
pr~s~ulc tr~n~ucer 40 senses blood ~JlC~:~UlC waveforms from the artery which
CA 022l0325 l997-07-lO
W O96/25091 PCTAUS95115~79
-10-
is t~n~mi~t~ to tr~n~duc~-r 40 from sensor interface assembly 38 through fluid
tube 44 (FIG. 1). Hold down ~ s~ure tr~n~duc~,r 42 senses fluid IJlGS~iUl~
supplied by cylinder 28 to hold down assembly 36, and is used as a safety
feature to detect an excess hold down plGS:~UlG condition. Wrist pad 48 is
5 ~lGfeldbly adhesively secured to plate 90 at a bottom surface of swivel mount
34. Pad 48 is prcrcldbly made of a soft flexible and cc~lllplGs~ible material sothat swivel mount 34 better confolllls to the wrist of a patient. Plate 90 is
pl~felably made of a metal such as brass and is sc-cwed to swivel mount 34 by
screw 92. Conductive plate 94 is secured within swivel mount 34 and is spaced
10 from plate 90 so that tr~nsd~lc~r 40 is positioned between plates 90 and 94.
Transducer 40 preferably has a met~llic conductive surface such as brass which
contacts conductive plate 94, which is el~trir~lly grounded. As a result, brass
plate 94 electrically grounds tr~n~lcP,r 40 so as to drain static charge from
tr~n~l~cer 40.
As shown by FIG. 4, hold down pres~u.e assembly 36 inc~ludes
swivel ball 72, housing 100, diaphragm 102, ring 104, piston 106, piston rod
108, pin 110 and pin mount 112. Diaphragm 102 comprises a generally circular
sheet of flexible m~t~,ri~l such as .~info.ced rubber. Diaphragm 102 is spaced
from and cooperates with interior cavity 114 formed within housing 100 to
20 define pressure chamber 116. ~es~ulc chamber 116 extends generally above
and partially around piston 106. Pressure chamber 116 receives pressurized
fluid from cylinder 28 through fluid passage 118 such that diaphragm 102
eY~n~ls and contracts to drive piston 106 and piston rod 108 up and down. As
a result, a selected ples~u-~ may be applied to piston 106 and piston rod 108 so25 as to selectively apply a ~res~ùre to sensor interface assembly 38, which is
pivotally mounted to the lower end of piston rod 108. By varying the volume
of fluid within pressure chamber 116, blood pressure monitoring system 20
applies a varying hold down pres~ur~ to sensor interface assembly 38 and the
underlying artery.
CA 0221032F 1997-07-10
WO 96/25091 PCT/US~5115579
Diaphragm 102 is ~Jpol~d in place by ring 104. Ring 104
encircles the outer perimeter of diaphragm 102 and cal)Lules an outer perimeter
or edge portion of diaphragm 102 between ring 104 and housing 100 so as to
seal diaphragm 102 against housing 100. Ring 104 is ~r~fGl~bly adhesively
secured to housing 100 and dial)hld~,l.. 102.
Piston 106 is preferably a disk or cylinder shapGd ...~ >C. which
has its top surface p~rel~bly fixedly coupled (such as by an adhesive) to
diaphragm 102. Consequently, as fluid is supplied to r~ hel 116, the volume
of chamber 116 expands by moving piston 106 downward. Bore 120 eYt~n-lc
from top to bottom of piston 106 and is sized for receiving a portion of piston
rod 108. Piston 106mateswithpistonrod 108andexerts~lGs~ul~uponpiston
rod 108 and sensor interface assembly 38.
Piston rod 108 is coupled to piston 106 and sensor interface
assembly 38. Piston rod 108 in~ludes plug 122, flange 124, stem 126, ball 128
and pin hole 130. Plug 122 is cylindrically shaped and is press fit within bore
120 to secure piston rod 108 to piston 106. Flange 124 projects ou~w~u~ly from
plug 122 and fits within a depression formed in the bottom surface of piston
106. As a result, piston 106 presses against flange 124 of piston rod 108 to
drive piston rod 108. Alternatively, because piston rod 108 is secured to piston106 by plug 122, piston 106 lifts piston rod 108 as pressure is decreased withinpressure çh~mber 116. Stem 126 integrally extends downward from flange 124
and has a length extçnding into interface assembly 38. Ball 128 is integrally
formed at the lower end of stem 126 and is received within socket 132 of sensor
interface assembly 38. As a result, sensor interface assembly 38 pivots about
ball 128 of piston rod 108.
Pin hole 130 axially extends through piston rod 108 and is sized
for receiving pin 110. Pin 110 is fixedly secured to housing 100 by pin mount
112 and extends through housing 100 into pin hole 130. Pin 110 has a tli~met~.r
smaller than the di~mçtçr of pin hole 130 and eYten(ls into stem 126. Pin 110
WO96/25091 CA 02210325 1997-07-lO PCT/US95/15579
guides the up and down movement of piston 106 and piston rod 108 as ~ s~-lre
within pf~S~ule çl-~...bç- 116 is varied. Pin 110 prevents lateral movement of
piston 106 and piston rod 108 so that piston 106 and piston rod 108 apply only
a perpe-n-licul~r force to sensor interface assembly 38. As a result, pin 110
S ~,---iLs piston 106 and piston rod 108 to move up and down while pin 110
remains fixedly suppolled by pin mount cap 112 to housing 100. Pin 110 is
preferably made from a hard rigid material such as st~inlçss steel.
As shown by FIG. 4, hold down ~ s~ule assembly 28 further
inrl~ldes ~ ;,u~e supply passage 118, which Pytpn~s from prcs~u-e chal-lber 116
through swivel ball 72 where it connects with flexible tubes 140 and 142 (shown
in FIGS. 5 and 6). Flexible tube 140 extends through cable 32 from cylinder
28 to passage 118 in swivel ball 72. Flexible tube 142 con,lecl~ passage 118 to
tr~n~duc~r 42 in swivel mount 34. This allows tr~n~ucPr to monitor the fluid
UlC: in ~h~m~er 116. Fluid supply tube 140 applies pr~ s~u. ;7f~d fluid from
cylinder 28 into ~ uç~ ch~mber 116 to vary the pl'~,S~ùl~ within ch~.. bel 116
so as to drive piston 106 and piston rod 108.
FIGS. 4 and 4A illustrate sensor interface assembly 38 in detail.
FIG. 4 is a cross-sectional view of wrist assembly 24. FIG. 4A is an enlarged
cross-s~ticn~l view of sensor interface assembly 38, taken along section 4A--
4A of FIG. 4. Sensor interface assembly 38 includes top plate 150, upper V
mount 152, lower V mount 154, diaphragm lock 156, inner mounting ring 158,
outer mounting ring 160, side wall diaphragm 162, damping ring 164, inner
diaphragm 166 and outer diaphragm 168.
Top plate 150 is a generally flat annular platform having a central
bore 200, shoulder 202, shoulder 204, and side bore 206. Central bore 200
receives and holds lower V mount 154. Upper V mount 152 engages shoulder
202 and extends downward into bore 200 and into lower V mount 154. Rings
158 and 160 and the upper outer end of side wall diaphragm 162 are mounted
in shoulder 204.
CA 02210325 1997-07-10
WO 96/2S091 PCT/US95115579
-13-
Side bore 206 is defined within top 150 and extends through top
150 so as to be in commllnir~tion with fluid ~ age 208 defined bel~ upper
and lower V mounts 152 and 154 and belween upper V mount 152 and
diaphragm lock 156. Side bore 206 receives an end of tube 44 so that tube 44
S is in fluid commlmic~*on with fluid passage 208 and ~nsor interface çh~mber
210 (which is defined by diaphragms 166 and 168). Fluid passage 208 and tube
44 provide fluid co"""~ ir~tion between sensor interface c~ ~mber 210 and
t~n~lcPr 40 e~nL.;c to socket 132. As a result, piston rod 108 may be
pivotally conn~t~ to sensor int~lr~~ assembly 38 at a lower pivot point.
Upper V mount 152 is a fulmel shaped socket which is sized for
receiving the lower or distal end of piston rod 108. Preferably, upper V mount
152 eYten(ls through central bore 200 of top plate 150 to a location near sensorinterface cll~mber 210. Upper V mount 152 is fixedly secured to an upper
portion of top plate at shoulder 202. Upper V mount 152 is supported by top
15 plate 150 such that upper V mount 152 is spaced from lower V mount 154 to
define annular fluid passage 208. Fluid passage 208 is in fluid comm~nir~tion
with an sensor interface ch~mber 210. A fluid coupling medium fills chamber
210, passage 208 and tube 44 all the way to tr~n~luc~r 40. Upper V mount
152, which is made from a material such as nylon and forms detent 220 and
20 socket 132 for pivotally receiving a ball member 128 of piston rod 108. As a
result, sensor interface assembly 38 may be pivoted about socket 132 so as to
better conform to the anatomy of the patient. Furthermore, because socket 132
iS ~lj~r,Pnt to sensor interface chamber 210, sensor interface assembly 38 is
pivotally coupled to piston rod 108 about a low pivot point. This permits sensor25 interface assembly 38 to be stably positioned above the underlying artery. Inaddition, the low pivot point enables hold down assembly 36 to apply a more
direct, ~Inifo~ force on diaphragm 168. Thus, the hold down press.~re applied
by hold down p~essule assembly 36 is more uniformly applied to the anatomy
of the patient above the underlying artery.
CA 022l032~ lgg7-o7-lo
WO 96/25091 pcTrus95llss79
-14-
Lower V mount 154 is a generally cylindrical shaped member
including step or spar 230 and bore 232. An outer surface or perimeter of
lower V mount 154 pl~j~LS ouLwa,dly to form spar 230. Spar 230 engages the
lower surface of top plate 150 to partially Su~y~JlL side wall diaphragm 162
which is partially ca~tu~cd l~wecn top plate 150 and spar 230. In the ~lc~e~-~d
embo~iment adhesive is used bc~l~n the lower surface of top plate 150 and
spar 230 to fixedly secure the portion of side wall diaphragm 162 trapped
Lhe.cbeLwecn. Alternatively, spar 230 may be press fit against the lower surfaceof top plate 150 to secure and support side wall ~ ph~gm 162. Spar 230
further divides the outer perimeter of lower V mount 154 into two portions, an
upper portion 234 and a lower portion 236. Upper portion 234 fits within bore
200 of top plate 150. Upper portion 234 is preferably adhesively secured to top
plate 150 within bore 200. Lower portion 236 extends below spar 230. Lower
portion 236, spar 230 and side wall ~i~rh~Em 162 define expansion cavity 240.
Fxp~n~ion cavity 240 enables upper diaphragm 166 to initially change shape
while only expp-rip~n~ing a small change in volume.
Diaphragm lock 156 is a thin, elong~tP~I, annular ring including
bore 250 and lower lip 252. Bore 250 extends through diaphragm lock 156 and
with upper V mount 152, defines a portion of fluid passage 208. Lip 252
projects ouLw~ily from a lower end of diaphragm lock 156. Diaphragm lock
156 fits within bore 232 of lower V mount 154 until an inner edge of diaphragm
lock 156 is captured between inserts, lip 252 and the lower end of lower V
mount 154. Diaphragm lock 156 is preferably adhesively affixed to lower V
mount 154. Al~",a~ively, diaphragm lock 156 may be press fit within lower
25 V mount 154.
Side wall diaphragm 162, rings 158 and 160 and top plate 150
define an annular deformable çh~mber 260 coupled between top plate 150 and
ring 164. Side wall diaphragm 162 is preferably formed from a generally
circular sheet of flexible m~teri~l, such as vinyl, and is partially filled with
CA 02210325 1997-07-10
WO 96/250gl PCT/US95115579
fluid. Diaphragm 162 has a hole sized to fit around upper portion 234 of lower
V mount 154. Di~h~ 162 includes outer edge portion 162a and inner edge
portion 162b. Outer edge portion 162a is trapped and held belween outer ring
160 and top plate 150. Inner edge portion 162b is trapped and suppolLed
between top plate 150 and spar 230 of lower V mount 154. Diaphragm 162 is
made from a flexible m~tPri~l and is bulged outward when ch~l.be, 260 is
partially filled with fluid. Chamber 260 is co.l.p.~,i,sible and ~ hle in the
vertical direction so as to be able to conform to the anatol.ly of the patient
~ullounding the underlying artery. As a result, the l1i.ct~nc~ between top plate10 150 and the patient's allaLc,ly can vary around the periphery of side wall
diaphragm 162 according to the conloul of the patient's ana~o.,.y. FU1 I1IG1 ",ore,
because fluid is ~cllllilled to flow through and around chamber 260, pressure isequalized around the patient's al~al~n,y.
Damping ring 164 ~ner~lly consists of an annular co---~ s~ible
ring and is preferably formed from a foam rubber or other pulse rl~m~nin~
material such as open celled foam or closed cell foam. Ring 164 is centered
about and positioned between side wall ~ hr~m 162 and diaphragms 166 and
168. Damping ring 164 is isolated from the fluid coupling medium within
chamber 210. Rec~lse ring 164 is formed from a co,llplessible material, ring
164 absorbs and dampens forces in a direction parallel to the underlying artery
which are exerted by the blood p,es~u-e pulses on sensor interface assembly 38
as the blood pressure pulse crosses sensor interface assembly 38. Rec~
bottom ring 164 is isolated f;om the fluid coupling medium, the forces absorbed
or received by ring 164 cannot be tr~ncmitt~l to the fluid coupling medium.
Tncte~-l, these forces are tr~ncmitted across ring 164 and side wall diaphragm
162 to top plate 150. Re~ se this path is distinct and separate from the fluid
coupling medium? chamber 210 and the fluid coupling medium are isolated from
these forces. In addition, ring 164 also presses tissue surrounding the artery to
neutrali~ or offset forces exerted by the tissue.
WO 96125091 CA 0 2 2 10 3 2 5 19 9 7 - O 7 - 10 PCT/US95/15579
-16-
Upper diaphragm 166 is an annular sheet of flexible material
having an inner portion 166a, an interm~Ai~te portion 166b, an outer portion
166c and an inner ~ mP,ter sized to fit around diaphragm lock 156. Inner
portion 166a is trapped or ca~luç~d belween lip 252 of diaphragm lock 156 and
the bottom rim of lower V mount 154. Inner portion 166A is preferably
adhesively affixed beLween lip 252 and lower V mount 154.
Interm~Ai~t~ portion 166b lies bel~cen inner portion 166a and
outer portion 166c. Inle~ Ai~l~o portion 166b is ~ c~;;nt to eYp~nsion cavity
240 and is i~ t~A from ring 164 and chamber 260. Rec~l-se interm~i~tP
portion 166b is po~ition~ ~dj~t~P,nt to expansion cavity 240, interm~Ai~te portion
166b is pe"~ led to initially move upward into e~r~n~ion cavity 240 as ch~.l.bel260, ring 164 and outer sli~rhr~gm 168 conform to the anatomy of the patient
surrounding the underlying artery while the eA~,iences only a small change in
volume. As ring 164 is pressed against the anatomy of the patient ~ oullding
the artery to neutralize or offset forces exerted by the tissue, diaphragm 168 is
also compless~. However, because interm~Ai~te portion 166b is ~lllliUed to
roll into expansion cavity 240, chamber 210 does not experience a large volume
decrease and a large co"esl~onding pressure increase. Thus, sensor interface
assembly 38 pellllils greater force to be applied to the anatomy of the patient
through ring 164 to neutralize tissue surrounding the artery without causing a
corresponding large change in ~es~u~ within chamber 210 as the height of the
side wall changes. As a result, sensor interface assembly 38 achieves more
con~i~tent and accurate blood pressure measurements.
Outer diaphragm 168 is a generally circular sheet of flexible
material capable of tr~n~mitting forces from an outer surface to fluid within
chamber 210. Outer diaphragm 168 is coupled to inner diaphragm 166 and is
configured for being positioned over the anatomy of the patient above the
underlying artery. Outer diaphragm sheet 168 includes non-active portion or
skirt 168a and active portion 168b. Skirt 168a con~titut~s the area of diaphragm
CA 02210325 1997-07-lO
WO 96/25091 PCT/US95/15579
168 where inner diaphragm 166, namely outer portion 166c, is bonded to outer
diaphragm 168. Skirt 168a and outer portion 166c are generally two bonded
sheets of flexible m~teri~l, forces parallel to the underlying artery are
L,,.n~ l across skirt 168a and outer portion 166c and are da,.,~.led by the
5 colllp~cssible material of ring 164.
Active portion 168b is cQ~ .~d by the portion of outer
diaphragm sheet 168 which is not bonded to inner diaphragm 166. Active
portion 168b is positioned below and within the inner di~m~ter of ring 164.
Active portion 168b is the active area of sensor interface assembly 38 which
receives and tr~n~mit~ pulse pres~ule to tr~n~ducer 40. Active portion 168b of
diaphragm 168, interme~i~te portion 166b of diaphragm 166 and diaphragm lock
15~ define ~nsor interface cham~Der 2iû.
The coupling me~ m within c~ ~mbçr 210 may consist of any
fluid (gas or liquid) capable of Ll~nc-~ g p~c~ul'e from diaphragm 168 to
15 ~n~ cer 40. The fluid coupling m~li~lm interfaces between active portion
168b of diaphragm 168 and tr~n~ducer 40 to transmit blood l.ress-lle pulses to
tr~nsducer 40. R~llse the fluid coupling me~ium is co~ in?~ within ~nsor
interface cha"lbel 210, which is i~ol~t~d from the side wall of ~nsor interface
assembly 38, the fluid coupling m~lium does not transmit blood ples~ur~ pulses
20 parallel to the underlying artery, forces from the tissue surrounding the
underlying artery and other forces absorbed by the side wall to transducer 40.
As a result, ~nsor interface assembly 38 more accurately measures and detects
arterial blood pressure.
Sensor interface assembly 38 provides continuous external
25 measurements of blood ~rcs~ulc in an underlying artery. Re~al-ce sensor
interface as~mbly 38 senses blood l,lcs~ulc non-invasively, blood pressure is
measured at a lower cost and without medical risks. Rec~ e sensor interface
assembly 38 is relatively small coll,pa~cd to the larger cuffs used with
oscillometric and ~llsclllt~tory methods, sensor interface assembly 38 applies a
WO 96/25091 CA 0 2 2 10 3 2 5 19 9 7 - O 7 - 10 PCT/US95/15579
-18-
hold down plG~i~iUlG to only a relatively small area above the underlying arteryof the patient. Conse~luenlly, blood ~llGS~ , measurements may be taken with
less discomfort to the patient. Re~ e sensor interface assembly 38 does not
require inflation or defl~tion~ COI tinuous, more frequent measu,G,nenls may be
5 taken.
Further",~"G, sensor interface assembly 38 better conforms to the
anato",y of the patient so as to be more comfortable to the patient and so as toachieve more concictlont and accurate blood pl'~i~UlG ,n~u,~ ont~. R~--~
chamber 260 is deÇ~"Ilable and partially hlled with fluid, chamber 260 better
10 conforms to the anato,lly of the patient and equalizes p~G~ l'G applied to the
patient's ana~",y. Rer~ll~ ring 164 is co",l ,~ ssible and because diaphMgm
168 is flexible and is pe""il~ed to bow or deform inwardly, ring 164 and
diaphragm 168 also better conrulm to the anaLo",y of the patient. At the same
time, however, sensor in~lr~ce assembly 38 does not experience a large sudden
15 increase in p~ e in sensor interface chamber 210 as ring 164 and diaphragm
168 are pressed against the anatomy of the patient. ~h~mber 260 and ring 164
apply force to the analo",y of the patient to neutralize the forces exerted by
tissue surrounding the underlying artery. R~ e çh~mbçr 260 and ring 164
are both co",~,essible, the height of the side wall decreases as side wall is
20 pressed against the patient. Diaphragms 166 and 168 are also conformable.
However, because interme~ t.o portion 166b of inner diaphragm 166 is
~"llil~ed to move upward into expansion cavity 240, sensor interface chamber
210 does not experience a large volume decrease and a corresponding large
pressure increase. Thus, the side wall is able to apply a greater force to the
25 anatomy of the patient without causing a corresponding large, error producingincrease in pl~s~lfG within sensor interface chamber 210 due to the change in
height of the side wall and the change in shape of outer diaphragm 168.
At the same time, sensor interface assembly 38 permits accurate
and con~ tent calculation of blood p~ss.l,e. R~ e of the large sensing area
CA 02210325 1997-07-10
wo 96/25091 PCT/US95/15579
-19-
through which blood ~ 7:~U~C pulses may be L~ ~d to tr~n~ cer 40, sensor
interface assembly 38 is not as d~pPn~ent upon accurate positioning of active
portion 168b over the underlying artery. Thus, sensor interface assembly 38 is
more tolerant to patient movement as measurements are being taken
S Moreover, sensor interface assembly 38 achieves a zero ylG~UlC
gradient across the active face or portion 168b of the sensor, achieves a zero
1;J1GS:;U~ gradient bet veen the t~n~u~r and ~e underlying artery, ~tten~t~s
or ~ c pl'~UlC pulses that are parallel to the sensing surface of the sensor,
and neutralizes forces of the tissue su..ounding the underlying artery Sensor
10 interface assembly 38 contacts and applies force to the analo,l,y of the patient
across skirt 168a and active portion 168b However, the ~JreS~iUre within
interface ch~ ~bel 210 is ~ul~SI~Li~lly equal to the l)leS~Ul~, applied across active
portion 168b The ~ ~ ing force applied by sensor interface assembly 38
across skirt 168a which neutralizes or offsets forces exerted by the tissue
15 ~ Junding the underlying artery is transferred through the side wall (ring 164
and cha",be~ 260) to top plate 150. As a result, the geo"~L, ~r and constructionof sensor inlelr~ce assembly 38 provides the proper ratio of pressures between
skirt 168a and active portion 168b to neutralize tissue surrounding the
underlying artery and to ~;ul~e]y measure the blood l~lcs~llc of the artery
20 In ~iitiQn, because the fluid coupling ~ediul~- within sensor interface çh~mker
210 is isolated from the side wall, ~ ,S:iUl'C pulses parallel to the underlyingartery, forces from tissue surrounding the underlying artery and other forces
absorbed by the side wall are not tr~ncmitt~ through the fluid coupling medium
to tr~nsducer 40 Consequently, sensor interface assembly 38 also achieves a
25 zero prCS:iUlC gr~ienS between tr~ncdllcçr 40 and the underlying artery
FIG S is a top view of wrist assembly 24 FIG S further
illustrates portions of swivel mount 34 and cable 30 in greater detail Fluid tube
140 has one end connto~ted to passage 118 in swivel ball 72 and its other end
connect~l to cylinder 28
WO 96/25091 CA 02210325 1997 - 07 - 1 o PCTrUS95115579
-20-
Fluid tube 142 ~t~n~s ~clween tr~n~duc~r 42 and passage 118
in ball 72. Fluid tube 142 fluidly coT-n~t~ ~iea~ull charnber 116 and tr~nsducer42. As a result, tr~n~Auc~r 42 senses the pl'~ Ul~ within p~cs~ur~ cha"-bel 116.Tr~nsdl~c~r 42 produces electrical signals r~r~-,~ g the sensed hold down
pleS~UlC within ~ UlC ch~mber 116. These electrical signals are ~n~mitted
by electrical wires 280 which extend within cables 30 and 32 to monitor 26
(shown in FIG. 1). As a result",.o~ or 26 may corltinuou~ly verify that the
actual ~les~ul~ within plcs;,ulc ch~m~r 116 is within a safe range.
As further shown by FIG. 5, cable 32 additionally en~loses
10 electrical wires 290 from t~n~duce~ 40 (shown in FIG. 4). Electrical wires 290
ll~ulSIIIil electric~l signals ~pl~n~;ng blood plcs~ure amplitudes sensed by
tr~n~ducer 40. Cable 32 also encloses an electric~l grounding wire 300 which
is electrically conn~t~ through resistor 302 (FIG. 6) to brass plate 94 (shown
in FIG. 4) and which electrically grounds t~n~-lcers 40 and 42.
FIG. 6 is a bottom view of wrist assembly 24. FIG. 6 illustrates
swivel mount 34 with pad 48 and plate 90 (FIG. 4) removed. FIG. 6 illustrates
the electrical connection between ~nsduc~rs 40 and 42 and electrical wires 280
and 290, respectively. As shown by FIG. 6, swivel mount 34 contains electrical
connector 304. Electrical connector 304 receives leads 306 of tr~n~ducer 40.
20 Leads 306 transmit the electrical signals produced by tr~nsdLIcer 40 r~resenling
the p~cs~ures and transmits the electrical signals to electrical wires 290.
Electrical connector 304 further includes an electrical resistor 302 electrically
coupled to brass plate 94. Resistor 302 is further electrically coupled to
grounded electrical wire 300. As a result, static charge is drained through
25 resistor 302 through electrical connector 304 and through grounded wire 300.
Electrical connector 304 permits tr~n~ducçr 40 to be removed and separated
from swivel mount 34.
Similarly, tr~ncducPr 42 includes four electrical leads 310 which
are electrically connected to electrical wires 280. In contrast to tr~n~ducer 40,
CA 02210325 1997-07-lO
WO 96t25091 PCTlUS95llS579
however, tr~n~luc~r 42 is generally fixed and ..,ounted within swivel mount 34.
As shown by FIG. 6, swivel mount 34 electrically connects tr~nsduc~rs 40 and
42 to mc)nitor 26 by el~tri~l wires 280 and 290 carried within cables 30 and
32.
S III, MONITOR 26
FIG. 7 shows a block diagram of blood pç~s~u~e morilo.;ng
system 20. As best shown by Figure 7, ~..or.;lo~ 26 further inc1udes input signal
processor 350, analog-to~igital converter 352, mic-~locessor (and ~Ci~t~A
memory) 354, inputs SOa-SOg, cylinder drive 356, displays 52a-52c and 54, and
power supply 358. In operation, mic.~.. ,cessor 354 receives inpuLL~d signalsfrom inputs 50a-50g. Inputs SOa-SOg may also consist of a keyboard or other
input m~ch~ni~m~. Inputs SOa-SGg permit microprocessor 354 to ~lfolm a
calibration.
Microprocessor 354 controls cylinder drive 356 to vary hold
15 down pn~S~iUlC applied by hold down ples~ure assembly 36 of wrist assembly
24. Hold down ~-~,s~ure is applied to the analo-ny of the patient directly abovethe artery. The hold down pn,s~llle applied by hold down pr~SUl~, assembly 36
on sensor interface assembly 38 is increased over time. As the force or hold
down pressure applied by sensor interface assembly 38 increases, the amplitude
20 or relative p-es~u-e of the blood pres~ure pulse also increases until a maximum
amplitude results. Once the maximum amplitude or maximum energy transfer
results, the amplitude of the blood pressure pulse begins to decrease as the
artery begins to flatten out beyond the point of maximum energy transfer.
Tr~n~ducPr 40 of wrist assembly 24 senses the amplitude and
25 shape of the blood pressure pulses within the underlying artery. Tr~n~ucer 40creates electric sensor signals representing the pressures exerted by the sensedblood pressure pulses. The sensor signals are tr~n~mitt~ to input signal
processor 350 of monitor 26. Input signal ~-ucessol 350 I lucesses the sensor
signals and filters any unwanted or undesirable noise and other effects. The
WO 96/25091 CA 0 2 2 10 3 2 5 19 9 7 - O 7 - 10 PCT/US95/lS579
sensor signals are then Ll~ ~ from input signal pl~cessor 350 to analog-to-
digital convertor 352. Analog-to-digital convertor 352 converts the sensor
signal into digital form. A digital signal r~pr~ g the pl' i~UlCS of the sensed
blood pressu~e pulses is sent to micn,pr~ssor 354.
S Based upon the digital sensor signals l'~)leSt'n~ the sensed
~-es~ul~s and shape of the blood pr~s;,ur~ pulses, micl~l~ssor 354
deLellllines wave shape information by ~P~ g ~mrlitlld~P and shape versus
time of individual cardiac cycles. The arterial wave shape inro~lllaLion is
deLellllined by sampling the arterial waves at a rate ~ignific~ntly above heart rate
so that a good definition of the arterial pressure wave is measured. From wave
shape information and other parameters derived ther~fiol.., microprocessor 354
calculates systolic, diastolic and mean blood pr~ss..les.
IV. METHOD FY)R LOCATING SENSOR INTERFACE ASSEMBLY
OVER ARTERY
FIG. 8 illustrates digital displays 52a-52c and display screen 54
of monitor 26 in greater detail. As shown by FIG. 8, display screen 54 furLher
incllldes pl~s~ule scale 400, horizontal guid~lin~s 410 and digital readout 430.Monitor 26 also is used to display blood ~ ,s~.~re pulse waveforms so as to
20 guide the opeldLol- in positioning and locating sensor interface assembly 38
directly over the underlying artery having a blood pressure pulse so that more
accurate blood l,les~ule values may be determined.
To place sensor interface assembly 38 over an underlying artery,
sensor interface assembly 38 is located or positioned above a known
25 appl~,~illlate location of the underlying artery. As sensor interface assembly 38
is positioned over the underlying artery, a constant hold down pressure is
applied to sensor interface assembly 38 and to the underlying artery.
Preferably, the plc;ssul~e applied to sensor interface assembly 38 should be as
high as possible without the diastolic portion 440 of blood pressure waveforms
30 450 distorting.
CA 02210325 1997-07-10
WO 96/25091 PCT/US95115579
-23-
In response to the applied pr~.~aulG~ the underlying artery exhibits
a blood ~lG:i~iUlG pulse waveform for each cardiac cycle. Sensor interface
assembly 38 senses or receives the force exerted by the blood pfeS~ul~; pulse asthe pulse travels beneath the sensing surface and tr~n~mit~ the ~le~ul~s throughS the fluid coupling m~~ m to ~n~luc~r 40. T~ncAucP,r 40 in turn senses the
changes in pl~S~U~G and converts the plG~UlGS into electrical signals which
l~lesent the arterial prei~urG wa~erolllls. The signals are then transmitted
through cables 30 and 32 to ...o~ or 36. ~cnitor 36 samples the signals
prefGldbly at a rate of 128 samples per second. Monitor 36 then visually
10 displays the ~mplcd signals received from t~n~ cer 40 and displays the
signals r~lese~ ng arterial plea~Ul'G waveforms on display screen 54. Display
screen 54 is preferably inrlPsed so as to provide a vertical scale 400 with
horizontal guidelines 410 for displaying ~S~S~u~G. G-lidelintos 410 permit the
lll~illlUIII pres~ul~ amplitude of blood p-es~u-~ pulse waveforms at the
15 particular location and at a constant hold down pres~ure to be determined. A
e~lG~Ill,{tive series of blood ~"c~ur~ pulse waveforms 450 is illu~lldlGd on
screen 54 in FIG. 8.
To further aid the o~>erator in dele~ ."inhlg the maximum
amplitude of blood pres~u- pulse waveforms, display screen 54 further includes
20 a digital readout 430 which digitally displays the maximum pressure amplitudeexerted by the pulse in response to the hold down pressure applied to the artery.
As shown in FIG. 8, the artery exhibits P1GSSUIGS which are in the form of
blood ~rGessul~G pulse waveforms 450 when a constant hold down l)les~ùl~e of 80
mmHg is applied to the underlying artery. Blood p.es~u~ pulse waveforms 450
25 exhibit a maximum amplitude of a~,~,~imately 18 mmHg.
Once the maximum ~lCS~iUlC; amplitude exerted by the pulse at a
particular hold down pressure at the particular location is deler",in~d and noted
sensor interface assembly 38 is repositioned at a second location above the
known approximate location of the artery. The same constant hold down
WO 96/25091 CA 0 2 2 10 3 2 5 19 9 7 - O 7 - 10 PCT/US95/15579
-24-
~ S~ul~, iS applied to sensor interface assembly 38 and to the underlying artery
of wrist 22. The constant hold down p~G~urG applied to the underlying artery
is preferably as close as possible to the c~nQt~nt hold down pressure applied atthe first location as in-~ic~teA by display screcn 54. This can be done by
5 applying a hold down pressure to sensor interface assembly 38 at a constant
force equal to one of guidelines 410.
The maximum pr~s~ulc amplitude exerted by the pulse in
pon~e to the hold down ~ ule applied to the artery at the second loc~tion
can be dct~ linGd from the analog display of the blood pl~ S~U1G waveforms 450
on display screen 54 or the digital readout 430 on display screen 54. The
maximum pl~,s~ule amplitude at the second location is then noted or recorded
for co,npatison with m~Limulll ~lGs~urG ~mplitudes at other loc~tion~.
Typically, sensor interface assembly 38 will be repositio~ed at a plurality of
locations above a known approximate location of the artery while applying a
15 con~ hold down plGs~ule to the artery. At each location, the m~xim~lm
p~cs~ur~ ~mplitllde exerted by the pulse in les~llse to the constant hold down
pr~s~urc will be displayed on display screen 54 and noted. At each location, themaximum plGS~U~G amplitude in~ ted by display screen 54 is col"~cd with
maximum pressure amplitudes exerted by the pulse in response to the constant
20 hold down plcs~ul'e applied to the artery and indicated by display screen 54 at
the plurality of other locations. After the maximum pressure amplitude
collcs~nding to each of the plurality of locations are COIllpaled, sensor
interface assembly 38 and its sensing surface are positioned at the particular
location which corresponds to the location at which the largest of the maximum
25 pressure amplitudes is exerted by the pulse in response to the constant hold
down pressure applied to the artery.
V. ~TEIOD FOR DETERl~G BLOOD I~RESSURE VALUES
Once the sensor is properly positioned over the underlying artery,
blood ~lcs~ure mc"~i~c,ling system 20 determines blood ~u~es~u~ values from the
CA 02210325 1997-07-10
WO 96/25091 PCT/US95J15579
-25-
sensed waveform pressure amplitudes sensed by sensor interface assembly 38 and
from other ~ n~ , derived from the l~les~u-e amplitudes using a stored set
of coefficients. A pressure amplitude is deterrnined at each sample point.
Blood ~lCS~ monitoring system 20 calculates a systolic blood
S pressure valve (S), a mean blood ~ ule (M) and a diastolic blood ~leS~ (D)
based upon the following formulas:
M Fm ( Pl, . . ., Pn, Cl, . . ., Cn )
S - Fs (Pl, ~ ~ ~, Pn ~ Cls, ~ ~ ~ ~ Cns)
D -- Fd ( Pl, . . . Pn, Cl, . . . Cn )
wherein Fm~ Fs~ Fd are linear or non-linear functions, plm, Pl5, p~d, . . ., pnm~ Pns~
pnd are parameters derived from waveform ples~u,e amplitudes and Clm, Cls, Cld,
. . ., Cnm, CnS, Cnd are coefficients obtained during training processes based upon
10 clinical data.
In particular, blood pres~ule monitoring system 20 calculates a
systolic blood ples~e value (S), a mean blood pressure value (M), a diastolic
blood pressure value (D) based upon the following formulas:
M - ClmPlm + C2mP2m + . . . + Cn Pn
S -- Cl Pl + C2 P2 + . . . + Cn Pn
D -- Cl Pl + C2 P2 + . . . + Cn Pn
wherein Pl, Pl, Pl . . . PD ~ Pn ~ Pnd are parameters derived from waveform
15 pressure amplitudes. Such parameters may be calculated from shape
characteristics of the waveform or parameters calculated from functions such as
curves based upon relationships between particular points of several waveforms.
SUBSTITUTE SHEET (RULE 26)
WO96/25091 CA 0221032~ 1997-07-10 PCT/US9S/15579
-26-
The parameters may be further based upon hold down pressure values and time
periods between particular points on the waveforms. The value c,m, Cls, C,d .
. . Cnm, CnS, Cnd are coefficients obtained during training processes based upon clinical data.
In addition, the pulse rate (PR) may also be determined using the
formula:
PR1 + PR2 + PR3 + PR4
To determine pulse rate, four individual waveforms or beats are
sensed and are time averaged to ~let~rrnine pulse rate. Preferably, the waveforms
used to determine pulse rates include the waveform having largest maximum
10 pressure amplitude, the two waveforms prior to the waveform having the largest
m;~xi~ ple~ ue and the waveform sllrcee~linP. the waveform having the
largest m:1~;,-,ll-" pressure. Once the four waveforms are identified, the pulserate of each waveform is cletPrmin~l The sum of the pulse rate of the four
waveforms is then divided by four to calculate pulse rate PR. The pulse rate
15 (PR) for each waveform is based upon the following forrnula:
pRNbeats pel minute(N- 1,2,3,4) _ 128samples/sec X60sec/min
No . sampl es/bea t,~
FIGS. 9, 10 and 1 1 illustrate representative parameters which may
be used to calculate blood ples~ule values. FIG. 9 illustrates a sample series of
waveforms exhibited by the underlying artery as a varying pressure is applied
over time. The vertical scale indicates l,les~ule in mmHg while the horizontal
20 scale indicates individual sample points at which the blood pressure values
exerted by the pulse are measured over time. In the preferred embodiment,
tr~n~lllrlor 40 produces continuous electrical signals lep.esen~h,g waveforrn
pressures which are sampled 128 times per second.
SUBSTITUTE SHEET (RULE 26)
CA 02210325 1997-07-10
Wo 961250~1 PCr/US95115579
In the p1cf~.~;d emb~im~nt the hold down pr~s ,uLe applied by
hold down ~l~S~,ulc assembly 36 to sensor interface assembly 38 (shown in FIG.
1) is swept over a p1~ ctçd range of increasing hold down pr~ u~s.
Preferably, the sweep range of hold down p,e~ r~ is begun at approximately
20 mmHg. The hold down ~lcs~ur~ applied by hold down p~ assembly
36 is then steadily increased until two individual waveforms are sensed
following the sensed waveform having the largest pressure amplitude.
ely, once the waveform having the largest m~ximllm ~ ;5~UlC iS
sensed and identifi~l, succe~ive sweeps may sllt~ J ,1~ti~ely have a varying hold
down ~ Un~ applied until a pr~ d multiple of the mean hold down
pre~u1~ of the waveform having the largest m~i111l.,1, p~C~UI~ amplitude is
re~h~. Preferably, each sweep range estçntlc b~lwee1l the initial hold down
l)lCS~Ul'C of 20 mmHg and a final hold down pl~~ul~c of apl)ioki",~t~ly 150%
of the mean hold down ~)leS~ulc of the waveform having the largest maximum
~l~S~ulc amplitude during the previous sweep. In addition, the sweep range
may alternatively have an initial hold down ~le~ c of approximately 20 mmHg
to a final hold down ~1~s~ulc having a preselected absolute value.
Alternatively, the sweep could start at a high pl~,S~ul~ and sweep low. As a
safety measure, the ~1CSSu1c within pressu1c chamber (sensed by tr~n~cluc~r 42)
and interface ch~mber 210 (sensed by tr~ncducer 40) are continually 1llonilolcd
by msn~r 26. If the r2tio c~ the ~s~ wi~}in pressure chambsr 1 l6~d
chamber 210 fall outside of a defined range of limits, an alarm is signaled.
After each hold down plcssLIre sweep, blood pressure mo11ilc ling
system 20 begins a succes~ive new sweep to calculate new, succes~ive blood
plcs~ule values. As a result, blood p1cs~urG 1llonilo-ing system 20 continually
measures blood p~cs~urc within the underlying artery without causing discomfort
to the patient. As can be apprGciated, the sweep range of hold down IJlG~ Ure
applied by hold down plcssule assembly 36 may have various initial and final
points. Furthermore, the hold down pressure applied by hold down pressure
WO96/25091 CA 02210325 1997-07-lO PCTIUS95/15579
-28-
assembly 36 may al~l,lali-~ely be inle~"~ ently varied. For example, the hold
down plCSi:~Ul~ may be increased or decreased in a step-wise fashion.
Based upon sensed and sampled ~ ul. waveform signals or
data produced by tr~n~lucer 40 and sent to l-lo~ l 26 during each sweep of
hold down p,~ssu,~ s""onilo~ 26 derives presel~t~l parameters for calcul~ting
blood pl~i~Sul~ values from the derived p~all-et~ and a stored set of
coeffi~ient~. As indicated in FIG.9, parameters may be derived dil~Lly from
the absolute waveform ~ ùrcs which vary as hold down ~ ul~ is varied
over time. Such pa~ulleLcl ~ may be derived from the shape of the waveforms
10 including a particular waveform's slope, absolute pies~ure at a sel~tecl sample
point, a rise time to a solecte~ sample point on a waveform and the hold down
~le,;,. lCS cc"~s~nding to a particular sample point on a waveform. As can be
a~p~ l~, any of a variety of parameters may be derived from the absolute
waveform plessul~s shown in FIG.9. Parameters may further be based upon
15 particular points or functions of the sample points.
FIG. 10 illustrates an example of how values or parameters of
multiple waveforms 500 shown in FIG. 9 may be used to derive additional
parameters. FIG. 10 shows several data points 510. Each data point 510
rcprcsellts a sPle~t~ waveform taken from the sweep shown in FIG.9. Curve
20 520 is derived by fitting points 510 to a presPl~t~d function or relationship.
Parameters such as the peak 530 are then derived from curve 520. As can be
appreciated various other parameters such as slope may also be derived from
curve 520. Parameters derived from curve 520 are ultim~t-oly based upon
pressure waveforms 500 shown in FIG. 9 which are produced from sensed
25 ~.es~u.e waveform data or signals from tr~n~clucer 40. However, because curve520 is derived using a plurality of waveforms 500, parameters derived from
curve 520 r~resent the overall rel~tionchip between the plurality of waveforms
500. In other words, parameters derived from curve 520 l~-esent the way in
which the plurality of waveforms 500 (shown in FIG. 9) are related to one
CA 02210325 1997-07-10
W O 96125091 PCTrUS95115579
-29-
another. Data points 510 r~ ll collw~d, relative waveform prc~ul~s. As
can be apprec;~t~, functionc such as curves may also be derived using absolute
waveform ~l~,S~ul~ values which are shown in FIG. 9.
A waveform is "coll~led" by subtracting the hold down pressure
S from the absolute ples~u~e of the waveform to produce relative waveform
p~ Ul~S (otherwise known as arnplitudes). CollwLi-lg a waveform e~ es
characteristics of the waveform which result from a c~ntinuously increasing holddown pÇ~S~ul~ being applied to the artery during each waveform or cardiac
cycle.
FIG. 11 further ~ s~t~s otherps l~lllel~;J ~ which may be derived
from waveform ~r~ ul~ values as shown in FIG. 9. FIG. 11 illu~lates
waveform 600 SPl~t~ from waveforms 500. Waveform 600 is preferably the
waveform having the largest peak or n~xi,,,~ e~ule amplitude.
Al~l"ati~ely, waveform 600 may be any of the waveforms 500 (shown in FIG.
9) such as waveforrns imm~l;~t~ly p,~ or succ~Aing ~e waveform
having the largest maximum pr~ule. As shown in FIG. 11, waveform 600is
co"~;led such that the be.~innin_ point 602 and an ending point 604 have the
same absolute waveform p,es~u~e value. As further shown by FIG. 11,
waveform 600 is horizontally and vertically scaled to elimin~t~ gain from
parameters derived from waveform 600. P,efe,ably, waveform 600 iS scaled
from zero to twenty-one be~ -g at be~ ~;np point 602 and ending at ending
point 604 of waveform 600 on the holi~ ~l b axis. Preferably, waveform 600
is vertically scaled from zero to one begi1-l-il-_ at its base and ending at its peak.
use waveforrn 600 is hori7onti~11y and vertically scaled, parameters may be
derived from waveform 600 for calcu1~tin_ blood pressure values without the
gain of the particular patient affecting the c~lcu1~t~A blood pleSSIllc value.
~ Gains are caused by the dirrt;-el~ces between the actual p-es~ure exerted within
the artery and the pres~u,cs sensed at the surface of the wrist or anatol.ly which
is caused by varying characteristics of the interme~ te ~dssue. Scaling
WO96/25091 CA 02210325 1997-07-10 PCT/US9S/lSS79
-30-
waveform 600 e~ e~ any gains exhibited by individual p~ti~nt~c. By using
scaled values to locate col,cs~)onding points or waveform pressure amplitudes
on waveform 600, points on waveform 600 ul~irol,l,ly COll~ alJond to the same
points on waveforms exhibited by other p~ti-ontc.
As shown by FIG. 11, various p~r~m~Pters may be derived from
scaled, co.-~cled waveform 600. As shown by FIG. 11, such parameters
include widths of waveform 600 at ~Pl~te~l points along the vertical y axis,
ratios of individual waveform pl~,S~ mplitudes at Sl~PctP~ points along the
horizontal b axis and the amplitude of the waveform, the rise time or time
10 elapsed from the start of waveform 600 at point 602 to a selected point alongthe vertical y axis. In addition, several other p~r~mtot~p-rs may also be derived
from waveform 600, such as slope and other shape characteristics.
Once the paldlllCI~ :i to be used in calcul~ting blood l,-es~ule
values are ~PIect~P~I coPffiriPntc collcs~ lin~ to each parameter must be
15 delc.",ined. Coefficientc Icl)lcsell~ the relationship between a particular
parameter set and the resl-lting blood p-~ ure value to be det~."~ined from a
particular pa,~,lleler set. Coefficients are initially ascertained from clinical tests
upon p~tiPntc having known blood ~rcs~ure values. Typically, the known blood
pr~ssul~ value is de~e"llined using the A-line method which is generally
20 accurate, although diffiicult to set up, expensive and mtoAiç~lly risky. As the
blood ~les~ul~ iS determined using the A-line or other methods, sensor interfaceassembly 38 is positioned over the underlying artery of the patient. Hold down
p,es~ul~ assembly 36 applies a varying ~res~ul~ to the artery of the patient
having the known blood plessule value. As discussed above tr~n~ducer 40
25 produces sensed pressure waveform signals or data representing arterial pressure
waveforms. Monitor 26 receives the produced sensed p,es~u,e waveform data
and derives prelselected parameters from the sensed pressure waveform data.
Coeffici-ont~ are then determined using the derived values of the selected
parameters and the known blood pressure value. Each coefficient co"es~ ding
CA 02210325 1997-07-10
WO 96/2SOgl PCT/US95/15579
to each se~t~ parameter is a function of the known blood ylGs~wG values and
the derived y~ e~c~. Preferably, several p~ti~ntc are rlinir~lly tested to
asc~ in the co~-fficient~. Once obt~ined, the coeffi~i~.nt~ are stored for use in
non-invasively calcul~tin~ blood yl~5~ul~ values of other ~ti-ontc without the
~-~e~;ly of using the more time col-Cllmin~ pe~ e and risky A-line method
and without using the generally more inaccurate conventional blood plGSs~
mea~curing methol1.c. Each particular coeffi~ient is preferably asc~llained so as
to be applicable for calc~ tin~ blood pr~s~ values from the derived
waveform p~r~m~.t~rs of all p~tiPnt~ t~ ely, individn~li7Pd coefficients
may be used to r~lclll~t~ blood p~ ~ values from derived waveform
parameters of particular p~tiPntc falling within a particular age group or otherspeci~li7~cl groups. The coefficient~ are p,~elably determined for use with the
same blood l~r~s~ulc mor,iLuling system as will be used to de~ linc the
particular blood prcs~u~e value of p~ti~ntc having unknown blood ~l~ssule
values. However, as can be ~,r~ia~ed, the method of the present invention
for ascelL~nillg coefficiontc as well as the method of the present invention forde~,~llinillg blood plei,~u~e values may be used in conj~ Lion with any one of
a variety of blood ~es~ul~ moni~uling systems including different sensor
assemblies and hold down ples~ure assemblies.
In addition to illustrating various methods by which parameters
may be derived from waveform pressure data, FIGS. 9, 10 and 11 illustrate
particular parameters for use in calcul~tin~ a systolic, a mean and a diastolic
blood PreS~U1e value of a particular patient during an individual hold down
pr~s:,ul~ sweep. According to the prere~red method of the present invention,
hold down pl'eS:~Ul~: assembly 36 applies a sweeping, continuously varying hold
down pless.lre to the underlying artery. Preferably, the hold down pressure
applied by hold down ~"cssule assembly 36 during each sweep begins at 20
mmHg and ramps upward over time until at least two waveforms are ~ete~ted
by tr~n~ducer 40 after the waveform having the largest maximum pressure is
W O96/25091 CA 0221032~ 1997-07-10 PCTrUS95/15579
identified. Based upon the produced sensed pressure ~verO~lll data r~lese.,l;t-Fthe waveforms as lep.,_sen~ ely shown by FIG. 9, blood ~ L11e monitoring
system 20 calculates systolic, mean and diastolic blood pressure using a stored
set of coefficients. Systolic blood ~les~ (S) is calculated using the formula:
S Cl6Pls+C2sp2s+C3 P3 +C4 P4 +C5SPsS+C6sP6s+C7SP7S+C8sp8s+CgS
Coefficients C~s C9s are stored coefficients asce.lailled according
to the earlier described method of the present invention. C9s is an offset value.
Parameters p~s and P2s are derived from relative waveform pl~ amplitudes
corresponding to scaled values taken from a scaled and corrected beat as
lel l. sellled by waveform 600 in FIG. 11. Preferably, parameter p,s is the ratio
defined by the waveform pl.,s~u.e amplitude on waveform 600 which
collcs~onds to scale value b, along the horizontal axis divided by the m~ximum
waveform plei,~ule amplitude or peak (point 606) of waveform 600. Parameter
P25 preferably is the ratio defined by the waveform ples~ule amplitude of point
608 on waveform 600 that corresponds to scale value b3 along the horizontal b
axis divided by the m~ximum waveform ples~ule amplitude or peak (point 606)
of waveform 600.
Parameter P3siS the rise time or the time elapsed from the start of
the waveform to a particular point along waveform 600 corresponding to a
particular vertical scale value. Preferably, parameter P3s is the elapsed time from
the start of waveform 600 to a point 610 on waveform 600 which has a vertical
height of approximately 0.18 that of a maximum pressure amplitude or peak
(point 606) of waveform 600. This rise time or elapsed time is represented as
612 in FIG. 11.
Pararneter P4sis the mean pr~s~ule of the uncorrected waveform
500a (shown in FIG. 9) having the highest peak or m~ximum pressure.
Parameter P4siS indicated on FIG. 9 by point 700. Parameter P5siS the systolic
SUBSTITUTE SHEET (RUI E 26)
CA 02210325 1997-07-10
wo 96/25091 PCT/US95/15579
point of the uncorrected p.es~ule waveform immç~ tely following the
uncorrected ~lessule waveform having the largest m~ ple;,~e. Parameter
P55 iS lc~lesented by point 710 on FIG. 9.
Parameter P6s is a pararneter taken from a function such as a curve
S derived from values of a plurality of waveforrns 500 (shown in FIG. 9).
Preferably, parameter P6s is the peak ples~ e of curve 520 shown in FIG. 10.
The peak is replesenled by point 530. Curve 520 is preferably generated by
fitting the relative waveforrn ~ C arnplitude of waveforms 500 (shown in
FIG. 9) to the function or m~th~m~tical t;A~l~;. ,;on of:
AMPLITUDE - exp (ax2 + bx + c),
wherein x = the mean ~ eS~ule amplitude of each pressure waveform.
Parameter P7s is a time value l~ e~ a width of waveform
600 (replcsellted by se~m~nt 614 between points 616 and 618) which
corresponds to a selected p~lcelllage of the m~xi ~ re~ c amplitude or peak
(point 606) of waveform 600. The time elapsed between points 616 and 618 is
det~rmin~d by counting the number of samples taken by monitor 26 which lie
above points 616 and 618 on waveform 600. Preferably, parameter p,s is the
width of waveform 600 at a height of about O.9A, where A is the maximum
waveform pressure amplitude of waveform 600 (point 606).
Parameter P85 is the maximum slope of the uncorrected waveform
500c immediately following the waveform 500a having the largest maximum
pressure or peak.
The mean blood ~le~ e value (M) is calculated using the
formula:
M - ClmPlm + C2mP2m + C3mP3m + C4'nP4m + CSm
Coefficients C,m - C5m are stored coefficients ascertained according
to the earlier described method of the present invention. Coefficient C5m is an
offset. Parameters plm and P2m are derived from relative waveform pressure
SU BSTIT U TE S H EET (R U LE 26)
WO 96/2509 1 CA 0 2 2 1 0 3 2 ~ 1 9 9 7 - O 7 - 1 0 PCT/US95/15579
-34-
amplitudes coll~;~ollding to scaled values taken from the scaled and corrected
beat as re~re~en~ed by waveform 600 in FIG. 11. Preferably, parameter plm is
the ratio defined by the waveform ~l~s~u~e (point 620) on waveform 600 which
coll~s~ollds to the scale value b9 along the holi~olll~l axis divided by the
m~Ximllm waveform ~)lei~W~; amplitude or peak (point 606) of waveform 600.
Similarly, ~ eter P2m is the ratio defined by the waveform pressure on
waveform 600 which coll~s~ ds to scale value bl3 along the horizontal axis
(point 622) divided by the maximum waveforrn pressure amplitude or peak
(point 606) of waveform 600.
Parameter P3m is identical to parameter P4s used to calculate
systolic blood ple;,~ule. Parameter P4m is identical to pararneter P6s used to
calculate systolic blood pl~ e.
Diastolic blood pl~ values (D) are calculated using the
formula:
D -- C, Pl + C2 P2 + C3 P3 + C4 P4 + C5 Plj + C6d P6 + C7d P7d + C8d
Coefficients Cld - C8d are stored coefficients ascertained according
to the earlier described method of the present invention. Coefficient C8d is an
offset value. Parameter p,d iS derived from relative waveform pressure
corresponding to scaled values taken from a scaled and corrected beat as
represented by waveform 600 in FIG. 11. Preferably, parameter p~d iS a ratio
defined by the waveform pressure amplitude on waveform 600 which
corresponds to scale value b,2 along the horizontal axis (point 624) divided by
the m~ximUm waveform pressure amplitude or peak (point 606) of waveform
600.
Parameter p2d is identical to parameter P3s used to calculate the
systolic blood l le~ . Preferably, parameter p3d iS the width of segment 626
between points 628 and 630. Preferably points 626 and 628 are points along
waveform 600 that are located at a height of 0.875A, where A is the maximum
SUBS 111 UTE SHEET (RULE ~6)
CA 0221032~ 1997-07-10
WO 961250gl PCT/US95/lS579
-35-
pressure arnplitude (point 606) of waveforrn 600. The width or time of
parameter p3d iS deterrnined by counting the number of individual wavefor~n
p~es~ amplitude signals or samples generated by tr~n~ rer 40 and transmitted
to monitor 26 which lie above points 626 and 6Z8 on waveform 60Q. If points
626 and 628 fall between individual waveform pressure arnplitude signals or
sarnples~ interpolation is used to determine the time width of pararneter p3d.
Parameter p4d iS identical to pararneter P4s used to calculate
systolic blood pressure. Parameters p5d and p6d are calculated from absolute
waveform p~ ules as illustrated in FIG. 9. Preferably, parameter p5d iS the
diastolic ples~we value of the -wlcolle~;led waveform having the largest
maximurn pressure value. This diastolic value is ~ ed by point 720.
Parameter p6d is the diastolic pressure value of the uncorrected waveform
(waveform 500c) immediately following the waveforrn (waveforrn 500a) having
the largest m~X;~ "~ ple;~We arnplitude or peak. Parameter p6d is replesented
15 by point 730 on FIG. 9.
Pararneter p,d iS derived from absolute waveform ples:,w~;S
illustrated in FIG. 9. To derive parameter p,d, the slopes along the portions ofeach individual waveform 500 are deterrnined. Parameter p,d iS the hold down
pressure applied to the underlying artery that corresponds to the point on the
20 particular waveform having the maximum slope corrected amplitude. The slope
corrected amplitude of a waveform is obtained by multiplying its amplitude with
the maximum slope over all waveforrns 500 and dividing the result with the
slope corresponding to the individual waveforrn. As can be appreciated. various
alternative pararneters may also be used to calculate blood pressure values under
25 the method of the present invention.
VI. CONCLUSION
The present invention enables blood pressures of patients to be
continuously and non-inva;ively deterrnined without the complexity, cost. risks.and inaccuracies associated with the prior methods and apl,~d~llses for
SUBSTITUTE SHE~T tRULE 26)
WO 96/25091 CA 0 2 2 10 3 2 5 19 9 7 - O 7 - 10 PCT/US95115579
-3~
and inaccuracies :l~Ci~tf~d with the prior me~thtxls and ap~udlLlses for
delel.l-ining blood plCS~UlC. Wrist assembly 24 securely mounts sensor interfaceassembly 38 upon wrist 22 of the patient so that patient movement does not alterthe optimal location of sensor interface assembly 38 found. The lower pivot
S point of sensor interface assembly 38 causes pl~UI~ applied by the sidewall ofassembly 38 to the tissue above the underlying artery to be uniÇc,llll around the
~,;m~llot of the sidewall. As a result, blood ~ e monik,l;ng system 20
.s~mples more ~ ~ur~te signals l~,p~ ;..g blood pi~s~ e pulse waveforms. By
deriving parameters from the waveform data and using stored coefficients,
10 blood l~leS~Ule m~nilo~ing system con~i~tt~ntly and accurately determines blood
pressure values.
Although the present invention has been described with reference
to prerell~d embotli...e~ , workers skilled in the art will recogni7P that changes
may be made in form and detail without departing from the spirit and scope of
15 the invention. For example, although the dele~lllinaLion of pressure values based
upon waveform parameters has been described using linear equations and stored
coefficients, other m~tho~.~ using non-linear equations, look-up tables, fuzzy
logic and neural networks also can be used in accoldance with the present
invention.