Note: Descriptions are shown in the official language in which they were submitted.
CA 02229219 1998-02-23
1
METHOD AND APPARATUS FOR MEASURING POLARIZATION MODE
DISPERSION OF OPTICAL DEVICES
FIELD OF THE INVENTION
The invention relates to a method and apparatus for measuring polarization
mode
dispersion of optical devices, especially, but not exclusively, components of
optical
telecommunications systems, including optical fibers, optical isolators,
couplers, light
amplifiers, and dispersion compensators.
BACKGROUND
F~olarization mode dispersion (PMD) limits the performance of optical
telecommunications systems by reducing bandwidth in digital telecommunications
systems
and contributing to distortion in analogue telecommunications systems.
Techniques have
been developed for measuring PMD so that it can be reduced or, if that is not
possible,
measures can be taken to mitigate its effects. The characterization or
measurement of
polarization mode dispersion in fiber optic telecommunications systems has
become of
great importance with the advent of high bit rate, long-haul
telecommunications links.
Optical components in such systems must be tested to verify that they do not
add
significant PMD. Measurements must be made in the laboratory environment
during
component and subsystem design, in the production environment when the
components
are being fabricated, and in the outside plant environment when the system has
been
installed .
The practical range over which PMD may need to be characterized now extends
over five orders of magnitude from about 1 femtosecond to nearly 100
picoseconds.
Moreover, in contemporary wavelength-division multiplex (WDM) systems,
measurements must frequently be made through interposed, narrow path optical
filters,
and the :PMD characterized for weak, intermediate and strong mode coupling.
When the
measurements must be made in the production environment or in the field,
speed,
robustnf;ss and portability are important factors.
Generally, to characterize the PMD, it is required to determine the state of
polarization of the light at the output of the device under test. There are
several
standardized methods for measuring polarization mode dispersion, which can be
classified into two categories according to the kind of data, i.e. time-domain
or
frequency-domain, that is collected. Thus, time-domain data is collected by
the
CA 02229219 1998-02-23
2
Interferometric method (INT). Frequency-domain data is collected by the fixed
analyzer
method (FA), also known as wavelength scanning, and by the polarimetric
method, that
is Jones Matrix Eigenanalysis (JME) method or the Poincare Sphere (PS) method.
The following ANSI standards apply:
TIA/EIA-455-124 for the Interferometric method
TIA/EIA-455-122 for the Jones Matrix Eigenanalysis method
TIA/EIA-455-113 for the Fixed Analyzer method.
The interferometric measurement methods typically pass polarized light from a
broadba~id light source through the device under test and to an
interferometer, for
example a Michelson interferometer or a Mach-Zehnder interferometer. For
measurements in the field, the interferometric method usually is preferred
because it
provides measurements quickly and uses comparatively light apparatus. INT also
gives
the more reliable results in the important case of long installed fibres,
owing to its
insensitivity to fast fluctuations of the output state of polarization.
Disadvantages of previously-known interference methods include limitation of
the
measurement range to PMD values larger than about 150 femtoseconds, especially
in the
strong mode-coupling regime characteristic of most optical fibre measurements.
Another
disadvantage is that the measurement is sensitive to the shape of the spectrum
transmitted
through the device under test, so results are affected whenever some kind of
filter is
present in the path. Yet another disadvantage is that measurement is virtually
impossible
in the case of optical components which have limited spectral bandwidth.
Techniques have been proposed to improve the measurement of low PMD. For
example, in US patent specification number 5,654,793 issued August 1997, A.J.
Barlow
et al. disclosed a "PMD-biasing" technique for measuring low PMD using a
birefringent
artefact with a stable PMD value in series with the fiber under test. The
interferogram
is biased away from the central autocorrelation peak and PMD is obtained by
measuring
the broadening of the peak. While lower PMD values may be measured in this
way,
ultra-low values, i.e. less than 10 femtoseconds, cannot.
What may be considered an improvement over Barlow's technique was disclosed
in an article entitled "Interferometric Polarization Mode Dispersion
Measurements with
Femto Second Sensitivity" by T. Oberson et al. , Journal of Light Wave
Technology,
1997. Oberson et al. discussed standard techniques for PMD measurements using
the
Michelson interferometer and an envelope detector, the PMD delay being deduced
from
CA 02229219 1998-02-23
3
the width of the interferogram and concluded that such standard techniques
were not
suitable where the polarization mode delay is smaller than, or comparable to,
the
coherence time of the source. According to Oberson et al. , a PMD of 104
femtoseconds
represented the lower limit of PMD measurable using standard interferometric
techniques. To extend the measurement range, Oberson et al. proposed modifying
the
standard set-up by inserting a high birefringent (HiBi) fiber with a PMD of
about 0.5
picoseconds between the fibre under test and the analyzer. The HiBi fibre
produced two
side peaks, one each side of the central autocorrelation peak. The
differential group
delay (DGD) was determined from the extremes of separation between the side
peaks.
While Oberson et al.'s technique may measure PMD values in the range of 10
femtoseconds, it does not address the problem of measurements being sensitive
to the
shape of the spectrum transferred to the device under test or the measurement
of PMD
of optical components with limited spectral bandwidth. Other limitations
include a
lengthy measurement time, application to weak mode-coupling only, and a
requirement
for a polarization controller in the light path which can introduce residual
PMD which
randomly adds to, or subtracts from, the measured PMD.
The Fixed Analyzer method makes a plurality of measurements at different
wavelengths and analyzes the measured spectrum by counting extrema.
Measurements
at the different wavelengths may be obtained by varying the wavelength of the
input light
source, for example a tunable laser, or using a broadband source with a
monochromator.
The light from the source is polarized and passed through the device under
test to a fixed
analyzer and then to a photodetector. Alternatively, a broadband source could
be used
and the output from the polarizer/analyzer analyzed using an optical spectrum
analyzer.
The resulting spectrum exhibits a multiplicity of maxima and minima because
the state
of polarization at the output of the device under test, and hence at the input
of the
analyzer, changes with wavelength. The PMD is estimated by averaging the
number of
maxima and minima. While this might be satisfactory where the PMD is
relatively
large, it is not satisfactory for low PMD because the state of polarization
does not
change very much and there will be very few, perhaps only one or two, maxima
and
minima to average. Thus, its main disadvantage is that it can measure only PMD
values
which are much larger than the inverse of the source spectral width. For
example, with
one 1550 nm LED (20 THz width), the mean number of extrema is approximately 1
when PMD is equal to 25 fs.
CA 02229219 1998-02-23
4
The polarimetric methods use a laser or other narrowband light source that can
be tuned across the range of wavelengths to be measured. The Poincare sphere
method,
for example, then uses a polarimeter which measures state of polarization
directly but
at only one wavelength at a time. In addition to requiring an expensive
tunable laser,
this approach is time-consuming because the measurements must be repeated at
the
different wavelengths. Moreover, the scanning range of a tunable laser
typically is about
100 nm, which is very restricted compared with that provided by a broadband
source.
The Jones Matrix Eigenanalysis (JME) also uses a tunable laser, the output of
which is passed through a polarization controller and a set of linear
polarizers at
respective angles of 0°, 45° and 90°, before being passed
through the device under test.
The light from the test fibre is analyzed using a polarimeter.
Hence, current polarimetric methods use bulky and/or expensive apparatus, such
as a polarimeter and a widely tunable narrow line width laser, and the
measurement time
is long, making measurements on long installed fibres generally impractical.
Contrasting the Fixed Analyzer method with the Polarimetric methods, the Fixed
Analyzer method is quick because it uses a broadband source and inexpensive
because
it does not need a tunable laser or a polarimeter. Its spectrum analysis
approach,
however, i.e. counting extrema, loses important phase information. The
polarimetric
methods are much slower because they entail repeated measurements at the
different
wavelengths and expensive because they require a tunable source (laser) and a
polarimeter, but they have the advantage of retaining phase information and
providing
complete information about the state of polarization. It would be desirable,
therefore,
to have a PMD measurement method which, like the Fixed Analyzer method, was
quick
to use and inexpensive, yet provided more complete information about the PMD.
SUMMARY OF THE INVENTION
The present invention seeks to eliminate or mitigate some or all of the afore
mentioned disadvantages and to provide an improved method for the measurement
of
very low levels of polarization mode dispersion and apparatus for use therein
that is
inexpensive, robust and portable.
According to one aspect of the invention, apparatus for measuring polarization
mode dispersion of an optical device comprises:
CA 02229219 1998-02-23
(i) means for directing substantially completely polarized broadband light
from a broadband light source into the device with the polarization in a plane
substantially perpendicular to the propagation direction of the light;
(ii) spectral analysis means for analyzing light leaving the device to produce
5 a spectrum of intensity in dependence upon wavelength or frequency of said
light leaving
the device for each of at least two mutually orthogonal polarization axes in a
plane
perpendicular to the propagation axis of the light leaving the device;
(iii) means for computing, from the at least two spectra, a Stokes parameter
for each of a plurality of wavelengths within the bandwidth of the broadband
light; and
(iv) means for characterizing polarization mode dispersion of the device in
dependence upon the Stokes parameter.
According to a second aspect of the invention, a method of measuring
polarization
mode dispersion of an optical device comprises the steps of:
(i) directing substantially completely polarized broadband light from a
broadband light source into the device with the polarization in a plane
substantially
perpendicular to the propagation direction of the light;
(ii) analyzing light leaving the device to produce at least two spectra, each
of
intensity in dependence upon wavelength or frequency of said light leaving the
device,
each spectrum for a respective one of two mutually orthogonal polarization
axes in a
plane perpendicular to the propagation axis of the light leaving the device;
(iii) computing, from the two spectra, a Stokes parameter for each of a
plurality of wavelengths within the bandwidth of the broadband light; and
(iv) characterizing polarization mode dispersion of the device in dependence
upon the Stokes parameter.
The characterizing of the polarization mode dispersion may be effected by a
Fixed
Analyzer method, in which case only two spectra for a pair of mutually
orthogonal
polarization axes are used.
Alternatively, the light leaving the device may be analyzed to produce at
least
four spectra, comprising two pairs of spectra for two different pairs,
respectively, of
mutually orthogonal polarization axes in a plane perpendicular to the
propagation axis
of the light leaving the device. Each pair of spectra so prduced may be used
to compute
Stokes parameters sl, s2 and ~ s3 ~ for each of a plurality of wavelengths
within the
bandwidth of the broadband light.
CA 02229219 1998-02-23
6
In embodiments of either aspect of the invention, a rotatable
analyzer/polarizer
for selecting different polarization components of the light from the device
may be
rotated to each of a plurality of angular positions corresponding to said
polarization axes
and, for each axis, light from the rotatable analyzer/polarizer scanned to
provide said
plurality of spectra, conveniently by means of an optical spectrum analyzer.
Alternatively, an interferometer may be used to generate, from the light
leaving the
rotatable analyzer/polarizer, a set of interference fringes for each of the
mutually
orthogonal polarization axes, and Fourier transform performed on each set of
fringes to
provide said spectra.
The rotatable analyzer may comprise a linear polarizes and a waveplate,
rotatable
together to said plurality of positions. Alternatively, the rotatable
analyzer/polarizer may
comprise a fixed linear polarizes and a waveplate, the waveplate being
rotatable relative
to the polarizes between the plurality of positions corresponding to said
mutually
orthogonal axes.
Preferably, the polarization state of the polarized light directed into the
device
may be set to first and second different polarization states, and the set of
spectra
generated for each of them.
As an alternative to using a rotatable analyzer/polarizer, the light from the
device
under test may be supplied directly to an interference fringe generating unit
for
generating interference fringes, and a real-time Stokes analyzer used to
produce a
corresponding set of fringes for each of the orthogonal polarization axes.
Fourier analysis
may then be performed on each set of fringes to provide said spectra.
The polarization mode dispersion may be characterized by any of several
standard
methods, including the Interferometric, Fixed Analyzer and polarimetric
methods.
Preferably, the polarization mode dispersion is characterized by plotting
trajectories on
a Poincar~ sphere of Stokes vectors corresponding to the Stokes parameters.
1'he method and apparatus may provide for selecting either the Fixed Analyzer
method or the polarimetric method in dependence upon whether or not the device
exhibits weak polarization mode coupling, as predetermined by a user.
BRIEF DESCRIPTION OF THE DRAWINGS
An embodiment of the invention will now be described by way of example only
and with reference to the accompanying drawings in which:
CA 02229219 1998-02-23
7
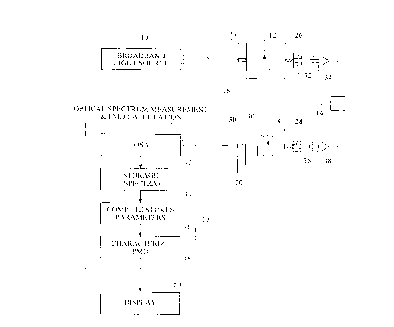
Figure 1 is a block diagram of apparatus for measuring polarization mode
dispersion (PMD) of a device, such as an optical fiber;
Figure 2 illustrates one spectrum obtained by measurements taken at one
analyzer
orientation;
Figure 3 illustrates the basic sequence of operations when using the apparatus
to
measure PMD;
Figure 4 is a flowchart illustrating a data acquisition sequence of the
apparatus
of Figure 1;
Figure 5 is a flowchart illustrating interpretation of the spectra and
determination
of PMD;
Figure 6 is a detail view of a first modification which uses a Fourier-
transform
spectrometer to obtain a plurality of spectra;
Figure 7 is a detail view of a modified polarizer/analyzer of the apparatus of
Figure 1 or Figure 6; and
Figure 8 is a detail view of yet another modification which uses a real time
Stokes analyzer.
DETAILED DESCRIPTION OF PREFERRED EMBODIMENT
In the drawings, corresponding components in the different Figures have the
same
reference numerals, with a prime where they are not identical.
Referring now to Figure 1, apparatus for measuring PMD comprises a low-
coherence, broadband, substantially unpolarized light source 10 which may
comprise one
or more light emitting diodes. Light emitted by the source 10 is passed
through a linear
input polarizer 12 and injected into the device under test 14. The polarizer
12 is
mounted in a support 16 and rotatable about the propagation axis of the light
beam by
a suitable drive unit (not shown) so that :its maximum transmission axis can
be set to two
different angles, e. g. 0 ° and 45 ° . On leaving the device
under test 14, the light is
passed through a rotatable linear analyzer 18 which is mounted in a second
support 20
and rotatable about the propagation axis by means of a drive unit (not shown)
. In
practice, the rotatable analyzer 18 also is a linear polarizer. Light leaving
the
polarizer/analyzer 18 is passed to an optical spectrum measurement unit 22
which
analyses the light in the frequency/wavelength domain to determine the optical
energy
(spectral density) at each wavelength.
CA 02229219 1998-02-23
8
Before it is passed through the polarizes 12, the light from the source 10 is
collimated by a first collimator 24, for example a GRIN lens or other suitable
means,
mounted on the support 16. A second collimator lens 26 carried by the support
20 and
aligned with lens 24 focuses the light leaving the polarizes 12 for injection
into the
device under test 14. The direction of propagation of the beam passing between
collimators 24 and 26 is substantially perpendicular to the maximum
transmission axis
of polarizes 12.
Light leaving the device under test 14 is collimated by a third collimating
lens 28
before passing through the rotatable analyzer 16. A fourth collimating lens 30
focuses
the light leaving the rotatable polarizer/analyzer 18 for inj ection into the
optical spectrum
measurement unit 22. The direction of propagation of the collimated beam
passing
between the collimators 28 and 30 is substantially perpendicular to the
maximum
transmission axis of the rotating polarizer/analyzer 18. The collimators 28
and 30 are
mounted coaxially upon the support 20.
The polarizes support 16 has a connector part 32 adjacent, and coaxial with,
the
collimator lens 26 for receiving a complementary connector part 34 coupled to
the input
of device 14 by a fiber pigtail. The connector part 32 is configured so that
the end of the
fiber pigtail abuts the adjacent end face of the collimator lens 26. The
analyzer support
has a similar connector part 36 to receive a connector part 38 coupled to the
output
20 of device 14 by a fiber pigtail so that the end of the fiber pigtail abuts
the end of the
collimator lens 28.
Abutting the ends of the device 14's fiber pigtails directly onto the ends of
the
collimator lenses 26 and 28, respectively, avoids introducing additional fiber
pigtails,
showing PMD, into the path between the polarizes 12 and the polarizer/analyzer
18.
Although, for convenience, polarizes 12 provides linear polarization, the
state of
polarization is not important; it could be circular, elliptical and so on. It
is important,
however, that the degree of polarization be substantially 100 per cent. The
maximum
transmission axis of input polarizes 12 may be rotated through 45 ° ,
if necessary, to
ensure that it is not aligned with one of the input principal states of
polarization of the
device under test 14.
The rotating polarizer/analyzer 18 may be rotated to set its maximum
transmission axis at each of four orientations differing by 45 ° from
each other, for
example 0 ° , 45 ° , 90 ° and 135 ° . In use,
eight measurements usually will be made, using
CA 02229219 1998-02-23
9
each of the four angular positions of the maximum transmission axis of
polarizer/analyzer 18 with each of the two angular positions of the maximum
transmission axis of polarizer 12, as will be described later.
As shown in Figure 1, a retarder in the form of a wave plate 40 is attached to
the
rotatable polarizer/analyzer 18. The angle between the birefringence axis of
the
waveplate 40 and the maximum transmission axis of the rotatable
polarizer/analyzer 18
is substantially 45°, independently of the orientation of the maximum
transmission axis
of polarizer/analyzer 18. The waveplate 40 is a quarter waveplate, i. e. with
a retardance
of ~r/2 at the wavelength corresponding to the centre of the emission spectrum
of source
10. In order for the retardance to be substantially ~/2 at any wavelength
within the
spectral bandwidth of the source 10, the waveplate 40 preferably is a zero-
order
waveplate or any substantially achromatic waveplate. The addition of the
waveplate 40
ensures that the state of polarization of the light passed to the unit 22 is
always
substantially circular, regardless of the orientation of the maximum
transmission axis of
the rotatable polarizer/analyzer 18. This virtually eliminates any adverse
effect upon the
measurement from the polarization dependent loss (PDL) of the assembly
following the
polarizer/analyzer 18 (i.e. the fourth collimator 30, and other components of
the optical
spectrum measurement unit 22).
As illustrated in Figure 2, the spectrum produced at the output of the
polarizer/analyzer 18 by a broadband source 10 comprising two LEDs having
centre
frequencies of 1300 nm and 1550 nm, respectively, comprises two similar
segments.
Each segment comprises only a limited number of maxima and minima. In Figure
2,
the bandwidth of the LED sources without any intervening device under test is
represented by a broken line curve, and the spectral density S(v) (in
watts/Hz) for one
of the four angles of the polarizer/analyzer 18 is represented by a full line
curve. The
difference between the full curve and the broken curve represents the spectrum
for the
other, orthogonal angle of the polarizer/analyzer 18 assuming the same
orientation of the
polarizer 12. The different permutations of the angles of the polarizer 12 and
polarizer/analyzer 18 will yield spectra which differ from each other.
Refernng also to Figure 3, in use, the apparatus first carnes out a data
acquisition
step I which involves carrying out scans for all permutations of the different
settings of
the polarizer 12 and polarizer/analyzer 18 to obtain eight spectra. In the
specific
embodiment illustrated in Figure 1, the optical spectrum measurement unit 22
comprises
CA 02229219 1998-02-23
an optical spectrum analyzer (OSA) 42 which scans the output of the
polarizer/analyzer
18 over the spectral bandwidth of the broadband source 10, for each of the
eight
combinations of angles for polarizes 12 and polarizerlanalyzer 18. In this
case, the
bandwidth is about 400 nm, i.e. the bandwidth of two LEDs. The spectra
produced by
5 the OSA 42 are stored in spectra storage means 44. When the eight spectra
have been
stored, in the second step II the Stokes parameter calculating means 46
calculates
normalized Stokes parameters sl, sz and ~ s3 ~ , the modulus of parameter s3,
for each
wavelength and for each of the two angles of polarizes 12. In step III, the
PMD
characterizing means 48 uses the Stokes parameters to obtain PMD, using
whichever of
10 several methods is appropriate, as will be explained later, and displays
the results on
display 50 (step IV).
The data acquisition step I is illustrated in more detail in Figure 4. In step
4.1,
the apparatus is initialized and the source 10 turned on. With the axis of
input polarizes
12 set to 0° (step 4.2), and the axis of the polarizer/analyzer 18 set
to 0° (step 4.3), the
optical spectrum measurement unit 22 acquires the spectrum (step 4.4) and
saves the
resulting data (step 4.5). The loop comprising decision step 4.6 and function
step 4.7
causes the sequence to repeat for analyzer angles of 45 ° , 90 °
and 135 ° and the
corresponding data (spectra) are stored. Steps 4.8 and 4.9 then change the
orientation
angle 9p of input polarizes 12 to 45°, and scanning steps 4.4, 4.5, 4.6
and 4.7 are
repeated to obtain, and store, a set of spectra for an input polarizes angle
of 45 ° . Once
this has been done, step 4.10 uses the stored spectra to compute the Stokes
parameters.
Referring now to Figure 5, in step 5.1, normalized Stokes parameters are
computed for each wavelength in the scanned range. Two sets of Stokes
parameters are
computed, one for each setting of the polarizes 12, vis. for angles 6P =
0° and OP =
45°. Stokes parameters of each set are calculated as follows:
- S(0,~.) - S(90,~.)
S(o, ~,) + S(go, ~)
S2 ~~) = S(45, h) -S(135, ~.)
S(45, ~,) +S(135, ~)
S3 (h) I = ~- (Si (~) + Sa (~,)
CA 02229219 1998-02-23
11
where the term S (0, ~) + S (90, ~) represents the spectral den sity at the
input of
polarizer/analyzer 18. The three Stokes parameters are the coordinates of the
point
representing the state of polarization in the Poincar~ sphere representation.
The Stokes parameters are supplied to output 5.3 for display by display device
50 (Figure 1), and decision step 5.4 determines, based upon the user's
selections prior
to/during initialization, whether or not the device exhibits strong
polarization coupling.
For the case where the device 14 is NOT strongly mode-coupled, step 5.5
analyzes the
sets of Stokes parameters as a function of optical frequency v, using a known
technique
such as cosine fitting of curves S;(v), to find the PMD value. Where 0(v) is
the period
of the sinewave variations of S;(v) found by the fit, the value of PMD is
1/Ov.
If the device does exhibit strong polarization mode coupling, step 5.7
analyzes
the trajectory on the Poincare sphere using known algorithms such as disclosed
by C.D.
Poole et al in "Polarization Dispersion and Principal States in a 147 km.
Undersea
Lightwave Cable", Journal of Lightwave Technology, 7, p. 1185, 1989, and
outputs that
as the PMD value. The Stokes parameters are used to determine the state of
polarization
at the input of the polarizer/analyzer 18 which is represented by the
trajectory of the
output Stokes vector on the Poincar~ sphere as a function of v (the Poincare
sphere is a
representation of SOP widely used in PMD analysis).
In certain circumstances, specifically if the device 14 exhibits weak mode-
coupling, the spectra produced by the polarizer/analyzer 18 may be analyzed,
to derive
the PMD, using a method according to the Fixed Analyzer standard TIA/EIA-455-
113.
In this case, only one Stokes parameter needs to be computed, which can be
done using
only one pair of spectra for mutually orthogonal polarization angles.
If it is apparent from the first three scans, with analyzer angles of
0°, 45° and
90 ° , that two suitable scans have been obtained, the measurement at
135 ° may be
omitted. Generally, however, it is more convenient to take all four
measurements.
It should be appreciated that, at this stage, either time-domain
interferometric
analysis or frequency-domain fixed-analyzer analysis could be performed on the
data.
Analysis of the normalized spectrum allows very small PMD values of only a few
femtoseconds to be measured, providing the device is weakly mode-coupled.
Various modifications to the above-described embodiment may be made within
the scope of the present invention. Thus, in the optical spectrum measurement
unit 22
(Figure 1), the optical spectrum analyzer (OSA) 42 could be replaced by a
Fourier-
CA 02229219 1998-02-23
12
transform spectrometer. Figure 6 illustrates such a Fourier-transform
spectrometer 52
comprising a modified Michelson interferometer unit 54 without the usual
envelope
detector. More specifically, instead of the output of the photodetector being
rectified and
the fringe envelope used, the interferometer has a storage unit 56 for storing
interference
fringes, a Fourier transform unit 58, and a modulus computing unit 60. For
each of the
eight permutations of the angles of the polarizer 12 and polarizer/analyzer
18, the
Michelson interferometer unit 54 stores a set of fringes in storage means 56.
Each set
of fringes is processed by the Fourier transform unit 58 which, in addition to
performing
the Fourier transform from the time domain to the frequency domain, may
provide some
scaling. The modulus computing unit 60 then deduces the modulus of the Fourier
transform of the interference fringes (ti.me-domain data) to obtain the
spectral density
S(v) and outputs it to the spectra storage unit 44 (Figure 1).
Imbalance of chromatic dispersion between the interferometer arms, which
distorts the shape of the interferogram, manifests in the Fourier transform as
a
frequency-dependent phase term. Taking the modulus of the Fourier transform
eliminates this phase term.
The eight spectra from the Fourier-transform spectrometer 52 are processed in
the same manner, described with reference to Figure 5, as those produced by
the OSA
42.
It is envisaged that a relatively inexpensive interferometer could be used and
any
detrimental effects of minor position errors corrected by means of a
narrowband
reference, for example a laser. The reference signal would be combined with
the output
of the rotatable polarizer/analyzer 18, using a coupler, before it was
inputted to the
interferometer. The wavelength of the reference signal would lie outside the
bandwidth
of the broadband source. Discrete Fourier Transform would be performed upon
the
fringe data, and the transformed data supplied to a broadband filter and a
narrowband
filter, respectively, which would segregate broadband (LED) and narrowband
(laser
reference) components. Inverse Discrete Fourier Transform would be applied to
the
filtered data to produce, respectively, an uncorrected interferogram for the
broadband
data and a position error of the scanning mirror of the interferometer. The
position error
would be used to correct the interferogram. Discrete Fourier Transform would
be
performed upon the corrected interferogram to produce the spectra.
CA 02229219 1998-02-23
13
As illustrated in Figure 7, the rotatable polarizer/analyzer 18 may be
replaced by
a rotatable quarter-waveplate 40' followed by a fixed polarizer/analyzer 18' .
An
advantage of making the quarter-wave plate 40' rotatable, instead of the
polarizerlanalyzer 18', is that it allows the state of polarization at the
output of the
polarizer/analyzer 18' to be rigorously fixed. The waveplate 40' should be
precisely
calibrated (retardance) as a function of wavelength. Calculation of the Stokes
parameters
is more complex.
Figure 8 illustrates a modification to the apparatus of Figure 6. The
modification
entails omitting the rotatable polarizerlanalyzer 18 completely and modifying
the
interferometer unit 54 (Figure 6) by replacing the photodetector (not shown)
with a real
time Stokes analyzer. Thus, referring to Figure 9, the output from the device
14 is
passed directly to interferometer 54' wherein it passes through a coupler 64
to a fixed
minor 66 and, via a lens 68, to a moving mirror 70. The light from the mirrors
66 and
70 is returned via the coupler 64 to real-time Stokes analyzer 72 wherein it
is reflected
by a first sputter 74 to pass through a quarter wave plate 76 and a first
polarizes 78 to
a first detector 80. The polarizes 78 has a maximum transmission axis set at
45 degrees
relative to a reference. Light transmitted by the first sputter 74 and
reflected a second
splitter 82 passes through a second polarizes 84 to a second detector 86. The
axis of the
second polarizes is set to 135 degrees. Light transmitted by the second
sputter 82 is split
by a polarizing beam splitter 88 into a vertically-polarized reflected
component which
is supplied to third detector 90 and a horizontally-polarized transmitted
component which
is supplied to fourth detector 92. The outputs of the four detectors 80, 86,
90 and 92,
respectively, are converted to digital numbers by an analog-to-digital
converter 94, the
output of which is supplied to the storage unit 56 and Fourier-transform unit
58 (Figure
6). Processing may then be carried out as described previously to obtain the
Stokes
parameters and characterize PMD. However, because the real-time Stokes
analyzer
provides the sign of the Stokes parameter s3, it is possible to perform Jones
Matrix
Eigenanalysis (JME).
An advantage of using the real time Stokes analyzer is that four
interferograms
are obtained in the same scan of the moving minor. However, it should be
recognized
that this approach is more costly and is more sensitive to residual PMD and
PDL of the
interferometer. Moreover, it requires an airpath interferometer to be used.
CA 02229219 1998-02-23
14
An advantage of embodiments of the present invention is that they allow the
use
of apparatus which is relatively inexpensive and portable to make PMD
measurements
using data analysis techniques according to the different standardized
methods. The
particular analysis method may be selected according to the type of device
under test,
range of PMD values, stability of the device under test, degree of mode
coupling, type
of results needed, and so on. Moreover, given that PMD is an inherently
fluctuating
quantity that is difficult to characterize with full certainty, the ability to
use different
forms of data analysis may afford a greater degree of comfort with the
measurements.