Note: Descriptions are shown in the official language in which they were submitted.
CA 02230880 1998-03-02
Method for Determining Formation Density and Formation Photo-
s Electriic Factor with a Multi-Detector-Gamma-Ray Tool
Field of the Invention
This invention relates to the determination of earth formation
characteristics. In
particular, it relates to the determination of formation density even at an
extended
standoff between a borehole tool and the formation. The invention also
measures the
photo-electric factor of a formation and provides better quality control for
the density
measurement.
is
Background of the Invention
Nuclear tools have been used for several decades to determine the density of
:ZO earth rock formations surrounding a borehole. The nuclear density tools
rely on the
Compton scattering of gamma-rays in the formation for the density
measurements. A
conventional density tool consists of a source of gamma-rays (or X-rays), at
least one
gamma-ray detector and shielding between the detector and the source, so that
only
scattered gamma-rays are detected. During density logging, gamma-rays from the
tool
s source travel through the borehole, into the earth formation. The gamma-rays
will be
scattered by the electrons in the formation or the borehole and some of them
will be
scattered back to the detector in the logging tool. Depending on the spacing
between
the source and detector, the count rate of detected gamma-rays will either
increase
with increasing formation density (scattering term dominant) or decrease with
30 increasing formation density (attenuation effect predominant). At
intermediate
spacings, both attenuation and scattering terms influence the response.
1
CA 02230880 1998-03-02
In an ideal logging situation, the borehole would have a uniform and straight
shape. This uniform borehole would enable a density tool containing a detector
to be
in close proximity with the formation surrounding the borehole and there would
be
minimal too( standoff. Under these conditions, one detector would be
sufficient for a
density measurement.
However, because boreholes normally do not have a uniform and straight
shape, one ma jor concern in density logging is the logging tool contact with
the
borehole wall. Density logging tools can be engineered either as pad tools or
as
mandrel tools. In a mandrel toot the source and detectors are in the body of
the
straight cylindrical tool. The long stiff length of such an arrangement
renders it difficult
for the tool to stay in close contact with a non-uniform borehole wall. In pad
tools, the
detectors and, in most cases, also the logging source are mounted in a short,
articulated pad which can move with respect to the tool body. A strong
eccentralizer
arm pushes the pad against the borehole wall and allows much better contact
because of the much smaller length of the device. All density logging tools
will also
encounter mudcake built up on the formation wall, which prevents good contact.
The
density measurement needs to be compensated for this kind of standoff as well.
Because of the shortcomings of the mandrel tools, these tools are only used if
a pad
tool cannot be Engineered because of size or cost constraints.
Most modern density tools use an articulated pad which houses the detectors
and the gamma-ray source. A backup arm pushes the pad against the formation.
The
:25 short length of such a pad and the large eccentralizing force exerted by
the backup
arm assure very good contact of the pad with the formation in most
circumstances.
However, for tools with a small diameter, the use of a pad type construction
becomes
difficult or impossible. In these cases, the detectors are placed inside the
tool housing
(mandrel tool). iEccentralization is provided by a bow-spring and/or a caliper
device
2
CA 02230880 1998-03-02
with a backup arm. However, the much longer stiff length of the tool leads to
a poorer
application of the tool to the borehole wall and leads to a larger average
standoff.
The basic layout for a two detector tool is shown in Fig. 1. The tool 1
consists of
a gamma-ray source 2, a short spaced (SS) detector 3 and a long spaced (LS)
detector 4. The tool is in a borehole 5 that is substantially uniform. Gamma-
rays
emitted from the source 2 go into the borehole and earth formation 6, where
they are
scattered and .some of them are subsequently detected by the detectors. The SS
detector 3 is more sensitive to the region close to the tool 7. The LS
detector 4
1() detects gamma-rays 8 from the formation 6 at greater depth than the SS
detector and
is less sensitive to effects of tool standoff. The apparent density derived
from the LS
detector measurement can be corrected for tool stand off by comparing the
apparent
density readings of the LS and SS detectors.
The correction for standoff caused by mudcake build-up or tool standoff can be
accomplished by using two detectors with different depths of investigation. In
this
case, the first detector (SS) has a shallow depth of investigation and is more
sensitive
to the borehole fluid or mudcake between the tool and the formation. A second
detector (LS) at a longer distance from the source is less sensitive to the
borehole
environment and is more sensitive to the formation. The difference between the
two
detector readings can be transformed into a correction for standoff and
mudcake.
However, at larder standoffs due to an irregular borehole shape 9 the 2-
detector
compensation is often insufficient or ambiguous.
:?5 The shortcomings of the 2-detector measurement lie in the fact that the
two
detector measurement is used to determine three unknowns: Formation density,
standoff (distance between the tool and the borehole wall) and the density of
the fluid
and/or mudcake between the tool and the formation. At small standoffs the
latter two
unknowns can bye combined into an effective thickness (mud density *
standoff). At
larger standoffs i:his approach fails and the correction becomes ambiguous. In
3
CA 02230880 1998-03-02
addition, the ahort space detector depth of investigation can become smaller
than the
stand off. This will prevent proper compensation.
As shown in Fig. 1, the irregular shape of the borehole wall 9 causes the tool
to
be separated from the wall by a large distance. The short space detector 3
depth of
investigation is smaller than the standoff and therefore an effective
compensation of
the density answer of the long space detector 4 is more difficult or nearly
impossible to
obtain.
The use of an additional detector positioned between the traditional LS and SS
detectors can help in addressing the ambiguity of the correction at large tool
stand off
and some of the limitations of the two-detector tool can be overcome. The
three-
detector measurement provides the ability to distinguish the effect of the mud
and/or
mudcake thickness from the effect of the density of the mudlor and mudcake
between
the tool and the formation. In addition, the better statistical precision
provided by the
middle measurement will improve the logging speed of the tool. The operation
of a
three-detector vtool is shown in Fig. 2. The three-detector tool 11 has the
ability to
measure three distinct depths of investigation in the formation. The tool has
a source
12, and short :spaced (SS) 13, middle spaced (MS) 14 and long spaced (LS) 15
detectors. Because of the shape of the borehole wall 9 a very large standoff
23 occurs
between the tool 11 and the borehole wall 9. In order to compensate for the
effect of
this large standoff, at least two detectors must have depths of investigation
greater
than the tool standoff. Detectors 14 and 15 have depths of investigation, 25
and 26
respectively, that extend into the formation 6 and provide for the measuring
of the
formation and the material in the region 23 between the tool and the borehole
wall.
The idea of using three detectors to differentiate different depths of
investigation
was described in U. S. Patent 4,129,777 (Wahl). In Wahl, the main idea is to
measure
the density of material at three different depths from the tool. This can be
used for
.30 determining formation density though casing, for determining the cement
thickness
4
CA 02230880 1998-03-02
behind casing or for determining mudcake density and thickness between the
tool and
the formation. In all three cases the measurement is also used to determine
the
formation density and the thickness and density of the a layer of material
between the
tool and the formation.
In Wahl, gamma radiation is emitted from the tool into the surrounding media
and measurements are taken of the amount of radiation which returns to the
detectors
as a result of ilhe interaction of the emitted radiation with first, second
and third layers
respectively of the surrounding media each beginning at the borehole and
extending
l0 to increasing radial depths. These measurements are taken by three
detectors located
at different spacings from the gamma radiation source so as to have three
different
depths of investigation. A representation of the thickness of the solid matter
is then
obtained from the three gamma radiation measurements.
1~ In particular, the method proposed by Wahl is useful for determining the
thickness of the bonding material between a borehole casing and the adjacent
formation. In that case, the three gamma radiation measurements (shallow,
intermediate and deep) are corrected for the attenuating effect of the casing.
Three
densities are then computed from the shallow, intermediate and deep radiation
20 measurements respectively.
Another patent incorporating the three detector concept is U. S. Patent
5,525,797, Moake. In this patent, like in Wahl, the gamma-ray source is spaced
axially
from the first, sE~cond and third detectors. The first/near detector is
axially spaced from
25 the gamma source by a distance defined as a first spacing. The first
spacing and
collimation for the first detector are designed so that the gamma-rays
detected at the
first detector area those gamma-rays that are scattered primarily by the
casing.
A second or middle detector is spaced axially farther away from gamma-
_SO ray source than 'the first detector. The second detector is spaced from
the
5
CA 02230880 1998-03-02
gamma-ray source by a distance defined as a second spacing. The second
spacing and c;ollimation for the second detector are designed so that the
gamma-rays detected at the second detector will be those that are primarily
scattered by the casing and the cement. Finally, a third or far detector is
spaced
axially farther away from the gamma-ray source than both the first and second
detectors by 2~ distance defined as a third spacing. The third spacing and
collimation defined by the third detector are designed so that the gamma-rays
detected at the' third detector are those primarily scattered from the casing,
cement and formation. It is this third detector that enables the tool to
measure
formation density while the first and second detectors primarily enable the
tool
to correct for casing and cement. However, the second detector can be used to
measure formation density in the absence of cement.
Preferably, the detectors are shielded by a high density material between
the source and' the detector that prevents detection of gamma-rays that are
simply traveling up through the tool. A pathway or void in the shielding is
provided in the.form of a collimation channel which extends from the detector
through the tool and terminates at the outside surface of the tool. The
collimation channels are specifically designed for the detection scheme of
each
detector. Specifically, the near or first detector will have a collimation
that is
aimed at a small angle with respect to the casing so that the first detector
will
detect gamma-rays that are scattered mainly by the casing. The second or
middle detector will have a collimation that is directed at a steeper or more
perpendicular angle with respect to the casing because the second detector is
intended to detE~ct gamma-rays scattered through all of the cement as well as
the casing (deeper depth of investigation). Finally, the third or far detector
will
have a wide collimation channel which is directed substantially perpendicular
to
the casing due to the distance of the third detector from the source. Because
gamma-rays del:ected at the far detector must pass through the casing, cement,
formation before passing back through the cement and casing, the statistical
6
CA 02230880 1998-03-02
probability of this event happening is smaller than for the first and second
detectors and therefore a wider collimation channel is required for the third
detector.
The three detector density presented by Wahl describes the general
idea of using three detectors to measure density in the presence of a material
of
substantial thickness andlor density between the tool and the formation. The
distinction between different depth of investigation is achieved by the
different
axial spacing ~of the detectors.
The invention presented by Moake uses substantially the same detector
spacings as the invention of Wahl. The detector collimation is optimized for a
through casing measurement. The SS (first) and LS(third) detectors use
collimation whiich is very similar to the one used in traditional two-detector
1S density tools. The MS (middle) detector collimation is very tight and
almost
perpendicular to the borehole wall to get a deeper density reading in through-
casing measurements. The steep collimation angle of the MS detector reduces
its count rate and statistical precision. In an open hole measurement the
depth
of investigation of the MS and LS detectors will become very similar and the
sensitivity to mudcake, which has a much smaller density than the steel
casing,
is reduced.
There remains a need for a solution to determining a correction for
standoff in logging tools that can overcome these limitations. One possible
approach for a 3-detector algorithm is described in U.S. patent 5,390,115
(Case and Ellis;).
The present invention provides a new multi-detector algorithm optimized for
situations in which a density tool encounters substantial standoff from the
:30 formation. The method of this invention can be implemented in conjunction
with
7
CA 02230880 2000-09-21
the multi-detector tool described in U. S. Patent No. 5,841,135.
In addition to determining formation density, this invention can also measure
the
photo-electric factor (PEF),of the formation. This measurement relies on the
absorption of low energy gamma-rays through the photoelectric effect in the
formation.
Since the photo-electric effect depends strongly on the atomic number of the
formation
elements, it provides an indication of the lithology of the formation. Because
photo-
electric absorption preferentially removes low energy gamma-rays, the tool
housing
needs to allow passage of low energy gamma-rays to detectors inside the
housing.
This objective can be accomplished through the use of a window of a material
with a
low atomic number (Z) in the housing or through the use of a low-Z housing
material
like titanium. Typical window materials are beryllium and titanium. Housing
materials
can be titanium or for lower pressure requirements graphite or high-strength
carbon
compounds.
Summaryr of the Invention
It is an object of this invention to provide an optimized means to make a high-
quality density measurement in the presence of large tool standoff.
It is another object of the tool to provide an improved, more robust
measurement
of the photo-electric factor of an earth formation.
It is another object of this invention to provide an improved means for the
quality
control of the density measurement.
The present invention is an improved method for determining formation density
by using an array of gamma-ray detectors. This includes improved standoff
correction,
8
CA 02230880 2000-06-15
77483-6
better precision and significantly enhanced measurement for
photo-electric effect and a more reliable way to ensure the
accuracy of the density answer. The detectors have varying
depths of investigation into the formation. At small
standoffs, the SS detector investigates mainly the mud and
mudcake and a shallow layer of the formation. As the standoff
increases the SS detector signal is no longer sensitive to the
formation or to the mud or mudcake found in close proximity to
the formation. The MS detector has a deeper depth of
investigation and is sensitive to borehole and formation even
at increased tool standoffs. The long spaced (LS) detector is
mainly sensitive to the formation density. This LS density
reading is corrected by using the information from the MS and
SS detectors to provide a more accurate density reading.
The present invention is also an improved method to
determine the photo-electric (PEF) of the formation. The use
of an array of three detectors in a titanium housing provides a
high quality PEF answer, which is more precise and more
accurate than in traditional two-detector tools.
In accordance with the present invention, there is
provided a method for determining characteristics of an earth
formation surrounding a borehole, comprising the steps of: (a)
providing a source for irradiating the earth formation with
gamma rays; (b) providing a short, middle, and long spaced
detector, each respective detector located at fixed
successively greater distances from the source such that the
detectors have different depths of investigation in the
formation, the detectors being capable of generating signals
indicative of the energy of the gamma radiation detected by
each of the detectors; (c) dividing the detected gamma-ray
spectrum into a plurality of windows in each detector, the
windows containing a count of gamma rays and being
representative of different gamma ray energies; (d) correcting
9
:,
CA 02230880 2000-06-15
77483-6
the detected gamma ray count rates for electronic dead time;
(e) determining a density measurement at each detector from
the generated signals indicative of the gamma radiation energy;
and (f) computing a corrected density from the density
measurement determined at each detector by comparing the
density measurements between the detectors.
9a
CA 02230880 1998-03-02
Brief Descriration of the Drawings
Figure 1 is a two-detector logging tool at large standoff caused by an
irregular
shaped borehole.
Figure .? is a three-detector logging tool at large standoff caused by an
irregular
shaped boreh~ole.
Figure ~4 is a typical gamma-ray spectrum observed in a density tool.
lU
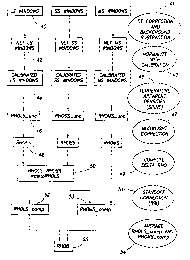
Figure 4. is the flow diagram of the preferred embodiment of the density
algorithm method.
Figures 5a and 5b show the basis for the density compensation algorithm and
the need to Limit the lithology correction.
Figures ~6a and 6b show the mid-spacing density compensation data.
Figures .7a and 7b show a comparison between the traditional and the
improved algorithm for determining Pef.
Figure 8 is the flow diagram of the algorithm to determine Pef.
Figure 9 shows the data underlying the algorithm for the density quality
control.
Figure 1 CI is the flow diagram for the determination of the density quality
factor.
CA 02230880 1998-03-02
Detailed Description of the Invention
The 3-detector density algorithm relies on the traditional spine-and-ribs
approach to
the density measurement. However, in order to make full use of the 3-detector
tool the
spine algorithm was modified and the rib algorithm was adapted to the use of
three
detectors. The traditional spine algorithm uses the following formulas to
determine the
apparent density from a single detector measurement. Formula (1 ) is used for
the
detectors farther away from the source. Formula (2) for a detector close to
the source.
RHO =A+B.ln(W ad )+C~ln(W °Q )
apparent '
Whard WSOft
RHOa = A + B . ln( W gird , '4L ) + C . ln( W S°'~ ) (2)
pparent - W cal
cal
hard L WSOff
Fig. 3 shows a typical gamma-ray spectrum observed in a density tool. The
spectrum is divided in two windows: soft and hard. "Soft" refers to the low
energy part
of the spectrum in the energy range of about 30 to 120 keV. "Hard" refers to
the high
energy part of lrhe spectrum about 200 to 500 keV if a '3'Cs source is used
for the
logging. RHOappa,e~t is the density measured by the single sensor and is not
corrected
for tool standoff. A is a constant (typically the density of a calibration
medium), B is the
coefficient for the density sensitivity of the count rate in the high energy
window. The
high energy window in a typical density tool using a '3'Cs source is between
200 and
500 keV, i.e. in the region in which the main gamma-ray interaction is through
Compton scattering and not through photoelectric absorption. Wham stands for
the
count rate in the high energy window. W~' is the equivalent count rate in a
calibration
measurement. Normalizing to the calibration eliminates small tool-to-tool
differences.
C is the coefficient of the lithology correction. This correction is needed to
eliminate
the small biase:> caused by different lithologies, i.e. by different effective
atomic
numbers. The sensitivity to this effect is highest at low gamma-ray energies,
therefore
the correction is based on the low energy window Wso~ which is normalized by
the
11
CA 02230880 2000-06-15
77483-6
respective calibration window count rate. Formula (2) uses in
addition the term AL which represents the coefficient A from a
detector at a further spacing and the apparent density RHOL
determined by that farther spaced detector.
The coefficients A, B and C may vary as a function of
borehole size. The variation can be described in the form of
discrete values at given borehole sizes for which the
coefficients have been determined through measurements or
modeling, where values for other borehole sizes are obtained
through interpolation. It is also possible to describe the
values A, B and C as analytical functions of borehole size.
Since the three (or more) detectors in an array
density tool have different depths of investigation the true
density can be determined by comparing the apparent densities
measured by the three (or more) detectors. The preferred
approach for determining the density of the earth formation is
shown schematically in the flow diagram in Fig. 4. In a first
step 40 the soft and hard window count rates are determined for
the three detectors (LS, MS and SS). The count rates are then
corrected 41 for the effect of electronic dead time and the
background spectrum from the gain-stabilization source is
subtracted. This background spectrum has been determined
previously, before the logging source was inserted in the tool.
Electronic dead time effects include the loss of counts when
the components are busy handling previous inputs. These
effects are corrected by compensating techniques as known in
the art. The resulting "net" count rates 42 are normalized 43
by the count rates from the tool calibration to give the
normalized or calibrated window count rates 44. For each
detector an apparent density is determined 45 using formula (1
or 2). In addition if necessary, the densities 46 are
corrected 47 using the effect of temperature on the net count
rates. Since the density of the mudweight affects the gamma-
12
CA 02230880 2000-06-15
77483-6
ray transport the apparent densities have to be corrected 47
for the mud-density (mud-weight). The temperature correction
47 can be done as shown in formula (3), where the correction is
a linear function of the difference between the tool
temperature Ttooi and a reference temperature Tref. The latter is
t. The latter is typically the temperature at which the tool
is calibrated. y is the temperature coefficient of the density
measurement.
12a
CA 02230880 1998-03-02
RH~eorr = RHOuncorr ' {1 -~ ~' ', (Ttuol - ref )}
These corrections produce a corrected density 48. A possible mudweight
correction is
shown in formula (4), where prt,~d is the density of the mud in the borehole,
Bhs is the
diameter of the borehole, dia is the tool diameter and M,, M2.and M3 are
coefficients
determined through experiment and/or modeling.
RHOeorr = R~IOuncorr ' (1 - ~I (Pmud -1) ~ (Bh,S - d1a) M2 . a M3'RHO~ncorr
This step is folllowed by the determination of a correction term
deItaRHOLSava,~ab~e, 49
which is the difference between the long-spaced and the short-spaced density
50.
This difference is indicative of the effect of the tool standoff 51. A
correction based on
this difference deItaRHOLSa~anab~e is then applied to obtain the LS 52 and MS
53
compensated densities. The correction is a monotonic function of
deItaRHO~sa~anab~e
1~ and the standoff-corrected density is determined as shown in formula (5).
The
compensated I_S 52 and MS 53 densities are then averaged 54 to give the bulk
density RHOB 55.
RHOLS-corr -. RHOLS-uncorr + f(deItaRHOLSa~a~me) (5)
f(deItaRHOLSa"angb~e) can be an analytical function or it can be described by
a
sequence of straight line segments (segmented rib). Fig. 5a shows the
correlation
between the needed correction deItaRHO~~~ and the available correction
deItaRHOLSe~$;,ab~e. The data points in the figure represent many measurements
taken
at densities fronn 1.7 to 3.1 g/cc with simulated mudcakes of varying
thickness and
density. Most points follow a trend line but some points deviate
significantly. This is
due to the photoelectric effect of the mudcake or borehole fluid which is
overcorrected
in equation (1 ).
13
CA 02230880 1998-03-02
"Soft" gamma-rays are not very penetrating and are strongly affected by the
presence
of elements with a high atomic number Z in their path. Formula (1) corrects
for the
effect of the photoelectric factor of the formation. However, if the gamma-
rays travel
through high-c'_ borehole material (heavy mud and heavy mudcake) the
correction will
.5 be too large and the density answer will become inaccurate. This invention
therefore
limits the "soft" correction to obtain an accurate answer even in heavy mud.
The result
is shown in formula (6).
RHO =-A+B~111(W~rd)+C~111(Max(wso'~r Whard ( )
apparent W cal W cal '~ ~ W cal
hard soft hard
~ is the coefficient determining the minimum value that the W~n needs to have
compared to the high energy window Wham. The effect of this correction is
shown in
figures 5a and 5b. Fig. 5a shows the needed density correction (deItaRHO
needed) as
a function of the difference between the LS and SS apparent densities
(deItaRHOLSa~;;,~a~,e) without the limit on the density correction. Figure 5b
shows the
same data including the limit on the lithology correction. The data points are
labeled
15 . according to thE~ photoelectric factor of the mud and/or mudcake. The
apparent density
of the mid-spacing detector can be corrected in the same way as the long-
spaced
density. The preferred embodiment uses deItaRHOLSa~a~~ab~e which is determined
from
the difference of the long-spaced and short-spaced densities as shown in
formula (7).
20 RHOMS-corr _. RHOMS-uncorr + g(deItaRHO~sa~ana~e) (7)
The function for the MS correction is different from the one of the LS
detector.
The reason for preferably using deltaRHOLSaYa~~ab~e is shown in figures 6a and
6b. The
plot Fig. 6a Of deItaRHOLSa~anab~e versus the needed correction
deItaRHOMS~e~,ad
25 shows a much smaller dispersion fig. 6a than if deltaRHOMSaYanab~e is used.
The fact
that the data points of the plot Fig. 6a, fall on different lines as a
function of the stand off
of the tool can be used for additional corrections at large stand off.
In the preferred embodiment the final density answer is obtained as the simple
average of the compensated LS and MS densities as shown in formula (8a).
14
CA 02230880 1998-03-02
RHO~;"a; _ (R~IOLS~"~~ + RHOMS~,~~~)/2. (ga)
RHO,;~a~ _ (c1 " RHOLS~o,~~~+ + c2 * RHOMS~~,~~) (gb)
:5
A weighted average as shown in equation (8b), where c1 + c2 = 1 can be used,
too.
and it is possit>le to further correct the density based on the difference
between the
compensated IV1S and LS densities as shown in formula (9):
1CI RHOf;~a; _ (Rt-IOLS~"~t~ + RHOMS~"8~~)/2. + h(RHOLS~o"~~ - RHOMS~on~m)(9)
Other implementations of the algorithm are possible. In particular, the
correction for
borehole size and mudweight can also be performed on the final density answer
RHOBf;~a; instead of on the apparent single detector densities.
The phol:oelectric effect affects mainly the low energy (soft) gamma-rays,
while
the high-energy (hard) window is affected almost exclusively by the density of
the
formation. It is ilherefore tempting to use the ratio of soft/hard gamma-rays
as a
measure of the photoelectric factor of the formation.
The tradiilional PEF algorithm relies on the formula shown in equation (10).
It
uses the fact that low energy gamma-rays are much more affected by gamma-ray
absorption through the photoelectric effect than high energy gamma-rays.
Taking the
ratio between the number of counts in a low energy window (<120 keV) and a
high
~!5 energy window (>200 keV) is an indication of the photoelectric effect of
the formation.
= A ~ys°h + B
PEF + C ~h~rd (10)
CA 02230880 1998-03-02
This equation works well with tools using beryllium windows to allow low
energy
gamma-rays i:o travel from the formation to the detector with minimal
scattering or
absorption. In this case a window at very low energy (e.g. 30 to 70 keV) can
be used.
The count ratr: in this window is dominated by the influence of the
photoelectric effect.
If a titanium housing is used the gamma-rays at very low energy (30 to 60 keV)
are
strongly absorbed in the housing material. This requires the use of an energy
window
which includes higher energy gamma-rays to obtain a sufficiently precise
answer.
However, the count rate in this window is more affected by the formation
density. This
shows in cases where the PEF is high at a low density. This density effect can
be
corrected in a simple and elegant manner by a slight change of equation (10).
The
resulting equation (11 ) is shown below:
Wso~ + B
PEF + C (W,~ard ) a ( 11 )
The change consists of taking a power a of the count rate in the density
window
before forming the soft-hard ratio. If this power a is less than 1.0 then the
effect of
density is reduced. Figures 7a and 7b show an actual example of both
approaches. In
fig. 7a there is ~one point 60 which has low density and high PEF that does
not follow
the obvious trend when the two sides of equation (10) are plotted against each
other.
In Fig. 7b, equation (11 ) with a = 0.94 is used. Point 61 also with low
density and
high PEF is in (better agreement with the general trend. PEF can therefore be
derived
from the count rates as shown in equation (12).
PEF - 1
A Wsvfr_ + B C (12)
Whard'
The coefficients A, B and C can be functions of the borehole size. In
particular in the
preferred embodiment the coefficient A can be written as
16
CA 02230880 1998-03-02
A = Ao * (1 - const * (borehole size - tool diameter)) (f 3)
where const i;s a small number. This allows correction for the effect of the
borehole
fluid between the tool and the formation even if the tool is in good contact
with the
formation. If there is a significant mismatch between the curvature of the
tool and the
borehole only gamma-rays entering on the line where the tool touches the
formation
will not encounter borehole fluid in their path. The amount of borehole fluid
traversed
on average by the gamma-rays increases with increasing curvature mismatch. If
uncorrected, this leads to a bias in the answer.
If two detectors are used to determine the PEF of the formation and if the two
detectors
subtend significantly different azimuthal angles the fact that the average
path length of
the gamma-rays through the borehole fluid varies can be used to correct for
the effect
of the PEF of the borehole fluid.
1.'i
Fig. 8 shows the various steps needed to determine the photoelectric factor
from
the gamma-ray spectra. In a first step 70 which is the same for each detector,
the
gamma-ray count rate spectrum measured by each detector is acquired and
divided
into at least two windows ("soft" and "hard"). In a second step 71 the window
count
rates are corrected for count rate losses due to electronic deadtime and the
background window count rates from the detector stabilization source are
subtracted.
In a third step T3 the net window count rates are normalized 73 (calibrated)
by the
respective net vvindow count rates from the tool calibration. This gives the
calibrated
window count rates 74, which are corrected for tool temperature 75. In a forth
step the
single detector photoelectric effect is determined according to equation (12),
where
some or all coeilficients (A, B, C) can be functions of the borehole size 77
and/or
mudweight. If F'EF is measured by more than one detector, the resulting single
detector PEFs 78 can be combined in steps 79 and 80 to obtain a PEF 82 which
is
compensated for the photoelectric effect of the mud and the tool stand off. To
17
CA 02230880 1998-03-02
accomplish this additional information such as deItaRHOava,~ab~e 8~ may need
to be
added to the computation.
PEF can be determined from all the detectors in the array. This allows two
things:
Compensation for the density and photoelectric effect of the mudcake and for
standoff.
Quality control by comparing the photoelectric factors determined by two or
more detectors.
Compensation for mudcake and standoff is dissimilar from compensation for
density.
The difference of PEF between two detectors depends on the collimation of the
detectors, the standoff and the density and photoelectric factor of the mud or
mudcake.
The corrected Pef is therefore not only a function of the difference in Pef
between two
detectors, it also depends on the measured density and the difference dRHO
between
the single detector densities.
1 _'i
PEF_co~rr = PEF + g(dPEF, dRHO, FEF and RHO) (14)
PEF is the single detector density computed from one of the detectors, dRHO is
the
difference betvween the LS and SS or MS and SS single detector densities and
dPEF
is the differencE~ between the PEF of two detectors. RHO can be the corrected
density
or on of the single detector densities.
In density logging it is possible that situations arise in which the answer is
inaccurate or wrong. It is important to have quality controls which indicate
when the
tool answer is no longer reliable.
The use of an array of three or more detectors makes it possible to use the
consistency befi~reen the responses of the detectors to indicated situations
in which
the tool is not able to give a reliable answer or to indicate a failure in the
tool.
:30 Traditional (two-detector) density tools rely on single detector quality
checks (quality
18
CA 02230880 1998-03-02
ratios) and thE~ size of the correction applied in the spine-and-rib algorithm
to infer the
validity of the results. However, deltaRHOaya;me is not an unambiguous quality
indicator since' it can wrongly indicate good data, even if the tool is
experiencing
excessive standoff. A combination of answers from the three detectors is a
more
.5 accurate and suitable way to detect and indicate bad data quality. It is
based on the
following quantities, which are derived from the apparent densities measured
by the
three detector,;.
dMS = (RHONIS-RHOSS,,;9h)/RHOLS
1 (1
dLS = (RHOL,~.>-RHOSS",~)/RHOLS (16)
If the quantities. (1 ) and (2) above are plotted against each other one
obtains the plot
shown in figure 9. RHOMS is the apparent mid-spaced density (corrected for the
15 effect of borehole size and mudweight), RHOLS is the apparent long spaced
density.
RHOSSm~ denotes the apparent short-spaced density from a gamma-ray energy
window which lies in the middle of the spectrum (around 300 keV for a tool
using a
'3'Cs source). I~HOSShigh refers to a higher energy window (about 400 keV).
The
position of the energy windows needs to be determined through experiment and
20 modeling for any particular array density tool.
The quality factor is determined as described in figure 10. The first four
steps
90 through 97 are the same as in the density algorithm and serve to determine
the
four or more apparent single detector densities 96 which are corrected for
mudweight
'. 5 97 producing corrected densities 98. In the sixth step 99 the ratios of
equations 15
and 16 are determined. In a seventh step 100 it is determined if the set of
the two
ratios falls into a predetermined region in the crossplot. The quality factor
101 is then
determined as the distance of the data points from the boundary of the
predetermined
region. DistancE~s which are inside the boundary are arbitrarily called
positive and
19
CA 02230880 1998-03-02
those outside the boundary negative. A negative quality factor then indicates
questionable or bad data.
Compared to the density processing two apparent densities are determined
:5 from the short-spaced detector calibrated window count rates. This is
indicative of the
fact that different energies of the scattered gamma-rays also correspond to
different
depths of investigation. The selection of the appropriated energy windows,
which may
differ from the ones used for the density algorithm has to be done through
experiment
and modeling.
The methods of this invention provide significant advantages over the current
art. The invention has been described in connection with its preferred
embodiments.
However, it is not limited thereto. Changes, variations and modifications to
the basic
design may be made without departing from the inventive concepts in this
invention.
In addition, these changes, variations and modifications would be obvious to
those
skilled in the arlt having the benefit of the foregoing teachings. All such
changes,
variations and rnodifications are intended to be within the scope of the
invention which
is limited only by the following claims.