Note: Descriptions are shown in the official language in which they were submitted.
CA 02250125 2004-O1-29
1
IN-VITRO DETECTION OF REACTIONS IN BLOOD TO FOREIGN SUBSTANCES
FIELD OF THE INVENTION
The present invention is directed to the field of medical diagnoses, and, more
specifically, diagnoses performed by detecting reactions in blood caused by
the presence of
foreign substances therein, conventionally referred to as the "MRT" Test.
BACKGROUND OF THE INVENTION
The MRT Test relates to the field of hypersensitivity reactions observed in
humans
and animals. These reactions can be due to contact with offending substances
such as
medications, environmental chemicals, foods, carcinogens, food additives, etc.
The MRT Test is an in-vitro assay which indirectly detects the release of
mediators
in whole blood after it is mixed with a test substance. When a patient's blood
reacts with the
test substance, intracellular fluids are released, causingthe liquid portion
ofblood to increase,
while the total volume of the solids present in the blood decreases. These
reactions may be
caused by various immunologic and non-immunologic mechanisms.
About blood:
Blood is a liquid that circulates throughout the body using the vascular
system and
is in contact with practically every cell in the body. Blood delivers oxygen,
food and other
essential elements to ail of our cells. Approximately 50% of blood is a fluid
called serum (or
plasma). It is a complex mixture of water, various proteins, carbohydrates,
lipids, and
electrolytes. Small amounts of other substances such as vitamins, minerals,
and hormones
are also found in blood. The other 50% of blood is comprised of solids such as
erythrocytes
(red blood cells: RBC}, leukocytes (white blood cells: WBC}, and thrombocytes
(Platelets).
The white blood cells are a significant part of our body's immune system. The
immune system is highly complex and intricate in its design and is responsible
for defending
against foreign invaders such as bacteria, viruses, and other pathogens. The
science of
immunology incorporates the study of resistance to infections and the
rejections of so called
"foreign substances".
Gell and Coombs in their 1962 book, Clinical Aspects oflmmunology, have
identified
various immune mediated hypersensitivity reactions and categorized them as
Types I-N,
CA 02250125 2004-O1-29
2
based upon the mechanics of the reaction. Types I, II. and III are identified
as antibody
mediated and the fourth one is described as cell mediated.
It is understood that Type I is the most widely occurring hypersensitivity
reaction. It
involves Mast cells and basophils, which bind IgE through their Fc receptors.
After
encountering the antigen, the antibody induces degranulation (the destruction
of the exterior
wall of the cell) and release of mediators.
Type II reactions involve the binding of antigen and antibody on the surface
of a cell,
generally resulting in the destruction of the cell. As is the case in a Type I
reaction, the final
outcome of this reaction generates the release of cellular contents (including
the release of
the mediators}.
Type III reactions address the interactions of cells with complexes. Immune
complexes, when deposited on tissue, cause complement activation, which in
turn attracts
polymorphonuclear leukocytes ("polymorphs"). As their normal response, the
polymorphs
will attempt phagocytosis on the complexes, but in many instances the
complexes will be
trapped by the tissue, blocking phagocytosis. As a natural course, polymorphs
will release
inflammatory mediators.
Type IV reactions involve sensitized T-lymphocytes. After the second contact
with
a specific antigen. T cells release lymphokines, which produces an
inflammatory response, and
in turn attracts mediator-releasing macrophages.
This is an accepted theory, which generally explains the partial release of
cytoplasm
and mediators into the blood stream, or upon tissue as a result of such
reactions. As these
reactions occur, the volumetric level of the plasma will change.
As observed under the microscope, there are two possible reactions triggered
by
offending substances:
a. release of liquid (substance, cytoplasm and mediators) from cells, causing
decrease in solids/liquid volumetric ratio in blood; or
b. consumption of liquids, causing increase of solids/liquid ratio in blood.
It appears that at any time human blood can react one way or the other.
However,
it was also observed that usually only one type of reaction takes place at a
time.
It is contemplated that similar phenomena takes place by reason of.contact
with
chemical substances such as gases (aerosols, pesticides, gases, cigarette
fumes), paints,
perfumes, oils, gas, thinners, air fresheners, food additives, drugs, and many
other substances.
There is very little scientific explanation why humans and animals react to
the above
named substances. Some theories suggest a classic allergic reaction, while
others state that
CA 02250125 2004-O1-29
3
lack of specific enzymes, helping to neutralize foreign substances, are the
reason for those
reactions.
In summary, reactions caused by immune, toxic, pharmacological and other
mechanisms may cause the release of mediators into the blood stream.
Current methods of diagnosis exist for measuring the degree of reaction a
patient's
blood may have with a suspected allergen, by measuring the size and number of
blood cells
in a patient's blood. Such tests are described in my prior U.S. Pat. Nos.
4,614,722;
4,788,155; and 5,147,785, to which the reader is directed for reference. In
essence, these
patented tests operate by comparing the number and size of cells in a
patient's blood before
and after exposure to a foreign substance. If there is a signif cant cellular
shift after exposure,
then a positive reaction is determined.
These tests, while a significant improvement in the art at the time they were
made,
have a drawback, in that they do not effectively measure small differences in
cell sizes caused
by the described ceilular reactions.
Currently, no tests are known which may test for the ,reaction blood cells
have to
foreign substances resulting in changes in plasma volume independent of
changes in cell size
distributions.
OBJECTS AND SUMMARY OF THE INVENTION
Accordingly, it is an object of the invention to provide an improved method of
determining cellular reaction caused by foreign substances, which overcomes
the drawbacks
of the prior art.
It is a further object of the invention to provide an improved method for
diagnosing
maladies caused by the presence of foreign substances in a patient's blood, by
measuring the
volume of plasma, or the volume of solids, in a patient's blood before and
after exposure to
a foreign substance whose effects are under consideration.
Briefly stated, there is provided a method of detecting reaction in blood
caused by the
presence of a foreign substance in the blood, comprising the steps of
establishing a potential
across a predetermined spatial volume; passing a first portion of the blood
through the
predetermined spatial volume; substantially continuously measuring tire
potential across the
predetermined spatial volume over a first predetermined period of time;
comparing the
measured potential with a baseline; and calculating the total volume of solids
in the first
portion ofthe blood as a function of a total absolute deviation ofthe measured
potential from
the baseline. The same procedure is then followed with a second portion of the
blood, after
CA 02250125 2004-O1-29
4
it has been exposed to the substance whose reaction is being determined. The
two
calculations are then compared, with a positive reaction being indicated when
the two
measured solid volumes are measurably different. The baselines are preferably
dynamic
baselines, and are determined with reference to the starting point of a sharp
rise in the
measured potential.
In accordance with these and other objects of the invention, there is provided
an in-
vitro method for detecting a reaction in blood caused by foreign substances,
comprising the
steps of establishing a first potential across a first predetermined spatial
volume; passing a
first portion of the blood through the first predetermined spatial volume;
substantially
continuously measuring the first potential over a first predetermined period
of time;
comparing the measured first potential with a first baseline; calculating the
total volume of
solids in the first portion of the blood as a first function of a total
absolute deviation of the
measured first potential from said first baseline; exposing a second portion
ofthe blood to a
foreign substance; establishing a second potential across a second
predetermined spatial
volume; passing the second portion of the blood through the second
predetermined spatial
volume; substantially continuously measuring the second potential over a
second
predetermined period of tune; comparing the measured second potential with a
second
baseline; calculating the total volume of solids in the second portion of the
blood as a second
function of a total absolute deviation of the measured second potential from
the second
baseline; and comparing the total volume of solids in the second portion of
the blood with the
total volume of solids in said first portion ofblood, whereby a positive
reaction is established
when the total volume of solids in the second portion of blood differs from
the total volume
of solids in the first portion of blood by more than a predetermined error
factor.
According to another feature of the invention, there is fiirther provided an
irr-vitro
method for detecting a reaction in blood caused by foreign substances,
comprising the steps
of establishing a first potential across a first predetermined spatial volume;
passing a first
portion of the blood through the first predetermined spatial volume;
substantially
continuously measuring the first potential over a first predetermined period
of time;
comparing the measured first potential with a first dynamic baseline;
calculating the total
volume of solids in the first portion of the blood as a first function of a
tote) absolute
deviation of the measured first potential from the first dynamic baseline;
exposing a second
portion of the blood to a foreign substance; establishing a second potential
across a second
predetermined spatial volume; passing the second portion of the blood through
the second
predetermined spatial volume; substantially continuously measuring the second
potential over
a second predetermined period of time; comparing the measured second potential
with a
second dynamic baseline; calculating the total volume of solids in the second
portion of the
CA 02250125 2004-O1-29
blood as a second function of a total absolute deviation of the measured
second potential
from the second dynamic baseline; and comparing the total volume of solids in
the second
portion of the blood with said total volume of solids in the first portion of
blood, whereby a
positive reaction is established when the total volume ofsolids in the second
portion ofblood
5 differs from the total volume of solids in the first portion of blood by
more than a
predetermined error factor.
The above, and other objects, features and advantages of the present invention
will
become apparent from the following description read in conjunction with the
accompanying
drawings, in which like reference numerals designate the same elements.
BRIEF DESCRIPTION OF THE FIGURES
Figure I illustrates an idealized particle (balloon) having a volume of.300
~1, in a unit
vohrme of I ml of a suspension, leaving a liquid volume of 700 ~tl;
Figure 2 illustrates an identical unit volume of 1 m! (not drawn to scale), in
which the
particle has a volume of only 100 p1, and the liquid a resultant volume of 900
p1;
Figure 3 illustrates an actual oscilloscope reading of a series of particles
being
measured as they pass through the electromagnetic field under observation;
Figure 4 shows a close up of some oscilloscope readings such as depicted in
Figure
3;
Figure 5 shows a smoothed curve showing three particles passing through the
electromagnetic field being measured;
Figure 6 shows an idealized representation ofa series ofparticles passing
through the
electromagnetic field; and
Figure 7 shows an idealized representation ofa comparison oftest and control
sample
readings as the particles pass through the electromagnetic field.
DETAILED DBSCR.1PTION OF THE PREFERRED EMBODllVIENT
The MRT Test relies in large part upon the performance of the test described
in my
PCT application, W09705475, and reference is made thereto for a more complete
understanding of the mechanics of the testing being done. The following is
presented for
convenience of reference.
CA 02250125 2004-O1-29
6
Description of the MRT procedure:
1. Supplies and Instrumentation.
2, Blood collection and test preparation.
3. Testing.
4. Results.
I. Supplies and Instrumentation.
(supplies and instrumentation may vary to some extent and depend on the type
of testing
CA 02250125 1998-09-25
WO 97/36169 PCT/US97/04849
instrument employed for the MRT Test. In this case I have chosen the semi-
automated
STS 100 manufactured by Signet Diagnostic Corporation, and the following
description is
made with that device as a reference).
100 p1 - 500 ~l adjustable mufti pipette
10-20 ml dispenser, e.g. an Oxford pipetor to dispense the electrolytic
solution mixed with
a lysing agent
body temperature incubator, e.g. by Precision Scientific
60-100 rpm rotator, e.g. by Roto Mix
70 ml blood dilution vial with diluent
lysing reagent (as described in my prior patents) 8 ml vial
testing cuvettes with reagents. The reagents are dried and diluted food
extracts, e.g. by ALK
or Bayer. Their concentration varies from 1:400 to 1:2,000.000 depending upon
their toxicity
isotonic (electrolytic) solution, e.g. Osmocel Isotonic Solution by Hematronic
Apparatus, STS 100 or STS200 made by Signet Diagnostic Corp.
1 S Z. Blood collection and test preparation.
I. Draw 5-10 ml of blood into a vacutainer containing 3.8% citrate solution
without the "buffer"
(citric acid, which may, itself, be an allergen).
II. Pour collected blood into the blood dilution vial.
III. Using the mufti-pipette, transfer 700 ~l of diluted blood into panels of
control and sample
cuvettes (each panel will have at least one control cuvette and at least one
sample cuvette).
Control samples contain no reagent. Test samples contain a small amount of a
substance
being evaluated. the "reagent". The control sample serves as a fingerprint of
the patient's
blood. The test sample provides information related to the reaction of the
tested substance
to the reagent being tested.
IV. After transferring blood to all tested samples, mix all cuvettes and cap
them.
V. Place tray on the top of the rotator in the incubator. Turn the rotator on.
VI. Incubate for 30 minutes at body temperature.
VII. Remove from incubator and follow by 30 minutes room temperature
incubation. Total of 60
minutes incubation.
7
CA 02250125 2004-O1-29
g
3. Testing:
The MRT Test, the new proprietary laboratory method, can be described in
thefollowing fashion:
a. incubation of predetermined amount of blood in its native form which serves
as the
fingerprint for the test.
b. Incubation ofa predetermined amount ofblood mixed with tested substance (at
least
1 test sample).
c. Measure total volume of liquid and/or solids in native blood sample by
means of the
method described in my prior PCT application, W09705475.
d. Measure total volume of liquid and/or solids in the mixture of blood and
tested
substance sample. Ifin step "c", you measure liquids, then do so here.
Likewise with solids,
so that comparisons may be made "like-to-like".
e. Repeat step "d" for each tested substance. This may be done in parallel,
i.e. several
test measurements taken at the same time, or one after another. The parallel
arrangement,
however, is the most time-effective.
f. Identify volumetric differences of liquid volume and or solid volume
between native
blood sample and the tested blood sample.
g. Prepare the results identifying the measured volumetric differences.
h. Identify the positive and negative reactions, by noting which reagents
produced a
measurable reaction, i.e. one greater than the standard deviation expected for
the test,
calculated in known fashion.
The in vitro trend in the Geld of allergy, is to measure levels of specific
immunogtobulins and detect the presence of individual mediators. In my
research studies, I
have identified that more then one mechanism may be employed in adverse
reactions to
foreign substances. By measurement of volumetric differences in plasma we may
deliver
more comprehensive answers.
Figure I represents a small cuvette containing 1 ml of heterogeneous fluid.
The liquid
portion is equivalent to 700 ~1. The balloon filled with black ink has an
equivalent volume
of 3 00 p.1. Note that for purposes of measurement the balloon would be
considered as a solid
entity. Figure 2 represents the same cuvette after the balloon has released
200 ~1 of its ink
into the external liquid. The Total volume of suspension is still I ml. The
volume of the
liquid has increased to 900 ~1 and the volume of the balloon has decreased to
I00 p1.
CA 02250125 2004-O1-29
9
This example illustrates how human blood cells react in the body. When the
reacting
substance is introduced to the blood, it triggers a series of complex
reactions. In the end, the
intracellular fluids will be released into the plasma, changing the original
ratio of solids to
liquid. The ratio is the key for identifying the malady (the intracellular
liquids contain the
mediators causing the clinical symptomology}, but the ratio can be determined
easily from a
measurement of either the solid or the liquid volume per unit volume ofthe
blood suspension.
There are many instruments widely used in the field ofhematology, which employ
the
electrical resistance principal of counting and sizing. It is based on the
fact that human cells
are poor conductors of electricity, while plasma is a good conductor.
The basic apparatus is shown in my prior PCT patent application, W09705475,
and
includes an aperture tube in which the blood suspension is drawn into an
orifice and along an
aperture. An electromagnetic field is imposed upon the aperture, and the blood
suspension
is drawn through the field. Since the liquid ofthe suspension is essentially
homogeneous, and
conductive, while the blood cells are resistive, with their resistivity
varying with their size, the
size of the blood cells passing through the aperture may be calculated by
measuring the
perturbation of the field as the particles pass therethrough.
As cells pass through the aperture, the change of voltage that occurs is
registered by
the instrument. All instruments known prior to my inventive method (described
in my co-
pending PCT application, W09705475) measure the peak of the impulse produced
by the
resistance of cell. A specific threshold is set during calibration which
controls the minimum
level of signal detection. This in turn lowers the presence of the
electronic'"noise". When
the voltage change exceeds the level of the threshold, the instrument wiU
identify the peak of
that impulse. This method is commonly called the "impedance" or "peak
detection method".
To conduct the MRT Test, one needs a very precise measurement of the volumes
of
liquids and solids in tested fluid. Common hematology instrumentation does not
posses high
precision for volumetric measurement and even though they are accepted in the
hematology
field, they cannot register very small volumetric changes occurring in cells
during reactions.
For that reason I developed my new (PCT} patent pending method, described in
W09705475, for measuring the volume of solids in a suspension. Like many
hematology
instruments, it employs the principal of resistance, illustrated by Ohm's Law:
CA 02250125 1998-09-25
WO 97/36169 PCT/US97/04849
VVOLTAGE - ICURRENT x RRESISTANCE
The new method does not adhere to the standard peak detection. It continuously
measures
the flow of volume of liquid and solids in the tested liquid.
The actual measurement will appear, if taken graphically, to be the same as an
oscilloscope
reading in time and resembles a continuous electrical wave signal (see the
actual computer printout
identified as Figure 3).
The series of spikes represent particles causing small disturbances in the
electrical field. The
longer and higher the pulse, the greater the volume of the particle (See
printout identified as Figure
4).
Accordingly, a smaller particle will create a shorter disturbance of a smaller
magnitude, and
a larger particle will cause a longer disturbance of a greater magnitude.
There is a definite
relationship between the length, height and volume of the tested particle.
Since the STS200
apparatus measures with a frequency better then 1 MHZ, it is easy to identify
the relationship
between the size of the particle and the time it will need to pass through the
orifice. Figure 5
explains how the MRT measurement works and how it differs from the Coulter
Method.
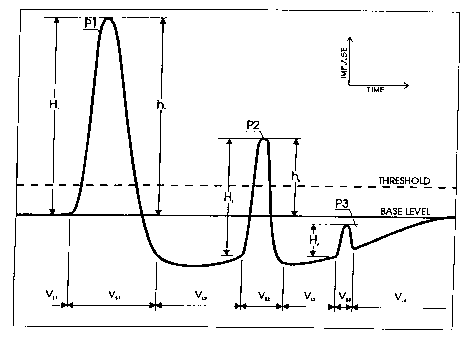
The description of the (Prior Art) Coulter Method.
A disturbance caused by particle "P1" produces the spike with the peak high's
marked "h,".
It is measured from the base level up to the peak of the signal. After the
particle travels the length
of the aperture, the measured signal experiences a "bounce" in which the
measured signal goes below
the original baseline, and gradually goes on an upward gradient towards the
original baseline. But
a subsequent particle may often enter the aperture before the "bounce" is
over. For example, in Fig.
5, second particle "P2" starts its disturbance below the static base level.
The height of hz is measured
from the baseline and clearly shows, that the result is not very accurate
since the true disturbance
commences below that level. The third particle (P3) is a platelet and its
electrical disturbance is
entirely below the base level, due to the large "bounce" caused by P2, and so
is invisible to the
instrument.
Disadvantages:
The lower size limit of particles which may be measured is determined by the
static noise
threshold established during calibration. The upper size limit is related to
the physical size of the
CA 02250125 1998-09-25
WO 97!36169 PCT/L1S97/04849
aperture. A major problem associated with electric resistance particle
counting and sizing becomes
evident when attempts are made to evaluate two dissimilar particle sizes at
the same time using the
same aperture, e.g. simultaneous measurement of erythrocytes and platelets.
After cells pass through
the orifice, some re-enter the electrical field with the pulse resembling the
size of platelets. Threshold
and electrical "noises" are also a substantial problem. A specific constant
threshold is set during the
' calibration which controls the minimum level of signal detection. This in
turn lowers the presence
of the electronic "noise". When the voltage change exceeds the level of the
threshold, the instrument
will identify the peak of that impulse. This is the basis of the peak
detection method.
Description of the MRT (Ribbon) Method.
According to the inventive method, an instrument continuously measures the
level of the
electromagnetic field as the suspension flows through the orifice, regardless
of the level of the signal.
Examples of the signal measurement are represented by "H" in Fig. 5. Compare
this reading with
the prior art method represented by "h". After the particle "P!" passes
through the orifice, the signal
dips down below the threshold and the baseline. The Coulter method stops the
measurement when
the signal goes below the threshold level, but the new measurement follows the
signal and measures
the time of impulse "P 1 " which is "V5, ", the time it takes for particle P 1
to stop disturbing the
measured signal. The time is measured as the duration of the interval
commencing when the
gradient of the curve begins to indicate the presence of a particle until the
measured signal returns
to its original level. The presence of the particle is indicated when the
gradient increases for a
predetermined period, preferably corresponding to at least three consecutive
measurement clock
cycles.
As the particle leaves the orifice, the instrument measures time identified as
"V~2". This is
the time it takes fluid to pass through the orifice. As we approach the point
"VSZ", another particle
"P2" enters the orifice. The signal is still below the static threshold and
the static baseline, but the
STS 100 instrument recognizes the condition and begins to measure the solid
particle. This
establishes a dynamic baseline, which is defined as the value of the measured
signal when the
gradient of the curve begins to increase. The height of the perturbation of
the signal is therefore
measured as H~, from the dynamic baseline, rather than from the static
baseline as shown by h,. This
more accurately reflects the true size of the perturbation of the signal, and
therefore the size of the
particle.
The duration of the signal identified as "VLZ" is another important part of
the measurement.
11
CA 02250125 2004-O1-29
12
If we look at signal "P3 ", it is evident, that the whole impulse is contained
below the
baseline. The volume of the solid, identified by time "Vs," and measured from
the dynamic
baseline becomes part of the measurement. The MRT Ribbon Method thus correctly
measures all particles suspended in the electrolytic solution. There is a
definite relationship
between the length, height and volume of the tested particle. Since the STS200
apparatus
measures with a frequency greater then 1 MHZ, it is easy to identify the
relationship between
the size of the particle and the time it will need to pass through the
orifice. Also the flow of
fluid is identified.
It has been determined, as well, that the gradient ofthe curve on the upward
slope of
the curve when a particle is present also varies with the size of the
particle, larger particles
having a steeper slope, The exact relationship depends upon the configuration
of the system,
and may be determined with some minor experimentation depending upon the
parameters of
the equipment being used. Thus, the gradient may also be used to calculate the
size of the
particles.
One point should be made about correction of the rough signal shown in Figure
4.
As described in my earlier PCT application, W09705475, the actual size of a
particle is
represented by the "ttough" between the peaks of the measurement curve shown
on either
the right or left of the figure. The value of the trough is the one selected
to represent the
corrected height of the curve.
The flow of fluid is also identified. Figure 6 graphically represents how the
STS200
identifies the volume of solid and the volume of liquid.
Letter A represents the beginning of the test:
VL= Volume in time in which an instrument measures the liquid VS= Volume in
time
in which an instrument measure the solid particle. Total measured volume:
VT = VLT + VsT where
V~,. = V,., + . . . +VI," and VST = VS, + . . . +V~,
During the measurement, the fluid flows through the orifice. The liquid
portion is
characterized by the flat impulse line and the solid portion is characterized
as the visual
disturbance in the flat impulse signal. As the 1 ml (volume of 1 ml is given
only as an
example) of diluted blood passes through the orifice, the computer software
program
quantifies the cumulative volume of liquid and cumulative volume of solids in
accordance
with the rules established, here.
CA 02250125 1998-09-25
WO 97/36169 PCT/US97/04849
There are at least three different ways of data collection and results
presentation:
1. Measure 1 ml (or other predetermined volume) of the diluted blood sample.
Calculate the
total volume of all solids and subtract them from 1 ml. From the difference,
the total volume
of liquid in the 1 ml of blood suspension will be given and the volume of
liquids in the
control and test sample can be compared; or
' 2. Compare only the total volume of solids in the two samples; or
3. Compare the ratio of solids to liquids (or liquids to solids) in the two
samples.
Each of these measurements is essentially the same, and any one (or more) of
them may be
used at the convenience of the user, as desired.
Step By Step Testing Procedure:
For purposes of visualization I will describe the MRT procedure conducted on
the STS200
continuous flow instrument.
After proper test preparation (see section 2), take incubated cuvette
identified as a "control"
and gently mix. Draw 100 ~1 of diluted blood and transfer it into empty
cuvette. You will have two
control cuvettes, one containing 600 p1 and another 100 ~1 of diluted blood.
Dispense 10 ml of
isotonic solution into each cuvette. Additionally add 100 p1 of lysing agent
to the cuvette containing
600 p1 of suspended blood. Place both cuvettes on the stage and start the test
run. An instrument
will measure the volume of one ml of the suspended blood in both cuvettes one
after another and will
display detailed information on how many femtoliters (fl) of liquid is present
in one milliliter of
suspended whole blood. The next step repeats the preparation process of the
sample cuvette. Draw
100 p1 of diluted blood from the incubated sample test cuvette. Transfer it
into the empty cuvette.
Dispense 10 ml of isotonic solution into each cuvette. Add 100 ~l of lysing
agent into the cuvette
containing 600 u1 of suspended blood. Place both cuvettes on the stage and run
the test. Repeat the
cycle for each additional sample tested. Results will be calculated from the
information obtained
from all samples, by comparing the total volume of liquid of control sample to
the total volume of
liquid of the substance sample. We will obtain two results from each
substance. One sample will
give us information on the activities of the Red Blood Cells (RBC) and another
sample will inform
us_~n reactions of all other then RBC blood components in presence of tested
substance. It is not
mandatory to conduct the MRT Test in this exact fashion. Per individual need,
one can conduct the
partial test obtaining results from the first or the second solution only.
13
CA 02250125 2004-O1-29
14
4. Results
The computer will establish the volumetric baseline of the plasma (liquid)
present in
one cubic millimeter of control blood sample. Once the baseline is
established, the actual
volume of plasma present in each milliliter of each blood sample will be
calculated and
compared against the actual volume of plasma in the control sample. If liquid
volume in the
control sample significantly varies from liquid volume in the test sample, the
tested substance
is identified as reacted. A significant reaction would be one greater than
could be attributed
to the known instrumentation error plus the standard deviation for
similarmeasurements. Any
difference of less than that amount would not necessarily indicate a positive
reaction, since
it could be attributed to statistical or instrumentation error.
Figure ? portrays the measurement ofthe blood sample distribution ofthe
Control and
Test Samples. The differences between the distribution patterns would he due
to the
exposure of the Test Sample to the tested substance.
The computer program will calculate the variation and save it as the results
data.
)''nterpretation of results will be based on the standard deviations and other
generally accepted
laboratory methods of results interpretation.
It will be appreciated by those of ordinary skill in the art that the
measurements ofthe
electromagnetic signal described above may be made of either the voltage or
the current,
since it is the resistance within the aperture which changes and the imposed
field is otherwise
constant.
Advantageous embodiments ofthis invention may provide an in-vitro method which
will identify reactions caused by various test substances.
Moreover, embodiments ofthis invention may identify the volumetric differences
in
the level of plasma in non-treated blood vs. the level of plasma in treated
blood.
Also, embodiments of this invention provide a unique way to solve the problem
of
identifying maladies which are otherwise difficult to diagnose.
Having described preferred embodiments of the invention with reference to the
accompanying drawings, it is to be understood that the invention is not
limited to those
precise embodiments, and that various changes and modifications may be
effected therein by
CA 02250125 2004-O1-29
14a
one skilled in the art without departing from the scope or spirit ofthe
invention as defined in
the appended claims.