Note: Descriptions are shown in the official language in which they were submitted.
CA 02339006 2007-07-27
63129-11j
METROD ANI- AP:E'.A.RATIIS VdR DETERM2LITTNG
.AN'1'ICOAGUIaANT THERAPY FACTORS
SACICGROLTNI7 OF TEiF IM'ENTIO1~
1 Fie1c~ a~ the Xaven~iaa
This invert.tiou relates to a relatively simple, yeL
accurate met.hod and apparatus for mos.itoring ora1.
anticoagu7.ant therapy tbat takes irito accoumt va.rying
prothrombin times caused by different sensitiva.ti.es of va.:ious
thromboplastin formed from rabbit brain, bovine brain, or
other sources all used for oral anticoagulant therapy.
2. Descxivtion of the Pra.o7-7Axt
To prevent excessive bl.eedin.g or deleterious blood clots,
a patient may receive ora1, anticoagulant therapy befox=e,
during and after surgery. To assure that the oral
anticoagulant therapy is properly admzna.steXed, strict:
monitoring is accomplished and, is;more fully describeci in
various medical technical literature, such as the art:~-cles
entitled "PTs, PR, ISIs and INRs: A Primer on Prothroznbin
Time Reporting Parts I and II" respectively published
JVavernber, 1993 and DeGerriber, 1993 issues oT Clin,i.cal
t-I.moGt sis Review,
~
CA 02339006 2001-01-30
WO 00/07012 PCT/US98/15972
These technical articles disclose anticoagulant therapy
monitoring that takes into account three parameters which are:
International Normalized Ratio (INR), International
Sensitivity Index (ISI) and prothrombin time (PT), reported in
seconds. The prothrombin time (PT) indicates the level of
prothrombin in a plasma sample and is a measure of the
coagulation response of a patient. The INR and ISI parameters
are needed so as to take into account various differences in
instrumentation, methodologies and in thromboplastins' (Tps)
sensitivities used in anticoagulant therapy. In general,
thromboplastins (Tps) used in North America are derived from
rabbit brain, those previously used in Great Britain from
human brain, and those used in Europe from either rabbit brain
or bovine brain. The INR and ISI parameters take into account
all of these various different factors, such as the
differences in thromboplastins (Tps), to provide a
standardized system for monitoring oral anticoagulant therapy
to reduce serious problems related to prior, during and after
surgery, such as excessive bleeding or the formation of blood
clots.
As reported in Part I (Calibration of Thromboplastin
Reagents and Principles of Prothrombin Time Report) of the
above technical article of the Clinical Hemostasis Review, the
determination of the INR and ISI parameters are quite
involved, and as reported in Part II (Limitation of INR
Reporting) of the above technical article of the Clinical
Hemostasis Review, the error yielded by the INR and ISI
parameters is quite high, such as about 13%. The complexity
of the interrelationship between the International Normalized
Ratio (INR), the International Sensitivity Index (ISI) and the
patient's prothrombin time (PT) may be given by the below
expression (1),
wherein the quantity Patient's PT is commonly
Mean of PT Normal Range
2
SUBSTITUTE SHEET (RULE 26)
CA 02339006 2007-08-08
63129-113
referred to as prothrombin ratio (PR)
INR Pa t.i en t's PT zsz (1 ~
-[ Mean of PT Normal Range,
The possible error involved with the use of International
Normalized Ratio (INR) is also discussed in the technical
article entitled "Reliability and Clinical Impact of the
Normalization of the Prothrombin Times in Oral A.nticoagulant
Control" of E.A. Loeliger et al, published in Thrombosis and.
Hemostasis 1985; 53: 148-154. As can be seen in expression
(1), ISI is an exponent of INR which leads to the possible
error involved in the use of INR to be about 13.5% or
possibly even more. A procedure related to the calibration
of the ISI is described in a technical article entitled
"Failure of the International Normalized Ratio to Generate
Consistent Results within a Local Medical Community" of
V.L. Ng et al, published in Am. J. Clin Pathol 1993;
99: 689-694.
The unwanted INR deviations are further discussed in the
technical article entitled "Minimum Lyophilized Plasma
Requirement for ISI Calibration" of L. Poller et al 'published
in Am J Clin Pathol February 1998, Vol. 109, No. 2, 196-204.
As discussed in this article, the INR deviations became
prominent when the number of abnormal samples being tested
therein was reduced to fewer than 20 which leads to keeping the
population of the samples to at least 20. The paper of L.
Poller et al also discusses the usage of 20 high lyophilized
INR plasmas and 7 normal lyophilized plasmas to calibrate the
INR. Further, in this article, a deviation of +/-
3
CA 02339006 2007-07-27
631'29-113
10¾ from mear s 4Ja5 d_sCUssed as beir,g an accep7-able 14 n14 t of
IIqR devi atior ^urL'ner sr-a i l, chi s ar*_-u1.-. discusses r.ne
cvaluazion teahn=qu.es of Laking inr.o acCouAL the prothz-amhin
ratio (PI?) and the mean normal prqthrombin tizne (MN'P?') , i.e. ,
the geometric mean of normal plasreia samples.
The disciepancies related to the use of the TNP, ax'e
further studied and described in the techuic al article of V.L.
NG et a7, entitled, "Highly Sensitive Thrornboplastins Dn Not
Improve INR Prec:sion," published :-n hmerican Journal of
CJ.inacal Pathology, 1998; 209, No. 3, 338-346. In thiEa
article, the clinical signa.ficanee. of INR discordance :Ls
examined with the results being tabulated in Tab1e 4 therein
and which are analyzed to conclude that the level of
discordance for paired values of iTidividual specimens tested
with different thromboplastins disadvantageousl.y range from 17%
to 29 s.
zt is desired that a method for monitoring oral
anticoagulant therapy be provided that does not have the
drawbacks of requiring the detezrm..i.nation of the INR. anci ISI
parameters and that does not suffer from the relatively high
(13ro) error sometimes occurring because of the use of these
INR and ISI parameters with the exponents used in their
determination.
Accordingly, it is a primary object of the present
invention to provide a mezhod and appaxatus therefor, Eor
accurate, yet simple, monitoring of oral anciCoagulazit therapy
without any of the drawbacks and disadvantages of the _arior
art moni.toring that relied on the INR and ISI paramete:rs.
This a.nvention relates to the a.nvention.s disclose3 in
~,7.5. Patent Nos. 3,905,769 (1769) of Sep. 16, 1975; 5,197,017
('017)
a
CA 02339006 2007-07-27
631%9-113
dated Mar. 23, 1993; and 5,502,651 (1651) daLed Mal'. 2E, 1996,
all issued to Wallace E. Carroll and R. David Oackson.
Further, the invention relates to the preViously menticined
cross-refeTeneed applications. Tbe present applicatiarL
discloses a method and an apparatus for monitoring
anticoagulant therapy that uses sonke of the features of: the
apparatus shown and described in all of the earlier patents.
~ p -E7MN1ARY . OF ~'HE IMNTTON
The present invention is directed to methods azid
apparatuses for monitoring anticoqgulant therapy so as to
serve to prevent e---cessive bleeding or deleterious blot: clots
of a patient before, during axnd after surgery. More
15 particularly, the present invention provides methods aiid
appaxatuses that are independent of the contributiozls inade by
the thromboplastin.s (Tps) and, thus, are devoid of the need of
taking into account the effects of various thromboplasi:ius
( Tps ) derived from rabbi.t braizz or bovine brain..
20 Specifically, the present invention provides xnethods and
apparatuses therefor that derive anticoagulant therapy facr.ors
that replace the znternational Norxaali7ed Ratio (M)
determination used for monitoring oral anticoagulant therapy.
The methods and apparatuses of the present invenC.ion are
25 used to determine anticoagulant therapy factors which are
designated herein and are dependent on the prothromhin time
(PT) , the prothromba.an ratio (PR) , a fi]arixiogen traxisfo.cmatzon
rate (FTR), and a maximum acceleration point (MkP) having an
associated time to maximum aoceleTation (TMA) . The
30 anticoagulant therapy factors rates comprise a predete.rmir,Led
range starting prior to and endi.ng after a ma3:imum
acceleration point which
.
CA 02339006 2008-03-28
63129-113
corresponds to the maximum acceleration of the fibrinogen
(FBG) to fibrin conversion.
In accordance with one aspect of the present
invention, there is provided a method of determining a
corrected anticoagulant therapy factor (CATF) comprising the
steps of: (a) developing a series of analog electrical
voltage signals having voltage amplitudes proportional to
respective optical densities of a plurality of liquid
samples containing fibrinogen; (b) converting the developed
analog voltage signals into a series of digital voltage
signals each having a value; (c) injecting a coagulant into
each of said plurality of liquid samples, thereby producing
a respective abrupt change in the optical density of each of
the liquid samples, said abrupt respective changes producing
abrupt changes in the amplitude of the respective analog
electrical voltage signals which, in turn, produce abrupt
changes in the values of each of the corresponding digital
voltage signals, the values of said digital voltage signals
being directly indicative of fibrinogen concentration in
said plurality of liquid samples; (d) recording an instant
time to of each of said respective abrupt changes in said
values of said digital voltage signals; (e) monitoring each
of said respective digital voltage signal values for a
respective first predetermined fibrinogen concentration
quantity cl; (f) recording an instant time tl and the value
of the digital voltage signal of each of said respective
first predetermined fibrinogen concentration quantity cl;
(g) recording an elapsed time between to and tl which defines
a prothrombin time (PT) for each of said respective digital
voltage signals; (h) monitoring for a differential change in
each of said respective digital voltage signal values that
include a second predetermined fibrinogen concentration
quantity c2 which is at least equal to said respective first
6
CA 02339006 2008-03-28
63129-113
predetermined fibrinogen concentration quantity cl, and a
third predetermined fibrinogen concentration quantity C3 for
each of said respective digital voltage signal values, said
first c1 and second c2 for each of said respective
predetermined fibrinogen concentration quantities occurring
within a first predetermined time period Ta, said second c2
and third c3 predetermined respective fibrinogen
concentration quantities occurring within a second
predetermined time period Tb; and (i) recording an instant
time and digital voltage signal value for each of said
respective second c2 and third c3 predetermined fibrinogen
concentration quantities corresponding to times t2 and t3 for
each of said respective digital voltage signal values, said
first predetermined time period Ta for each of said
respective quantities being defined by the time difference
between the instant times of said first cl and second c2 of
each of said respective predetermined fibrinogen
concentration quantities, said second predetermined time
period Tb of each of said respective quantities being defined
by the time difference between the instant times t2 and t3 of
said second c2 and third c3 of each of said respective
predetermined fibrinogen concentration quantities, said
third fibrinogen concentration quantity c3 and said time t3
for each of said respective quantities defining a maximum
acceleration point (MAP) for each of said respective
quantities and a time to maximum acceleration (TMA) for each
of said respective quantities being measured as the elapsed
time from tl to t3 for each of said respective quantities
which serves as a multiplier (TMA)/100, respectively, and
each of the third quantity c3 and said time t3 for each of
said respective quantities having a predetermined range
starting prior to and ending after said maximum acceleration
point (MAP) with the difference covered by an overall range
6a
CA 02339006 2008-03-28
63129-113
for each of said respective quantities defining a fibrinogen
transformation rate (FTR) for each of said respective
quantities; wherein the corrected anticoagulant therapy
factor (CATF) for each of said plurality of liquid samples
is expressed by the following relationship:
C'A TF = (PT) * (PR) ~ TNIA
FTR 100
where PR =~PT and PR is the prothrombin ratio of the
respective liquid sample and MNPT is the mean of the PT of
the plurality of liquid samples from at least twenty (20)
normal people.
In accordance with another aspect of the present
invention, there is provided'a method of calibrating
thromboplastin specimens for anticoagulant therapy and
determining a corrected anticoagulant therapy factor (CATF)
for each said thromboplastin specimen comprising the steps
of: (A) determining the anticoagulant therapy factor (ATF)
of each of at least twenty (20) specimens of said
thromboplastin specimens by performing the following steps
(a) - (i) and selecting the ATF having the lowest value:
(a) developing a series of analog electrical voltage signals
having voltage amplitudes proportional to an optical density
of a liquid sample containing fibrinogen, (b) converting the
developed analog voltage signals into a series of digital
voltage signals each having a value, (c) injecting a
coagulant into the liquid sample, thereby producing an
abrupt change in the optical density of the liquid sample,
said abrupt change producing an abrupt change in the
amplitude of the analog electrical voltage signals which, in
6b
CA 02339006 2008-03-28
63129-113
turn, produces an abrupt change in the corresponding values
of the corresponding digital voltage signals, the values of
said digital voltage signals being directly indicative of
fibrinogen concentration in the liquid sample, (d) recording
an instant time to of said abrupt change in said value of
said digital voltage signal, (e) monitoring said digital
voltage signal values for a first predetermined fibrinogen
concentration quantity cl, (f) recording an instant time tl
and the value of the digital voltage signal of said first
predetermined fibrinogen concentration quantity cl,
(g) recording an elapsed time between to and tl which defines
a prothrombin time (PT), (h) monitoring for a differential
change in the digital voltage signal values that include a
second predetermined fibrinogen concentration quantity c2
which is at least equal to said first predetermined
fibrinogen concentration quantity cl, and third predetermined
fibrinogen concentration quantity c3r said first cland
second c2 predetermined fibrinogen concentration quantities
occurring within a first predetermined time period Ta, said
second c2 and third c3 predetermined fibrinogen concentration
quantities occurring within a second predetermined time
period Tb, and (i) recording an instant time and digital
voltage signal value for each of said second cZ, and third c3
predetermined fibrinogen concentration quantities
corresponding to times t2 and t3, said first predetermined
time period Ta being defined by the time difference between
the instant times of said first cl and second c2
predetermined fibrinogen concentration quantities, said
second predetermined time period Tb being defined by the time
difference between the instant times t2 and t3 of said second
c2r and third c3 predetermined fibrinogen concentration
quantities, said third fibrinogen concentration quantity c3
and said time t3 defining a maximum acceleration point (MAP)
6c
CA 02339006 2008-03-28
63129-113
and a time to maximum acceleration (TMA) being measured as
the elapsed time from t1 to t3 which serves as a multiplier
(TMA)/100, respectively, and each of the third quantity c3
and said time t3 having a predetermined range starting prior
to and ending after said maximum acceleration point (MAP)
with the difference covered by an overall range defining a
fibrinogen transformation rate (FTR); wherein the
anticoagulant therapy factor (ATF) is expressed by the
following relationship: ATF = (PT/FTR) * (TMA/100);
(B) determining the anticoagulant therapy factor (ATF) of
each of at least twenty (20) specimens from a pool of
patients that has been receiving oral anticoagulants for at
least six (6) weeks by performing the following steps
(a) - (i) and selecting the ATF having the highest value:
(a) developing a series of analog electrical voltage signals
having voltage amplitudes proportional to an optical density
of a liquid sample containing fibrinogen, (b) converting the
developed analog voltage signals into a series of digital
voltage signals each having a value, (c) injecting a
coagulant into the liquid sample, thereby producing an
abrupt change in the optical density of the liquid sample,
said abrupt change producing an abrupt change in the
amplitude of the analog electrical voltage signals which, in
turn, produces an abrupt change in the corresponding values
of the corresponding digital voltage signals, the values of
said digital voltage signals being directly indicative of
fibrinogen concentration in the liquid sample, (d) recording
an instant time to of said abrupt change in said value of
said digital voltage signal, (e) monitoring said digital
voltage signal values for a first predetermined fibrinogen
concentration quantity cl, (f) recording an instant time tl
and the value of the digital voltage signal of said first
predetermined fibrinogen concentration quantity cl,
6d
CA 02339006 2008-03-28
63129-113
(g) recording an elapsed time between to and tl which defines
a prothrombin time (PT), (h) monitoring for a differential
change in the digital voltage signal values that include a
second predetermined fibrinogen concentration quantity c2
which is at least equal to said first predetermined
fibrinogen concentration quantity cl, and third predetermined
fibrinogen concentration quantity c3r said first cl and
second c2 predetermined fibrinogen concentration quantities
occurring within a first predetermined time period Ta, said
second c2 and third c3 predetermined fibrinogen concentration
quantities occurring within a second predetermined time
period Tb, and (i) recording an instant time and digital
voltage signal value for each of said second c2r and third c3
predetermined fibrinogen concentration quantities
corresponding to times t2 and t3, said first predetermined
time period Ta being defined by the time difference between
the instant times of said first c1 and second c2
predetermined fibrinogen concentration quantities, said
second predetermined time period Tb being defined by the time
difference between the instant times t2 and t3 of said second
c2r and third c3 predetermined fibrinogen concentration
quantities, said third fibrinogen concentration quantity c3
and said time t3 defining a maximum acceleration point (MAP)
and a time to maximum acceleration (TMA) being measured as
the elapsed time from tl to t3 which serves as a multiplier
(TMA)/100, respectively, and each of the third quantity c3
and said time t3 having a predetermined range starting prior
to and ending after said maximum acceleration point (MAP)
with the difference covered by an overall range defining a
fibrinogen transformation rate (FTR); wherein the
anticoagulant therapy factor (ATF) is expressed by the
following relationship: ATF = (PT/FTR) * (TMA/100);
(C) determining the corrected anticoagulant therapy factor
6e
CA 02339006 2008-03-28
63129-113
(CATF) of each said thromboplastin specimens by performing
the following steps (a) - (i): (a) developing a series of
analog electrical voltage signals having voltage amplitudes
proportional to respective optical densities of a plurality
of liquid samples containing fibrinogen; (b) converting the
developed analog voltage signals into a series of digital
voltage signals each having a value; (c) injecting a
coagulant into each of said plurality of liquid samples,
thereby producing a respective abrupt change in the optical
density of each of the liquid samples, said abrupt
respective changes producing abrupt changes in the amplitude
of the respective analog electrical voltage signals which,
in turn, produce abrupt changes in the values of the
corresponding digital voltage signals, the values of said
digital voltage signals being directly indicative of
fibrinogen concentration in said plurality of liquid
samples; (d) recording an instant time to of each of said
respective abrupt changes in said values of said digital
voltage signals; (e) monitoring each of said respective
digital voltage signal values for a respective first
predetermined fibrinogen concentration quantity c1;
(f) recording an instant time tl and the value of the digital
voltage signal of each of said respective first
predetermined fibrinogen concentration quantity cl;
(g) recording an elapsed time between to and tl which defines
a prothrombin time (PT) for each of said respective digital
voltage signals; (h) monitoring for a differential change in
each of said respective digital voltage signal values that
include a second predetermined fibrinogen concentration
quantity c2 which is at least equal to said respective first
predetermined fibrinogen concentration quantity cl, and a
third predetermined fibrinogen concentration quantity c3 for
each of said respective digital voltage signal values, said
6f
CA 02339006 2008-03-28
63129-113
first c1 and second c2 for each of said respective
predetermined fibrinogen concentration quantities occurring
within a first predetermined time period Ta, said second c2
and third c3 predetermined respective fibrinogen
concentration quantities occurring within a second
predetermined time period Tb; and (i) recording an instant
time and digital voltage signal value for each of said
respective second c2 and third c3 predetermined fibrinogen
concentration quantities corresponding to times t2 and t3 for
each of said respective digital voltage signal values, said
first predetermined time period Ta for each of said
respective quantities being defined by the time difference
between the instant times of said first cl and second c2 of
each of said respective predetermined fibrinogen
concentration quantities, said second predetermined time
period Tb of each of said respective quantities being defined
by the time difference between the instant times t2 and t3 of
said second c2 and third c3 of each of said respective
predetermined fibrinogen concentration quantities, said
third fibrinogen concentration quantity c3 and said time t3
for each of said respective quantities defining a maximum
acceleration point (MAP) for each of said respective
quantities and a time to maximum acceleration (TMA) for each
of said respective quantities being measured as the elapsed
time from tl to t3 for each of said respective quantities
which serves as a multiplier (TMA)/100, respectively, and
each of the third quantity c3 and said time t3 for each of
said respective quantities having a predetermined range
starting prior to and ending after said maximum acceleration
point (MAP) with the difference covered by an overall range
for each of said respective quantities defining a fibrinogen
transformation rate (FTR) for each of said respective
quantities; wherein the corrected anticoagulant therapy
6g
CA 02339006 2008-03-28
63129-113
factor (CATF) for each of said plurality of liquid samples
is expressed by the following relationship:
C'ATF = (Pfi) * (PR) * TMA
FTR 100
where PR = PT/MNPT and PR is the prothrombin ratio of the
respective liquid sample and MNPT is the mean of the PT of
the plurality of liquid samples from at least twenty (20)
normal people; and (D) comparing the CATF of step (C)
against the lowest ATF of step (A) and the highest ATF of
step (B) so as to ensure the compared CATF is not less than
the lowest ATF or greater than the highest ATF.
In accordance with yet another aspect of the
present invention, there is provided a method of determining
a modified anticoagulant therapy factor (MATF) comprising
the steps of: (a) determining the international normalized
ratio (INR) of at least twenty (20) specimens of
thromboplastin specimens; (b) determining the international
normalized ratio (INR) of at least twenty (20) specimens
from a pool of patients that has been receiving oral
anticoagulants for at least six (6) weeks; (c) determining
the corrected anticoagulant therapy factor (CATF) of each
said thromboplastin specimens by performing the following
steps: developing a series of analog electrical voltage
signals having voltage amplitudes proportional to respective
optical densities of a plurality of liquid samples
containing fibrinogen; converting the developed analog
voltage signals into a series of digital voltage signals
each having a value; injecting a coagulant into each of said
plurality of liquid samples, thereby producing a respective
6h
CA 02339006 2008-03-28
63129-113
abrupt change in the optical density of each of the liquid
samples, said abrupt respective changes producing abrupt
changes in the amplitude of the respective analog electrical
voltage signals which, in turn produce abrupt changes in the
values of the corresponding digital voltage signals, the
values of said digital voltage signals being directly
indicative of fibrinogen concentration in said plurality of
liquid samples; recording an instant time to of each of said
respective abrupt changes in said values of said digital
voltage signals; monitoring each of said respective digital
voltage signal values for a respective first predetermined
fibrinogen concentration quantity cl; recording an instant
time tl and the value of the digital voltage signal of each
of said respective first predetermined fibrinogen
concentration quantity cl; recording an elapsed time between
to and tl which defines a prothrombin time (PT) for each of
said respective digital voltage signals; monitoring for a
differential change in each of said respective digital
voltage signal values that include a second predetermined
fibrinogen concentration quantity c2 which is at least equal
to said respective first predetermined fibrinogen
concentration quantity cl, and a third predetermined
fibrinogen concentration quantity c3 for each of said
respective digital voltage signal values, said first cl and
second c2 for each of said respective predetermined
fibrinogen concentration quantities occurring within a first
predetermined time period Ta, said second c2 and third c3
predetermined respective fibrinogen concentration quantities
occurring within a second predetermined time period Tb; and
recording an instant time and digital voltage signal value
for each of said respective second c2 and third c3
predetermined fibrinogen concentration quantities
corresponding to times t2 and t3 for each of said respective
6i
CA 02339006 2008-03-28
63129-113
digital voltage signal values, said first predetermined time
period Ta for each of said respective quantities being
defined by the time difference between the instant times of
said first cl and second c2 of each of said respective
predetermined fibrinogen concentration quantities, said
second predetermined time period Tb of each of said
respective quantities being defined by the time difference
between the instant times t2 and t3 of said second c2 and
third c3 of each of said respective predetermined fibrinogen
concentration quantities, said third fibrinogen
concentration quantity c3 and said time t3 for each of said
respective quantities defining a maximum acceleration point
(MAP) for each of said respective quantities and a time to
maximum acceleration (TMA) for each of said respective
quantities being measured as the elapsed time from tl to t3
for each of said respective quantities which serves as a
multiplier (TMA)/100, respectively, and each of the third
quantity c3 and said time t3 for each of said respective
quantities having a predetermined range starting prior to
and ending after said maximum acceleration point (MAP) with
the difference covered by an overall range for each of said
respective quantities defining a fibrinogen transformation
rate (FTR) for each of said respective quantities; wherein
the corrected anticoagulant therapy factor (CATF) for each
of said plurality of liquid samples is expressed by the
following relationship:
CATF = (PT) * (PR) X ~TMA~
FTR 100
where PR= PT and PR is the prothrombin ratio of the MNPT
respective liquid sample and MNPT is the mean of the PT of
the plurality of liquid samples from at least twenty (20)
6j
CA 02339006 2008-03-28
63129-113
normal people; (d) selecting all of INR values as x
quantities and the CATF values as y quantities; (e)
determining the mean as the x quantities and classifying it
as MEAN (X); (f) determining the mean of the y quantities
and classifying it as MEAN (Y); (g) determining the slope
between the MEAN (X) and MEAN (Y) and classifying it as
SLOPE (X,Y); and (h) determining the quantity MATF by the
following expression:
MATF = ((CATF - EAN (Y) ) /SLOPE (XY) ) + MEAN (X).
BRIEF DESCRIPTION OF THE DRAWINGS
Fig. 1 is a diagram of potentiophotometric
(hereinafter sometimes referred to as "POTENS +")
anticoagulant therapy factor (ATF) determination apparatus
generally similar to that shown in Fig. 1 of U.S. Pat. Nos.
3,905,769, 5,197,017 and 5,502,651, with the output of the
analog/digital (A/D) converter being applied to a computer.
Fig. 2 is a plot of the various phases of the
fibrinogen concentration occurring in a typical plasma
clotting process.
Figs. 3 and 4 show the results of comparative
testing between using a +/- 0.5 second FTR range (Fig. 3)
and a range of FTR of 1.0 seconds (Fig. 4) prior to the
maximum acceleration point (MAP).
Figs. 5, 6, 7 and 8 illustrate the correlation
between the International Normalized Ratio (INR) and the
corrected anticoagulant therapy factor (CATF) independently
computed for three different thromboplastins.
Figs. 9, 10, 11 and 12 graphically illustrate, in
accordance with the practice of the present invention, the
6k
CA 02339006 2008-03-28
63129-113
transition of a plot (Fig. 9) not having a slope of one (1)
nor an intercept of zero (0), to a plot (Fig. 12) having
both a slope of one (1) and an intercept of zero (0).
Figs. 13 and 14 illustrate the correlation between
the International Normalized Ratio (INR) and the corrected
61
CA 02339006 2001-01-30
WO 00/07012 PCT/US98/15972
anticoagulant therapy factor (CATF) related to the present
invention.
Figs. 15, 16, 17, and 18 illustrate the correlation
between the International Normalized Ratio (INR) and the
modified anticoagulant therapy factor (MATF) related to the
present invention.
DETAILED DESCRIPTION
Referring to the drawings, wherein the same reference
numbers indicate the same elements throughout, there is shown
in Fig. 1 a light source 4 which may be a low power gas laser
producing a beam of light 6 which passes through a sample test
tube or cuvette 8 and is received by detection means which is
preferably a silicon or selenium generating photocell 10
(photovoltaic cell). Battery 12 acts as a constant voltage DC
source. Its negative terminal is connected through switch 14
to one end of variable resistor 16 and its positive terminal
is connected directly to the opposite end of variable resistor
16. The combination of battery 12 and variable resistor 16
provides a variable DC voltage source, the variable voltage
being derivable between line 18 at the upper terminal of
resistor 16 and wiper 20. This variable DC voltage source is
connected in series with detection means photocell 10, the
positive output of detection means photocell 10 being
connected to the wiper 20 of variable resistor 16 so that the
voltage produced by the variable voltage DC source opposes the
voltage produced by the detection means photocell 10. The
negative output of detection means photocell 10 is connected
through variable resistor 22 to line 18. Thus, the voltage
across variable resistor 22 is the difference between the
voltage produced by the variable voltage DC source and the
voltage produced by the photovoltaic cell 10. The output of
the
7
SUBSTITUTE SHEET (RULE 26)
CA 02339006 2001-01-30
WO 00/07012 PCT/US98/15972
electrical network is taken between line 18 and wiper 24 of
variable resistor 22. Thus, variable resistor 22 acts as a
multiplier, multiplying the voltage produced as a result of
the aforesaid subtraction by a selective variable depending on
the setting of variable resistor 22. The potentiophotometer
just described embodies the electrical-analog solution to
Beer's Law and its output is expressed directly in the
concentration of the substance being measured.
In the present invention, wiper 24 is placed at a
position to give a suitable output and is not varied during
the running of the test. The output between line 18 and wiper
24 is delivered to an A/D converter 26 and digital recorder
28. As is known, the A/D converter 26 and the digital
recorder 28 may be combined into one piece of equipment and
may, for example, be a device sold commercially by National
Instrument of Austin, Texas as their type Lab-PC+. The signal
across variable resistor 22 is an analog signal and hence the
portion of the signal between leads 18 and wiper 24, which is
applied to the A/D converter 26 and digital recorder 28, is
also analog. A computer 30 is connected to the output of the
A/D converter 26, is preferably IBM compatible, and is
programmed in a manner described hereinafter.
The description of the present invention makes reference
to terms, and symbols thereof, having a general description as
used herein, all to be further described and all of which are
given in Table 1.
8
SUBSTITUTE SHEET (RULE 26)
CA 02339006 2007-07-27
63129-113
Some embadimenta further include a means for
injecting a coagulant into each of a plurality of liquid
sample. This produces a respective abrupt change in the
optical density of each of the liquid samplea, said abrupt
respective changes producing changeslin Lhe amplitude of the
respective electriaal analog eignals:,, which, in turn, produce
abrupt changes in the value of each of said respective digital
voltage signala, the value of said digital voltage eignals
being directly indicative of fibrinogen concentration in eaeh
of said plurality of liquid samples.;
8a
~~I
CA 02339006 2001-01-30
WO 00/07012 PCT/US98/15972
TABLE 1
SYMBOL TERM GENERAL DESCRIPTION
PT Prothrombin Time A period of time calculated from
the addition of thromboplastin
to a point where the conversion
of Fibrinogen to Fibrin begins.
TMA Time to Maximum The time from PT to a point
Acceleration where the rate of conversion of
Fibrinogen to Fibrin has reached
maximum and begins to slow.
FTR Fibrinogen The amount of Fibrinogen
Transformation converted during a time period
Ratio from -1/2 TMA to +1/2 TMA. This
is a percentage of the total
Fibrinogen.
ATF Anticoagulation The calculated value used to
Therapy Factor monitor the uses of an
anticoagulant without a need for
an International Sensitivity
Index of a thromboplastin.
CATF Corrected ATF Change to the ATF calculation to
give a better correlation of ATF
vs. INR.
MATF Modified ATF A geometric modification making
the value ATF equal to the value
INR.
PR Prothrombin A value computed by dividing a
Ratio sample PT by the geometric mean
of at least 20 normal patients
( MNPT ) .
The present invention in one embodiment determines an
anticoagulant therapy factor (ATF) and in another embodiment
determines a corrected anticoagulant therapy factor (CATF)
both selectably used as a standard during the monitoring of
oral anticoagulant therapy without the need of any
consideration of the International Normalized Ratio (INR) or
International
9
SUBSTITUTE SHEET (RULE 26)
CA 02339006 2007-07-27
6. .129-113
Sensitivity Index (IS1) previously discuased in referencE
technical articles entitled PTs, PRs, ISIs and ZNRs: A Primer
on Prothrombin Time Reporting Part I and II respectively
published November, 1993 and December, 1993 iesues of Clinical
Hemostasis Review. The practice o.t the present invention
relies upon the prothrombin time (PT) and a fibrinogen
transformata,on rate (FTR) , that is, the thrombin a.ctivity in
wr,ich fibra,nogen (FSG) is converted to fa.brin to cause clotting
in blood plasma. Tk1e practice of the present in.vention also
relies upon a particular understanding of the enzymatic
clotting steps occurring during a prothrombin time (p'I') of
plasma having proteins including factors II, IIa, V, VII, and
X.
More parta.cularly, during the clotting steps used to
dete=ine the clotting process of a plasma specimen of a
patient under observation, a thrombopl.astin (Tp) activates
factor VTI which, activates factor X, which, in tui-n, under
catalytic action of factor V, activates factor 11 (som?times
referred to as pzothromlain) to cause factor IZa (sometimes
referred to as throinbirl) that con'trerts fibrizlogen (FBG) to
fibrin with resultant turbidity activity which is irteas-ared, in
a manner as to be described hereiaaaf ter, when the reaction is
undergoing simulated zero-order kinetics.
From the above, it should be noted that the
^5 th.roznboplastin (Tp) does not take part in t,kle reaction where
factor 2Ia (thrornbin) converts fibrinogen (FBG) to fibrin
which is detexaministic of the clotting of the plasma of the
patient under consideration. The thromboplasti.n (Tp) on.ly
acts to activate factor VII to start the whole cascade
rolling. Note also that differing th.rombop? astins (Tp:=) have
differing rates of effect on factor VTT, so the rates of
enzyme factor reactians up to II - ITa (the PT) will vary.
Therefore, the prothx'ombln times (PTs)
Ip
CA 02339006 2001-01-30
WO 00/07012 PCT/US98/15972
vary with the different thromboplastins (Tps) which may have
been a factor that mislead authorities to the need of taking
into account the International Normalized Ratio (INR) and the
International Sensitivity Index (ISI) to compensate for the
use of different types of thromboplastins (Tps) during the
monitoring of oral anticoagulant therapy. Note further, that
thromboplastins (Tps) have nothing to do with factor IIa
converting fibrinogen (FBG) to fibrin, so it does not matter
which thromboplastin is used when the fibrinogen
transformation is a primary factor. All that the
thromboplastin (Tp) is needed for in the present invention is
to start the reactions that give factor IIa. Once the present
invention obtains the factor IIa, fibrinogen (FBG) to fibrin
conversion goes on its own independent of the thromboplastin
(Tp) used. Accordingly, the present invention in its
anticoagulant therapy factor (ATF) embodiment needs only take
into account the determination of the fibrinogen
transformation rate (FTR), the prothrombin time (PT) and the
maximum acceleration point (MAP), all of which may be
typically ascertained by the use of fibrinogen solutions.
The practice of the present invention preferably includes
fibrinogen (FBG) standard solutions and a control solution,
wherein the fibrinogen standard solutions act as dormant
references to which solutions analyzed by the present
invention are compared, whereas the control solution acts as a
reagent that is used to control a reaction related to the
present invention. The fibrinogen standards include both high
and low solutions, whereas the control solution is
particularly used to control clotting times and fibrinogens of
blood samples.
A fibrinogen (FBG) solution of 10 g/1 may be prepared
from a cryoprecipitate. The cryoprecipitate may be prepared
by freezing plasma, letting the plasma thaw in a refrigerator
and then, as
11
SUBSTITUTE SHEET (RULE 26)
CA 02339006 2007-07-27
a3129-113
}:nflwn -n th~ a~:c, e::p--re_ s'_Slg off tha pl-asm.7 so as Lo ~ =-gvLh
Derai-nd CnE res;ciua crvopa: Ycipi tate , The gathe : ed
crvo-~:;recipitate snouid conLain a substantial amount of both
desi.red fibrinogen (FBG) and factor ViIS (antihemophilic
globulin) , along with other elements that are not of
particulax concei.~n to the presznL inverltion. The 10 g/].
fibrinogen (FBO) solution, after further treatment, serves as
the source for the high fibrinogen (FBG) standard. A 0.5 g/1
fibrirlogen (FHG) solution may th.en be prepared by a 1: 2G (10
1.0 g/1/20=0.5 g/1) di.lution of some of the gathered
crryaprecipitate to which may be added an Owren's Veron3l
Buffer (pi3 7.35) (known in the art) or normal saline sal.ut.ion
and which, after further treatznent, may serve as a source of
the low fibrinogen (FBG) standard. Then, 1 ml of each of the
high (10 g/1) and low (0.5 g/1) sources of tJae fibrinogen
standards may be added to 1 ml of normal human plasma (so the
human plasma caza clot), and this addition respectively may
yield 6.38 g/l and 1.5 g/1 high and low fibrinagen (FB13)
standards, used in the practice of the presant invexztion for
analyzing samples of citrated blood -under test, especially
th.ose samples being monitored durdzag oral anticoagulant
therapy which is of prime importa.4qe to the present invenkion.
As is known, the addition. of the reagent Thromboplastin
C serves as a coagulant to cause clotting to occur witthin a
sample of citrated blood under test which may be contained in
a test tube B. As clotting occurs, the A/D converter 26 of
Fig. 1 wi11 count and produce a digital value of voltage at a
predetermined period, such as once every 0.05,or 0.01 seconds.
As more fully described in the pre'viously iaatrdduced U.S.
Patent No. 5,197,017 ('017), these voltage values are stored
and then pxinted by the recorder as an array of numbers, the
printing being from left to right and line by line, top to
bottom. There are typically one hundred numbere in the five
groups representirig
i2
CA 02339006 2007-07-27
c.:::L2S-113
JoiCage .;ai u25 sitrerv secozid ar-Ld 11 _I7ce, oTl` line ?-?riZ eg¾3nCs
onE-=ifth of a second in time (20x0.01 seconds ). 1*~d~ ~ iaual
nuiTifaers in the same cOlu7fln are CwenL]y seaue'=tti-al nuIRbF"-s
.anart. Hence, th.A tirne diiference laetweer, zwo adjacent.
numbers in a colum.ra ks one-fifth oi a second, The
significance of these r.ecorded values may be more readily
apnreciated after a genGral review of the opera.ting pr:.ncip7.eS
oT the present invention illustrated in Fig. 2 having e, Y axis
identified as Fibiinogen Concentza=tzon (Optical Density) and a
X axis identified in time (seconds).
Fig. 2 illustrates the daLa point 1.ocations of the
clotting ourve.related to the present invention. In getneral,
Fig. 2 illustiates a"clot slope" method that ms.y be used in
the present invention for determinj;ng an antiocagulant therapy
factor (ATF) and is more fully di.scuised in the previously
introduced U.S. Patent 5,502,651 which measures
zhz concentration of the fibrinogen (FBG) in the plasma, that
contributes to the clotting of the plasma aTa.d uses the
potentiophotometer of Fig. 3. to provide an otiztput volta.ge
signal that is directly indicative of the fibrinogen (FBG)
concentration in the plasma sample under test contained in a
test tube 8. The quantities given along the Y-ar.is of Fig. 2
are values (+and^) that may be dispiayecl by the d.igital
recorder 28. The "clot slope" method comprises detection of
the rate or the slope of the curve associated with the
foxuation of fibrin. from fa.brizlagera. The "clot slope" method
takes into account the prothrombin time (PT) (previously
mentioned as one of the factors for determin.i.ng the
anticoagulant the~-apy) which is typicalZy c3efined as th.e Cime
3Q duration between the injection of a reagent, such as
thxornboplastin and ca}.cium ion, into the plasma and the
corresponding instant of time when the clotting process
begins.
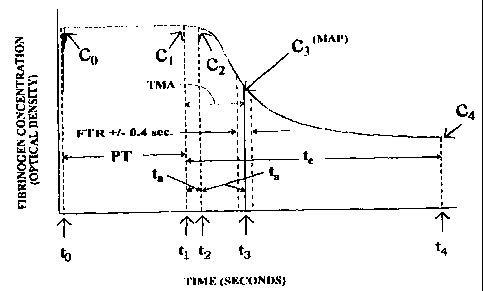
Ps seen in Fig. 2, at time to,'corresponding zo a
13
CA 02339006 2001-01-30
WO 00/07012 PCT/US98/15972
concentration co, the thromboplas tin/ calcium ion reagent is
introduced into the blood plasma which causes a disturbance to
the composition of the plasma sample which, in turn, causes
the optical density of the plasma to increase momentarily.
After the injection of the reagent (the time of which is
known, as to be described, by the computer 30), the digital
quantity of the recorder 28 of Fig. 1 rapidly increases and
then levels off in a relatively smooth manner and then
continues along until the quantity cl is reached at a time tl.
The time which elapses between the injection of thromboplastin
at to and the instant time t, of the quantity cl is the
prothrombin time (PT) and is indicated in Fig. 2 by the symbol
PT. The prothrombin time (PT) is of primary importance
because it is one of the three parameters (the other are the
fibrinogen transformation rate (FTR) and the maximum
acceleration point (MAP) having associated with it a time to
maximum acceleration (TMA)) that determines the anticoagulant
therapy factor (ATF) of the present invention.
The optical density of the quantity cl directly
corresponds to a specified minimum amount of fibrinogen (FBG)
that must be present for a measuring system, such as the
circuit arrangement of Fig. 1, to detect that a clot is being
formed. Further, all the quantities shown in Fig. 2 are of
optical densities that are directly correlatable to fibrinogen
concentration values. The critical quantity cl, may vary from
one clot detection system to another, but for the
potentiophotometer system of Fig. 1, this minimum is defined
by units of mass having a value of about 0.05 grams/liter
(g/1).
The detection of this first predetermined quantity cl is
shown in Fig. 2 to occur at an instant time tl which is the
start of the clotting process being monitored by the method of
the present invention for determining the anticoagulant
therapy
14
SUBSTITUTE SHEET (RULE 26)
CA 02339006 2001-01-30
WO 00/07012 PCT/US98/15972
factor (ATF) The time tl is the beginning point of the
fibrinogen formation, that is, it is the point that
corresponds to the beginning of the acceleration of the
fibrinogen conversion that lasts for a predetermined time,
preferably about 1.5 seconds. This tl point is determined by a
real time analysis of the optical density data accumulated
during testing. The time duration of at least 1.5 seconds
allows a sufficient amount of delay time to eliminate any
false responses due to noises created by initial mixing of the
reagent into the sample or bubbles within the sample under
test. This 1.5 second duration helps determine the beginning
point (tl) of the fibrinogen conversion in spite of any bubbles
or artifacts that might be present for short durations. These
noise producers might, without the benefits of the present
invention, be erroneously interpreted as early clots and might
lead to a correspondingly false response by the instrument
performing the measuring.
The acceleration of the fibrinogen conversion that occurs
within the 1.5 second duration, is shown in Fig. 2 as a first
time period Ta (tl to t2) . This first time period Ta is defined
by the first quantity cl and a second c2 occurring at a time
t2, wherein c2 has a value equal to at least cl. The
acceleration of the fibrinogen conversion continues until a
time t3, having a corresponding quantity c3. The time t3, as
well as the quantity c3, is of primary importance to the
present invention because it is the point of maximum
acceleration of the fibrinogen (FBG) to fibrin conversion and
is also the point where deceleration of fibrinogen (FBG) to
fibrin conversion begins. Further, the elapsed time from tl to
t3 is a time to maximum acceleration (TMA), shown in Fig. 2,
which serves as a multiplier (TMA)/100 to be described. The
third quantity (c3) and the time t3 define a maximum
acceleration point (MAP) associated with the present invention
and is shown in Fig. 2 as having predetermined ranges
SUBSTITUTE SHEET (RULE 26)
CA 02339006 2001-01-30
WO 00/07012 PCT/US98/15972
starting prior to maximum acceleration point (MAP) and ending
after the maximum acceleration point (MAP), with the
difference covered by the overall range defining the
fibrinogen transformation rate (FTR), which is also shown in
Fig. 2 and has a typical band of +/- 0.5 seconds. Fibrin
formation, after a short lag phase before the MAP, occurs for
a period of time, in a linear manner. Fibrinogen (FBG) is in
excess during this lag phase, and fibrin formation appears
linear up to the MAP. The FBG formed during an interval from +/-
(TMA - 2) seconds of the MAP is given as a percentage of the
total clottable FBG. This is the fibrinogen transformation
rate (FTR). The fibrinogen transformation rate (FTR) is of
primary importance to the present invention because it is one
of the three parameters that determine the anticoagulant
therapy factor (ATF) of the present invention with the other
two being the prothrombin time (PT) and the maximum
acceleration point (MAP). The predetermined range may be from
about 0.1 seconds to about 5.0 seconds on each side of the
maximum acceleration point (MAP) shown in Fig. 2 so that the
fibrinogen transformation rate (FTR) may cover an overall
difference from about 0.2 seconds to about 10.0 seconds.
The times t3 and t2 define a second time period Tb which
has a typical value of 1.5 seconds. The deceleration of
fibrinogen (FBG) to fibrin conversion continues until a
quantity c4 is reached at a time t4. The time t4 is the point
where the deceleration of the fibrinogen (FBG) to fibrin
conversion corresponds to a value which is less than the
required amount of fibrinogen (FBG) that was present in order
to start the fibrinogen (FBG) to fibrin conversion process.
Thus, because the desired fibrinogen (FBG) to fibrin
conversion is no longer in existence, the time t4 represents
the ending point of the fibrinogen (FBG) to fibrin conversion
as defined by the present invention. The fibrinogen (FBG) to
fibrin conversion has a
16
SUBSTITUTE SHEET (RULE 26)
CA 02339006 2001-01-30
WO 00/07012 PCT/US98/15972
starting point of tl and an ending point of t4. These times tl
and t4 def ine a third period Tc.
The significance of the points (tl, and t4) are not the
times at which they occur, but rather the difference in the
optical density of the quantities cl and c9 occurring at the
times tl and tQ. This difference is defined herein as the
delta optical density of the "clot slope" method and is of
importance to the present invention related to determining the
anticoagulant therapy factor (ATF). The "clot slope" method
that gathers typical data as shown in Fig. 2 has four critical
parameters. The first is that the initial delta optical
density of substance being analyzed should be greater than
about 0.05 g/l in order for the circuit arrangement of Fig. 1
to operate effectively. Second, the acceleration (fibrinogen
((FBG)) to fibrin conversion associated with Ta) should be
increasing for a minimum period of about 1.5 seconds so as to
overcome any false reactions created by bubbles. Third, the
total delta optical density (defined by the difference in
quantities cl and c4) should be at least three (3) times the
instrument value in order to perform a valid test, i.e.,
(3)*(0.05 g/l)=0.15 g/l. Fourth, the fibrinogen (FBG) to
fibrin conversion is defined, in part, by the point (t9) where
the deceleration of conversion becomes less than the
instrument value of about 0.05 g/l that is used to detect the
clot point (tl). As with most clot detection systems, a
specific amount of fibrinogen needs to be present in order to
detect a clot forming. Adhering to the four given critical
parameters allows the present invention to determine a
specific quantity of fibrinogen. In order for that specific
amount of fibrinogen to be determined, it is first necessary
to detect a clot point (tl). After that clot point (tl) is
detected, it logically follows that when the fibrinogen
conversion becomes less than the specific amount (about 0.05
g/l for the circuit arrangement of Fig. 1), the end
17
SUBSTITUTE SHEET (RULE 26)
CA 02339006 2001-01-30
WO 00/07012 PCT/US98/15972
point (t9) of the fibrinogen conversion has been reached.
The gathering, storing, and manipulation of the data
generally illustrated in Fig. 2, is primarily accomplished by
computer 30 of Fig. 1 that receives digital voltage values
converted, by the A/D converter 26, from analog voltage
quantities of the photocell 10 detection means.
The preferred IBM-compatible computer 30 of Fig. 1 stores
and manipulates these digital values corresponding to related
data of Fig. 2 and is preferably programmed as follows:
(a) with citrated blood, such as described above in
the test tube 8, the computer 30, as well as the recorder 28,
sequentially records voltage values for a few seconds before
injection of thromboplastin. As previously discussed,
thromboplastin is one of the factors in the human body that
causes blood to clot. Prothrombin is another. Fibrinogen is
yet another. Before injection of the thromboplastin, the
output from the A/D converter 26 is relatively constant. When
thromboplastin is injected into the blood in test tube 8, a
significant and abrupt change occurs in the recorded voltage
values of both the computer 30 and the recorder 28. This
abrupt change is recognized by both the recorder 28 and, more
importantly, by the computer 30 which uses such recognition to
establish to already discussed with reference to Fig. 2. The
computer 30 may be programmed so as to correlate the digital
quantities of the A/D converter 26 to the analog output of the
detector means photocell 10 which, in turn, is directly
correlatable to the fibrinogen (FBG) concentration g/l of the
sample of blood discussed with reference to Fig. 2;
(b) following the recording of digital quantities
representative of the fact that thromboplastin had been
injected (see to of Fig. 2), the computer 30 may be programmed
to look for
18
SUBSTITUTE SHEET (RULE 26)
CA 02339006 2001-01-30
WO 00/07012 PCT/US98/15972
a digital quantity representative of the previously discussed
critical quantity cl, and when such occurs, record its instant
time tl. The time span between to and tl is the prothrombin
time (PT) of particular importance to the present invention
and has a normal duration of about 12 seconds, but may be
greater than 30 seconds;
(c) following the detection of the critical quantity
cl, the computer 30 may be programmed to detect for the
acceleration of fibrinogen (FBG) to fibrin conversion within
the defined time period Ta, having a typical duration of 1.5
seconds. The parameters of this time period Ta are its
beginning which is defined by the occurrence (tl) of the first
predetermined quantity cl and its end which is defined by the
second predetermined quantity c2 occurring at time t2. The
first predetermined time period Ta has a typical range of about
12 to about 30 seconds as measured from to. The computer 30 is
also programmed to detect the maximum acceleration quantity c3
and its time of occurrence t3 (having a typical value of 1.5
seconds after t2). These two times t2 and t3 define the time
duration Tb. Furthermore, the computer detects the quantity c4
occurring at time t4 so as to define the time duration Tc. The
time period Ta may exceed but may not be less than the typical
1.5 second duration. The duration of the time between the
occurrence (tl) of the quantity cl, and the occurrence (t2) of
the quantity c2 is not fixed. It is only important that the
rate of fibrin formation increase for at least 1.5 second
following the occurrence of (tl) ;
(d) following the detection of the maximum
acceleration quantity c3 and the time t3 both of which define
the maximum acceleration point (MAP), the computer 30 is
programmed to determine the fibrinogen transformation rate
(FTR) covering a predetermined range starting prior to the
maximum acceleration point (MAP) and ending after the maximum
acceleration point
19
SUBSTITUTE SHEET (RULE 26)
CA 02339006 2001-01-30
WO 00/07012 PCT/US98/15972
(MAP). The elapsed time from tl to t3 is the time to maximum
acceleration (TMA) shown in Fig. 2 and is a multiplier factor
(TMA/100). The fibrinogen transformation rate (FTR) has an
upwardly rising (increasing quantities) slope prior to the
maximum acceleration point (MAP) and, conversely, has a
downwardly falling (decreasing quantities) slope after the
maximum acceleration point (MAP). The computer 30 is
programmed to allow for a predetermined range defining the
fibrinogen transformation rate (FTR) which may be from about
0.1 seconds up to 5.0 seconds on each side of the maximum
acceleration point (MAP) so that the fibrinogen transformation
rate (FTR) may cover an overall difference from about 0.2
seconds to about 10.0 seconds;
(e) following the detection of the acceleration of
fibrinogen conversion,the computer 30 is programmed to detect
for a deceleration of the fibrinogen conversion, wherein the
fibrinogen concentration decreases from its third
predetermined quantity c3 to a fourth predetermined quantity c4
having a value which is about equal but less than the first
quantity cl. The time duration from the instant time of the
detection of the first quantity cl to the instant time of the
detection of the fourth quantity c4, defines the third period
Tc ;
(f) the computer 30 manipulates the collected data
of (a); (b); (c); (d) and (e) above, to determine the
prothrombin time (PT) based on the principle that if a
required amount (e.g., 0.05 g/1) of fibrinogen concentration cl
is first necessary to detect a clot point (tl); then when the
fibrinogen concentration (c4) becomes less than the required
amount cl, which occurs at time (t4), the fibrinogen end point
has been reached. More particularly, the required fibrinogen
concentration cl is the starting point of fibrinogen conversion
of the clotting process and the less than required fibrinogen
concentration c4 is the end point of the fibrinogen conversion
of the clotting process.
SUBSTITUTE SHEET (RULE 26)
CA 02339006 2001-01-30
WO 00/07012 PCT/US98/15972
Thus, the duration of the fibrinogen conversion of the
clotting process of the present invention is defined by the
time period between tl and t4 and is generally indicated in
Fig. 2 as T,:; and
(g) the computer 30 now has the information needed
to determine the anticoagulant therapy factor (ATF) of the
present invention. More particularly, the computer 30 has
knowledge of the fibrinogen transformation rate (FTR) and the
prothrombin time (PT) and a simple division routine, run in
the computer 30, the product which, when multiplied by the
time to maximum acceleration (TMA), yields the anticoagulant
therapy factor (ATF) of the present invention having the
relationship given by the below expression (2):
ATF = PT/ FTR *( TMA/ 10 0) (2)
It should now be appreciated that the practice of the
present invention provides a relatively easy and automatic
method for obtaining an anticoagulant therapy factor (ATF)
without encountering the complications involved with obtaining
the prior art quantities International Normalized Ratio (INR)
and International Sensitivity Index (ISI) having a
relationship defined by the below expression (3) as well as
the quantity
Patient's PT referred to as the prothrombin ratio
Mean of PT Normal Range
(PR) all discussed in the "Background" section:
T,vR _ Pa ti en tls PT 1S2 (3)
[ Mean of PT Normal Range,
21
SUBSTITUTE SHEET (RULE 26)
CA 02339006 2001-01-30
WO 00/07012 PCT/US98/15972
The anticoagulant therapy factor (ATF) is a replacement
for the International Normalized Ratio (INR); however, the
existing medical literature, instrumentation, and
methodologies are closely linked to the International
Normalized Ratio (INR) and, therefore, the practice of the
present invention correlates, by comparative testing, the ATF
to INR quantities to each other even with the understanding
that the INR determination may have an error of about thirteen
(13) % which needs to be taken into account to explain certain
inconsistencies to be described hereinafter.
Comoarative Testing of ATF and INR Ouantities
Comparative testing was accomplished by using three
different thromboplastins (Tps), the first being Dade
Thromboplastin (Tp) = C with an ISI of 2.06; the second being
Dade Innovin with an ISI of about 1.0; and the third being
Sigma Diagnostics Thromboplastin with calcium ion and having
an ISI of 2.48. The usage of these three thromboplastins
(Tps) having calcium ion provided for a relatively large range
of ISI parameters. Citrated patient's plasmas were obtained
about one hour after the plasmas had been drawn from patients
and having had their prothrombin time (PT) determined. Most
of the patients were on the anticoagulant Coumadin and a very
few were on both Coumadin and Heparin. After the prothrombin
times were determined, the FTR and INR were determined in a
manner as previously described. At least four runs (Tray I,
Tray II, Tray III and Tray IV to be described, especially for
Figs. 3-8 also to be described) of comparative testing were
accomplished. The Thromboplastin = C was used in the first
run (Tray I) and its usage was repeated in the last run (Tray
IV). The thromboplastin (Tp) Innovin was used for the second
specimens (Tray II). The
22
SUBSTITUTE SHEET (RULE 26)
CA 02339006 2001-01-30
WO 00/07012 PCT/US98/15972
thromboplastin was changed to Sigma (Tp) (Tray III), and
testing was again performed. Finally, Thromboplastin = C was
used for Tray IV. It took about 40 minutes to change over the
various thromboplastins and run the specimens (I, II, III and
IV). Thromboplastin = C was run first (Tray I) and last (Tray
IV) to show that significant coagulation factor deterioration
had not occurred. The results of the comparative testing are
shown on Figs. 3-8, all of which have a X axis indicating
values of the International Normalized Ratio (INR) and a Y
axis indicating values of the anticoagulant therapy factor
(ATF) and the correlation therebetween is the correlation
factor, r, thereof.
Figs. 3 and 4 illustrate comparative testing showing the
International Normalized Ratio (INR) of all Trays (I, II, III
and IV) as the X axis, and the anticoagulant therapy factor
(ATF) of all Trays (I, II, III and IV) as the Y axis. Fig. 3
illustrates the fibrinogen transformation rate (FTR) of a
range of + and -0.5 seconds relative to the maximum
acceleration point (MAP), whereas Fig. 4 illustrates a
fibrinogen transformation rate (FTR) having a range of 1
second prior to the maximum acceleration point (MAP). The
correlation obtained by the use of a+/-0.5 seconds fibrinogen
transformation rate (FTR) range of Fig. 3 is 0.9334, which is
better than the correlation of 0.9235 obtained from that of
Fig. 4 using a fibrinogen transformation rate (FTR) range of -
1.0 seconds.
Figs. 5, 6, 7 and 8 show the results of separately
computing the International Normalized Ratio (INR) for Tray I
(Fig. 5), Tray II (Fig. 6), Tray III (Fig. 7) and Tray IV
(Fig. 8). Figs. 5, 6, 7 and 8 respectively illustrate
correlations of 0.948, 0.9632, 0.966, and 0.9653.
Although the hereinbefore description of anticoagulant
23
SUBSTITUTE SHEET (RULE 26)
CA 02339006 2001-01-30
WO 00/07012 PCT/US98/15972
therapy factor (ATF) does correlate well with the
International Normalized Ratio (INR) when most of the patients
being sampled were using a particular therapy, such as the
anticoagulant Coumadin (previously discussed), it does suffer
discrepancies when the ATF and INR quantities are compared for
individual patients. These discrepancies are resolved when
the anticoagulant therapy factor is statistically corrected,
hereinafter referred to as corrected anticoagulant therapy
factor (CATF), by the below expression (4):
CATF = PT * PR/FTR * (TMA/100) (4)
where the prothrombin ratio, PR, as used herein, _
PT/MNPT, and the mean normal prothrombin time (MNPT), as used
herein, is the geometric mean of the prothrombin time (PT)
from at least 20 normal patients. The usage of the
prothrombin ratio, PR, quantity in expression (4) more evenly
spreads out the values of the prothrombin time, PT, quantity
so as to yield a more sensitive CATF quantity of expression
(4) as compared to the sensitivity of the ATF quantity of
expression (2).
In general, it is desired to "correct" the ATF of
expression (2) to be that of expression (4), so that the
corrected anticoagulant therapy factor (CATF) corresponds as
well as possible to the INR numerically. To visually show the
correlation, the graphs (Figs. 9-12, to be described) of INR
vs ATF are mathematically manipulated so the slope of the
plots of Figs. 9-12 is one (1) and so that the linear
repression line represented by these plots passes through the
origin, that is, yields a zero (0) intercept line. These
manipulations modify the values of ATF of expression (2) so
that the CATF quantities of expression (4) almost equals INR.
In general, to achieve the
24
SUBSTITUTE SHEET (RULE 26)
CA 02339006 2001-01-30
WO 00/07012 PCT/US98/15972
modified ATF (MATF) value to compare with the INR value, we
compute the MEAN(X), MEAN(Y) and the SLOPE(X,Y) of all samples
for each thromboplastin used, then make the geometric
modifications in a manner to be described with reference to
Figs. 13-18 and, wherein the quantity MATF may be generally
expressed by expression (5) given as follows:
MATF = ( ( CATF - MEAN ( Y) ) / SLOPE ( XY) ) + MEA1V ( X ) (5)
The correlation between CATF and INR is shown in Figs.
13-14, to be further described, wherein the quantities X(INR)
are those shown along the X axis, and the quantities Y (CATF)
are those shown along the Y axis. To transform the quantities
of expression (2) to those of expression (4), the following
five (5) manipulations represented by the corresponding
expressions (6) - (10) are accomplished with the X quantities
thereof representing the INR quantities of Figs. 9-12 and the
Y quantities thereof representing the CATF quantities of Figs.
13-14:
the mean of X, (x--) is derived with (6)
3E also being referred to herein as mean (x) ;
the mean of Y, (y) is derived with (7)
y 7 also being referred to herein as mean (y) ;
thenXisset =X -
Y isset=Y - y
(8)
and the Y is set = Y_Y _
slope (x, y
SUBSTITUTE SHEET (RULE 26)
CA 02339006 2001-01-30
WO 00/07012 PCT/US98/15972
Expressions (6), (7) and (8) makes the slope of the
plots of Figs. 9-14 equal to one (1) without (9)
altering the correlation of expression (2) related
to IlVR; and
the regression line still needs to be positioned
for the intercept line to be zero (0) and to (10)
accomplish this x is added to X and Y.
The correlation between CATF and the INR quantities, in
particular, the manipulation of collected data so as to
provide plots with slopes of one (1) and with a zero (0)
intercept may be described in a graphic manner with reference
to Figs. 9-12.
Fig. 9 illustrates a plot 32 for various collected data
(generally indicated with X symbols) from 92 samples, wherein
the data associated with the X and Y axes having a correlation
factor, r, of 0.9759. The slope of the plot 32 of Fig. 9 is
2.8388 and the intercept is -1.6852. As previously discussed,
it is desired by the practice of this invention to maintain
the quality of the data defined by plot 32 but to change the
slope to one (1) and the intercept to zero (0).
Fig. 10 illustrates the plot 32 as having an intercept of
zero (0) and this is accomplished by setting X = x-mean(x) and
Y=y - mean(y), where the quantities x and y are the data of
Fig. 9. A comparison between the X and Y axes of Figs. 9 and
10 reveals that the values of the Y axis are changed from 0 to
of Fig. 9 to -5 to 15 of Fig. 10 and, similarly, the values
20 of the X axis are changed from 0 to 7 of Fig. 9 to -2 to 5 of
Fig. 10. However, the distribution and correction factor, r,
of plot 32 remain the same.
26
SUBSTITUTE SHEET (RULE 26)
CA 02339006 2001-01-30
WO 00/07012 PCT/US98/15972
Fig. 11 illustrates the plot 32 as having a slope of one
(1) and this is accomplished by setting X = to the x
quantities of Fig. 10 and Y = to the y quantities of Fig. 10
and then setting Y = Y/Slope (x, y) with x,y being the
quantities of Fig. 9. A comparison between the X and Y axes
of Figs. 10 and 11 reveals that the values of the Y axis are
changed from -5 to 15 of Fig. 10 to -2 to 6 of Fig. 11 and,
conversely, the values of the X axis for both Figs. 10 and 11
remain the same; i.e., -2 to 5.
Fig. 12 illustrates the plot 32 as having an intercept
line of zero (0) and this is accomplished by setting X and Y
to the quantities of Fig. 11 and then setting X = Y + mean(x)
and Y = Y + mean(x), with x and y being the quantities of Fig.
9. A comparison between the X and Y axes of Figs. 11 and 12
reveals that the values of Y axis are changed from -2 to 6 of
Fig. 11 to 0 to 8 of Fig. 12 and, similarly, the values of the
X axis are changed from -2 to 5 of Fig. 11 to 0 to 8 of Fig.
12. More importantly, the values defining the X and Y axes
are the same; i.e., 0 to 8.
Fig. 12 having a plot 32 with a slope (1) and a zero (0)
intercept line provides data comprised of x and y points
having values defined by the practice of this invention for
the INRs quantities and CATFs quantities of expression (4)
that agree with each other.
The computer 30 may be used to manipulate and derive the
quantities of expression (4) utilizing known programming
routines and techniques. The data collected by an computer 30
used to manipulate and derive the anticoagulant therapy factor
(ATF) of expression (2) may be used and becomes the same data
that is used to manipulate and derive the corrected
anticoagulant therapy factor (CATF) of expression (4).
Similarly, one skilled in the
27
SUBSTITUTE SHEET (RULE 26)
CA 02339006 2007-07-27
6Y~.~a-113
2~L, usin~ }_noW7~,, rRrL_~.a*n~~ic~~ rc ,~_rru_ m=_~~ d~=' :'= L='7=
~rCLA OI71~j l"i _"dL? O (~'i~ ) a.CZ thE 1TIe2~: normal proChro111C)in
I::.1TlC
(kp%TPT) of expre=s?on (4) which, in turn, are used io determine
the corrected anticoagulzr?L L?7zrapy (CATF) of :,_prdsSiojj ~^).
The accuracy of these quc~riLi tias is derender~t , i n part, on thE
n.unber of specirnens used, that is, the nunbEr of st.able
pazienis; wherein for the practice of the pr esant invention,
to be further discussed hereinafter'with reference to a
calibration procedure, a number of at least twerlty (20) of
stable patients is preferably used and which is in agreement
with that usLd in the a2'r to establ,ish a populati on sampling
standard, such as disc'loaed i.n the previously introducec(
technical article of L. Po11.er et al.
The greater than twenty (20} specimens each are
separately handled to derive separate corrected anticoaq-ulant
therapy factor (CA.TF), but with a plurality of specimens being
manipulated to derive the mean norz4al prothrombin time kMNPT)
that is used in the derivation of zach separate anticoacfulant
therapy factor (CAT?) quantity.
Comnarative_me tina of CATF and INR ~uantities
In the practice of the invention, the T.NRs, ATFs e.rGd
corrected ATFs (C-kTF of expressi4n (4) ) were determined from
20 normal patient:s, Quantities of ATF and ZNR used in the
practice were already available, such as those discussecl with
Teference to FigS. 2-8. Further, additional INR, were
determined using a thromboplastin, Thrornbop7.ast.in C p3.us; of
the Dade Corporation, which was analyzed by usxng a Caaq-A-
Mate Coagulati on Analyzer known in the art. The INRs
deCermined by the Coag-A-Mate Coagu7.ation Analyzer were
compared to corrected AFTs. The
?g
CA 02339006 2001-01-30
WO 00/07012 PCT/US98/15972
comparison between the corrected ATFs and gathered INRs may be
further described with reference to Fig. 13 previously
mentioned.
Figs. 13 and 14 are similar to Figs. 3-4 having a X axis
indicated by INR, but now having a Y axis indicated by CATF.
Fig. 13 shows the composite plot of corrected AFTs (CATF)
versus INRs for 510 samples from the stable patients using
four separate thromboplastins; Thromboplastin C plus (TPC),
Innovin (INN), Sigma (SIG) and Pacific Hemostasis-D (PHT) all
known in the art. The plot of Fig. 13 has a correlation
factor r, = 0.6860. From Fig. 13, in a manner as previously
discussed, it should be noted that the plot thereof represents
a zero (0) intercept line and has a slope of 1 both previously
described. The comparison between the corrected ATFs (CATF)
and INR related to the present invention may be further
described with reference to Fig. 14.
Fig. 14 shows the plot of corrected ATFs (CATF) versus
INR for 380 samples from the 20 stable patients yielding a
correlation factor, r, of 0.9126. Fig. 14 differs from Fig.
13 in that the INN thromboplastin of Fig. 13 was excluded from
Fig. 14.
As in known in the art, the INN thromboplastin is
prepared by recombinant technology and has an ISI of 1.02,
whereas the other three thromboplastins (TPC, SIG and PHT) are
prepared from rabbit brain and have ISIs of 2.12, 2.51 and
1.99 respectively. The use of INN thromboplastin results in
definitely longer prothrombin times in otherwise prolonged
specimens (i.e., times greater than 15 seconds) and the INN
thromboplastins also has a slower reacting time as may be seen
in the clotting graphs of time vs optical density yielded by
using the arrangement of Fig. 1. This slower reaction time
results in individual tests ending before the actual final
total fibrinogen (FBG) value is achieved.
29
SUBSTITUTE SHEET (RULE 26)
CA 02339006 2001-01-30
WO 00/07012 PCT/US98/15972
A small number for FBG results, so the FTR is increased and
the ATF, hereby, increases. (This end point detection problem
also exists to a lesser extent with Sigma thromboplastin).
The problem can be resolved by extending measurement time
until "End of Test" results or 120 second expire, whichever
comes first. The error at 120 sec does not matter, as
compared to tests that run with a cut-off time of 60 seconds.
The 60 second duration is fully adequate for prothrombin
times; but not, as is apparent, for FBGs determined using INN
and to a lesser extent using the SIG thromboplastin. The
comparison testing between the modified ATFs (MATF) and INR's
may be further described with reference to Figs. 15-18.
Figs. 15, 16, 17 and 18 illustrate the plots showing the
correlation between the modified anticoagulant therapy factor
(MATFs) and the INR's respectively using 92 samples derived
from the TPC thromboplastin yielding a correlation factor, r,
of 0.9759; 93 samples derived from the SIG thromboplastin
yielding a correlation factor, r, of 0.9442; 101 samples
derived from the PHT thromboplastin yielding a correlation
factor, r, of 0.9268; and 96 samples of the INN thromboplastin
yielding a correlation factor, r, of 0.8927.
A review of the above results illustrated in Figs. 13-14
show an acceptable correlation factor (r) of corrected ATFs
(CATFs) to INRs, and a review of the above results illustrated
in Figs. 15-18 show an acceptable correlation factor (r) of
modified ATFs (MATFs) to INRs. The results are further
improved when INN thromboplastin (included in Figs. 13 and 15)
is excluded, but clinical medicine demands attention to the
individual patient. Accordingly, the use of the INN
thromboplastin needs to be taken into account. In this part of
the study shown in Figs. 13-18, we compared corrected ATFs
(CATFs) and modified ATFs (MATFs) to the
SUBSTITUTE SHEET (RULE 26)
CA 02339006 2001-01-30
WO 00/07012 PCT/US98/15972
INRs determined on the "POTENS +" arrangement of Fig. 1 and/or
in the clinical laboratory by using the Coag-A-Mate
Coagulation Analyzer known in the art. These clinical
laboratory INR results were those actually used for patient
care in a manner as hereinbefore described. The raw data
accumulated to derive the plots of Figs. 15-18 are given below
in Tables 2 and 3.
31
SUBSTITUTE SHEET (RULE 26)
CA 02339006 2001-01-30
WO 00/07012 PCT/US98/15972
TABLE 2
TPC INN SIG PHT
INR's MATF's INR's MATF'S INR's MATF's INR's MATF's
3.6 3.6 1.5 1.5 4.0 4.3 3.2 3.1
1.2 1.1 1.0 1.5 1.1 1.2 1.4 1.3
0.8 0.9 2.4 2.0 0.9 1.2 0.9 1.1
1.7 1.5 1.0 1.5 2.4 2.0 1.8 1.7
0.9 1.0 1.4 1.5 0.8 1.3 1.0 1.2
1.2 1.2 3.4 3.0 1.0 1.2 1.1 1.2
3.2 3.7 2.1 1.9 3.1 2.6 2.9 3.6
1.9 1.6 4.4 5.2 3.4 2.2 2.2 2.1
3.0 2.8 2.7 2.4 2.5 2.2 2.3 1.9
2.4 2.1 2.7 2.1 2.2 2.1 2.2 1.8
1.3 1.4 2.2 2.0 1.2 1.5 2.4 1.9
1.4 1.3 1.6 1.5 1.7 1.6 1.3 1.4
1.8 1.6 2.0 1.8 1.6 1.5 1.6 1.4
1.9 1.5 2.0 1.8 1.3 1.5 1.6 1.7
3.0 3.4 1.8 1.8 1.7 1.4 1.3 1.4
1.0 1.1 2.2 1.8 6.7 4.8 1.7 1.5
3.5 3.1 4.4 5.7 1.1 1.3 4.4 4.8
3.2 2.9 1.3 1.5 3.4 2.8 1.2 1.4
2.5 2.4 4.2 4.1 5.4 4.5 3.2 3.0
1.7 1.6 5.3 4.6 1.8 1.5 4.4 5.3
1.3 1.1 2.3 1.8 1.3 1.5 2.4 2.2
1.9 2.0 1.5 1.5 2.4 1.4 1.8 2.2
1.2 1.1 3.0 2.1 1.5 1.6 1.6 1.5
1.3 1.2 1.9 1.7 1.5 1.5 2.1 2.0
32
SUBSTITUTE SHEET (RULE 26)
CA 02339006 2001-01-30
WO 00/07012 PCT/US98/15972
TABLE 2 (CONTINUED)
TPC INN SIG PHT
INR's MATF's INR's MATF's INR's MATF's INR's MATF's
0.7 0.9 1.6 1.6 0.8 1.1 1.5 1.6
3.2 3.3 1.1 1.5 3.3 2.5 1.6 1.6
2.5 1.8 3.6 2.9 4.5 2.5 0.8 1.0
2.0 1.7 4.6 3.0 2.0 1.5 3.3 2.7
0.8 1.0 2.4 1.8 1.0 1.5 4.1 2.4
0.9 1.0 1.0 1.5 0.9 1.4 2.2 1.9
1.6 1.7 2.7 2.0 2.5 2.3 0.9 1.1
1.7 1.6 1.9 1.7 1.6 1.7 1.1 1.3
1.3 1.3 1.5 1.6 1.3 1.4 2.3 2.4
2.7 2.6 3.4 3.2 2.1 2.4 1.4 1.7
1.3 1.2 1.5 1.6 2.3 2.2 1.7 1.7
0.8 0.9 1.0 1.5 1.1 1.3 1.4 1.4
1.2 1.2 4.0 4.0 0.7 1.1 2.0 1.9
2.6 2.4 1.5 1.7 5.3 5.7 2.2 2.2
2.4 2.6 1.7 1.8 1.4 2.1 1.3 1.4
2.5 2.0 3.3 2.5 3.5 3.8 0.8 1.0
1.4 1.5 2.7 3.4 2.6 3.3 1.1 1.3
1.6 1.4 2.9 3.2 2.7 2.7 1.4 1.6
1.2 1.3 2.0 1.9 1.3 1.5 2.3 2.3
2.0 1.9 1.7 1.6 1.9 2.9 2.4 2.4
3.6 3.4 1.7 1.7 3.5 4.3 1.6 1.4
1.0 1.3 4.9 6.6 7.4 7.9 1.4 1.4
1.6 1.7 1.9 2.0 1.3 1.6 1.4 1.5
1.5 1.5 2.3 2.0 2.1 2.0 2.7 2.6
33
SUBSTITUTE SHEET (RULE 26)
CA 02339006 2001-01-30
WO 00/07012 PCT/US98/15972
TABLE 2 (CONTINUED)
TPC INN SIG PHT
INR's MATF's INR's MATF's INR's MATF's INR's MATF's
1.8 2.0 1.4 1.6 1.4 1.7 3.9 2.9
1.8 1.9 1.9 1.8 1.6 1.7 1.3 1.5
6.3 6.5 2.2 2.2 2.1 2.3 1.8 1.9
1.1 1.2 1.6 1.6 2.1 2.8 1.3 1.6
6.3 6.9 4.1 3.3 1.4 1.5 1.5 1.5
1.3 1.2 1.9 1.8 11.0 15.0 2.0 1.9
2.6 2.4 2.0 1.7 3.6 3.1 1.9 1.8
1.2 1.2 1.8 1.9 1.8 2.1 1.1 1.4
0.8 0.9 3.1 3.0 6.8 6.2 2.8 1.6
1.8 1.8 1.2 1.5 1.9 1.6 1.9 1.6
1.8 1.7 2.1 2.0 1.9 1.4 1.5 1.2
0.8 0.9 2.0 2.0 2.2 1.7 3.0 3.0
0.9 1.0 1.2 1.5 1.0 1.5 1.5 1.7
1.5 1.4 1.1 1.5 1.0 1.3 2.8 2.6
0.7 0.9 1.9 1.7 1.4 1.5 0.9 1.2
1.8 1.6 0.9 1.5 1.7 1.9 2.0 1.7
2.2 2.1 2.0 1.7 2.8 2.8 2.2 1.8
1.5 1.5 2.6 2.9 4.5 3.4 1.0 1.2
1.6 1.4 3.5 4.2 1.7 2.1 0.9 1.1
1.7 1.5 1.6 1.9 2.8 2.5 1.5 1.4
1.4 1.4 2.5 2.1 2.9 2.5 0.6 1.0
2.7 2.2 2.5 1.8 3.2 2.9 1.5 1.6
2.8 2.6 2.4 2.3 2.0 1.8 2.5 2.4
1.9 2.0 2.6 2.4 1.3 1.5 2.7 2.3
34
SUBSTITUTE SHEET (RULE 26)
CA 02339006 2001-01-30
WO 00/07012 PCT/US98/15972
TABLE 2 (CONTINUED)
TPC INN SIG PHT
INR's MATF's INR's MATF's INR's MATF's INR's MATF's
1.4 1.3 1.8 1.7 1.6 1.8 1.4 1.6
1.7 1.7 1.8 1.6 1.6 1.5 1.9 1.6
1.4 1.4 1.9 1.8 1.3 1.6 2.4 1.4
1.2 1.3 1.8 1.7 2.3 2.1 2.2 2.1
2.6 2.8 1.3 1.5 3.0 3.1 1.1 1.6
2.4 3.0 3.1 2.6 1.8 2.0 1.2 1.6
0.9 1.1 3.4 3.9 1.0 1.2 1.5 1.5
1.8 1.5 2.2 2.0 2.1 1.6 1.6 1.8
1.5 1.5 1.3 1.5 1.8 1.6 1.6 1.5
1.1 1.1 2.6 2.0 1.5 1.5 1.4 1.5
0.9 1.1 2.0 1.8 1.0 1.1 2.2 2.5
1.5 1.7 1.8 1.7 1.6 1.7 3.0 2.8
3.1 3.2 1.3 1.5 2.8 2.4 1.7 1.8
3.3 3.9 1.2 1.5 0.9 1.2 1.0 1.1
0.8 1.0 4.2 3.9 2.7 2.1 2.0 1.7
1.7 2.1 3.9 4.5 10.0 10.0 1.8 1.8
1.1 1.1 1.1 1.5 2.5 2.5 1.6 1.6
3.5 3.3 2.5 2.3 1.0 1.2 1.1 1.2
1.0 1.1 2.7 2.3 3.4 3.0 0.9 1.2
0.8 1.0 1.5 1.5 1.2 1.3 1.4 1.7
3.6 3.5 0.7 1.1 3.8 3.5
5.4 8.0 0.9 1.2
1.4 1.6 2.6 2.5
1.0 1.5 8.0 10.0
SUBSTITUTE SHEET (RULE 26)
CA 02339006 2001-01-30
WO 00/07012 PCT/IJS98/15972
TABLE 2 ( CONTINtIED )
TPC INN SIG PHT
INR's MATF's INR's MATF's INR's MATF's INR's MATF's
2.0 1.9
1.1 1.2
2.8 2.7
1.1 1.3
0.8 1.0
36
SUBSTITUTE SHEET (RULE 26)
CA 02339006 2001-01-30
WO 00/07012 PCT/US98/15972
TABLE 3
Clinical
Lab INR MATF'S
1.6 1.4
2.2 1.8
1.4 1.5
2.3 2.1
3.9 3.7
1.4 1.4
1.8 1.4
1.0 1.3
1.1 1.3
2.1 2.0
1.2 1.2
1.2 1.3
2.9 2.7
1.8 1.7
2.2 2.0
1.3 1.3
2.4 1.9
2.7 2.0
1.3 1.3
2.1 2.0
3.3 3.0
1.1 1.2
1.5 1.4
3.4 2.9
37
SUBSTITUTE SHEET (RULE 26)
CA 02339006 2001-01-30
WO 00/07012 PCT/US98/15972
TABLE 3 ( CONTINiJED )
Clinical
Lab INR MATF's
2.1 1.8
2.0 1.7
1.2 1.3
2.3 1.9
2.3 1.7
3.0 2.9
1.9 1.6
4.0 4.0
2.2 2.0
2.1 1.8
2.3 2.2
1.8 1.5
1.3 1.2
2.4 2.0
1.3 1.3
1.0 1.2
2.8 2.6
1.9 1.9
1.9 2.4
1.7 1.7
1.3 1.4
1.4 1.4
1.3 1.4
2.0 2.1
38
SUBSTITUTE SHEET (RULE 26)
CA 02339006 2001-01-30
WO 00/07012 PCT/US98/15972
TABLE 3 (CONTINUED)
Clinical
Lab INR MATF's
3.9 3.8
4.2 4.5
2.6 2.6
1.6 1.4
1.6 1.4
1.2 1.3
2.2 1.7
2.4 2.1
1.9 1.8
Table 2 has four (4) columns grouped into TPC
thromboplastin, INN thromboplastin, SIG thromboplastin and PHT
thromboplastin, each of which is sub-divided into two columns
INR's and MATF's. Table 3 has two columns respectively
identified as clinical Lab INR and modified ATFs (MATF's). In
each of the columns of Tables 2 and 3 the quantities therein
are considered to be undesired if the individual MATFs differs
from the corresponding mean INR by more than 10%. Further,
in each of the columns of Tables 2 and 3 the quantities
therein are considered undesired if the individual MATF is
within * 10% of the corresponding INR for a given range of
INR, such as International Sensitivity Index (ISI) of between
2-3.0, but outside of 10% range of the corresponding INR for
a different range of INR, such as ISI of between 3.0-4.5.
Table 2 shows four columns of pairs of data, representing
39
SUBSTITUTE SHEET (RULE 26)
CA 02339006 2007-07-27
63129-113
Iq=_'?'F Valuf-R.5 V5 _lq: s YJrz.?7 C-Re bLkTX' 'ie:.'_7y o...t".aiZ?_d -f-
roIh i:?1e
POTx~'.dS - ar: angGm?n; o= r i g. 1, The i,LkT7- :r- eaCh cc__umn :.S
related co its own pai=ed II1P,, and eacn of tZe rour pa__red
co2un]-rls -s independent 4I Lrie oL17eSS . Whe17 cGppe-!'iIlg 1_!1e
obtained INR to the sample or staszdard INR acting as a
refeience, a dllfC:rellce oL 0.5 uT1i7-5 Che.e~DeCWean is
cons:idered acceptab? z. ~?lso considered acceptable, is wizen
the IN'ft is within +/- 10% of the corresponding mea.n sainple INR
value. Wherj this same ruler is applied to the ATrs and INRs,
0.5 units or less is considered an acceptable differen:-e, in a
manner similar to that described in the Technical Bulletin,
Judy R. BodwE].1, MT (ASCP) SC, boehringer Maiunheizn
Corporation, or when the ATF is w,~thi.n + or - 10% of 1JJR
reference in a manner similar to that disc].oaed in the
previously mentioned reference of Paller at al, American
Journal of Clinical Pathology 1996; 109; 196-204. The
therapeutic range for INRe for treatment of venoue
thrornbosis, pulmonary einbolisrn, a.Ad prevention of systeznic
embolism is 2.0 - 3.0 and for mechanical prosthetic valves it
is 2.5 - 3.5 units. The ranges of = for various tre:a'Cment
ars more fully disclosed in the technical article en,titled
"Plechanism of Action, Clinical EffeGtiveness, and Cpti.mal
Therapeutic Range" of J. Hi,~7sh et al, publ.a.shed in ornl
Amticoaaulants= Chest, 102, 4, 4c~tober, 1991, Supplement.
A review of Table 2 revea,ls, that for the use of the TPC
thromboplastin two (2) patients out of ninety-two I92, showed
a difference greater tham 0.5 units.
A further review of Table 2 reveals that for the use of
INN thromboplastin, 10 of 96 patients shows an MATF - INR
difference greater than 0.5 and some adjustment in th-a INN
thromboplastin dosage could be considexed to bring pacients
back into range. For the use of the SIC thrc,mboplastin, 12 of
43 -Datzents had
Q0.
iI
CA 02339006 2007-07-27
G3J.L5-1~3
d? =r?, ?I1C~ ~r ca ~=Y LS23r ~ . ? d'ld ~OIj1E G~ t~~5e ~7c~1 ~?2 ~ wolliCj
nroLa~?j not r6qv.ire medicst.ior change. F:,r Lhe usz- of che
PNT *-h?"oICWOp1asLi?'l. 5 0= 101 -Datzents showed a greatez t:ha-n
0.5 di rference and some would probably not recauY re a ch<<nge in
anedication.
An overall reva.ew Ds Table 2 reveaIs good results 1:oz7 the
i.zldividual natients witb each of uhe four thromboplasti.ns,
especially with xl'C and PHT thxombopZastins ara,d with 1e: s
desired results for INN and SIG thx omboplast=xis relative to
those obtained from the TPC axld P.T-TT. thzomboplastins .
A review of Table 3 of the "modified ATFs" to the ::NRs
determin.ed in the c1inical laboxatory, for samples from 57
patients reveals only 1 patient exhibited a difference cireater
tha.ri 0.5 units. ln the coinparison of 'Table 2, TPC was used on
both coagul.ation instruments, i.e_, on the "PQTENS +"
arrangement of Fig. 1 and oza, the one available in the c].ia.ical
laboratozy, that is, the Coag-A-Mate system.
The information given in Tables 2 azd 3 wLy be
reformatted as shown in the below Tables 4A and 4B,
respectively, and compared to the information and analy5.xs
described in the previously introduced technical article: of
V.L. NG et al, more particularly, Table 4 therein:
Q1
CA 02339006 2001-01-30
WO 00/07012 PCT/US98/15972
TABLE 4A
RANGE
Total Number
Thromboolastin < 2.0 ! 2.0-3.0 > 3.0-4.5 ! >4.5 of Mismatches
T P C 4 ( 4 .4)L63- ! 4(1. 3 )117 1 ( 0 , 1) / 9 ! 1 _(0 .1)/3 10 / 9 2 = 11.
0 %
INN 1(1,0)/45 !13(2,11)/311 7(2,5)/16 1 1(0,1)/4 122/96 = 23.0%
SIG ! 4(4,0)/50 1 7(2,5)/24 i 7(0,7)/12 ! 1(0.1)/7 119/93 =Ø0$
PHT ~ 1(1.0)/62 !13i1.12)/301 6(2.4)/8 1 0(0,0)/1 !20/101-20.0$
TABLE 4B
RANGE
Total Number
Thromboolastin < 2.0 2.0-3.0 ~> 3.0-4.5 ~ >4.5 of Mismatches
ITPC ~ 1(1.0)/29 8(0,8)/22 2(0.2)/6 0(0,0)/0 !11/57 = 19.0%
Tables 4A and 4B are arranged in a similar manner as that of
Table 4 of the technical article of V.L. NG et al, wherein the left-
most column thereof indicates the Thromboplastin used, the central
columns thereof indicate the therapeutic ranges, and the right-most
column indicates the total number of mismatches. More particularly,
and using the TPC thromboplastin of range < 2.0 of Table 4A as an
example, the central columns indicate the total number (4) of lower
and highs (0,4) reading of INR in that particular range, and the total
number (60) of samples taken in that particular range. Further for
this same example, the right-
42
SUBSTITUTE SHEET (RULE 26)
CA 02339006 2001-01-30
WO 00/07012 PCT/US98/15972
most column indicates the total lower and higher reading of
INR (9) measured against the total samples (87) so as to
derive a percentage (9/87 = 10%).
From a review of Tables 4A and 4B it is realized that a
discordance of 6-25% is obtained by the practice of this
invention which is much better than the 17-29% described in
the V.L. NG et al technical article.
Calibration of ATF
In the practice of this invention it is preferred that
when a new lot of thromboplastin is to be used, it is desired
to reestablish the mean normal prothrombin time MNPT so as to
compute an INR value for each patient. For such a
reestablishment, it is preferred that the circuit arrangement
of Fig. 1 be calibrated. To accomplish such calibration, the
specimens that are used to derive the MNPT are pooled to
establish the low ATF value of the new lot in a manner as
hereinbefore described. A pool of patients who have been on
oral anticoagulants for at least 6 weeks, and ideally with an
INR value of 3.0 or greater, is preferably used to establish
the high ATF value. A run of at least 20 samples each of the
high and low ATF pools establishes the instrument's precision
as well as the MEAN(X), MEAN(Y) and SLOPE(X,Y) in a manner as
hereinbefore described. These high and low ATF values are
used to produce the modified ATF (MATF) value and are specific
for each thromboplastin. These low and high ATF values are
used as references to compare against when the new lot of
thromboplastins are analyzed by the practice of the present
invention to obtain both the ATF and CATF hereinbefore
discussed.
In the practice of the present invention, the above
43
SUBSTITUTE SHEET (RULE 26)
CA 02339006 2001-01-30
WO 00/07012 PCT/US98/15972
calibration procedure was performed using Tnromboplastin C+ of
Dade Corporation and satisfactory results were obtained,
although the slope and intercept quantities were not exactly 1
and 0 respectively.
It should now be appreciated that the practice of the
present invention provides for methods and apparatuses to
derive an anticoagulant therapy factor (ATF), a corrected
anticoagulant therapy factor (CATF), and a modified
anticoagulant therapy factor (MATF), all of which correlate
well with the International Normalized Ratio (INR), yet do not
suffer from the inaccuracy contributed to by the various
thromboplastins derived from either rabbit or bovine brain.
While the invention has been described with reference to
specific embodiments, the description is illustrative and is
not to be construed as limiting the scope of the invention.
Various modifications and changes may occur to those skilled
in the art without departing from the spirit and scope of the
invention as defined by the appended claims.
44
SUBSTITUTE SHEET (RULE 26)