Note: Descriptions are shown in the official language in which they were submitted.
CA 02347494 2001-04-12
WO 00/22413 PCT/US99/23665
METHODS AND APPARATUS FOR TAILORING SPECTROSCOPIC
CALIBRATION MODELS
Cross Reference to Co-Pending-Applications
The present application is a continuation-in-part of U.S. Patent Application
Serial No. 09/170,022, filed October 13, 1998.
Technical Field
The present invention relates generally to methods for multivariate
calibration
and prediction and their application to the non-invasive or non-destructive
measurement of selected properties utilizing spectroscopy methods. A specific
implementation of the invention relates to the situation where the
multivariate
calibration and prediction methods are utilized in a situation wherein
biological tissue
is irradiated with infrared energy having at least several wavelengths and
differential
absorption by the biological tissue sample is measured to detetrnine an
analyte
concentration or other attribute of the tissue by application of the
calibration model to
the resulting spectral information.
Background of the Invention
The need and demand for an accurate, non-invasive method for determining
attributes of tissue, other biological samples or analyte concentrations in
tissue or
blood are well documented. For example, accurate non-invasive measurement of
blood glucose levels in patients, particularly diabetics, would greatly
improve
treatment. Barnes et al. (U.S. Patent No. 5,379,764) disclose the necessity
for
diabetics to frequently monitor glucose levels in their blood. It is further
recognized
that the more frequent the analysis, the less likely there will be large
swings in
glucose levels. These large swings are associated with the symptoms and
CA 02347494 2001-04-12
WO 00/22413 PCT/US99/23665
complications of the disease, whose long-term effects can include heart
disease,
arteriosclerosis, blindness, stroke, hypertension, kidney failure, and
premature death.
As described below, several systems have been proposed for the non-invasive
measurement of glucose in blood. However, despite these efforts, a lancet cut
into the
5 finger is still necessary for all presently commercially available forms of
home
glucose monitoring. This is believed so compromising to the diabetic patient
that the
most effective use of any form of diabetic management is rarely achieved.
The various proposed non-invasive methods for determining blood glucose
level generally utilize quantitative infrared spectroscopy as a theoretical
basis for
10 analysis. In general, these methods involve probing glucose containing
tissue using
infrared radiation in absorption or attenuated total reflectance mode.
Infrared
spectroscopy measures the electromagnetic radiation (0.7-25 pm) a substance
absorbs
at various wavelengths. Molecules do not maintain fixed positions with respect
to
each other, but vibrate back and forth about an average distance. Absorption
of light
15 at the appropriate energy causes the molecules to become excited to a
higher vibration
level. The excitation of the molecules to an excited state occurs only at
certain
discrete energy levels, which are characteristic for that particular molecule.
The most
primary vibrational states occur in the rnid-infrared frequency region (i.e.,
2.5-25 p.cn).
However, non-invasive analyte determination in blood in this region is
problematic, if
20 not impossible, due to the absorption of the light by water. The problem is
overcome
through the use of shorter wavelengths of light which are not as attenuated by
water.
Overtones of the primary vibrational states exist at shorter wavelengths and
enable
quantitative determinations at these wavelengths.
It is known that glucose absorbs at multiple frequencies in both the mid- and
-2-
CA 02347494 2001-04-12
WO 00/22413 PCTNS99/23665
near-infrared range. There are, however, other infrared active analytes in the
tissue
and blood that also absorb at similar frequencies. Due to the overlapping
nature of
these absorption bands, no single or specific frequency can be used for
reliable non-
invasive glucose measurement. Analysis of spectral data for glucose
measurement
5 thus requires evaluation of many spectral intensities over a wide spectral
range to
achieve the sensitivity, precision, accuracy, and reliability necessary for
quantitative - -
determination. In addition to overlapping absorption bands, measurement of
glucose
is further complicated by the fact that glucose is a minor component by weight
in
blood and tissue, and that the resulting spectral data may exhibit a non-
linear response
10 due to both the properties of the substance being examined and/or inherent
non
Iinearities in optical instrumentation.
A further common element to non-invasive glucose measuring techniques is
the necessity for an optical interface between the body portion at the point
of
measurement and the sensor element of the analytical instrument. Generally,
the
15 sensor element must include an input element or means for irradiating the
sample
point with the infrared energy. The sensor element must further include an
output
element or means for measuring transmitted or reflected energy at various
wavelengths resulting from irradiation through the input element. The optical
interface also introduces variability into the non-invasive measurement.
20 Robinson et al. (U.S. Patent No. 4,975,5$1) disclose a method and apparatus
for measuring a characteristic of unknown value in a biological sample using
infrared
spectroscopy in conjunction with a multivariate model that is empirically
derived
from a set of spectra of biological samples of known characteristic values.
The
above-mentioned characteristic is generally the concentration of an analyte,
such as
-3-
CA 02347494 2001-04-12
WO 00/22413 PCT/US99/23665
glucose, but also may be any chemical or physical property of the sample. The
method of Robinson et al. involves a two-step process that includes both
calibration
and prediction steps. In the calibration step, the infrared light is coupled
to calibration
samples of known characteristic values so that there is differential
attenuation of at
S least several wavelengths of the infrared radiation as a function of the
various
components and analytes comprising the sample with known characteristic value.
- -
The infrared light is coupled to the sample by passing the light through the
sample or
by reflecting the light from the sample. Absorption of the infrared light by
the sample
causes intensity variations of the light that are a function of the wavelength
of the
10 light. The resulting intensity variations at the at least several
wavelengths are
measured for the set of calibration samples of known characteristic values.
Original
or transformed intensity variations are then empirically related to the known
characteristic of the calibration samples using a multivariate algorithm to
obtain a
multivariate calibration model. In the prediction step, the infrared light is
coupled to a
15 sample of unknown characteristic value, and the calibration model is
applied to the
original or transformed intensity variations of the appropriate wavelengths of
light
measured from this unknown sample: The result of the prediction step is the
estimated value of the characteristic of the unknown sample. The disclosure of
Robinson et al. is incorporated herein by reference.
20 Barnes et al. (U.S. Patent No. 5,379,764) disclose a spectrographic method
for
analyzing glucose concentration wherein near infrared radiation is projected
on a
portion of the body, the radiation including a plurality of wavelengths,
followed by
sensing the resulting radiation emitted from the portion of the body as
affected by the
absorption of the body. The method disclosed includes pretreating the
resulting data
-4-
CA 02347494 2001-04-12
WO 00/22413 PCT/US99/23665
to minimize influences of offset and drift to obtain an expression of the
magnitude of
the sensed radiation as modified.
Dahne et al. (U.S. Patent No. 4,655,225) disclose the employment of near
infrared spectroscopy for non-invasively transmitting optical energy in the
near
infrared spectrum through a forger or earlobe of a subject. Also discussed is
the use
of near infrared energy diffusely reflected from deep within the tissues.
Responses -
are derived at two different wavelengths to quantify glucose in the subject.
One of the
wavelengths is used to determine background absorption, while the other
wavelength
is used to determine glucose absorption.
Caro (U.S. Patent No. 5,348,003) discloses the use of temporally modulated
electromagnetic energy at multiple wavelengths as the irradiating light
energy. The
derived wavelength dependence of the optical absorption per unit path length
is
compared with a calibration model to derive concentrations of an analyte in
the
medium.
Wu et al. (U.S. Patent No. 5,452,723) disclose a method of spectrographic
analysis of a tissue sample which includes measuring the diffuse reflectance
spectrum,
as well as a second selected spectrum, such as fluorescence, and adjusting the
spectrum with the reflectance spectrum. Wu et al. assert that this procedure
reduces
the sample-to-sample variability.
The intended benefit of using models such as those disclosed above, including
multivariate analysis as disclosed by Robinson, is that direct measurements
that are
important but costly, time consuming, or difficult to obtain, may be replaced
by other
indirect measurements that are cheaper and easier to get. However, none of the
prior
art modeling methods, as disclosed, has proven to be sufficiently robust or
accurate to
-5-
CA 02347494 2001-04-12
WO 00/22413 PCTNS99/23665
be used as a surrogate or replacement for direct measurement of an analyte
such as
glucose.
Of particular importance to the present invention is the use of multivariate
analysis. Measurement by multivariate analysis involves a two-step process. In
the
5 first step, calibration, a model is constructed utilizing a dataset obtained
by
concurrently making indirect measurements and direct measurements (e.g., by
invasively drawing or taking and analyzing a biological sample such as blood
for
glucose levels) in a number of situations spanning a variety of physiological
and
instrumental conditions. A general form for the relationship between direct
(blood-
10 glucose concentration) and the indirect (optical) measurements is G = f (y,
y2, . . . ,
y9), where G is the desired estimated value of the direct measurement
(glucose), f is
some function (model), and y~, y2, . . ., y9 (the arguments of f) represents
the indirect
(optical) measurement, or transformed optical measurements, at q wavelengths.
The
goal of this first step is to develop a useful function, f . In the second
step, prediction,
15 this function is evaluated at a measured set of indirect (optical)
measurements {yt, y2,
. . . , y9} in order to obtain an estimate of the direct measurement (blood-
glucose
concentration) at some time in the future when optical measurements will be
made
without a corresponding direct or invasive measurement.
Ideally, one would prefer to develop a calibration model that is applicable
20 across all subjects. Many such systems have been proposed as discussed
above.
However, it has been shown that for many applications the variability of the
items
being measured makes it difficult to develop such a universal calibration
model. For
the glucose application, the variability is across subjects with respect to
the optical
appearance of tissue and, possibly, across the analyte within the tissue.
-6-
CA 02347494 2001-04-12
WO 00/22413 PCT/US99/23665
Figure 1 indicates the levels of spectral variation observed both among and
within subjects during an experiment in which 84 measurements were obtained
from
each of 8 subjects. Sources of spectral variation within a subject include:
spatial
effects across the tissue, physiological changes within the tissue during the
course of
S the experiment, sampling effects related to the interaction between the
instrument and
the tissue, and instrumental/environmental effects. The spectral variation
across
subjects is substantially larger than the sum of all effects within a subject.
In this case
the subjects were from a relatively homogeneous population. In the broader
population it is expected that spectral variation across subjects will be
substantially
10 increased. Thus, the task of building a universal calibration model is a
daunting one.
In order to avoid the issue of variability across subjects, one approach
involves
building a completely new model for each subject. Such a method involves a
substantial period of observation for each subject, as taught by R. Marbach et
al.,
"Noninvasive Blood Glucose Assay by Near-Infrared Diffuse Reflectance
15 Spectroscopy of the Human Inner Lip," Applied Spectroscopy, 1993, 47, 875-
881.
This method would be inefficient and impractical for commercial glucose
applications
due to the intensive optical sampling that would be needed for each subject.
Another approach taught by K. Ward et al., "Post-Prandial Blood Glucose
Determination by Quantitative Mid-Infrared Spectroscopy," Applied
Spectroscopy,
20 1992, 46, 959-965, utilizes partial least-squares multivariate calibration
models based
on whole blood glucose levels. When the models were based on in vitro
measurements using whole blood, a subject-dependent concentration bias was
retrospectively observed, indicating that additional calibration would be
necessary.
In an article by Haaland et al., "Reagentless Near-Infrared Determination of
_7_
CA 02347494 2001-04-12
WO 00/22413 PCT/US99/23665
Glucose in Whole Blood Using Multivariate Calibration," Applied Spectroscopy,
1992, 46, 1575-1578, the authors suggest the use of derivative spectra for
reducing
subject-to-subject (or inter-subject) spectral differences. The method was not
found
to be effective on the data presented in the paper. First derivatives are an
example of
5 a general set of processing methods that are commonly used for spectral
pretreatment.
A general but incomplete list of these pretreatment methods would include
trimming,
wavelength selection, centering, scaling, normalization, taking first or
higher
derivatives, smoothing, Fourier transforming, principle component selection,
linearization, and transformation. This general class of processing methods
has been
10 examined by the inventors and has not been found to effectively reduce the
spectral
variance to the level desired for clinical prediction results.
In an article by Lorber et al., "Local Centering in Multivariate Calibration,"
.lournal of Chemometrics, 1996, 10, 215-220, a method of local centering the
calibration data by using a single spectrum is described. For each unknown
sample,
15 the spectrum used for centering the calibration data set is selected to be
that spectrum
that is the closest match (with respect to Mahalanobis distance) to the
spectrum of the
unknown. A separate partial least-squares model is then constructed for each
unknown. The method does not reduce the overall spectroscopic variation in the
calibration data set.
20 Accordingly, the need exists for a method and apparatus for non-invasively
measuring attributes of biological tissue, such as glucose concentrations in
blood,
which incorporates a model that is sufficiently robust to act as an accurate
surrogate
for direct measurement. The model would preferably account for variability
both
between subjects and within the subject on which the indirect measurement is
being
_g_
CA 02347494 2001-04-12
WO 00/22413 PCTNS99/236b5
used as a predictor. In order to be commercially successful, applicants
believe, the
model should not require extensive sampling of the specific subject on which
the
model is to be applied in order to accurately predict a biological attribute
such as
glucose. Extensive calibration of each subject is currently being proposed by
5 BioControl Inc. In a recent press release the company defines a 60-day
calibration
procedure followed by a 30-day evaluation period.
The present invention addresses these needs as well as other problems
associated with existing models and calibrations used in methods for non-
invasively
measuring an attribute of a biological sample such as glucose concentration in
blood.
10 The present invention also offers further advantages over the prior art and
solves
problems associated therewith.
Summary of the Invention
The present invention is a method that reduces the level of interfering
spectral
variation that a multivariate calibration model needs to compensate for. An
important
15 application of the invention is the non-invasive measurement of an
attribute of a
biological sample such as an analyte, particularly glucose, in human tissue.
The
invention utilizes spectroscopic techniques in conjunction with improved
protocols
and methods for acquiring and processing spectral data. The essence of the
invention
consists of protocols and data-analytic methods that enable a clear definition
of intra-
20 subject spectral effects while reducing inter-subject spectral effects. The
resulting
data, which have reduced inter-subject spectroscopic variation, can be
utilized in a
prediction method that is specific for a given subject or tailored (or
adapted) for use
on the specific subject. The prediction method uses a minimal set of reference
samples from that subject for generation of valid prediction results.
-9-
CA 02347494 2001-04-12
WO 00/22413 PCT/US99/23665
A preferred method for non-invasively measuring a tissue attribute, such as
the
concentration of glucose in blood, includes first providing an apparatus for
measuring
infrared absorption by a biological sample such as an analyte containing
tissue. The
apparatus preferably includes generally three elements, an energy source, a
sensor
5 element, and a spectrum analyzer. The sensor element includes an input
element and
an output element. The input element is operatively connected to the energy
source
by a first means for transmitting infrared energy. The output element is
operatively
connected to the spectrum analyzer by a second means for transmitting infrared
energy.
10 In practicing a preferred method of the present invention, an analyte
containing tissue area is selected as the point of analysis. This area can
include the
skin surface on the finger, earlobe, forearm, or any other skin surface. A
preferred
sample location is the underside of the forearm. The sensor element, which
includes
the input element and the output element, is then placed in contact with the
skin. In
15 this way, the input element and output element are coupled to the analyte
containing
tissue or skin surface
In analyzing for a biological attribute, such as the concentration of glucose
in
the anaiyte containing tissue, light energy from the energy source is
transmitted via a
first means for transmitting infrared energy into the input element. The light
energy is
20 transmitted from the input element to the skin surface. Some of the light
energy
contacting the analyte-containing sample is differentially absorbed by the
various
components and anaiytes contained therein at various depths within the sample.
A
quantity of light energy is reflected back to the output element. The non-
absorbed
reflected light energy is then transmitted via the second means for
transmitting
-10-
CA 02347494 2001-04-12
WO 00/22413 PCT/US99/23665
infrared energy to the spectrum analyzer. As detailed below, the spectrum
analyzer
preferably utilizes a computer and associated memory to generate a prediction
result
utilizing the measured intensities and a calibration model from which a
multivariate
algorithm is derived.
5 The viability of the present invention to act as an accurate and robust
surrogate
for direct measurement of biological attributes in a sample such as glucose in
tissue,
resides in the ability to generate accurate predictions of the direct
measurement (e.g.,
glucose level) via the indirect measurements (spectra). Applicants have found
that, in
the case of the noninvasive prediction of glucose by spectroscopic means,
application
10 of known multivariate techniques to spectral data, will not produce a
predictive model
that yields sufficiently accurate predictions for future use. In order to
obtain useful
predictions, the spectral contribution from the particular analyte ar
attribute of interest
must be extracted from a complex and varying background of interfering
signals. The
interfering signals vary across and within subjects and can be broadly
partitioned into
15 "infra-subject" and "inter-subject" sources. Some of these interfering
signals arise
from other substances that vary in concentration. The net effect of the
cumulative
interfering signals is such that the application of known multivariate
analysis methods
does not generate prediction results with an accuracy that satisfies clinical
needs.
The present invention involves a prediction process that reduces the impact of
20 subject-specific effects on prediction through a tailoring process, while
concurrently
facilitating the modeling of infra-subject effects. The tailoring process is
used to
adapt the model so that it predicts accurately for a given subject. An
essential
experimental observation is that infra-subject spectral effects are consistent
across
subjects. Thus, infra-subject spectral variation obsen~ed from a set of
subjects can be
-11-
CA 02347494 2001-04-12
WO 00/Z2413 PCTNS99/23665
used to enhance or strengthen the calibration for subsequent use on an
individual not
included in the set. This results in a prediction process that is specific for
use on a
given subject, but where infra-subject information from other subjects is used
to
enhance the performance of the monitoring device.
5 Spectroscopic data that have been acquired and processed in a manner that
reduces inter-subject spectroscopic variation while maintaining infra-subject
variation
are herein referred to as generic calibration data. These generic data, which
comprise
a library of infra-subject variation, are representative of the likely
variation that might
be observed over time for any particular subject. In order to be effective,
the intra-
10 subject spectral variation manifested in the generic calibration data must
be
representative of future infra-subject spectral effects such as those effects
due to
physiological variation, changes in the instrument status, sampling
techniques, and
spectroscopic effects associated with the analyte of interest. Thus, it is
important to
use an appropriate experimental protocol to provide representation of these
intra
1 ~ subject spectral effects.
In each prediction embodiment of the present invention, multivariate
techniques are applied to the generic calibration data to derive a subject-
specific
predictor of the direct measurement. Each prediction embodiment uses the
generic
calibration data in some raw or altered condition in conjunction with at most
a few
20 reference spectra from a specific subject to achieve a tailored prediction
method that
is an accurate predictor of a desired indirect measurement for that particular
subject.
Reference spectra are spectroscopic measurements from a specific subject that
are
used in the development of a tailored prediction model. Reference analyte
values
quantify the concentration of the analyte (via direct methods) and can be used
in the
-12-
CA 02347494 2001-04-12
WO 00/22413 PCTNS99/23665
development of a tailored prediction model. Applicants have developed several
embodiments that incorporate the above concepts.
Each tailored prediction method described herein utilizes generic calibration
data. Generic calibration data can be created by a variety of data acquisition
and
5 processing methods. In a first preferred processing method, the generic
calibration
data are obtained by acquiring a series of indirect measurements from one or
more
subjects and a direct measurement for each subject corresponding to each
indirect
measurement. An appropriate experimental protocol is needed to provide
adequate
representation of infra-subject effects that are expected in the future
(including those
10 associated with the analyte of interest). The mean indirect measurement and
the mean
direct measurement for each subject based on the number of measurements from
that
subject are then formed. The indirect measurements are mean centered by
subtracting
the mean indirect measurement of each subject from each of that subject's
indirect
measurements. The direct measurements are mean centered by subtracting the
mean
15 direct measurement of each subject from each of that subject's direct
measurements.
That is, the subject-specific mean indirect measurements and subject-specific
mean
direct measurements act as subject-specific subtrahends. The sets of mean-
centered
measurements (indirect and direct) comprise the generic calibration data.
There are a number of other related ways for creating generic calibration data
20 with a subject-specific subtrahend. For example, the subject-specific
subtrahends for
the indirect and direct measurements could be some linear combination of each
subject's indirect and direct measurements, respectively.
In one other specific method for creating generic calibration data, the
subject-
specific subtrahends for the indirect and direct measurements consist of the
mean of
-13-
CA 02347494 2001-04-12
WO 00/22413 PCT/US99/23665
the first S indirect measurements of each subject and the mean of the first S
direct
measurements of each subject, respectively. Alternately, a moving window
reference
technique could be utilized wherein the subtrahends are the subject-specific
means of
the S nearest (in time) indirect and direct measurements, where S is less than
the total
S number of reference measurements made on a particular subject. The value of
S can
be chosen to fit the constraints of the particular application, neglecting
effects due to
random noise and reference error.
In another alternative processing method, the generic calibration data can be
produced in a round-robin reference manner wherein you subtract each of the
10 patient's reference data from every other reference measurement made on
that subject
in a round-robin fashion.
In a further alternative processing method which is particularly usefizl when
a
spectral library associated with a large number of subjects exists, the
generic
calibration data are created by subtracting some linear combination of
spectral library
15 data in order to minimize inter-subject spectral features. Subject-specific
attributes
can be reduced by subtracting some linear combination of similar spectra. That
is, the
subject-specific subtrahend for a given subject consists of a linear
combination of
spectra obtained from one or more subjects each of whom are different than the
given
subject. In one embodiment. the spectrum of a given subject would be matched
with
20 a combination of similarly appearing spectra from other subjects. In
another
embodiment, one would match the spectrum of a given subject with a combination
of
spectra from other subjects where the matching criteria involve measurable
parameters such as age, gender, skin thickness, etc.
In a final alternative processing method, the generic calibration data are
-14-
CA 02347494 2001-04-12
WO 00/Z2413 PCT/US99/23665
created through simulation in a manner that minimizes subject-specific
spectral
attributes. This methodology requires accurate simulations of patient spectra,
as well
as accurate modeling of the optical system, the sampler-tissue interface, and
the tissue
optical properties which all contribute to such spectral variation. Generic
calibration
S data can be simulated directly or subject data can be simulated. The
simulated subject
spectra can subsequently be processed by any of the preceding five processing
methods. In an additional embodiment, the simulated data can be combined with
real
patient data for the creation of a hybrid generic calibration data.
Once the generic calibration data have been created, such data is then
utilized
10 to create a tailored prediction process specific for a particular subject
for use in future
predictions of the biological attribute. The tailored prediction process can
be
accomplished in several ways.
The most straightforward and direct way to tailor the prediction process to a
given subject is as follows and will be denoted as direct tailoring. First,
the generic
15 calibration data are used to develop an infra-subject calibration model for
the analyte
of interest. This model herein is referred to as a generic model. By design,
the
generic model will produce predictions that are essentially unaffected by
infra-subject
spectral variation that is represented in the generic calibration data and not
associated
with the analyte of interest. On the other hand, the generic model will
produce
20 predictions that are appropriately sensitive to the analyte of interest.
The generic
model is applied directly to at least one indirect measurement from a target
subject for
whom there are corresponding direct measurements. 'fhe resulting predictions
of the
generic model are averaged. The difference between the average of the direct
measurements and average prediction is computed. This subject-specific
difference is
-15-
CA 02347494 2001-04-12
WO 00/22413 PCTNS99/23665
added to the subsequent predictions of the generic model as applied directly
to the
future indirect measurements from the target subject. The resultant sums
comprise
the net predictions of the direct measurement corresponding to the future
indirect
measurements from the target subject. It is important to note that a single
generic
5 model can be used in the tailoring process for a number of target subjects.
A second tailored prediction embodiment uses a combination of at least two
subject reference spectra, reference analyte values and the generic
calibration data to
create a prediction model that is specific for use on the particular subject.
The
technique by which the calibration data and reference spectra are combined
uses a
IO linear combination of the data in absorbance units. The combinations of
calibration
data and reference data can be done in a structured or random way. It is the
applicant's observation that random associations work effectively and are
easily
implemented. The process of creating these composite data is referred to as
robustification. The resulting calibration spectra contain the reference
spectra from
1 ~ the particular patient combined with spectral data that contains sources
of
spectroscopic variation associated with physiological variations, variations
associated
with sampling techniques, instrument variation and spectroscopic effects
associated
with the analyte of interest. The composite calibration data can be processed
to
develop a calibration model. The resulting model will be referred to hereafter
as a
20 composite calibration model. The resulting composite calibration model is
specific
for a particular patient and can be used to generate analyte prediction
results for the
particular subject.
In the use of either tailored prediction process, reference spectra and
reference
analyte values are utilized. The reference information is used in combination
with the
-16-
CA 02347494 2001-04-12
WO 00/22413 PCT/US99/23665
generic calibration data to create a tailored prediction process for use on
the particular
subject. In general terms the subject reference information is used to tailor
a general
processing method for use on a particular subject. In an additional
embodiment, the
subject reference spectra can be replaced by the use of a subject-matched
spectrum or
a set of matched spectra. Matched spectra are spectra from another subject or
a
combined spectrum that interacts with the calibration model in a manner
similar to the
subject to be predicted upon. In use, a never-before-seen subject is tested
and at least
one spectrum is obtained. The resulting spectrum is used for generating a
prediction
result and as a reference spectrum. In use and in contrast to the two prior
embodiments no reference analyte value is used or needed. The implementation
of
this method requires the following:
1. Identification or creation of a matched spectra through use of the
reference spectra.
2. Replacement of the reference spectra with the corresponding matched
spectra.
3. Although reference analyte values are not obtained from the never-
before-seen patient, matched analyte values from the corresponding
matched spectra are used in the processing method in a manner
consistent with the prior uses of reference analyte values.
4. Use of either tailored prediction process.
In practice, the spectral data from the never-before-seen subject is compared
with spectral data that has corresponding biological attribute reference
values in a
spectral library to identify the best method or several matched spectra.
Matched
spectra are spectra from another subject that appear similar when processed by
the
-17-
CA 02347494 2001-04-12
WO 00/22413 PCT/US99/23665
calibration model.
Applicants have observed that identical twins are well matched from a
spectroscopic
model perspective.
As stated previously, the application of known multivariate analysis
5 techniques have not resulted in glucose prediction results at a clinically
relevant level.
The processing method described overcomes these known limitations by using a
matched spectrum. Thus, the subject tailoring with this method is accomplished
without an actual reference analyte value from the individual. The matched
spectrum
method in conjunction with either tailored prediction process requires a large
spectral
10 library to facilitate the appropriate matching between the subject to be
predicted upon
and at least one library spectrum. In implementation of this matching method,
applicants have identified matched spectra by finding those spectra that are
most
consistent with the calibration model as reflected by such parameters as
Mahalanobis
distance and spectral residual metrics. Other methods of spectral match would
also
15 have applicability for determination of matched spectra.
These and various other advantages and features of novelty that characterize
the present invention are pointed out with particularih~ in the claims annexed
hereto
and forming a part hereof. However, for a better understanding of the
invention, its
advantages, and the object obtained by its use, reference should be made to
the
20 drawings which form a further part hereof, and to the accompanying
descriptive
matter in which there are illustrated and described preferred embodiments of
the
present invention.
Brief Description of the Draw-in~s
In the drawings, in which like reference numerals indicate corresponding parts
-18-
CA 02347494 2001-04-12
WO 00/22413 PCT/US99/23665
or elements of preferred embodiments of the present invention throughout the
several
mews:
Fig. 1 depicts exemplary spectral variation observed in subjects;
Fig. 2 is a flow chart representing the processing steps associated with
5 generating generic calibration data through meancentering;
Fig. 3 is a flow chart representing the steps of the direct tailoring
prediction
process of the present invention;
Fig. 4 is a flow chart representing the steps of the composite tailored
prediction process of the current invention;
10 Fig. 5 is a flow chart representing the processing steps associated with
generating generic calibration data through the fixed reference method;
Fig. 6 is a flow chart representing the processing steps associated with
generating generic calibration data through the round robin method;
Fig. 7 is a flow chart representing the steps of the composite tailored
15 prediction process of the current invention;
Fig. 8 is a flow chart representing the steps of the matched spectrum method
in
conjunction with the direct-tailored prediction process of the current
invention;
Fig. 9 is a flow chart representing the steps of the matched spectrum method
in
conjunction with the composite tailored production process of the current
invention;
20 Fig. 10 displays the spectrum of generic model coefficients;
Fig. 11 graphically depicts the ability of the present invention to predict
glucose using mean centering with direct tailoring for Subject 1;
Fig. 12 graphically depicts the ability of the present invention to predict
glucose using mean centering with direct tailoring for Subject 2;
-19-
CA 02347494 2001-04-12
WO 00/22413 PCT/US99/23b65
Fig. 13 graphically depicts the ability of the present invention to predict
glucose with the direct tailored prediction process; and
Fig. 14 graphically depicts the ability of the present invention to predict
glucose with the composite tailored prediction process.
5 Detailed Description of Preferred Embodiments
Detailed descriptions of the preferred embodiments of the present invention
are disclosed herein. However, it is to be understood that the disclosed
embodiments
are merely exemplary of the present invention that may be embodied in various
systems. Therefore, specific details disclosed herein are not to be
interpreted as
10 limiting, but rather as a basis for the claims and as a representative
basis for teaching
one of skill in the art to variously practice the invention.
The present invention is directed to a method for non-invasive measurement of
biological attributes, such as tissue analytes or properties using
spectroscopy. It has
been found that the sample is a complex matrix of materials with differing
refractive
15 indices and absorption properties. Further, because the tissue or blood
constituents of
interest are present at very low concentrations, it has been found necessary
to
incorporate a mathematical model derived using multivariate analysis. However,
known methods of applying multivariate analysis to spectral data from a broad
range
of subjects have failed to produce a sufficiently accurate and robust model.
To this
20 point, these failures are largely a consequence of inadequate experimental
protocols
and inadequate data analytic methods. The present invention solves these
deficiencies
via improvements in experimental protocols and data analytic procedures.
Experimental protocols have been improved in the sense that the acquisition of
a wide
variety of infra-subject spectral variation is emphasized. Coinciding with the
-20-
CA 02347494 2001-04-12
WO 00/22413 PCT/US99/23665
improved protocols are data analytic methods that modify the calibration data
to
reduce subject-specific spectral attributes that are unrelated to measuring
the
biological attributes of interest. The resulting modified calibration data set
thus
facilitates the development of models that perform well in the presence of
actual
5 within-patient physiological variation. The prediction methodologies using
this core
concept are detailed below, subsequent to a description of the method and
apparatus
used for non-invasive measurement in conjunction the model.
The present invention utilizes light energy in the near-infrared region of the
optical spectrum as an energy source for analysis. Water is by far the largest
10 contributor to absorption in tissue in the near-infrared region because of
its
concentration, as well as its strong absorption coefficient. It has been found
that the
total absorption spectrum of tissue, therefore, closely resembles the water
spectrum.
Less than 0.1 percent of the absorption of light is from, for instance, a
constituent
such as glucose. It has been further found that tissue greatly scatters Light
because
15 there are many refractive index discontinuities in a typical tissue sample.
Water is
perfused through the tissue, with a refractive index of 1.33. Cell walls and
other
features of tissue have refractive indices closer to 1.5 to 1.6. These
refractive index
discontinuities give rise to scatter. Although these refractive index
discontinuities are
frequent, they are also typically small in magnitude and the scatter generally
has a
20 strong directionality toward the forward direction.
This forward scatter has been described in terms of anisotropy, which is
defined as the cosine of the average scatter angle. Thus, for complete
backward
scatter, meaning that all scatter events would cause a photon to divert its
direction of
travel by 180 degrees, the anisotropy factor is -1. Likewise, for complete
forward
-21 -
CA 02347494 2001-04-12
WO 00/22413 PCT/US99/23665
scatter, the anisotropy factor is ~1. In the near infrared, tissue has been
found to have
an anisotropy factor of around 0.9 to 0.95, which is very forward scattering.
For
instance, an anisotropy factor of .9 means that an average photon of light
only scatters
through an angle of up to 25 degrees as it passes through the sample.
In analyzing for an analy~te in tissue, measurements can be made in at least
two
different modes. It is recognized that one can measure light transmitted
through a
section of tissue, or one may measure light reflected or remitted from tissue.
It has
been recognized that transmission is the preferred method of analysis in
spectroscopy
because of the forward scattering of light as it passes through the tissue.
However, it
is difficult to find a part of the body which is optically thin enough to pass
near
infrared light through, especially at the longer wavelengths. Thus, the
preferred
method for measurement in the present invention is to focus on the reflectance
of light
from the sample. Preferred apparatus and methods for conducting such
measurements
are disclosed by Robinson in LT.S. Patent No. 5,830,132, the disclosure of
which is
incorporated herein by reference.
In preferred embodiments of an apparatus for non-invasively measuring a
biological attribute such as a blood analyte concentration, several elements
are
combined in conjunction with a mathematical model. The apparatus generally
includes three elements, an energy source, a sensor element, and a spectrum
analyzer.
The sensor element preferably includes an input element and an output element,
which can include a single lens system for both input and output light energy,
as for
example a fiber optic bundle. The input element and output element are in
contact
with a common skin surface of an analyte-containing tissue. In an alternative
embodiment, an alternative sensor element arrangement is used, wherein the
input
-22-
CA 02347494 2001-04-12
WO 00/22413 PCT/US99/23665
element and output element are arranged on opposing surfaces of an analyte
containing tissue. Both embodiments function to give a measure of the
absorption of
infrared energy by the analyte-containing tissue. However, the first
embodiment is
utilized to measure the quantity of light energy that is reflected from the
analyte-
5 containing tissue by the analyte components therein. In contrast, the second
embodiment measures the transmission of light energy through the analyte-
containing
tissue. In either embodiment, the absorption at various wavelengths can be
determined by comparison to the intensity of the light energy from the energy
source.
The energy source is preferably a wide band, infrared black body source. The
10 optical wavelengths emitted from the energy source are preferably between
1.0 and
2.5 p.m. The energy source is operatively coupled to a first means for
transmitting
infrared energy from the energy source to the input element. In preferred
embodiments, this first means can simply include the transmission of light
energy to
the input element through air by placing the energy source proximate the input
15 element or use of a fiber optic cable.
The input element of the sensor element is preferably an optical lens or fiber
that focuses the light energy to a high energy density spot. However, it is
understood
that other beam focusing means may be utilized in conjunction with the optical
lens to
alter the area of illumination. For example, a multiple lens system, tapered
fibers, or
20 other conventional optical beam-shaping devices could be utilized to alter
the input
light energy.
In both embodiments, an output sensor is utilized to receive reflected or
transmitted light energy from the analyte containing tissue. As described in
conjunction with a method of analysis below, the first embodiment has an
output
- 23 -
CA 02347494 2001-04-12
WO 00/22413 PCT/US99/23665
sensor that receives reflected light energy, while the second embodiment of
includes
an output sensor which receives transmitted light through the analyte-
containing
tissue. As with the input element, the output element is preferably an optical
lens or
fiber optic. Other optical collection means may be incorporated into an output
5 element, such as a multiple lens system, tapered fiber, or other beam-
collection means
to assist in directing the light energy to the spectrum analyzer.
A second means for transmitting infrared energy is operatively connected to
the output element. The light transmitted through the second means for
transmitting
infrared energy is transmitted to the spectrum analyzer. In a preferred
embodiment,
10 the operative connection to the output element includes transmission of the
reflected
or transmitted light energy exiting the output element through a fiber optic
or air to
the spectrum analyzer. A mirror or series of mirrors may be utilized to direct
this
light energy to the spectrum analyzer. In a preferred embodiment, a specular
control
device is incorporated to separate the specular reflected light from diffusely
reflected
15 light. This device is disclosed in co-pending and commonly assigned
application
Serial No. 08/513,094, filed August 9, 1995, and entitled "Improved Diffuse
Reflectance Monitoring Apparatus," now U.S. Patent no. 5,636,633, issued June
10,
1997, the disclosure of which is incorporated herein by reference.
In practicing a preferred method of the present invention, an analyte
20 containing tissue area is selected as the point of analysis. A preferred
sample location
is the underside of the forearm. The sensor element, which includes the input
element
and the output element, is then placed in contact with the sample area.
In analyzing for a biological attribute, such as for the concentration of
glucose
in the analyte-containing tissue, light energy from the energy source is
transmitted
- 24 -
CA 02347494 2001-04-12
WO 00/22413 PCT/US99/23665
through the first means for transmitting infrared energy into the input
element. The
light energy is transmitted from the input element to the skin surface. The
light
energy contacting the skin surface is differentially absorbed by the various
components and analytes contained below the skin surface within the body
(i.e., blood
5 within vessels) therein. In a preferred embodiment, the non-absorbed light
energy is
reflected back to the output element. The non-absorbed light energy is
transmitted via
the second means for transmitting infrared energy to the spectrum analyzer.
In a preferred embodiment, a biological attribute, such as the concentration
of
glucose in the tissue, is determined by first measuring the light intensity
received by
10 the output sensor. These measured intensities in combination with a
calibration
model are utilized by a multivariate algorithm to predict the glucose
concentration in
the tissue. In preferred embodiments, the calibration model empirically
relates the
known biological attribute in the calibration samples to the measured
intensity
variations obtained from the calibration samples. The spectrum analyzer of the
1 S present invention preferably includes a frequency dispersion device and
photodiode
array detectors in conjunction with a computer to apply the data received from
such
devices to the model stored therein to predict the biological attribute of
interest of the
subject.
As previously stated, the computer includes a memory having stored therein a
20 multivariate calibration model empirically relating known biological
attributes, such
as glucose concentration, in a set of calibration samples to the measured
intensity
variations from the calibration samples, at several wavelengths. The present
invention includes prediction methodologies with sufficient accuracy to act as
a
surrogate predictor of biological attributes so that direct measurements can
be
- 25 -
CA 02347494 2001-04-12
WO 00/22413 PCT/US99/23665
dramatically reduced or eliminated.
Generally, the method of the present invention incorporates generic
calibration
data in combination with subject-specific data to create a tailored prediction
process.
The resulting subject-tailored prediction process combines selected portions
of
5 multiple subject spectral variances and subject reference spectra. The
tailored
prediction process is made subject specific by incorporating a minor amount of
-
subject-specific spectral data and does not require extensive calibration
testing of the
individual subject on which the model is to be applied. The various
embodiments
described below require data collection and processing to be applied in both a
10 calibration and a prediction phase.
In the calibration phase, the methods generally require the realization of
calibration data that has been modified in such a way as to reduce or
eliminate
subject-specific spectral attributes that are unrelated to the biological
amibute of
interest in the test. The resulting modified calibration data has reduced
inter-subject
15 spectroscopic variation while maintaining other relevant sources of
spectroscopic
variation. Other known sources of spectroscopic variation include within
subject
physiological variation, variation associated with sampling errors, instrument
variation, and spectroscopic effects associated with the analyte or attribute
of interest.
Such calibration data is referred to herein as generic calibration data.
20 In the prediction phase, two general embodiments are incorporated. The
first
method focuses on developing a model from the generic calibration data
followed by
introducing subject-specific data from a particular individual, whose
attributes are to
be predicted, and utilizing this information to create a subject specific
prediction
through use of the generic model. The second general approach includes
-26-
CA 02347494 2001-04-12
WO 00/22413 PCTNS99/23665
incorporating subject-specific data from an individual subject to be tested
along with
the generic calibration data. The resulting composite data is used in the
multivariate
analysis to generate a prediction function. The resulting prediction function
resulting
from the combination of generic calibration data and subject-specific data is
a
composite calibration model that is subject specific.
In all embodiments, a model is developed using spectroscopic variation from
multiple subjects wherein the tailored prediction method uses one or more
reference
spectroscopic measurements from a specific patient so that the prediction
process
becomes subject tailored for that specific subject. Applicants have found that
the
model is an accurate predictor because it incorporates the physiological
variation from
other subjects to enhance or strengthen a calibration for subsequent use on a
given
individual. The prediction procedure results in a method that is specific for
use on a
given subject, but where information not from the subject is used to enhance
prediction accuracy, in combination with spectral information from that
particular
individual.
In practicing the present invention, the first step of one preferred method is
to
generate generic calibration data that is essentially free from subject-
specific effects.
This step may be accomplished by utilizing a device such as disclosed in the
aforementioned Robinson Patent No. 4,975,581 to indirectly measure from one to
many subjects, each at a variety of physiological (such as taking glucose
measurement
over a period of time) and spatial (such as taking glucose measurements from a
variety of locations on the body) states.
A preferred method to generate generic calibration data is referred to as
meancentering and is depicted in the flow chart of 'Figure 2. Here, let Y;~k
be the
-27-
CA 02347494 2001-04-12
WO 00/22413 PCTNS99/23665
spectral measurement (e.g., log(intensity)) of the k'h wavelength within the
j'h
spectrum from the i'h subject. Subject-specific effects are removed as
follows. First,
form the mean spectrum for each subject. 'The mean spectrum at the k'h
wavelength
for the i'h subject is:
J
1
j. ~ Y~ik
' J= 1
where J; is the number of spectra from the i'h subject. The appropriate mean
spectrum
is then removed from each observed spectrum: y;~k = Y;~k - M;k. This process
may be
referred to as meancentering the spectra by subject.
Associated with each spectrum, we also have a direct measurement of
10 reference blood-glucose concentration, G;~. The glucose concentrations are
also
meancentered by subject, resulting in g;~ = G;~ - N;, where N; is the mean
glucose
concentration for the i'h subject and defined as:
J
- j ~ G~i
' J=1
The meancentered glucose values may be scaled by a subject-specific factor
15 (k) that is equal to the relative magnitude of the spectral effect of 1
mg/dL of in vivo
blood-glucose for that subject. This scaling serves to normalize glucose
signals
across subjects that could be different across subject (e.g., due to
pathlength
differences) to a standard in vivo glucose signal. The particular example of
meancentered processing is cited to illustrate a specific processing
embodiment of the
20 invention. It is recognized that the use of this invention may involve
generation of
generic calibration date through multiple processing means. Subject-specific
spectroscopic variances can be reduced by subtracting (in absorbance units, or
-28-
CA 02347494 2001-04-12
WO 00/22413 PCTNS99/23665
performing a similar operation in any other data space) some linear
combination of
each subject's reference spectra and reference analyte values. At this point,
the
meancentered spectra and meancentered (and possibly scaled) glucose
concentrations
are used in the multivariate calibration model development.
5 Once the generic calibration data has been created, such data are then
utilized
in forming a tailored prediction process for a particular subject for use in
future
predictions of the biological attribute. This can be accomplished in several
ways such
as use of a direct-tailoring technique or alternatively a composite technique.
Common
to both methods is a calibration model. A representation of a linear
multivariate
10 calibration model (a specific type of calibration model;) is G = bo + b,
~y~ + b2 ~y2 +
. . . +bq ~ yq, where the bk's are model parameters. Development of G from the
meancentered indirect data y;~k or other generic calibration data and the
direct data g;~
is a routine matter for one skilled in chemometrics, as taught by H. Martens
et al.,
Multivariate Calibration, ( 19$9), John Wiley, Chichester.
15 Note that the use of generic calibration data for developing the generic
model
in this embodiment is believed important for preserving sufficient sensitivity
to detect
outlier (or anomalous) spectra during prediction. Without the meancentering
operation of the invention on the spectra, Mahalanobis-distance and other
outlier
detection metrics are likely to be based heavily on ancillary inter-subject
effects and,
20 therefore, not be sufficiently responsive to unusual infra-subject effects.
Once the generic model is in hand, it must be tailored (or adapted) for a
specific subject. Two direct tailoring versions of this procedure are
described for the
present embodiment. In the first version it is assumed that the scale factor,
k,
pertaining to the relative magnitude of the spectral effect of 1 mg/dL of in
vivo blood-
-29-
CA 02347494 2001-04-12
WO 00/22413 PCTNS99/23665
glucose is known with adequate precision. In the second version it is assumed
that
this scale factor is unknown and must be estimated.
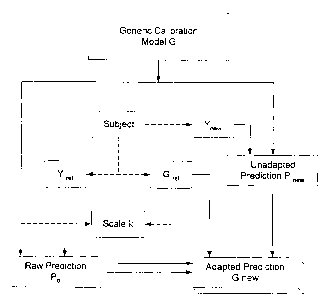
Version 1 (k known)
1. Make one (or several) spectral measurement of the target subject's tissue
{perhaps varying the spatial position when multiple measurements are obtained
at
about the same time). Denote the resultant spectrum (or average spectrum when -
-
multiple spectra are obtained) by Y~ef, where Yree= {Yri, Yr2~ . . ., yrq}.
The idea is to
obtain very precise spectral measurements for the adaptation process.
2. As close as possible in time with respect to the collection of the spectrum
(spectra), an accurate reference measurement of in vivo glucose, Grey, is
obtained from
the subject (e.g., blood draw).
3. Use the generic model in conjunction with Yref to obtain a raw prediction
of
glucose, Po, that will be used as the basis to adapt the generic model to the
subject.
Once steps 1-3 have been completed, non-invasive measurements of glucose can
be
determined in the future as follows.
4. Obtain a new spectral measurement of the subject's tissue,
'new= ~Ynl~Yn2~ . . .,Yn4J~
5. Apply the generic model to Ynew to obtain an unadapted prediction, PneW.
' The prediction of glucose (adapted to that subject) is
Pnew - Po
Gnew = k + C'ref
Version 2 (k unknown)
In this format, steps 1-3 (from version 1) are performed at least twice (once
when the target subject is experiencing a relatively low in vivo glucose
level, the
-30-
CA 02347494 2001-04-12
WO 00/22413 PCT/US99/23665
other when the target subject is experiencing a relatively high in vivo
glucose level).
At the relatively low glucose level, we obtain:
Ynew = ~ yn~~ yn2~ yn3
At the relatively high glucose level, we obtain:
hi hi hi hi
Ynew = { yn~ ~ Yn2~ yn3~ . .
5
As in version 1, apply the generic model to Y"eW to obtain an uncorrected
prediction, P"e~~. The prediction of glucose (adapted to that subject) is:
Pla Phi - Pio
Gnew = p"ew~ o + G sf, where k = h° o
k Grei - Gref
Note that it is straightforward (and perhaps desirable) to modify this
technique to
10 include more than one or two reference samples per target subject.
In summary, the proposed prediction method of this first embodiment provides
a solution to the difficulties associated with building a universal
calibration model that
needs to be appropriately responsive to subject-to-subject spectral variation
as well as
spectral variation within subjects over time and space. The proposed method is
15 illustrated in the flow chart of Figure 3 and provides a simple subject-
specific
adaptation to a generic model that is appropriately sensitive to the spectral
variation
within a subject. Development of this type of subject-specific model is a
substantial
improvement (with respect to efficiency) when compared to the development of
subject-specific models via intensive optical sampling of each individual
subject.
20 The second prediction technique of the present invention is the composite
technique that is depicted in the flow chart of Figure 4, With the composite
technique, two or more reference measurements, which include both the spectra
and
-31 -
CA 02347494 2001-04-12
WO 00/22413 PCT/US99/23665
the analyte reference values, are made on the particular subject and these
data are
added in a random fashion to the generic calibration data. This process is
represented
by the equations:
- _ ref ~ ref
y ijk - yijk + y ilk ~ g ij r gij + g il
where y ~kf is the k~" element of the h"
reference spectrum for subject i, g ref
is the h" glucose reference value for
subject i, and a random value of 1 is
chosen for each f, j pair
S The resulting composite data is then used in conjunction with a multivariate
analysis
technique to generate a calibration model which is subject tailored due to the
addition
of reference spectral measurements and reference analyte measurements prior to
generating the model. The resulting subject-tailored model is then applied to
other
spectra from the same subject on whom the reference measurements were made.
Predictions are made with the resulting calibration model by following
standard
chemometric practices known to one skilled in the art.
Generic calibration data can also be created by a fixed reference technique.
The fixed reference technique is depicted in the flow chart of Figure 5. This
technique can be utilized to modify the calibration data by subtracting the
mean of the
first S calibration spectra and reference values from a particular subject
from each of
the subject's reference measurements, where S is less than the total number of
reference measurements made on a particular subject. This is represented by
the
equations:
S S
Mik ' S ~ Yijk ~ Ni - S Gij , where S < Ji
j-_1 l-1
-32-
CA 02347494 2001-04-12
WO 00/22413 PCT/US99/236b5
In the alternative, a moving window reference technique may be utilized
wherein you
subtract the mean of the S nearest (in time) calibration spectra and reference
values
from each of the subject's calibration measurements, where S is less than the
total
number of reference measurements made on a particular subject. This method is
represented by the equations:
J+ ~s_, ~ J+ ~s_,
z z
Yijk , Nij - S ~ Gij , where S is odd
p J_(s-~) ~=j__(s-~)
2 z
The value of S can be chosen to fit the constraints of the particular
application,
neglecting effects due to random noise and reference error.
Alternatively, the generic calibration data may be generated in a round-robin
reference manner wherein you subtract each of the patient's reference data
from every
other reference measurement made on that subject in a round-robin fashion. The
round-robin method is depicted in the flow chart of Figure 6. This method is
represented by the equations:
yilk - Y7 k ~ Yijik
' For all j. j' where j~ > jr
gir - 9~~r - g~~r
A Final method used for generating generic calibration data is particularly
useful where a large spectral library, including spectra and reference values
from
multiple people exists. The library data are modified to reduce or eliminate
subject-
specific spectral attributes by subtracting some linear combination of
spectral library
data in order to minimize cross-subject spectl-al features. The methods of
this
embodiment are depicted in the flow chart of Figure 7. Thus in modifying the
- 33 -
CA 02347494 2001-04-12
WO 00/22413 PCT/US99/23665
spectral library data, to create generic calibration data, a given subject's
spectra are
modified through the use of a similar patient spectra. Similar patient spectra
are those
spectra that when subtracted from a specific subject results in a spectral
difference
that is less than the average difference across all subjects. The similar
spectrum can
5 be from another subject or can be formed by combining several subjects to
create a
similar spectrum.
In an additional embodiment, patient spectra are created through simulation in
a manner that minimizes subject-specific spectral attributes. This methodology
requires accurate simulations of patient spectra, which would include high
accurate
10 modeling of the optical system, the sampler-tissue interface, and the
tissue optical
properties which all contribute to such spectral variation. Such simulated
data can be
generated and removed from measured calibrated data to reduce patient-specific
characteristics. The modified calibration model data can then be utilized in
conjunction with data from a specific patient to tailor the model for use in
predicting
15 biological attributes of that patient with the above methods.
Once the generic calibration data has been created, such data is then utilized
in
forming a tailored prediction process for a particular subject for use in
future
predictions of the biological attribute. This can be accomplished in several
ways,
such as use of the direct-tailored technique, or alternatively, the composite
technique
20 previously described
With either the direct-tailored prediction method or the composite tailored
prediction method as previously described, the reference spectra can be
replaced by a
matched spectra. The flow charts of Figures 8 and 9 depict matched spectra
methods
with bidirects tailored prediction and composite tailored prediction,
respectively.
-34-
CA 02347494 2001-04-12
WO 00/22413 PCT/US99/23665
With this method, a never-before-seen subject is then tested and at least one
target
spectrum or set of spectral data is acquired. However, no analyte or direct
measurement is required from the patient. Rather, the spectral data from the
never-
before-seen patient is compared with spectral data which has corresponding
biological
S attribute reference values in a spectral library to identify the best
reference spectrum
or spectra that corresponds to the target spectrum of the never-before-seen
patient.
This reference spectrum can be compared with the target spectrum to determine
the
level of match. Thus, the subject tailoring with this method is accomplished
without
an actual reference analyte value. This method relies on a large spectral
library to
facilitate the appropriate matching between a target spectrum and a single
spectral
library entry or several library entries.
In the direct-tailored prediction method the matched spectrum and
corresponding reference analyte values are used instead of actual reference
spectra
and analyte values from the subject to be predicted upon. The following
equations
define the substitution and prediction steps:
Gnew = Pnew - f'orM + GseM where
f'new's the raw prediction of the new spectrum Yew using the
generic model,
P orM is the raw prediction of the similar spectrum YSrM
identified in the spectral library,
GSBM is the referenced valve associated with the similar
spectrum identified in the spectral library
One requirement of this methodology is the ability to find an appropriate
match within the spectral library. If no single subject is an appropriate
match, a
matched spectrum can be created by combining spectra from other patients. In
- 35 -
CA 02347494 2001-04-12
WO 00/22413 PCTNS99/23665
practice the matched spectrum, a combination of spectra and inference values
from
subject in the spectral library, is created through a weighted linear
combination of
absorbance spectra. The various coefficients applied to the individual library
spectra
can be adjusted such that the best possible match is obtained. The matched
spectrum
5 created through other subject combinations is created by the following
equations:
SIM _ ~ SIM SIM __ S IM
Y K - J-1 Ci y JK G ref ~ Cl ~l
S Ci S CI
J=1 J=1
where y ~K is the K'" element of the ,I'" spectrum selected
from the spectral library, Gi is the corresponding reference
value, and the coefficients, c, are chosen to optimize the
spectral similarity with YneH
The resulting matched spectrum and reference value is used in a manner
consistent with a matched spectrum obtained from a single patient.
In using the composite tailored prediction process generic calibration data is
10 combined with one or more reference spectra and reference values to create
a data set
that is subsequently used for generation of a calibration model. The reference
spectra
used for the composite tailored process can be replaced by matched spectra. In
practice a fixed number of best-matched spectra from the subject library can
be used
as reference spectra. In an alternative method any spectra which meet a
15 predetermined level of matching could be used as reference spectra. In
practice, the
level of match has been determined by first calculating the difference between
the
target spectrum and the possible matched spectrum. The resulting difference
spectrum is then used in conjunction with the calibration model to determine
such
parameters as the Mahalanobis distance and spectral residual metrics.
-36-
CA 02347494 2001-04-12
WO 00/22413 PCTNS99/23665
Once appropriate matched spectra are determined these spectra are used in a
manner consistent with the composite tailored prediction method using
reference
spectra from the actual subject to be predicted upon.
In addition to the above benefits, application of the methods disclosed
herein,
5 such as monitoring blood/glucose levels non-invasively in the home where a
single
instrument unit (e.g., spectrometer) is paired with a single subject, provides
some
substantial benefits with respect to calibration transfer and maintenance.
Calibration
transfer refers to the process of migrating a master calibration model to a
specific unit.
Due to manufacturing variation across units, each unit will differ in subtle
ways such
10 that the same object will appear slightly different across units (e.g.,
resulting in
slightly different spectra in the case of spectroscopy). Calibration
maintenance refers
to the process of maintaining a functional model across different instrument
states
(e.g., induced by changing a discrete component). The generic subject model
(which
is based on data that has within subject variation removed) is in fact a
generic
1 S instrument/subject model. That is, the specific effect of the instrument
has also been
removed through the process used to modify the data set. Preferably, a generic
instrument/subject model is developed by combining data across units and
subjects
within a unit. In either case (using a single unit or multiple units for
developing a
generic model), one can see that the series of measurements that are taken to
adapt to
20 the subject simultaneously and implicitly provide adaptation to the
specific instrument
and current instrument state. Thus, this single generic model is adaptable to
an
arbitrary subject being measured on an arbitrary unit from an entire
production run of
instruments. Furthermore, this method will facilitate the detection of
anomalous
conditions with respect to the subject and instrument during prediction.
-37-
CA 02347494 2001-04-12
WO 00/22413 PCT/US99/23665
EXAMPLES OF METHOD
A number of clinical studies have recently been performed to assess the
performance of some of the subject tailored prediction methods disclosed in
this
application. In one such study, generic calibration data were obtained from 18
S diabetic subjects who were repeatedly measured over a span of 7 weeks. The
intent of
observing the subjects for such a long period of time was to develop
calibration data
that spanned significant levels of natural intra-subject physiological
variation
(including but not limited to glucose variation) and sampling variation. In
addition,
the study protocol involved the deliberate perturbation of the spectrometer
and its
10 local environment to induce instrumental/environmental effects into the
generic
calibration data. These perturbations were carefully selected to span the
expected
long-term operating conditions of the instrument. Activities, such as these,
are
extremely important for developing generic calibration data that will
facilitate valid
predictions into the future.
15 Spectral and reference data were acquired twice per week from most
subjects.
A few subjects were unable to keep all of their appointments to provide
spectral and
reference data. During each appointment, 5 separate spectral measurements at
different spatial positions on the underside of the forearm were acquired over
a 15-
minute period using reflectance sampling from 4200-7200 wavenumbers (390
discrete
20 wavelengths were involved). In addition, two capillary glucose reference
measurements were obtained via blood draws from each subject during each data
acquisition period. The blood draws were performed immediately before and
after the
acquisition of the spectral data. Time-based interpolation was used to assign
an
appropriate capillary glucose reference value to each spectrum. A total of
1161
- 38 -
CA 02347494 2001-04-12
WO 00/22413 PCTNS99/23665
spectra (some acquired spectra were deemed outliers and were discarded) and
associated reference glucose values comprise the calibration data.
The spectral and capillary glucose reference data were mean-centered by
subject to form the generic calibration data. A generic calibration model was
fit to the
5 calibration data using principal components regression without an intercept.
Due to
the nature of the generic calibration data (the mean-centered spectra and
reference
values have mean zero), the intercept is not needed. In terms of the spectral
data this
model is of the form, G = b, ~y, + bz ~y2 + . . . +bq ~y9. The model
coefficients, (b~,
b~, ..., b~), are shown in Figure 10. This model is clearly sensitive to
glucose since
glucose has absorption bands at 4300 and 4400.
In order to test the efficacy of the subject tailored prediction methods, the
generic model was tailored (via direct tailoring) to two additional diabetic
subjects
who are distinct from the 18 subjects whose data were used to develop the
generic
calibration data/model. The period of observation for these two additional
subjects
1 S spanned more than six months, beginning with the initial measurements of
the
original 18 subjects. Thus, the two additional subjects were observed for more
than
four months following the acquisition of the generic calibration data. As in
the case
of acquiring the calibration data, 5 separate spectral measurements at
different spatial
positions on the underside of the forearm were acquired over a 15-minute
period
20 during each data acquisition period. In addition, capillary glucose
reference
measurements were acquired from each of the two subjects during each data
acquisition period according to the protocol described earlier.
During the first 7 weeks of observation and coinciding with the measurements
of the original 18 subjects, the two additional subjects were observed twice
per week
-39-
CA 02347494 2001-04-12
WO 00/22413 PCT/US99/23665
(with one exception). The additional measurements were made were roughly 2 and
4
months beyond the initial 7-week period. The spectra and reference values
obtained
during the first data acquisition period were used to tailor the generic model
to each
subject. These tailored models were used to predict the glucose levels
associated with
5 subsequently obtained spectra. Figures 11 and 12 compare these predictions
(averaged within a data acquisition period) with the reference measurements
(also
averaged within a data acquisition period) for each subject. The bottom half
of each
figure allows for a direct comparison of predicted glucose with the reference
glucose.
The top half of each figure provides a visualization of prediction performance
versus
10 time. The following conventions are used in both figures. The solid lines
connect the
reference glucose values over the entire measurement period. The 'x' symbols
denote
the predictions during the tailoring period (by definition the average
prediction is
identical to the average reference in this case). The '*' symbols denote
predictions
during the remainder of the initial 7-week period. Note that these predictions
are truly
15 prospective with respect to the unique spectral changes induced by each
subject
following the tailoring period. The 'o' symbols denote predictions made after
the
initial 7-week period. These predictions are truly prospective with respect to
the
unique spectral changes induced by each subject and the instrument/environment
following the tailoring period. From these figures it is clear than clinically
useful
20 predictions of blood-glucose can be made using the proposed method.
It is interesting to note that there is no apparent degradation in prediction
performance with respect to the first subject over the 6-month period of
observation
following tailoring (see Figure 11). In contrast with respect to the second
subject (see
Figure 12), prediction performance worsened over time. In this case, the
tailored
- 40 -
CA 02347494 2001-04-12
WO 00/22413 PCT/US99/Z3665
model consistently underpredicted glucose (by about 40 mg/dL) over the last
several
data acquisition periods (perhaps due to some unmodeled physiological effect).
One
way to remedy these systematic prediction errors would be to re-tailor (or re-
adapt)
the generic model to a subject on a regular basis. If needed, re-tailoring on
a weekly
5 basis would seem to be only a minor inconvenience for users of this
technology.
Additional tests have also been performed that enabled the subject tailored
prediction methods to be tested. The test data used spectral measurements
obtained
from 20 subjects over a total span of 16 weeks. The protocol for the study
required
that each subject have spectral measurements taken on 2 or 3 separate days per
week
10 for 8 weeks, spanning the 16-week study duration. Each time a subject came
in for a
study "sitting," 4 separate spectxal measurements at different spatial
positions on the
underside of the forearm were acquired over a I S-minute period, as well as
two
capillary glucose reference measurements, which bounded the spectral
collection. A
total of 1248 spectra (reflectance sampling from 4200-7200 wavenumbers [390
15 discrete wavelengths]) and associated reference glucose values were used to
develop
the calibration data. The resulting data set was processed through the mean
centering
method and generic calibration data were obtained. To adequately test the true
prediction capabilities of the methods, the subject to be evaluated was
excluded from
the data used to develop the generic calibration data. The exclusion of one
patient
20 from the calibration data with subsequent evaluation of their performance
is
commonly referred to as patient-out cross-validation. The cross-validated
generic
calibration data was adapted for each of the 16 diabetic subjects (4 subjects
were not
present for the entire study) and resulted in predictions the final two days
of that
subject's data. Adaptation to each subject was performed using data from 5
separate
-41 -
CA 02347494 2001-04-12
WO 00/22413 PCT/US99/23665
sittings of the subject, 4 sittings were from the first two weeks of data
collection and
the fifth sitting was from a day that was two days prior to the first
validation day. The
second validation day occurred two days after the first. Figures 13 and 14
provide the
prospective (in time) prediction results associated with the subjects. The
figures show
5 the predicted glucose values for the two validation days relative to the
corresponding
glucose reference values obtained by capillary draw for all 16 subjects
measured.
Figure 13 shows the results using the direct-tailored method discussed in the
body of
this disclosure. Figure 14 shows the results using the composite-tailored
method, also
discussed earlier in this disclosure. From these figures it is clear than
clinically useful
10 predictions of blood-glucose can be made using the proposed method.
The particular examples discussed above are cited merely to illustrate
particular embodiments of this invention. It is contemplated that the use of
the
invention may involve methods for multivariate calibration and prediction and
their
application to the non-invasive or non-destructive spectroscopic measurement
of
15 selected variables in an environment. Although blood glucose (the variable)
and
people (the environment) are the focus of this disclosure, calibration of
other variables
such as blood alcohol levels, and other subjects, such as scans of a physical
scene
from which information about the scene is determined, is contemplated. For
example,
an airborne scan of a site (geophysical environment) might provide information
20 whereby multivariate analysis of spectra could determine the amount of
pollutants
(the variables) at the site (the environment), if the scanning device had been
calibrated
for pollutants. In this case, prediction of pollutant levels would be the
tailored to a
particular site. In another example, one might be interested in predicting the
level of a
certain chemical species (the variable) in a chemical reactor (the
environment) using
-42-
CA 02347494 2001-04-12
WO 00/22413 PCTNS99/23665
spectral methods. If the infra-reactor spectral variability were consistent
across
different reactors, then generic calibration data could be obtained by using
reactor-
specific subtrahends. Predictions could be tailored to each reactor.
In addition, while the invention is disclosed as a method of calibrating a
single
5 measurement device, it is also contemplated that the meancentered data could
be
obtained form a number of units that measure both the same subjects and
different
subjects. Lastly, the generic calibration discussed above preferably uses more
than
one subject because multiple subjects permit a sufficient quantity of infra-
subject
variation data to be obtained in a short period of time. However, for other
situations
10 where there are not multiple subjects, such as the observation of a unique
chemical
process, the calibration data may be obtained from the one site over an
extended
period of time. It is intended that the scope of the invention be defined by
the claims
appended hereto.
New characteristics and advantages of the invention covered by this document
1 S have been set forth in the foregoing description. It will be understood,
however, that
this disclosure is, in many respects, only illustrative. Changes may be made
in details,
particularly in matters of shape, size, and arrangement of parts, without
exceeding the
scope of the invention. The scope of the invention is, of course, defined in
the
language in which the appended claims are expressed.
- 43 -