Note: Descriptions are shown in the official language in which they were submitted.
CA 02349416 2009-04-14
Title: IMPROVEMENTS IN MS/MS SCAN METHODS FOR A
QUADRUPOLE/TIME OF FLIGHT TANDEM MASS SPECTROMETER
FIELD OF THE INVENTION
This invention relates to mass spectrometry including multiple
mass analysis (MS/MS) steps and final analysis in a time of flight (TOF)
device or in general any orthogonal mass spectrometry system. This
invention is more particularly concerned with such a technique carried out in
a
hybrid tandem quadrupole-TOF (QqTOF) spectrometer and is concerned with
io improving the duty cycle of such an instrument for parent or precursor ion
scanning and like operations, or more generally to improving the duty cycle
over a wide mass range for any type of scan.
BACKGROUND OF THE INVENTION
Tandem mass spectrometry is widely used for trace analysis
and for the determination of the structures of ions. In tandem mass
spectrometry a first mass analyzer selects ions of one particular mass to
charge ratio (or range of mass to charge ratios) from ions supplied by an ion
source, the ions are fragmented and a second mass analyzer records the
mass spectrum of the fragment ions. In a triple quadrupole mass
spectrometer system, this effects MS/MS. Ions produced in an atmospheric
pressure source, pass through a region of dry nitrogen and then pass through
a small orifice, into a region at a pressure of several torr. The ions then
pass
through a quadrupole ion guide, operated a pressure of about 7x10⁻³ torr into
a first quadrupole mass analyzer, operated at a pressure of about 2x10⁻⁵ torr.
Precursor ions mass selected in the first quadrupole mass analyzer are
injected into a collision cell filled with an inert gas, such as argon, of a
pressure of 10"4 to 10"2 torr. The collision cell contains a second quadrupole
(or multipole) ion guide, to confine ions to the axis. Ions gain internal
energy
through collisions with gas and then fragment. The fragment ions and any
undissociated precursor ions then pass into a third quadrupole, which forms a
second mass analyzer, and then to a detector, where the mass spectrum is
recorded.
CA 02349416 2009-04-14
2
Triple quadrupole systems are widely used for tandem mass
spectrometry. One limitation is that recording a fragment mass spectrum can
be time consuming because the second mass analyzer must step through
many masses to record a complete spectrum. As in any scanning mass
analyzer, all other ions (outside of 'transmission window') are lost for
analysis,
thus reducing the duty cycle to values of around 0.1% or less. To overcome
these limitations, QqTOF systems have been developed (as described for
example in: Morris, H.R.; Pacton, T; Dell, A.; Langhorne, J.; Berg. M.;
Bordoli,
R.S.; Hoyes, J.; Bateman, R.H.; Rapid Commun. Mass Spectrometry, 1996,
io 10, 889-896; and Shevchenko, A.; Chernushevich, I.; Ens, W.; Standing,
K.G.;
Thomson, B.; Wilm, M.; Mann, M., Rapid Commun. Mass Spectrometry, 1997,
11, 1015-1024). This system is similar to the triple quadrupole system but the
second mass analyzer is replaced by a time-of-flight mass analyzer, TOF. The
advantage of the TOF is that it can record 104 or more complete mass spectra
in one second without scanning. Thus for applications where a complete mass
spectrum of fragment ions is desired the duty cycle is greatly improved with a
TOF mass analyzer and spectra can be acquired more quickly. Alternatively
for a given measurement time, spectra can be acquired on a smaller amount
of sample.
A further known technique is the coupling of electrospray
ionization (ESI) to time-of-flight mass spectrometers (TOFMS), and this is an
attractive technique for mass spectrometry. ESI is a soft ionization technique
capable of forming ions from a broad range of biomolecules, while TOFMS
has the well known advantages of rapid mass scanning, high sensitivity, and a
theoretically limitless mass range. However, ESI and TOFMS are, in one way,
incompatible as a source/analyzer pair: ESI creates a continuous stream of
ions and TOFMS requires pulsed operation. Thus in the simplest coupling of
ESI to TOFMS there is a very poor duty cycle, with less than 1% of the ions
formed being detected (to obtain reasonable mass resolution) and early work
in this field was predominantly concerned with increasing the duty cycle.
Within the past two years, literature on ESI-TOFMS has begun
to focus on tandem mass spectrometry (MS/MS) with hybrid instruments. The
CA 02349416 2009-04-14
3
fragmentation of ions in these systems is achieved via traditional methods for
collision induced dissociation (CID). Tandem-in-space systems termed
quadrupo{e-TOF's (QqTOF or QTOF), as noted above, are analogous to triple
quadrupole mass spectrometers - the precursor ion is selected in a
quadrupole mass filter, dissociated in a radiofrequency- (RF-) only multipole
collision cell, and the resultant fragments are analyzed in a TOFMS. Tandem-
in-time systems use a 3-D ion trap mass spectrometer (ITMS) for selecting
and fragmenting the precursor ion, but pulse the fragment ions out of the trap
and into a TOFMS for mass analysis.
Tandem mass spectrometers (in particular, triple quadrupoles
and QqTOFs) are often used to perform a technique known as a parent ion
scan (or precursor ion scan). In this technique, the first mass resolving
quadrupole is scanned in order to sequentially transmit precursor ions over a
selected mass range. The second mass spectrometer is used to selectively
transmit only one specific fragment or product ion from the collision cell.
The
mass spectrum thus produced by scanning the first mass spectrometer shows
only those ions from the ion source which fragment to produce the specific
product ion. Thus from a complex mixture of ionized species, a simple mass
spectrum showing only those components which produce the known fragment
ion is produced. This method is often used in order to identify precursor ions
as candidates for full MS/MS. For example, if the sample contains a mixture of
many different species, and the only compounds of interest are those which
have a structure known to always generate a fragment of m/z 86, then a
precursor ion scan may be performed in order to identify which precursor ions
form m/z 86. A full MS/MS spectrum may then be performed on those few
precursor ions, instead of on every peak in the Q1 mass spectrum. In this
way, a significant amount of time can be saved in analyzing the sample.
In triple quadrupoles, precursor ion scans have proved to be the
right tool to search for ions of certain classes of compounds, e.g. peptides',
glycopeptides2 or phosphopeptides3 (as detailed, for example in the following
references for these three classes of compounds: 'M. Wilm, G. Neubauer and
M. Mann, Anal. Chem., 1996 68, pp. 527-533; 2S.A. Carr, M.J. Huddleston
CA 02349416 2009-04-14
4
and M.F. Bean, Protein Science, 1993, 2, pp. 183-196; 3S.A. Carr, M.J.
Huddleston and R.S. Annan, Anal. Biochem., 1996, 239, pp. 180-192).
However, a current limitation of the Qq-TOFs is their lower sensitivity in
this
particular mode of operation, compared to triple quadrupoles. The last mass
s analyzer (TOF or Q3) does not need to scan in this mode, and the Qq-TOF
does not benefit from simultaneous ion detection in TOF. On the other hand,
more ions are lost in a TOF compared to a third quadrupole: at the entrance,
on grids, and mostly due to duty cycle.
The problem here is that usually the fragment ions cover a large
io m/z range, and the TOF instrument has to capture all that m/z range if
consecutive spectra are not to overlap. If one is interested in just a
particular
mass, then this can lead to a low duty cycle.
There are two main factors governing the duty cycle of an
orthogonal acceleration TOF instrument when operated in the conventional
15 (continuous beam) mode. Generally, you have to wait for the heaviest ions
to
reach the detector before the next pulse of ions can be introduced. Since the
width of the entrance window is only a fraction of the transverse distance
between the ion storage region and the detector, even the heaviest ions will
overfill this region before the next pulse of ions can be released. The loss
due
20 to this effect is simply equal to the ratio of the length of the entrance
window
to the distance between the storage region and the detector. This ratio is
often
1:4, giving a maximum duty cycle of 25% (achievable only for the heaviest
ions).
Additionally, there is a loss factor due to the mass-dependent
25 velocities of the ions. This is due to the fact that ions have a constant
transverse energy, which means that the velocities of the lighter ions are
higher than those of heavier ions (in the ratio of the square root of the
ratio of
the masses). This means that the duty cycle loss of lighter ions is larger
than
that of the heaviest ions in the spectrum, that is the lighter ions tend to
overfill
30 the ion storage region to an even greater extent than the heavier ions. For
example, if ions of up to m/z 2000 are present, and one is particularly
interested only in m/z 200, then the additional loss factor is:
CA 02349416 2009-04-14
200
2000 = 0.1 =0.316
Putting together the loss factor for the heaviest ions, plus the
additional loss factor for lighter ions, gives for m/z 200 a total duty cycle
of
approximately 31.6% time 25%, which is approximately equal to 8%. The
5 equation which describes the theoretical efficiency for m/z m, is therefore:
Transmission efficiency = 0.25 * (m,lM) (1)
where M = heaviest ions which can reach the detector within the time period
io of one pulse (i.e. within a time equal to 1/f, where f is the frequency of
the
TOF pulse).
It has been known to provide ion traps in a TOF mass
spectrometer (although not in a QqTOF type of arrangement, using the
collision cell as the ion trap). Thus, U.S. patent 5,689,111 (Dresch et al and
is assigned to Analytica of Brantford) describes an instrument which provides
a
linear two-dimensional ion guide with a time of flight mass analyzer. The ion
guide is a multipole ion guide. However, while the intention is to improve the
duty cycle, a single ion guide is provided extending through two different
chambers. An ion entrance section of the ion guide is located in a region
20 where background gas pressure is in the viscous flow regime and the
pressure along the ion guide drops to molecular flow pressure regimes at the
ion exit section. The ion guide is switched to operate as an ion trap.
However,
this is not a tandem instrument in that there is only a single multipole ion
guide. Thus, this instrument can only detect ions in a certain mass range, and
25 does not have the ability to provide an upstream mass resolving section to
select ions of interest. There is no recognition that this method can be
applied
to enhance the sensitivity of an MS/MS device where ions are coming out of a
collision cell. Nor is there any indication that it can be used to enhance
sensitivity in any situation where one or more specific ions (fragments or
30 precursors) are desired to be monitored. Specifically, there is no
indication
CA 02349416 2009-04-14
6
that the method can be used to enhance the sensitivity in a precursor ion scan
mode, MRM mode, or neutral loss scan mode.
Another proposal is found in U.S. patent 5,763,878. This
discloses a method and device for orthogonal injection into a time of flight
mass spectrometer. It provides a somewhat unusual arrangement in which
the multipole rod set extends through to the time of flight instrument. Ions
are
then pulsed out from one of the rod sets into the field free drift region of
the
time of flight instrument. However, again, there is no provision of an
upstream
mass resolving section. Also, both these patents do not discuss or mention a
io precursor ion scanning technique, and do not mention any MS/MS scanning
methods.
SUMMARY OF THE INVENTION
It is now being realized that providing an ion trap in a QqTOF
can lead to considerable improvement in the duty cycle of the overall
instrument, for those types of scan where a relatively narrow m/z range needs
to be recorded by the TOF analyzer, in particular: precursor ion scan,
"neutral
loss" scan, and "multiple reaction monitoring" (MRM) scan, which is
sometimes referred to as "selected reaction monitoring" (SRM) scan. It has
also been realized that the technique detailed below can be used to provide a
considerable improvement in the duty cycle over a wide mass range by, in
effect, applying the method of the present invention to a series of narrow
mass ranges.
In accordance with the present invention, there is provided a
method of effecting mass analysis on an ion stream, the method comprising:
(1) providing a stream of ions having different mass to
charge ratios;
(2) trapping the ions in an ion trap;
(3) periodically releasing, from the trapped ions, ion pulses
into a mass analyzer, to detect ions with a second mass to charge ratio; and
(4) providing a delay between the release of the ion pulses
and initiation of mass analysis in the mass analyzer, and
, . ,~...~..-~...,.~._~. ~ -~ . _
CA 02349416 2009-04-14
7
adjusting the delay to improve the duty cycle efficiency in
the mass analyzer for ions with a desired mass to charge
ratio.
The method preferably includes effecting mass analysis in a
time of flight instrument provided as said mass analyzer, and adjusting the
duration of each ion pulse to improve the duty cycle efficiency of ions with
the
desired mass to charge ratio. More preferably, the delay of step (4)
comprises providing a time delay between each ion pulse and initiation of a
drive pulse in the time of flight instrument, and adjusting the duration of
each
io ion pulse and the time delay to improve the duty cycle for a range of ion
mass to charge values, including the desired mass to charge ratio.
For a wide range of mass to charge ratios, the mass
analysis of step (4) comprises mass analyzing ions in a relatively broad range
of mass to charge ratios, the method including: enhancing the sensitivity for
different ion mass to charge ratios by providing a series of intervals, during
each of which the ion pulse duration and the time delay are optimized for a
relatively narrow range of mass to charge values, and setting the narrow
ranges of mass to charge ratios to cover together all of the broad range of
mass to charge ratios, whereby substantially all ions in the broad range of
mass to charge ratios are given an improved duty cycle.
For a variety of MS/MS techniques, the method includes:
a) passing the ion stream through a mass analyzer to select
a precursor ion with a desired mass to charge ratio;
(b) subjecting the precursor ions to at least one of the
collision-induced association and reaction to generate product ions; and
(c) passing the product ions into the ion trap to effect step
(3).
CA 02349416 2009-04-14
8
BRIEF DESCRIPTION OF THE DRAWING FIGURES
For a better understanding of the present invention and to show
more clearly how it may be carried into effect, reference will now be made, by
way of example, to the accompanying drawings which show a preferred
embodiment of the present invention and in which:
Figure 1 is a schematic of a QqTOF instrument;
Figure 2a is a detailed schematic of the collision cell and pulser
section at the TOF at Figure 1;
Figure 2b is a diagram showing variation of the DC potential in
io the collision cell;
Figure 2c is a timing diagram for pulses for the QqTOF of Figure
2a;
Figures 3a-3d are graphs showing variation of sensitivity for
different pulse delays for ejecting ions from an ion trap and showing
comparison with no trapping;
Figures 4a and 4b are graphs showing the relative performance
for a precursor ion scan, with and without ion trapping;
Figures 5a and 5b are graphs showing the relative performance
for an MRM scan, with and without ion trapping; and
Figures 6a-6d are graphs showing variation of the flight time for
different gate voltage profiles on the exit lens from the collision cell, with
gate
voltage profiles shown insert;
Figure 7 shows graphically how enhancement ranges or
intervals are determined in order to cover a wide range of mass to charge
ratios;
Figure 8 shows a product ion spectrum obtained using
conventional techniques; and
Figure 9 shows a product ion spectrum obtained, for the same
sample as in Figure 8, in accordance with the present invention.
.,nv..xvvrw ..u.-_1 ,. r... ......_..mm+u.us~mwm. ..,,.....,.... . . ........
.. . . .. . .
CA 02349416 2009-04-14
9
DESCRIPTION OF THE PREFERRED EMBODIMENT
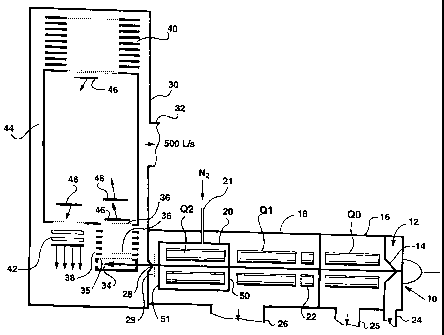
Referring first to Figure 1, there is shown a QqTOF instrument,
and the basic configuration of such an instrument is known.
This instrument includes an electrospray source 10, although it
is understood that any suitable ion source can be provided. lons pass through
into a differentially pumped region 12, maintained at a pressure of around 2.5
torr, and from there through a skimmer 14 into a first collimating quadrupole
QO operated in RF-only mode. QO is located in a chamber 16 maintained at a
pressure around 10-2 torr.
Downstream, there is a further chamber 18, containing two main
rod sets Q1 and Q2, with Q2 being located within an interior, subsidiary
chamber 20. Chamber 18 would be maintained at a low pressure of
approximately 10-5 torr, while the subsidiary chamber 20 is supplied with
nitrogen or argon gas as indicated at 21 for effecting CID. Chamber 20 would
be typically maintained at a pressure of around 10-2 torr.
Upstream from the rod set Q1 is a short collimating rod set 22.
The rod set Q1 is operated in a mass resolving mode, to select ions with a
particular m/z ratio. These ions then pass through into Q2 and are subject to
collision-induced dissociation (CID) and/or reaction. Then, the product ions,
2o and any remaining precursor ions pass through into the TOF instrument
indicated generally at 30.
It is to be noted that the various chambers of the device are, in
known manner, connected to suitable pumps, with pump connections being
indicated at 24, 25, 26 and, for the TOF instrument at 32. Commonly, the
differentially pumped region 12 would be connected to a roughing pump,
which would serve to back up higher performance pumps connected to the
pump connections 25, 26 and 32.
As the ions leave the chamber 20, they pass through a focusing
grid 27 and then pass through a slit having dimensions of 2mm times 8mm
into the TOF 30.
CA 02349416 2009-04-14
Within the TOF 30, there is an ion storage zone 34 and window
35. Grids 36 are provided in known manner for effecting a push-pull pulse to
ions collected in the ion storage zone 34. An accelerating column is indicated
at 38.
5 At the far end of the TOF instrument, there is an ion mirror 40
and a detector is provided at 42. In known manner, the main chamber or flight
tube of the TOF is defined by a liner 44.
Ions leaving the ion storage window 34 are accelerated towards
the ion mirror 40 and then back towards the detector 42. The ions still have a
io transverse velocity (resulting from their travel through the quadrupole rod
sets
QO, Q1 and Q2), which means that they return to the detector 42. Clouds of
ions are indicated schematically at 46, showing how ions travel through the
TOF instrument 40.
Now, in accordance with the present invention, the chamber 20
around the quadrupole Q2 is provided with lenses 50 and 51 at either end so
that it can be operated as an ion trap.
Reference will now be made to Figures 2a, 2b and 2c to explain
the effect of trapping ions in Q2 on the instrument's duty cycle. Figure 2a
shows Q2, the chamber 20 and the lenses 50, 51, the grid 27, the slit 28 and
the ion storage zone 34 with a window 35. Figure 2b shows the plot of voltage
along the axis of Q2, and Figure 2c shows the timing of the voltages applied
to the lens 51 and storage zone 34.
Figure 2b shows the variation of the DC potential along the axis
of the rod set Q2. The DC potential at the rod set Q2 is indicated at 60, and
at
61 the potential gradients at either end up to the potential of lenses 50, 51
are
indicated. The potential at the slit is indicated at 62 (in this case, the
slit and
the storage zone 34 are at ground potential). Line 63 (top line) shows the
profile of the potential when ions are trapped in Q2, and Line 64 shows the
profile of the potential when the voltage on exit lens 51 is dropped in order
to
3o release a pulse of ions. The exact form of this gradient can be modified by
changing the potential on grid 27, which is between lens 51 and slit 28. Thus,
CA 02349416 2009-04-14
11
in effect, through the chamber 20, the ions then see either a constant DC
potential, or a gradient accelerating the ions towards the storage region 34.
In Figure 2c, 70 shows the variation of potential on the exit lens
51 with time. For comparison purposes, for the lens 51, the dashed line 76
indicates the DC potential of the rod set Q2 correspondingly. Line 74 shows
the variation of potential of the conventional push-pull arrangement at the
ion
collection zone 34.
During the trapping period (lens 51 at "high" voltage, typically 2V
above the potential 76 of the rod set Q2), ions enter collision cell Q2
easily,
io but cannot leave it in either axial direction because of the potential
barrier
present on both entrance and exit lenses 50 and 51. This is true even if ions
have a significant amount of energy upon entering Q2, since most of this
energy will be lost due to collisions with gas in Q2, resulting in both
fragmentation and collisional damping of ions, and possibly reaction with the
gas.
When it is desired to eject a pulse of ions, the voltage on the
lens 51 is switched to "low", (as shown at 64 in Figure 2b) which is lower
than
the potential of the rod set 76. This "low" voltage is applied for the time
ATp, a
pulse duration. Typically, the "high" voltage is a few volts higher, and the
"low"
voltage is a few volts lower that the rod set voltage 76.
A cloud of ions then leaves the ion trap. After time ATp when
some, but not necessarily all of the ions have left the ion trap, the voltage
on
the lens 51 goes to "high" again. The time between pulses (typically 100-200
ps) is much smaller than a characteristic time of scanning Q1 (dwell time),
typically 1-10 ms, so it is not critical if some ions remain in the trap of
Q2, as
these can be included in the next pulse. This has a dual effect: it starts
trapping in Q2 again; and it may also have the effect of accelerating the
rearmost portion of the elongated ion cloud towards the TOF device and
causing the ions to bunch up. This is a desirable effect, as it helps to
produce
3o a shorter (in the direction of flight) ion cloud. While trapping itself
doesn't
depend on the particular values of "high" and "low" voltages, the "bunching"
effect depends strongly on these voltages, and they should be adjusted
..,mm,iK L -.v.i.-.v.w..m.,.x..w-.,......+w.....:....w......,.-...,....
......._ _... . . .. . .. . .
CA 02349416 2009-04-14
12
properly; this is detailed below. Generally, ATp is calculated from the
velocity
of ions of interest and the length of the storage zone 34, so that the cloud
of
ions is short enough not to overfill the storage zone 34, so as to make best
use of the ions.
The ion cloud then passes through the slit 28 and into the ion
storage zone 34. After a time delay period tD, as indicated in Figure 7, the
appropriate push-pull voltages, indicated at 74, are applied, to accelerate
the
ions into the TOF device, for measurement in known manner.
The time delay tD is selected in such a way so as to maximize
io transmission of ions in the m/z-range of interest. Since all ions are
accelerated with same electric fields from lens 51 to the storage zone 34,
they
obtain same kinetic energy in this region, but their velocity depends on their
mass. Thus, this region serves as another small TOF analyzer where a rather
crude separation of ions happens.
The ion transmission is maximized for those ions which at the
time of push-pull pulse happen to be in the storage zone 34 exactly under the
window 35. For those ions a 100% duty cycle will be achieved. So, the optimal
delay time tD is selected to allow ions of interest to move from Q2 to the
storage zone 34 and generally centered under the window 35.
The delay time tD is proportional to 4"'/Z . Since the flight time
through the main TOF device is also proportional to the same value, the
optimal delay time can be found as a certain ratio of the flight time measured
in the TOF device. In our instrument, these times were found to be roughly
equal.
Now, for m/z=86, the flight time through the TOF device is 26
ps, while the optimal delay time tD was found to be 22 ps, i.e. approximately
equal as indicated. This ion, with m/z=86, is of particular interest in some
applications since it is an ammonium ion of most abundant amino acid
residues leucine and isoleucine, and it is widely used in "precursor ion
scanning" in order to distinguish peptide ions from ions of other compounds.
CA 02349416 2009-04-14
13
Based on the dimensions of the instrument used, the average
time for the ions to travel from the ion trap to the ion collection zone 34 is
17.5
ps. For this the calculated pulse width OTp should be approximately 6.5 Ns.
The fact that the actual optimum values found (20 ps pulse width and 22 ps
time delay) for m/z 86 are different from the calculated values, may be due to
the additional time which is required for ions to travel from inside the
collision
cell to the exit lens 51.
It is to be appreciated that the invention can also be used to
effect a neutral loss scan. In such a scan, the intention is to measure ions
io having a constant mass difference from ions selected in Q1, with the same
charge. For example, if ions with an m/z of 1,000 are selected in Q1, then the
TOF 31 could look for ions with an m/z of 800; in other words, one is looking
for a neutral mass loss of 200 daltons with both ions being singly charged. A
neutral loss scan for 200 would require scanning the quadrupole, while
trapping in the collision cell and adjusting the time delay to provide optimum
efficiency for product ions which were 200 daltons lower in m/z than the
precursor ion.
Reference will now be made to Figures 3a and 3b, which show a
series of tests carried out using a peptide, commonly identified as ALILTLVS,
to generate the ions. This peptide has an m/z of 829. It was passed into Q2,
trapped and fragmented, and the product ions scanned in the TOF instrument
or device 30. Figures 3a and 3b show two variants of this test; in Figure 3a
no
trapping was carried out, and the product ions were passed straight through to
the TOF instrument 30, and in Figure 3b, trapping was carried out with a time
delay tD 22 Ns.
As shown in Figure 3a, the total count for the m/z 86 was around
10,000, and there was a significant signal detected in the range of
approximately m/z 200-500. In Figure 3b, on the other hand, the count for m/z
86 shows a gain of approximately 17. Noticeably, the signal for ions of higher
m/z is largely absent. This is due to the coarse or rough mass selection which
occurs when ions are released from the ion trap to the ion collection window
34.
e nRw, Yrv I . . .._ . , .........s. .,..,..,... ....... .. ......... .......
. .
CA 02349416 2009-04-14
14
This is emphasized further in Figures 3c and 3d. These two
figures show respective delays of 20 and 24 ps. As might be expected, the
shorter delay of tp = 20 ps, is not quite long enough for ions of m/z = 86 to
reach the ion collection zone 34. In fact, this shows a reduced signal even as
compared to the untrapped signal of Figure 3a. Relatively high counts are
recorded in the range 60-80 m/s.
In contrast, in Figure 3d, a relatively strong signal is recorded,
for tD=24 ps, but the performance is not as good as in Figure 3b. This series
of figures clearly indicates that selection of the appropriate time delay tD
is
io critical to obtaining high sensitivity and a strong signal for the mass of
interest.
Turning now to Figures 4a and 4b, these show a precursor ion
scan for a tryptic digest of myoglobin, i.e. myoglobin digested by an enzyme
to give a variety of peptides. Here, the vertical axis again indicates the
number of counts for m/z 86 as detected in the TOF instrument 30. The
horizontal axis shows the variation of m/z of the precursor ion, as scanned in
Q1.
Thus, Figure 4a shows two significant peaks for an m/z of the
precursor ion of somewhere just below 700 and at approximately 740, as
giving strong signals for m/z 86 detected in the TOF instrument 30.
A comparison of Figure 4b shows an approximate gain of 15 in
the signal strength for the peaks detected, when trapping is carried out in
Q2.
Again, trapping here is carried out with the delay tD determined from the
results shown in Figure 3, i.e. with tp = 22 ps. One can also note that
relative
diminution of small, background peaks in Figure 4b as compared to Figure 5a.
Turning to Figures 5a and 5b, these again show a comparison of
results obtained without trapping and with trapping. Once again, the sample
used was the peptide ALILTVS, which produces a precursor ion of m/z 829.
The precursor m/z 829 was selected with Q1 and fragmented in the collision
cell, and Figure 5a shows the full MS/MS spectrum, which contains an ion of
m/z 268.15. While it is prominent, it is not the highest peak, and it shows an
intensity of approximately 1,100. This shows the effect of no trapping.
CA 02349416 2009-04-14
With trapping, and optimizing the time delay for m/z 268.15, one
can see that this peak at m/z 268.15 is now the largest peak, and the total
count has increased, by a factor of 13 to approximately 15,000. This indicates
that the method can be used to optimize ions of different m/z.
5 The trapping method can be used advantageously to improve
the performance of the MRM mode of analysis. The MRM mode is commonly
used on triple quadrupoles to quantitatively measure the levels or amounts of
targeted compounds, where the precursor and product ions are known. In
triple quadrupoles, Q1 and Q3 are sequentially tuned to one or more
io precursor/product ion combinations. On the QqTOF, the trapping method can
be used to improve the sensitivity for the targeted ions of interest, by
setting
Q1 to the precursor ion of interest and the time delay appropriate to the
product ion of interest. After recording the ion intensity in the TOF for the
product ion of interest for a time period of a few milliseconds, then Q1 and
the
15 time delay can be set to new values appropriate for another
precursor/product
combination. This provides enhanced sensitivity for the MRM mode, where
several targeted ions can be monitored.
Referring now to Figures 6a-6d, these show the effect of
variation in the voltages on the exit lens 51 and the duration ATp, of the
voltage pulse on that exit lens. For convenience, each of these figures
include
some insert, indicating the voltage pulse profile, with references 70, 70A and
76, as in Figure 2c.
For the data collected at Figures 6a-6d, the peptide ALILTLVS is
used. It is fragmented upstream of QO, by a separate technique. In Q1, m/z 86
was selected. Q2 was operated in a trapping mode only with no
fragmentation. The TOF instrument 30 was operated in a DC mode, i.e. with
no pulsing, so that the total flight time from Q2 to the TOF detector could be
determined. Thus, the flight times shown in Figure 6 are a total of the flight
times from the lens 51 to the ion storage zone 34, and then from the ion
storage zone 34 to the detector 42.
Referring first to Figure 6a, this shows that the voltage on lens
51 was initially 10 volts, that is 2 volts above the DC rod potential of 76.
For a
CA 02349416 2009-04-14
16
pulse period of 5 ps, as indicated at 70A, this voltage is reduced to 6 volts.
This gave the peak profile shown.
Figure 6b shows a pulse with similar high and low voltage
characteristics, but with a much longer duration of 30 ps. As might be
expected, this shows a considerable width to the base of the peak. This
indicates that there is an initial burst of ions leaving the rod set Q2, and
then
remaining ions are released more slowly.
Figure 6c shows the same voltage characteristics, but for an
intermediate duration OTp of 20 ps. This shows a much improved peak shape.
io The peak shows a higher maximum, and less spreading.
Figure 6d shows an alternative pulse profile, for comparison
purposes. Here, the duration ATp again was 20 ps, but when the gate 51 was
opened, its voltage was reduced to 2 volts, i.e. 6 volts below the DC
potential
of the rod set Q2. It is believed that this large drop, and then the recovery
at
the end when the lens 51 is switched back to 10 volts, gave an undesirably
large acceleration to those ions which left the collision cell last. As a
consequence, these ions, effectively, arrived early, giving the expanded peak
width on the left-hand side, showing ions arriving shortly after 50 ps. It
seems
clear that the time focusing properties exhibited in Figures 6a-6d are due to
the process known as time-lag focusing.
It is clear from Figure 6 that appropriate selection of the voltage
magnitude and the pulse duration ATp can be helpful in obtaining a sharp
peak shape, which can improve the definition of the mass window and provide
better sensitivity.
It is clear from the description above that selection of
appropriate values of the pulse width ATp and the pulse delay tDcan provide
very large increases in sensitivity for a specific mass (m/z) values, and also
for a range of m/z values around the selected value. For example, in Figure
5b, where these values are optimized to enhance the sensitivity of m/z 298.1,
there are other peaks in the vicinity which are also enhanced. In fact the
inventors have discovered that for the particular geometry of the QStar
CA 02349416 2009-04-14
17
QqTOF system (manufactured by MDS Inc., doing business as MDS Sciex)-
when m/z Ml is enhanced, the range over which enhancement occurs
extends from approximately M1/2 up to 3M1/2, that is over a mass range
which is approximately equal to the value of m/z which is enhanced.
However, the degree of enhancement is not flat over that range of m/z values.
The gains increase from about lx at the value of M1/2, to a maximum at Ml,
and then fall gradually again to a value of 1x or less at a value of 3M1/2.
These figures are approximate, and details of the shape of the enhanced
region may depend on other factors such as lens voltages, ion energies etc.
lo Additionally, the width of the enhanced region depends on the geometry of
the instrument, in particular on the distance between the trapping region and
the acceleration region of the TOF. However, what is clearly observed is that
the width of the enhanced region increases as the value of the "center"
enhanced m/z increases. Thus if OTp and tp and are selected to optimize the
enhancement of m/z 86, then the range of m/z values observed (and
enhanced by factors of more than 1) is very narrow. However, if the
parameters are selected to optimize m/z 298.1, then the enhanced region is
wider. If the parameters are selected to optimize m/z 600, then the enhanced
region may extend approximately from m/z 300 up to m/z 900, although the
2o enhancement factors at each end of the range will not be optimum.
This discovery suggests that the techniques can be used to
enhance a wide range of m/z values if desired, instead of simply focusing on a
single m/z value. For example, it is commonly required to obtain a Product Ion
Scan over a wide mass range. In this mode of operation, a single precursor
ion is selected with Q1, which is fixed at the m/z value of the precursor ion.
The ions are fragmented in the collision cell (Q2), and the entire range of
product ions is desired to be recorded in the TOF section. This mode is one of
the most common modes of operation of a QqTOF System such as the QStar.
In this case, it is desirable to enhance the sensitivity of a wide mass range,
3o equal to the expected mass range of all of the product ions. This range may
extend from a low value such as m/z 50, up to at least the m/z of the
precursor m/z, and if the precursor ion is doubly charged, the desired range
CA 02349416 2009-04-14
18
may extend up to a value of twice the m/z of the precursor ion. These
operating conditions are well known in the art.
Without application of the present invention technique, the
desired Product Ion Scan is performed by selecting the Precursor ion m/z with
Q1, fragmenting the selected ions in Q2, and allowing all product ions to flow
continuously into the TOF region, where they are pulsed orthogonally as
described above, in order to product a TOF spectrum. Since no trapping is
employed, ions of all m/z values can flow simultaneously into the TOF section.
However, duty cycle losses as described above will be incurred, resulting in
io mass dependent transmission efficiency across the range of the mass window
as described by Equation (1) above.
Now if it is desired to obtain a Product Ion Scan across a wide
mass range, and it is desired to obtain the scan during a time T1 (for
example,
during a time of 1 second), then the time period T1 can be divided into two or
more intervals, and during each interval a region of the TOF product ion
spectrum can be acquired which is enhanced over a certain range. By
selecting the appropriate ranges of m/z values to be enhanced, and setting
the timing parameters to enhance each range during an interval of time, and
then adding the resulting sections of the spectrum together, then a complete
product ion spectrum, which is enhanced by some factor over the entire wide
mass range, can be produced. Thus for example, if it is desired to obtain a
product ion scan over a range from m/z 60 to m/z 500, the range can be
broken into intervals of from m/z 60 to m/z 100, 100 to 300, and 300 to 500.
By setting ATp and tD to values which enhance m/z values within the first
range, and acquiring data for 0.33 second, then setting the parameters to
enhance the second range for 0.33 second, and then setting the parameters
to enhance the third range for 0.33 seconds, and adding the resultant spectra
together, a complete spectrum can be obtained in one second which is
enhanced by some factor at all masses, although the enhancement factor will
3o not be uniform over the entire range. By proper choice of ranges and timing
parameters, a significant increase in sensitivity can be achieved over a wide
mass range in this way.
CA 02349416 2009-04-14
19
If the width of the mass range to be enhanced extends from
M(Low) to M(High), then this range should be divided into n segments. The
first segment, centered at m(1), has an enhanced range from m(1)/2 up to
3*m(1)/2. The next mass range, centered at m(2) should start at 3*m(1)/2 and
extend up to 3*m(2)/2. This pattern should be repeated until the entire mass
range from M(Low) to M(High) is covered. A table of values of m/z values,
delay and width values should be constructed as follows:
m(1) = M(Low)*2
io m(2) = 3*m(1)
m(3) = 3*m(2)
m(4) = 3*m(3)
m(n) = 3""'m(1)
etc until 3*m(n)/2 a M(High)
For each value of m(n), corresponding values of ATp and tD are
calculated which are optimum for each value of m(n). These values may be
calculated from previously constructed algorithms which can be used to
predict the values of ATp and tD. For example, for the geometry of the QStar
QqTOF system, it has been discovered that the optimum values of ATp and
tD are given approximately by:
ATp =.0013*sqrt(m(n)) milliseconds
tD = .003*sqrt(m(n))
Then for each value of m(n) calculated above, corresponding
values of ATp and tD can be calculated. In order to enhance the range from
M(Low) to M(High), the mass range is divided into n segments as described
above, and the time is divided into n sub-intervals. During the first sub-
interval, ATp and tD are set to those appropriate for m(1). For the second sub-
CA 02349416 2009-04-14
interval, the values are set to those appropriate for m(2), etc up to m(n). By
summing the mass spectra acquired during each sub-interval, an entire mass
spectrum from M(Low) to M(High) is produced, and the intensity of the entire
spectrum will be enhanced.
5 In addition to the parameters which control the timing of the
trapping and releasing of ion pulses, it is also known that the ion signal
intensity is also a function of the RF voltage level on the collision cell.
For
example, if low mass ions are to be stably trapped and confined in Q2, it is
important that the RF voltage be set to a value which is optimum for the mass
to range of interest. When the RF voltage of the collision cell (Q2) is set to
a
value which is optimum for mass m(n), a range of m/z values is transmitted
which extends from approximately 0.8m(n) up to at least 5m(n). For example,
when the voltage is optimum for transmission of m/z 100, ions from m/z 80 up
to approximately at least m/z 500 are also transmitted. The decrease at the
15 high end of the range is rather gradual, so the boundary of 5m(n) is only
very
approximate.
Nevertheless it is clear that in order to optimally transmit a wide
range of productions, the RF voltage on Q2 may also need to be stepped
sequentially through 2 or more values during each acquisition period. This is
20 true even in the normal (prior art) mode of operation. For example, if it
is
desired to acquire a product ion spectrum from m/z 50 up to m/z 1000 during
1 second, it has been found necessary to set the Q2 RF level to m/z 50 for
0.33 seconds, m/z 200 for 0.33 seconds and m/z 400 for 0.33 seconds. Note
that this will give a degree of overlap, but this is desirable and there is a
progressive drop off from the nominal center of each range, so as to ensure
adequate capture of all masses. Spectra acquired during each interval are
then added together. Since in order to perform the procedure described
above, the acquisition period must be divided into segments in which different
trapping parameters are applied, therefore it is advantageous to also set the
Q2 RF voltage to a value which is optimum for each range of m/z values
which are enhanced during the trapping. Therefore, for each set of trapping
parameters which are applied, a different Q2 RF voltage is also set in order
to
CA 02349416 2009-04-14
21
provide the most optimum enhancement conditions. The method of setting all
of these parameters will be described below.
In the description above relating to TOF performance, the width
of each mass range m(n), that gives an enhanced signal in the TOF section,
is assumed to be approximately equal to the value of m(n). For example, if
m(1) = 200, then the range of enhanced m/z value is approximately equal to
200, extending from m/z 100 up to m/z 300. This recognition leads to the
pattern described above, where m(n) = 3"-1m(1), where m(1) is the center m/z
value of the lowest range to be enhanced. However, it is also recognized that
io the enhancement values decrease toward each end of the range of width
m(n). For this reason, in order to obtain maximum enhancement across a
mass range, it may be better to divide the range into smaller segments (as
suggested above for the RF level in Q2), such that each value m(n) = 2n"
lm(1). This will lead to narrower ranges, but each range will overlap
somewhat with the adjacent ranges.
Figure 7 shows graphically how the enhancement ranges are
constructed, and how they overlap to provide a wide range of enhancement.
Ranges are indicated at 81, 82, 83, 84 and 85 for the five different masses in
Table 1 below. While division into a greater number of smaller ranges
2o ensures that good overlap is achieved, and ensures that the average
enhancement over any range is larger, it also requires more steps, so that the
time spent in each interval will be less. Therefore it is likely that there is
an
optimum degree of overlap to achieve maximum overall enhancement. The
inventors have discovered that at least the suggested width of m(n) = 2""I
m(1)
works well, as will be shown below.
For each of the mass values m(n) into which the full range is
divided, there is a corresponding value of the Q2 m/z value. Since the best
transmission for any range is not centered on the mass value to which Q2 is
set (as stated above, the ranges may extend from 0.8m(n) up to 5m(n)), then
3o a preferred method of setting the Q2 m/z value (defined as the m/z value
which corresponds to a Matthieu q-parameter of 0.706) is as follows:
CA 02349416 2009-04-14
22
Q2(1) = M(Low) - 20
Q2(2) = m(2)/2 - 20
Q2(3) = m(3)/2 - 20
Q2(n) = m(n)/2 - 20
As an example, assume that it is desired to enhance the range
from 50 up 1000 amu. Then the values of m(n) are calculated as below:
m(1) =1.5* M(Low) = 1.5*50 = 75
m(2) = 22"1m(1) = 150
m(3) = 23"1m(1)= 300
m(4) = 241m(1)= 600
m(5) = 35-'m(1)= 1200
The corresponding Q2 m/z, ATp and tD values are shown in the
Table 1 below (where ATp and tD are in milliseconds and are calculated in
accordance with the equations above):
n m(n) Q2 OTp tD
1 75 30 .012 .026
2 150 55 .016 .037
3 300 130 .023 .052
4 600 280 .032 .073
5 1200 580 .045 .103
CA 02349416 2009-04-14
23
Therefore, as shown, the entire mass range is divided into 5
segments, and the acquisition time for each spectrum (which may be typically
of the order of 1 second) is divided into 5 intervals of 0.2 seconds each.
During the first 0.2 seconds, the width and delay parameters are set to 0.012
and 0.026 milliseconds respectively. During the next two seconds, the width
and delay are set to .016 and .037 milliseconds respectively, etc. At the end
of
the fifth interval, the cycle is repeated.
The spectrum in Figure 8 shows a complete product ion
spectrum of m/z 829, a singly charge peptide ion. Product ions from m/z 86 up
io to mlz 829 are present. This figure shows the intensity which is recorded
in a
normal mode of operation for an interval of one second, without the
enhancement technique applied. Figure 9 shows a spectrum of the same
sample, acquired for the same time period, when the procedure is used to
enhance the entire range of m/z values. In this case the range has been
divided into 4 sub-intervals, to make up a complete 1 second interval with the
following values of Q2, ATp and tD being used. It will be understood that, in
both cases, Q1 would have been held fixed to select m/z 829, and that timing
in the TOF section involved pulsing ions into the TOF section energy at a
frequency which is not faster than that that required to allow the highest m/z
ions to reach the detector between pulses. While a higher frequency could be
used for enhancement intervals, which correspond to lower m/z ions, there is
no advantage to doing so since the trapping does not allow any ions to be
wasted
Table 2
Interval Q2 OTp tD
1 60 14.2 32.8
2 120 20.1 46.5
3 240 28.4 65.7
3o 4 480 40.2 92.9
CA 02349416 2009-04-14
24
It can be observed that each of the peaks in the spectrum of
Figure 9 is significantly larger than that in Figure 8. For the major peaks in
the
spectrum, an average increase in intensity of a factor of approximately 5x has
been achieved.
While the method has been described in application with a
QqTOF tandem mass spectrometer system, it will be appreciated that the
method can be applied to any orthogonal time-of-flight mass spectrometer
system where it is desired to overcome mass-dependent duty-cycle losses,
and enhance a wide mass range, and where ions can be trapped and gated
io from a region upstream of the TOF pulsing region, and where the optimum
parameters for enhancement are mass dependent. For example, this method
could be applied to a quadrupole time-of-flight configuration such as
described by Douglas in PCT Application WO 00/33350, or by Whitehouse in
US Patent 6,011,259. It could also be employed for the same beneficial
is purpose described if the upstream mass spectrometer was a time-of-flight
mass spectrometer, an ion trap mass spectrometer, a magnetic sector mass
spectrometer, an ion mobility device, or any mass selective means which
supplies ions into a collision cell or ion guide which can be used to trap
ions
and then release them into an orthogonal time-of-flight mass spectrometer.
2o Although the application has been described for use with an electrospray
type
of ion source, it will be appreciated that it could be used for any type of
ion
source such as MALDI, electron impact, inductively coupled plasma (ICP),
chemical ionization, atmospheric pressure chemical ionization (APCI) etc. It
should be recognized that the product ions in the collision cell may not
simply
25 be fragments of the precursor ions, but can also be reaction products
formed
in the cell at low or high energy by reactions with neutral gas molecules,
which are added to the cell. Such ion-molecule reactions can be useful in
order to specifically detect certain chemical species by means of their
reaction, or may be used in order to remove interferences. Any products of a
30 precursor ion, whether fragment or cluster or reaction products, as well as
unreacted precursor ions in the cell, will be suitable enhanced by the method
of the present invention described.
. . 4r.~ _ ..~. .. ......... . . .. .
CA 02349416 2009-04-14
It will be recognized that although the invention has been
described with a collision cell, which includes a quadrupole rod set for ion
containment, other similar RF devices such as RF hexapole, octapole or other
multipole will work as well as a quadrupole. In addition, an RF ring guide or
5 RF ion funnel is well known in the art for providing ion containment and ion
trapping and can also function in the collision cell to allow ions to be
trapped
and released.