Note: Descriptions are shown in the official language in which they were submitted.
CA 02429818 2003-05-22
WO 02/052821 PCT/GBO1/05555
1
FAULT MANAGEMENT SYSTEM
FOR A COMMUNICATIONS NETWORK
This invention relates to a fault management system for managing faults in the
terminating circuits of a communications network and also to a method of
operating
such a fault management system.
A conventional communications network comprises a relatively small number of
interconnected main switches and a much larger number of local switches, each
of
which is connected to one or two main switches. The local switches are
connected to
the terminating circuits of the network and the far ends of these circuits are
connected
to terminal equipment such as telephone instruments provided for users of the
network.
The network formed from the main switches and local switches is known as the
core
network while a network formed from the terminating circuits is known
variously as an
access network or a local loop. In this specification, it will be referred to
as an access
network. Some terminating circuits are connected to a remote concentrator,
which may
or may not have switching capability. The remote concentrator is then
connected to a
local switch. In this specification, the term "local switch" is to be
interpreted to cover
both local switches and remote concentrators.
In a conventional access network, each terminating circuit is formed from a
pair of
copper wires. Typically, each pair of copper wires passes through a series of
nodes (or
network elements) between the local switch and terminal equipment. Examples of
such
nodes are primary cross-connect points, secondary cross-connect points,
distribution
points (DPs), cable nodes and joints.
Recently, optical fibres have been used to carry terminating circuits in
access
networks. In a modern access network, both pairs of copper wires and optical
fibres are
used to carry the terminating circuits. Where a terminating circuit is carried
by an
optical fibre, the circuit will typically pass through several node between
the local switch
and the terminal equipment. At each node, the incoming fibre from the local
switch is
split into a group of outgoing fibres which branch out in various directions.
Where a
terminating circuit is carried by an optical fibre from the local switch, the
last part of the
circuit may be carried by a pair of copper wire. Unfortunately, terminating
circuits are
prone to faults. In the case of a terminating circuit carried by a pair of
copper wires,
SUBSTITUTE SHEET (RULE 26)
CA 02429818 2003-05-22
WO 02/052821 PCT/GBO1/05555
2
example of such faults are disconnection, a short circuit between two wires of
a pair of
wires and a short circuit between one of the wires and earth. In the case of a
conventional access network formed from pairs of wires, the causes of the
faults
include ingress of water into a node and also physical damage to a node.
When a customer reports a fault, the terminating circuit may be tested so as
to identify
the cause of the fault. The fault can then be repaired. However, until the
fault is
repaired, the user suffers a loss of service.
It is known how to perform a set of circuit tests on each terminating circuit
in an access
network on a routine basis, for example nightly. Such routine tests can detect
a fault on
a terminating circuit. The fault can then be repaired, possibly before the
user of the
terminating circuit notices a loss of service. It is also known to measure the
operational
quality of individual nodes of an access network. Where the operational
quality of a
1~ node is poor, it is likely that faults will develop in terminating circuits
passing through
the node. However, although it is possible to measure the operational quality
of a node
current systems do not provide information to the network administrator to
indicate
what resources might be required when or if the faults) actually occur in
order to repair
them.
According to one aspect of the invention, there is provided a method of
operating a
fault management system for a communications network, said communications
network including a switch and an access network of one or more terminating
circuits
connecting said switch to terminal equipment provided for users of the
communications
network, the or each of said terminating circuits passing through one or more
nodes
between said switch and its respective terminal equipment, said method
comprising the
steps of:
performing a circuit test on the or each circuit of at least a subset of said
terminating circuits and to produce a test result for the or each circuit so
tested, the or
each test result comprising one or more elements of test data;
for the or each circuit identifying whether a fault exists on the circuit;
identifying circuits that have a possibility of becoming faulty within the
predetermined period;
associating a repair cost with each fault or potential fault; and
SUBSTITUTE SHEET (RULE 26)
CA 02429818 2003-05-22
WO 02/052821 PCT/GBO1/05555
3
for the or each circuit calculating a measure of the possible cost of repair
of the
circuit over a predetermined period.
By providing an indication of the relative cost of repair of a circuit or
network element,
the resources that are likely to be required to meet the repair can be put in
place.
Furthermore, proactive maintenance can be conducted in problem areas to avoid
the
faults identified. This facility also helps in the planning of maintenance of
the network.
According to another aspect of the invention, there is provided a fault
management
apparatus for a communications network including a switch and an access
network of
terminating circuits connecting said switch to terminal equipment provided for
users of
the communications network, each of said terminating circuits passing through
a series
of nodes between said switch and its respective terminal equipment, said fault
management apparatus comprising:
circuit testing apparatus arranged to perform circuit tests on said
terminating
circuits to produce test results;
a store containing data relating to said terminating circuits;
means for identifying in the or each circuit whether a fault exists on the
circuit;
means for identifying circuits that have a possibility of becoming faulty
within the
predetermined period;
means for associating a repair cost with each fault or potential fault; and
means operable, for the or each circuit to calculate a measure of the possible
cost of
repair of the circuit over a predetermined period.
This invention will now be described in more detail, by way of example, with
reference
to the accompanying drawings in which:
Figure 1 is a block diagram of an access network and an associated local
switch which
form part of a communications network in which the present invention may be
used;
Figure 2 is a block diagram showing the components of the communications
network
which are used to provide a fault management system embodying the invention
for the
access network of Figure 1;
Figure 3 is a circuit diagram illustrating some of the measurements which are
made
when testing a terminating circuit;
Figure 4 is a flow diagram illustrating the processing performed in the fault
management system in identifying faults in the network;
SUBSTITUTE SHEET (RULE 26)
CA 02429818 2003-05-22
WO 02/052821 PCT/GBO1/05555
4
Figures 5 to 10 are tables of data and parameters and data used in the
processing
illustrated in figure 4;
Figure 11 is a flow chart of the steps which are performed in the fault
management
system to obtain reference data on faults in the network;
Figures 12 to 18 are tables of data and parameters and data used in the
processing
illustrated in figure 11; and
Figure 19 is a graph showing data from the use of the present invention in a
communications system.
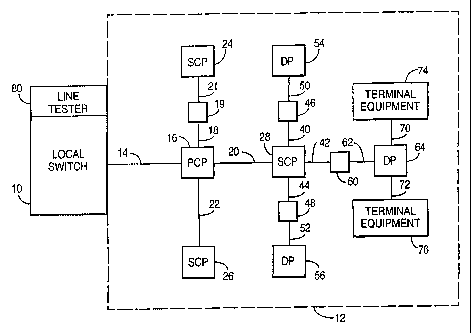
Referring now to Figure 1, there is shown a local switch 10 and a conventional
access
network 12 connected to the local switch 10. The local switch 10 and the
access
network 12 form part of a communications network. The local switch 10 is
connected to
the terminating circuits or lines of the access network 12. Typically, a local
switch is
connected to several thousand terminating circuits. Each terminating circuit
or line
passes through several nodes before reaching its respective terminal
equipment.
These nodes comprise primary cross-connect points, secondary cross-connect
points,
distribution points (DPs) and junctions and examples of these nodes will be
described
below.
In the conventional access network 12 shown in Figure 1, each terminating
circuit or
line is formed from a pair of copper wires. The copper wires leave the local
switch 10 in
the form of one or more cables. One of these cables is shown in Figure 1 and
indicated
by reference numeral 14. The far end of cable 14 from switch 10 is connected
to a
primary cross-connect point 16 which may be housed in a street cabinet or
underground junction box. From the primary cross-connect point 16, the
terminating
lines branch out as cables in several directions. For simplicity, in Figure 1
there are
shown only three cables 18, 20 and 22. The far end of cable 18 is connected to
a joint
19. The joint 19 is connected by cable 21 to a secondary cross-connect point
24. The
far ends of cables 20 and 22 are connected, respectively, to secondary cross-
connect
points 26 and 28. For reasons of simplicity, the continuations of the
terminating lines
beyond secondary cross-connect points 24 and 26 are not shown. The secondary
cross-connect points 24, 26 and 28 are housed in junction boxes which may be
located
above or below ground.
SUBSTITUTE SHEET (RULE 26)
CA 02429818 2003-05-22
WO 02/052821 PCT/GBO1/05555
From the secondary cross-connect point 28, the terminating lines branch out
again in
several directions in the form of cables. By way of illustration, Figure 1
shows cables
40, 42, and 44 leaving the secondary cross-connect point 28. Cables 40 and 44
are
connected, respectively, to joints 46 and 48. Joints 46 and 48 are connected,
5 respectively, to cables 50 and 52, the far ends of which are connected to
distribution
points 54 and 56. The far end of cable 42 is connected to a joint 60. The
joint 60 is
connected by cable 62 to a distribution point 64. For reasons of simplicity,
the
terminating lines beyond distribution points 54 and 56 are not shown.
Distribution points are implemented as junctions boxes which are typically
located on
telephone poles. From each distribution point, the terminating lines branch
out as
single copper wire pairs to where terminal equipment provided for a user of
the network
is located. By way of illustration, Figure 1 shows two single copper wire
pairs 70, 72,
leaving the distribution point 64. The far ends of copper wire pairs 70 and 72
are
connected, respectively, to terminal equipment 74, 76. As is well known,
terminal
equipment may take various forms. For example, terminal equipment may be a
telephone located in a telephone box, a telephone instrument located in a
domestic
house or an office, or a fax machine or a computer located in a customer's
premises. In
the example shown in Figure 1, each of the joints 19, 46, 48 and 60 is used to
connect
two cables together. Joints may also be used to connect two or more smaller
cables to
a larger cable.
In each terminating line, the two wires of each pair are designated as the A
wire and
the B wire. At the local switch 10, in order to supply current to the line, a
bias voltage of
50V is applied between the A wire and the B wire. As the bias voltage was
applied in
the early exchanges by using a battery, the bias voltage is still known as the
battery
voltage. In the terminal equipment, the A wire and B wire are connected by a
capacitor,
the presence of which may be detected when the terminal equipment is not in
use.
The terminating lines in the access network 10 are prone to faults. The main
causes of
these faults are ingress of water and physical damage to the nodes through
which the
terminating lines pass between the local switch 10 and terminal equipment.
There are
five main faults which occur due to causes arising in the nodes. These faults
are
disconnection, short circuit, faulty battery voltage, earthing fault and low
insulation
resistance. A disconnection arises where a terminating line is interrupted
between the
SUBSTITUTE SHEET (RULE 26)
CA 02429818 2003-05-22
WO 02/052821 PCT/GBO1/05555
6
local switch and the terminal equipment. A short circuit arises where the A
wire and B
wire of a line are connected together. A faulty battery voltage arises where
the A wire
or the B wire of a terminating line has a short circuit connection to the B
wire of another
line. An earthing fault arises when the A wire or B wire is connected to earth
or the A
wire of another line. Low insulation resistance arises where the resistance
between the
A wire and the B wire or between one of the wires and earth or between one of
the
wires and a wire of another line is below an acceptable value.
In order to detect faults in the terminating lines of the access network 12,
the local
switch 10 is provided with a line tester 80. The line tester 80 may be
operated from the
local switch 10 or, as will be explained in more detail below, from a remote
location.
The line tester 80 is capable of performing various tests, examples of which
will be
described below. Various models of line testers for local switches are
available
commercially. In the present example, the line tester 80 is either Teradyne
and
Vanderhoff test equipment. In some case both types of test equipments may be
used.
As well as producing resistance, capacitance and voltage measurement data for
line
these pieces of equipment also further data called Termination Statements such
as
"Bell Loop", "Master Jack Loop" and "Bridged". These termination statements
are
special line conditions which the equipment is arranged to detect.
Referring now to Figure 2, there is shown the local switch 10 and the
components of
the communications network which provide a fault management system for the
access
network 12. These components comprise the line tester 80, a customer service
system
100 for the communications network and an access network management system
102.
The line tester 80 comprises a test head 104 which contains the electronic
equipment
for physically making line tests and a controller 106 for the test head 104.
The
controller 106 takes the form of a computer. The controller 106 can be
operated from a
workstation 108 connected to it and provided at the local exchange 10. The
controller
106 is also connected to both the customer service system 100 and the access
network management system 102 and can be operated by workstations connected to
either the customer service system 100 or the access network management system
102.
The customer service system 100 is also a computer and it can be operated from
any
one of a number of workstations which are connected to it. In Figure 3, one
such
SUBSTITUTE SHEET (RULE 26)
CA 02429818 2003-05-22
WO 02/052821 PCT/GBO1/05555
7
workstation is shown and indicated by reference numeral 110. The customer
service
system 100 is used by operators of the communications network who have contact
with
the customers of the network. Together with these operators, the customer
service
system is responsible for providing various services to the customers.
The access network management system 102 is also a computer and it can be
operated from one of a number of workstations. One of these workstations is
shown in
Figure 3 and indicated by reference numeral 912. The access network management
system 102 is responsible for managing the access network 12 as well as a
number of
other access networks in the same general geographical area as the access
network
12. The access network management system manages various operations for each
of
the access networks which it manages. These operations include the provision
of new
equipment, logging data on work performed by engineers in the network,
maintaining
data on the terminating lines and nodes of each access network detection and
management of faults. The workstations which are connected to the access
network
management system 102 are also connected to the customer service system 100.
As
shown in Figure 3, the customer service system 100 and the access network
management system 102 are connected together.
The operations performed by the customer service system 100 and the access
network
management system 102 apart from the detection and management of faults in the
access network 12 do not form part of the present invention and will not be
described in
further detail.
Although in the present example the fault management system for the access
network
12 is formed from the line tester 80, the customer service system 100 and the
access
network management system 102, the fault management system could also be
provided simply by the line tester 80 on its own. In order to achieve this, it
would be
necessary to add appropriate software to the computer which forms the
controller 106.
In a small network, this might be an appropriate form of providing the fault
management system. However, in a large network it is advantageous to integrate
the
fault management system into the customer service system 100 and the access
network management system 102.
SUBSTITUTE SHEET (RULE 26)
CA 02429818 2003-05-22
WO 02/052821 PCT/GBO1/05555
The controller 106 is programmed to cause the test head 104 to make a series
of
routine tests each night on each terminating line of the access network 12.
These tests
will be explained with reference to the circuit diagram shown in Figure 3.
In order to test a line, it is disconnected from the switch 10 and connected
to the test
head 104 . Figure 3 shows a line 300 being tested. The line 300 has an A wire
302 and
a B wire 304. The end of line 300 remote from switch 10 is connected to
terminal
equipment 306. Each of the lines 302, 304 has a resistance which depends upon
its
diameter and the distance from the local switch to the terminal equipment 306.
Each of
the wires 302, 304 is coated with an insulating material. The function of the
insulating
material is to provide insulation between each wire and adjacent wires. Damage
to the
insulating material or oxidation of the metal of a wire can cause the
resistance .between
two adjacent wires to fall.
The effectiveness of the insulation between wires 302, 304 can be determined
by
measuring the resistance R1 between the A wire 302 and the B wire 304 and the
resistance R2 between the B wire 304 and the A wire 302. The resistances R1
and R2
may be different because of rectification as indicated by diodes D1 and D2.
For a
circuit in good condition, the resistances R1 and R2 are high, greater than 1
megaohm.
Damage to the insulating material or oxidation will cause the resistances R1,
R2 to fall
by an amount which depends upon the severity of the damage or oxidation. If
the
insulating material is totally destroyed so that the A and B wires are
physically touching
each other, the values of resistances R1, R2 will depend upon the distance
between
the test head 80 and the point of damage but will typically lie in the range 0
to 1500
ohms. Oxidation can result in wires effectively touching each other.
Only the A and B wires 302, 304 of the line 300 being tested are disconnected.
In the
other lines, the bias voltage of 50 volts is applied between the A wire and
the B wire. In
Figure 3, the A wires of the other lines are collectively shown by a wire 310
which is
connected at the switch 10 to earth. The B wires of the other lines are
collectively
shown by a wire 312 connected at the switch to a potential of -50 volts.
If the insulating material separating the A wire 302 or the B wire 304 from
one of the
adjacent A or B wires becomes damaged, or if one of the wires suffers
oxidation,
current may flow. The effectiveness of the insulation between the A and B
wires 302,
SUBSTITUTE SHEET (RULE 26)
CA 02429818 2003-05-22
WO 02/052821 PCT/GBO1/05555
9
304 and adjacent A and B wires can be determined by measuring the resistance
R3
between A wire 302 and adjacent A wires 310, the resistance R4 between the A
wire
302 and adjacent B wires 312, the resistance R5 between the B wire 304 and
adjacent
A wires 310, and the resistance R6 between the B wires 304 and adjacent B
wires 312.
For a good circuit, the resistance R3, R4, R5, R6 are high, greater than 1
megohm.
Damage to insulating material may cause one or more of the resistances R3, R4,
R5,
R6 to fall by an amount which depends upon the severity of the damage. If the
insulating material between the A wire 302 or the B wire 304 and an adjacent
wire is
totally destroyed so that the two wires are physically touching each other,
the
resistance between the two touching wires will depend upon the distance
between the
test head 80 and the point of damage but will typically lie in the range 0 to
1500 ohms.
Oxidation can also result in two wires effectively touching each other.
The A and B wires 302, 304 and the insulating material between them act as a
capacitor. In Figure 3, the capacitance between the A and B wires is shown as
having
a value C1. The value of the capacitance between the A and B wires of a line
will
depend upon the length of the line. A break in the line 300 will reduce the
value of
capacitance C1 as measured from the test head 80. Figure 3 also shows the
capacitance C2 between the A wire 302 and earth and the capacitance C3 between
the
B wire 304 and earth.
Each night, the controller 106 causes the test head 80 to measure the
resistances R1,
R2, R3, R4, R5, R6 and the capacitances C1, C2, C3 for each terminating line
of the
access network 12. The controller 106 also causes the test head 80 to check if
there is
terminal equipment connected to the end of the line. Terminal equipment has a
standard capacitance value. When terminal equipment is connected, the value of
its
capacitance is subtracted from the capacitance as measured by the test head to
obtain
the capacitance C1. For each terminating line, the results of the tests are
stored
against its directory number in the access network management system 102.
The controller 106 transmits the results of the tests to the access network
management
system 102. The access network management system 102 examines the results of
the
series of tests for each terminating line for the presence of a suspected
fault. The
possible faults include disconnection, short circuit, a fault battery voltage,
an earth fault
SUBSTITUTE SHEET (RULE 26)
CA 02429818 2003-05-22
WO 02/052821 PCT/GBO1/05555
and low insulation resistance. When a fault is suspected, the name of the
fault and the
results of the test for the line are stored in the access network management
system
102 against its directory number or an identifier in the exchange associated
with the
line. The details of the suspected faults found each night may be reviewed by
an
5 operator of the access network management system 102. Where appropriate, the
operator may give instructions for a fault to be repaired.
The network management system 102 is also arranged to carry out some further
processing of the data collected from the over-night testing. This further
processing is
10 designed to test potential faults rather than actual faults so that, where
appropriate,
remedial work can be carried out before the fault is detected by a customer.
These
tests use the resistance and capacitance measurements noted above to provide
an
indication of the probability of a given line becoming faulty within a given
time period.
The tests also give an indication of whether the fault is likely to be in the
part of the
network that is underground or the part of the network that is overhead.
Whether a fault
is underground or overhead has a significant effect on the cost of repair of
the fault and
therefore is an important factor in assessing which of a number of potential
faults
should be tackled first.
An overview of the processing carried out by the network management system 102
will
now be given with respect to figure 4 and a detailed example of the processing
will also
be given below. The processing is initiated at step 401 either automatically
in response
to the receipt of the appropriate data or by a human operator and processing
moves to
step 403. At step 403, using known methods (which will be described in detail
below),
the test data for all the lines in question is analysed to identify existing
faults. These are
termed "hard faults" and are divided in to two categories namely disconnection
faults
and rectified loop faults and have identifiable electrical characteristics
that allow them
to be recognised as such as noted above.
Once these hard faults have been identified the processing moves to step 405
at which
point the remaining test data is analysed further. This analysis involves
further
inspection of the test data to identify lines with characteristics that
indicate that a hard
fault is likely to occur within a predetermined period of time. The parameters
for
determining this are derived from historical data.
SUBSTITUTE SHEET (RULE 26)
CA 02429818 2003-05-22
WO 02/052821 PCT/GBO1/05555
11
At step 407, the data for the lines that have been identified as having
anticipated hard
faults are analysed further to assess the probability of the fault occurring
within a
specified period (which in the present embodiment is a year). As in step 405
above,
this analysis is carried out for each line on the basis of historical data and
results in a
score being attributed to each line being tested. Then at step 409 the data is
further
analysed to give an indication of the probability of the fault being in the
overhead (OH)
or in the underground (UG) part of the network, giving a score or probability
for the fault
occurring in each of those areas. Then at step 411 the UG and OH scores are
combined to provide a joint score that is used to judge whether the
anticipated fault is
most likely to be UG or OH.
Finally, at step 413, the scores for each line running though a network
element such as
a DP or cable node are added together to give a score for the element i.e. to
give a
probability of a hard fault occurring at the element within the next year. The
network
element can then be scored on the basis of it UG scores, its OH scores and/or
its
combined score. A group of network elements, for example those within a given
geographical area, can then be ranked to determine those elements most in need
of
preventative maintenance.
The invention will now be described further by way of a worked example showing
test
data from a set of lines running though a common DP being processed in the
manner
outlined above with reference to figure 4. Figure 5 shows the test data for
each of nine
lines that run through the DP. For each line the test data comprises four
capacitance
measurements between the A wire and earth, between the A wire and the B wire
(both
a current measurement and a prior measurement) and between the B wire and
earth.
The data also comprises a distance measurement for each line and a series of
resistance measurements between each combination of the A wire, B wire,
Battery and
Earth. These correspond to the capacitances C1, C2, C3 and resistances R1, R2,
R3,
R4, R5, R6 described above with reference to figure 3. In addition, there is a
previous
capacitance reading between the A and B wires and a termination flag (Term)
supplied
by the Vanderhoff and/or Terradyne equipment.
As noted above, the first step in the processing is the identification of hard
faults. This
is carried out by analysing the test data for each line in turn and
establishing whether
the test data falls within a set of parameters as set out in figure 6 below.
For each of
SUBSTITUTE SHEET (RULE 26)
CA 02429818 2003-05-22
WO 02/052821 PCT/GBO1/05555
12
the elements of test data in figure 5, figure 6 defines a threshold which if
the element
exceeds it, may indicate the presence of a disconnection hard fault for that
line. Each
element of test data for a line from figure 5 is compared, in accordance with
a rule
against the parameters of figure 6. The rule is as follows:
IF resistance A to Earth >= VD3
AND resistance B to Earth >= VD4
AND resistance A to Battery >= VD5
AND resistance B to Battery >= VD6
AND resistance A to B >= VD7
AND resistance A to B >= VD8
AND (((A - B Capacitance drop > VD1 from previous value) AND
(A - B Capacitance < VD2))
OR (Capacitance Balance > VD9)
OR (MIN( Capacitance A - Earth, Capacitance B - Earth) < VD10))
AND ((termination statement to "No termination" )
OR ( from Vanderhoff "Bell Loop")
OR ( from Vanderhoff "Master Jack-loop")
OR (from Teradyne "Bridged"))
THEN the circuit has a HARD FAULT.
Taking the data for line 1 shown in figure 5 above and using the parameters
from figure
6 above it can be seen that all of the resistance measurements exceed the
parameters
(i.e. all the resistance measurements of 700,000 Ohms exceed the threshold of
1 Mega
Ohm), that two of the three capacitance measurements fall within the given
range and
the Teradyne "bridged" flag is satisfied. As a result, each clause of the rule
is satisfied
indicating the presence of a disconnection hard fault on line 1.
The next step in the processing noted above is the analysis of the test data
to identify
any rectified loop hard faults. Figure 7 shows the parameters for the test
data that are
used in identifying rectified loop hard faults, again using a rule to apply
the parameters
to the data. The rule far rectified loop detection is as follows:
Where the B leg to A leg MIN = MIN ( B leg to A leg resistance, A leg to B leg
resistance) AND
SUBSTITUTE SHEET (RULE 26)
CA 02429818 2003-05-22
WO 02/052821 PCT/GBO1/05555
13
the B leg to A leg MAX = MAX ( B leg to A leg resistance, A leg to B leg
resistance)
Then IF B-leg to A-leg MIN <= TR1 Ohms
AN D B-Leg to A-Leg M I N > TR2
AND B-Leg to A-Leg MIN is NOT between TR4 and TR3
AND B-Leg to A-Leg MAX > TR5 x B-Leg to A-Leg MIN
AND ( resistance A to Battery <= TR7
OR resistance B to Battery <= TR8
OR resistance B to Earth <= TR9
OR resistance B to Earth <= TR10)
THEN the circuit has a Rectified Loop Hard Fault.
For each of the elements of test data in figure 5, figure 7 defines a
threshold which if
the element exceeds it, may indicate the presence of a rectified loop hard
fault for that
line. Each element of test data for a line from figure 5 is compared, in
accordance with
a formula (set out below) against the parameters of figure 7. Taking the data
for line 2
from figure 5 above and applying the rules it will be seen that each clause of
the rule is
satisfied i.e. the B to A leg minimum resistance is between 10 and 30k Ohms
and not in
the range of 700 to 5000 Ohms, the B to A leg maximum resistance is not more
that
twice the B to A leg minimum and at (east one of the A or B resistances to
earth or
battery are less that or equal to 400k Ohms. Accordingly, line 2 is considered
to have a
rectified loop hard fault.
Once the test data for all the lines has been analysed to identify the hard
faults, the
processing of the test data moves on to the next stage as noted above where
the data
is analysed further. The purpose of this further analysis is to identify those
lines which,
although they have not yet developed a hard fault, have characteristics that
suggest
they are likely to become faulty within a specified period. Again the data is
analysed in
accordance with a rule against a set of thresholds as set out in figure 8.
The rule for identifying anticipated hard faults checks each element of the
test data in
turn and establishes whether or not it falls within the two thresholds for
each element
defined in figure 8. The number of elements that fall within the thresholds is
counted
and if this exceeds a further threshold the line is considered to have an
anticipated
hard fault. The rule is as follows:
SUBSTITUTE SHEET (RULE 26)
CA 02429818 2003-05-22
WO 02/052821 PCT/GBO1/05555
14
FOR N = AHF 1 to AHF 19
IF Threshold1 (N) < Test-Read (N) < Threshold2 (N)
THEN Anticipated Hard Faults = Anticipated Hard Faults + 1 (Count)
END IFAHF 2 <= Anticipated Hard Faults
THEN the circuit has an Anticipated Hard Fault.
In addition to the resistance and capacitance measurements the test equipment
can is
also arranged to produce a set of voltage measurements. The comprise six DC
voltage
measurements between line A and a negative/positive earth, line B and a
negative/positive earth and between line A and line B when line B is negative
and when
it is positive. The voltage measurements also comprise three AC voltage
measurements between line A and line B and between each line and earth. These
voltage measurements can be used in the processing to identify anticipated
hard faults
and the detailed example will be described on this basis. However, the use of
the
voltage measurements is optional and the processing can be carried out without
them.
The voltage measurements for line 2 in the current example are shown in the
"Actual"
column of the table of figure 8. The voltage measurements for the other lines
are not
shown.
Taking the test data for line 2 from figure 5, it can be seen that the A to B
and B to A
resistance measurements are both within the limits specified as are the
voltage
measurements AHF 8, 9 and 12. As a result, five parameters contribute towards
and
overall score that exceeds the threshold parameter resulting in line 2 being
considered
to have an anticipated hard fault.
Now that line 2 has been designated as an anticipated hard fault i.e. is
expected to
show a hard fault within the specified time period of one year, the next stage
in the
processing is to determine the probability of that event occurring. In other
words, the
probability of the deterioration of the electrical characteristics of the line
continuing into
a range where the quality of the line is likely to be affected. Again, the
processing uses
a set of parameters as set out in figure 9 in combination with a pair of rules
which are
as follows:
Then the Probability of Failure for electrical characteristics are as follows
SUBSTITUTE SHEET (RULE 26)
CA 02429818 2003-05-22
WO 02/052821 PCT/GBO1/05555
FOR n = PB1 to PB19
A - IF Lower Limit (n) < Upper Limit (n)
AND Upper Limit (n) > Test Read (n) _> Lower Limit (n) THEN
Prob. of Failure (n) = Minimum( 1, upper. Limit. (n) - Test. Read. (n)) )
( Upper. Limit. (n) - Lower. Limit. (n))
ELSE Probability of Failure (n) = 0.0
B - IF Lower Limit.(n) > Upper Limit.(n)
AND Upper Limit (n) <= Test Read (n) < Lower Limit (n) THEN
10 (Test. Read (n) - Upper. Limit. (n) )
Prob. of Failure. (n) = Minimum(1, )
( Lower. Limit. (n) - Upper. Limit. (n))
ELSE Probability of Failure (n) = 0.0
IF none of the above satisfied default the probability of Failure = 0.0
15 The parameters in figure 9 comprise, for each element of the test data, a
set of limits
which the above rule uses to establish whether the particular element of test
data is
within the range where a hard fault will occur within a year. If the element
is outside this
range then the probability of failure assigned to it is zero. If the element
falls within the
range this indicates that there is a probability of a hard fault occurring
within a year. In
this case the above rule which is based on the relative differences between
the
element of test data and the upper and lower limits for that element as
defined in figure
9. In other words, since the upper limit is the level at which a hard fault is
likely in the a
years time and the lower limit is the level at which a hard fault is imminent
then the
probability is determined by how close the element of test data is to the
lower limit
relative to the upper limit.
The two rules above, rule A and Rule B, are used to carry out the same
calculation but
rule A is designed for use when the parameter range is positive while rule B
is
designed for use when the parameter range is negative. Which rule should be
used
when is indicated in the "Type" column of figure 9 as either type A or type B.
SUBSTITUTE SHEET (RULE 26)
CA 02429818 2003-05-22
WO 02/052821 PCT/GBO1/05555
16
Taking the first element of the test data for line 2 - PB1, the resistance
measurement
of 22700 Ohms falls within the upper and lower threshold values and results in
a
probability of 0.98. Similarly, PB6 - a resistance measurement of 351,656 Ohms
will
result in a probability of 0.64.
Once the probabilities have been calculated for each element of the test data
then the
next stage in the processing modifies each probability depending on whether
the
element would be expected to demonstrate a fault in the over-ground or
underground
part of the network. This is possible since certain electrical characteristics
can be
correlated with particular types of degradation of the cables which are
attributable to
the particular physical environment of the cable. The modification process is
carried out
by multiplying each probability by a weighting for underground (UG) and by a
weighting
for over-ground (0G) resulting in two revised probabilities for each data
element. All of
the UG probabilities are then added together and all of the OH probabilities
are added
together to give an OH score for the line and an UG score for the line. The
formulae for
calculating these scores are as follows:
OH Score =
(Probability of failure.(n) x OH.weighting.( n) )
For all tests (PB I to PB 19)
UG Score =
(Probability of failure. (n ) x UG. weighting. (n) )
For all tests(PBl to PB19)
Figure 10 shows these calculations for the test data from line 2 which provide
a UG
score of 38.85 and a OH score of 49.39. These scores result from the
application of the
UG and OH weighting factors to the probabilities for each element of test data
added
together in accordance with the rule above. From figure 10 it can be seen that
for the
resistance measurements one of the weighting factors is zero. This means that
the
element concerned gives no significant indication of a fault for that category
(OH or
UG) of fault and so its probability is weighted to zero. The level of
weighting applied is
dependent on empirical evidence i.e. on data of actual faults that have
occurred.
SUBSTITUTE SHEET (RULE 26)
CA 02429818 2003-05-22
WO 02/052821 PCT/GBO1/05555
17
The next stage in the processing determines, from the total UG and OH scores
for the
line, a combined score which is compared to a threshold value to give an
indication of
the most likely location for the anticipated hard fault i.e. whether the fault
will be in the
OH network or the UG network. The following rule is used to combine the OH and
UG
scores for a line.
ANGLE = ~G1 x OH.Score
(ANGl x (OH.Score)2) + (ANG2 x(UG.Score)2)
Then the following rule is used to compare the "angle" of the combined OH and-
UG
score against a threshold angle. If the combined score angle is greater than
the
threshold then the anticipated fault is expected to be Overhead and if it is
less than the
threshold angle then the fault is expected to be Underground. The rule for
determining
this is set out below.
If ANGLE > = Sine(ANG3)
THEN anticipated fault is located in the OVERHEAD NETWORK
If ANGLE < Sine(ANG3)
THEN anticipated fault is located in the UNDERGROUND NETWORK
(ANG1, ANG2 and ANG3 are variables with ANG1 and ANG2 being set in this
example
to the integer 1 and ANG3 to 45 degrees. These variable can be used to trim
the
performance of the above algorithm.)
Continuing the example from above, the OH score of 38.85 and the UG score of
49.39
are combined in accordance with the formula above to gives a combined score of
62.86. This is then used to calculate the Angle - which is 0.7867 i.e. greater
than Sine
(45) = 0.7071, indicating that the anticipated fault is expected to occur in
the overhead
network.
The processing of the test data continues until all the lines under
investigation have
been processed in the manner described above and either identified as hard
faults,
anticipated hard faults or as clear of faults. The lines that have anticipated
hard faults
can be ranked or ordered in terms of their overhead score, underground score
or
combined score. This then enables the proactive repair of the anticipated hard
faults to
be prioritised by those most likely to become hard faults soonest but also by
the
location of the fault. The location of a fault is important knowledge to have
in
SUBSTITUTE SHEET (RULE 26)
CA 02429818 2003-05-22
WO 02/052821 PCT/GBO1/05555
18
scheduling repair since the skills of the repairers and the cost of the repair
are normally
very different for a underground and overhead faults.
As noted above, the lines in the network run through interconnection points
such as
DPs or cable nodes. Commonly, it is at these points where faults occur since
these are
the places where the cables is physically joined to each other and therefore
the most
likely place for connections or insulations to break down and cause faults.
Therefore, if
the test data for all the lines running through a given DP or other network
element is
processed as described above it can then be combined to give a score for the
network
element. The UG, OH and combined scores for each line running through the
network
element are added together to give a score for the element as a whole.
Having scores for the elements themselves give further advantages when
carrying out
or planning proactive network maintenance. For example all DPs can be ranked
by
their OH score or their UG score which enables the proper identification of
the required
skill set of the engineers who will repair a given fault. Furthermore, scores
(UG, OH
and Combined) can be used in deciding which of a number of elements with hard
faults
should be repaired first. For example, two DPs each having two hard faults but
one
also having a much higher UG, OH or combined score thereby enabling the DP
most
likely to show further hard faults in the near future to be repaired more
urgently.
The network management system 102 can be further arranged to process the data
collected from the overnight testing to provide results that give an
indication of the likely
future costs of repair to the network over a predefined period of time. This
processing
takes in to account both the hard faults that have been recognised as well as
the
anticipated hard faults. An overview of this processing will now be given with
reference
to figure 11 and a more detailed example will also be given below. The
processing is
initiated at step 1101 either automatically in response to the receipt of the
appropriate
data or by a human operator and the processing moves to step 1103. At step
1103,
hard faults are identified and categorised (as disconnections or rectified
loops) in the
same manner as described above with reference to step 403 of figure 4 and the
anticipated hard faults are identified in the same manner as step 405. Also,
the
probability of failure for each parameter of the test data is calculated in
accordance with
the steps described above with reference to step 407 of figure 4.
SUBSTITUTE SHEET (RULE 26)
CA 02429818 2003-05-22
WO 02/052821 PCT/GBO1/05555
19
At step 1105, each probability is weighted depending on its importance in
calculating
the final score for the line that it relates to and then the probabilities for
each element
(as weighted) are added together with some further factors to give a score for
the line
as a whole know as the AFS score. This score is weighted further depending on
whether or not the line has also been identified as having a hard fault and/or
an
anticipated fault in step 1103. Steps 1103 and 1105 are carried out for each
line for
which test data has been collected. In the next step 1107 if data for one or
more of the
lines is missing a smoothing algorithm is applied which has the effect of
compensating
for the missing data so that the results of the processing are not skewed.
Next, at step 1109, the UG, OH and combined probabilities are calculated for
each line
of the network element for which there is data present in the same manner as
steps
409 and 411 of figure 4 above. A determination of whether the anticipated
fault is UG
or OH is also calculated as in step 411 above. Next, in step 1113, the
accumulated
data is combined in accordance with three separate formulae to give and
overall score
for the DP. These three formulae take in to account the relative costs of
repairing
particular types of faults and as a result, the AFS scores can be used to
estimate or
predict the costs of maintaining the network elements for the predetermined
period. At
step 1115, the UG, OH and combined scores are used to rank the current DP
against
the equivalent scores for other DPs and network elements. The ranking of the
network
elements by relative cost assists the network administrator when budgeting
since the
costs of repairs over the coming year can be estimated. The ranked data also
highlights points in the network where the preventative maintenance effort
should be
directed.
The invention will now be described by way of a worked example showing the
test data
from a set of lines running through a DP being processed in the manner
outlined above
with reference to figure 11. The same test data example from figure 5 will be
used as
was used to describe the processing in relation to figure 4. The first step in
the
processing is to identify the hard faults, anticipated hard faults and their
probabilities in
the same manner as was described above with reference to steps 403, 405 and
407 of
figure 4. Then, as set out in figure 12, the probabilities are multiplied by a
weighting
factor which effectively selects the resistance measurements AFS1-6 for
subsequent
processing. The resulting probabilities are then summed in accordance with the
formula below:
SUBSTITUTE SHEET (RULE 26)
CA 02429818 2003-05-22
WO 02/052821 PCT/GBO1/05555
Probability of failure (n) x AFS. Weighting(n)
For all tests (AFSI to AFS19)
AFS.Score = { + AFS20 (IF Hard Fault Circuit) }
+ AFS21 (IF Anticipated Hard Fault Circuit)
As can be seen from the above formula, that in addition to the summed
probabilities for
5 each element of the data, two further weightings are added. The first
weighting is
added if the line was identified in step 1103 as having a hard fault and the
second is
added if in step 1103 the line was also identified as an anticipated hard
fault. The AFS
score is then compared to a table of values shown in figure 13 to give an AFS
value
which corresponds to the number of faults that would be avoided on that line
if it were
10 to be repaired immediately. The AFS score is calculated for each of the
lines under
investigation. Taking the example of line 2, from figure 12 it can be seen
that the sum
of the weighted probabilities is 4.51 which is then has a hard fault weight of
5 and an
anticipated fault weight of 3 added to it giving a total of 12.51. This AFS
score is
compared to the table of figure 13 in accordance with the following rule and
in results in
15 the actual AFS value of 1.
For n = SC1 to SC12 (see the table of figure 13)
IF Lower Interval.(n) <= AFS Score < Upper Interval.(n)
THEN Actual AFS = Circuit AFS.
20 ELSE AFS = 0.
When the AFS score has been calculated for each line under investigation, the
next
stage in the processing is the application of a smoothing algorithm to
compensate for
situations where test data can not be obtained for one or more of the lines.
In the
current example using the data from figure 5, all the data for the DP is
present. If
however, data for lines 3 and 7 were missing then the smoothing algorithm
would be
applied. The smoothing algorithm is designed so that AFS scores for DPs where
data
is missing can be meaningfully compared with those of other DPs. The smoothing
algorithm is as follows:
(No. of unique circuits DN / Line No combinations that make up a DP)
SMV.DP = Min(1+SMV1, )
(No. unique DN / Line No. combinations that were tested on a DP)
SUBSTITUTE SHEET (RULE 26)
CA 02429818 2003-05-22
WO 02/052821 PCT/GBO1/05555
21
The above rule takes the minimum value from either the smoothing parameter
plus 1 or
the ratio of total lines under investigation and those for which test data has
actually
been obtained. The smoothing parameter is set as 0.6 and is provided so that
the
upper limit of the smoothing parameter can be adjusted. Continuing with the
example, if
test data for only seven out of nine possible lines is available then the
smoothing factor
will be calculated as the minimum of 1.6 (1 = 0.6) and 1.28 (7/9) which is
1.28. This
smoothing factor would then used in the subsequent calculation for AFS scores
for
network elements e.g. DPs or cable nodes.
Figure 14 shows the results of the processing of the data of figure 5 in
accordance with
the steps described so far. From the inspection of these results it can be
seen that lines
one and six to nine are clear of faults. Line two as described above has been
categorised as both a hard fault and an anticipated hard fault in the overhead
network.
Line two has also achieved an AFS score of one. Lines three to five all have
some
characteristics that indicate possible faults but none of them hard faults and
none of
them significant enough to be considered as an anticipated hard fault.
However, the
indications are significant enough to be able to show that when such a fault
does occur
it would be in the underground network. The fact that there is still potential
for a fault to
occur is also reflected in the AFS scores for each of these lines which show
AFS
scores of 0.3, 0.3 and 0.4 respectively. In other words, there are no actual
faults
identified on these lines and they are not expected to become faulty within a
year but
nevertheless there is still some chance of a fault within that year.
The scores for each line are summarised in the lower half of the table of
figure 14
which gives the total OH, UG and combination scores for the DP and totals of
hard
faults and anticipated hard faults for the underground network. In addition
there are
totals for the number of possible faults and AFS score totals again split
between those
indicated in the underground network and those indicated in the overhead
network.
The next step in the processing is to use the data from the table in figure 14
to
calculate the scores (UG, OH and combined) for the DP as a whole. This is done
in
accordance to three formulae. The formula for calculating the overhead score
for the
DP is shown in figure 15. For each line of data that has been designated as
being a
potential or actual fault in the overhead network the formula adds together
the total OH
score, the total number of anticipated hard faults, the total number of hard
faults and
SUBSTITUTE SHEET (RULE 26)
CA 02429818 2003-05-22
WO 02/052821 PCT/GBO1/05555
22
the total number of circuits. From this is subtracted the difference between
the total
number of circuits in the DP and the number of circuits that are OH. Each of
these
elements of data are also multiplied by the smoothing factor (which in the
present
example is one since there is data present for each line running through the
DP). Each
S element is also multiplied by a ranking value as set out in the table in the
lower half of
figure 15. The ranking value is used to modify the effect that any one of the
five values
that are summed above have on the overall OH score for the DP. The result of
these
calculations as set out in figure 15 is a total OH score for the DP of 181.04.
Figures 16 and 17 show the equivalent formulae and ranking parameters for the
calculation of the UG score for the DP and for the combined score for the DP.
The
difference in the UG formulae is the where the OH formula takes the OH scores
and
the OH circuits the UG formula takes the UG scores and the UG circuits. The
combined
score formula takes the combined score for all the circuits in the DP, all of
the hard,
anticipated hard faults and suspect circuits.
The results of the processing in accordance with the three formulae of figure
15 to 17 is
a UG score of 181.04, a OH score of 209.10 and a combined score of 261.10 for
the
DP. As will be understood by those skilled in the art, the formulae set out in
figure 15,
16 & 17 can be modified to provide scores for other network elements which may
have
more lines running though them such as a cable node which may have 100 lines
running through it.
The final step in the processing for the data is to calculate the annual fault
saving
(AFS) score for the DP as a whole (as opposed to a single circuit as described
above).
The formula which is used for this is set out in figure 18. For the UG AFS the
AFS for
each circuit in the DP is added up which in the example gives a UG AFS for the
DP of
1.0 (from lines 3, 4 & 5 i.e. 0.3 + 0.3 + 0.4). The OH AFS for the DP is 1.0
also (from
line 2's AFS). The combined AFS score comes to 2Ø
The AFS score as described above can be established either for a single line
(or
circuit) or for a network element such as a DP or cable node. The AFS score
combines
the probability of a fault occurring within the given time period with the
cost of repair of
the fault should it occur. Furthermore, the cost of repair takes in to account
whether the
fault is expected to be in the underground or in the overhead network. The AFS
allows
SUBSTITUTE SHEET (RULE 26)
CA 02429818 2003-05-22
WO 02/052821 PCT/GBO1/05555
23
the network administrator to rank the test data from the network on a line by
line basis
or on the basis of network elements. Where the ranking is performed on the
basis of
network elements the AFS score is calculated such that elements can be
meaningfully
compared even when data is missing and/or when the elements being compared
have
different numbers of lines running through them. Since the AFS score has a UG
and
OH element as well as a combined element, the AFS score can be used to rank
the
test data either from the perspective of the underground network or the over-
ground
network (as well as overall). All of these features enable the test data to be
more easily
analysed and processed by the network administrators and assists in lowering
network
maintenance costs and increasing efficiency.
The parameters described above with reference to figures 6 to 10, 12, 13 and
15 to 17
are all dependent on characteristics of the network which is being tested and
monitored. The parameters can be modified to adjust the processing of the test
data so
that the results more accurately measure the network performance. Most of the
threshold values can be obtained from analysis of historical electrical
characteristics in
combination with fault histories or logs. These can be used to establish
initial values for
the threshold which can then be compared to the subsequent performance of the
network and adjusted as necessary.
Figure 19 shows the results of some experimental work in the nodes in an
access
network forming part of a communications network. The node score was evaluated
for
a large number of nodes. Each node was then monitored for a fault report from
a
customer during the subsequent 3 months. In Figure 11, for these nodes, the
node
score is plotted against fault reports received during the three months after
evaluating
the node score. These experimental results show a strong correlation believed
node
score and number of fault reports.
Although the present invention has been described with reference to an access
network in which each circuit is carried by a piece of copper wire, it may
also be used
for terminating circuits carried by optical fibres.
1t will be understood by those skilled in the art that the apparatus that
embodies the
invention could be a general purpose computer having software arranged to
provide
the analysis and/or processing of the test data. The computer could be a
single
SUBSTITUTE SHEET (RULE 26)
CA 02429818 2003-05-22
WO 02/052821 PCT/GBO1/05555
24
computer or a group of computers and the software could be a single program or
a set
of programs. Furthermore, any or all of the software used to implement the
invention
can be contained on various transmission and/or storage mediums such as a
floppy
disc, CD-ROM, or magnetic tape so that the program can be loaded onto one or
more
general purpose computers or could be downloaded over a computer network using
a
suitable transmission medium.
Unless the context clearly requires otherwise, throughout the description and
the
claims, the words "comprise", "comprising" and the like are to be construed in
an
inclusive as opposed to an exclusive or exhaustive sense; that is to say, in
the sense of
"including, but not limited to".
SUBSTITUTE SHEET (RULE 26)