Note: Descriptions are shown in the official language in which they were submitted.
CA 02431138 2003-06-04
Specification
FUSION SPLICING APPA.RATUS AND FUSION SPLICING METHOD
<Field of the Invention>
The present invention relates to an apparatus and method
for fusion splicing end portions of optical fibers for
communication by discharge heating and the like, and more
particularly to an apparatus and method for fusion splicing
the optical fibers under fusion splicing conditions suitable
for types of optical fibers by automatically determining the
types of optical fibers.
<Background of the Invention>
Along with the expansion and diversification of the
optical fiber communications in recent years, various types
of optical fibers adapted for respective uses have been developed
and utilized.Varioustypes of optical f ibers, including a single
mode optical fiber (hereinafter referred to as an SM fiber),
a multi-mode optical fiber (hereinafter referred to as an MM
fiber), a dispersion shifted optical fiber (hereinafter
referred to as a DS fiber) , and an erbium doped optical fiber
(hereinafter referred to as an ED fiber), are provided. When
these optical fibers are fusion spliced by a fusion splicing
machine, it is required to make splicing under the fusion
1
CA 02431138 2003-06-04
splicing conditions (discharge current, discharge time, etc.)
suitable for eachoptical fiber. However, the type of the optical
fiber may be mistaken, in which there is the risk that a splicing
failure occurs due to unsuitable fusion splicing conditions
for the optical fibers.
The fusion splicing of the optical fibers is not
necessarily conducted under the light working environment, but
may be conducted under the dark environment within a manhole,
for example. In this case, the coating material of the optical
fiber may be colored to identify the type of optical fiber,
but recognized by mistake. If image observing means of high
resolution and high magnification is employed for an image
monitor of the fusion splicing machine, a core portion as minute
as 3 to l01im can be observed, but the optical fibers of similar
profiles may be recognized by mistake.
If the optical fibers are not spliced under the fusion
splicing conditions suitable for the type of optical fiber,
a splicing loss is greater, whereby the splicing of optical
fibers must be made again from the beginning. To make splicing
again, a series of operations, including the removal of a falsely
spliced portion, the removal of the coatings for the end portion
of optical fiber and cutting the end portion must be performed
from the beginning, resulting in a worse working efficiency,
and the operator becomes nervous.
One of the conventional techniques to solve the above
2
CA 02431138 2003-06-04
problem is well-known in which the optical fibers are spliced
under the optimal fusion splicing conditions by identifying
the type of opticalfiber through image processing, as disclosed
in JP-A-8-21923. This conventional technique involves
identifying the brightness level profile of the optical fiber
observed at the fusion spliced portion through image processing.
Then the brightness level profile (hereinafter referred to as
a brightness profile) for each of various types of optical fiber
is previously stored. Thereafter, the type of optical fiber
is designatedby collation with the brightness profile of optical
fiber tobe fusion spliced. The optical fibers are fusion spliced
by designating the type of optical fiber and selecting the
optimal fusion splicing conditions fromamong the stored fusion
splicing conditions for each type of optical fiber.
However, when the type of optical fiber is estimated by
obtaining the brightness profile from an observed image of the
optical fiber, there are various intricate factors such that
the brightness profile may be varied or different between the
same type of optical fibers, depending on the focus or optical
characteristics of the observed image, and the manufacturing
conditions of the optical fiber. The conventional technique
shows an example of a fusion splicing machine for ribbonized
optical fiber, in which image observing means, typically with
a low magnification and a long depth of focus, has a small
numerical aperture of 0.1 or less. Hence, the resolution can
3
CA 02431138 2003-06-04
not besufficiently obtained, whereby it is difficult to acquire
the detailed information from the brightness profile.
Even if image observing means with high magnification
and high resolution is employed for image observation, a DS
fiber and an ED fiber, for example, have both a core diameter
of4 m, with quite similar brightness profiles, and practically
is difficult to discriminate from the comparison between the
brightness profiles. In the conventional technique, the
comparison between the brightness profiles is made employing
the interval between displaced points near the center of fiber
axis. Accordingly, although this technique is effective when
the brightness profile is clearly different depending on the
type of optical fiber, it is difficult to discriminate all the
types of optical fiber.
The present invention has been achieved in the light of
the above-mentioned circumstance, and it is an object of the
invention to provide an apparatus and method for fusion splicing
the optical f ibers under thefusion splicing conditions suitable
for respective optical fibers in which the types of optical
fibers can be fully discriminated.
<Summary of the Invention>
The present invention provides a fusion splicing
apparatus for fusion splicing end portions of optical fibers
by butt discharging, characterized by comprising an image
4
CA 02431138 2003-06-04
observing mechanismfor observing the end portions of the optical
fibers, an image processing section for measuring parameter
data of a brightness distribution waveform of optical fiber
in cross section fromapickedup image, a fuzzyoperation section
for obtaining a degree of attribution for the measured parameter
data from a fuzzy operation data registered in advance in a
data registering section and identifying the type of optical
fiber through a fuzzy operation, a collating section for
collating the identified type of optical fiber with fusion
splicing conditions for each type of optical fiber registered
in advance in a fusion splicing condition registering section,
a display unit for displaying a collation result, a fusion
splicing mechanism, and a control section.
Also, this invention provides a fusion splicing method
for fusion splicing end portions of optical fibers by butt
discharging, characterized by including observing the end
portions of the optical fibers in an image observing mechanism,
measuring parameter data of a brightness distribution waveform
of optical fiber in cross section from a picked up.image in
an image processing section, obtaining a degree of attribution
for the measured parameter data from fuzzy operation data
registered in advance and identifying the type of optical fiber
through a fuzzy operation in a fuzzy operation section, collating
the identified type of optical fiber with fusion splicing
conditions for each type of optical fiber registered in advance
CA 02431138 2003-06-04
in a collating section, displaying the collation result, and
fusion splicing the optical fibers in a fusion splicing
mechanism.
<Brief Description of the Drawings>
Fig. 1 is a block diagram for explaining an embodiment
of the present invention.
Fig. 2 is a view showing a picked up image.
Fig. 3 is a graph for explaining a brightness distribution
waveform.
Fig. 4 is a graph for explaining a differential waveform
of the brightness distribution waveform.
Fig. 5 is a graph for explaining a membership function.
Fig. 6 is a graph for showing a specific example of the
membership function.
Fig. 7 is a graph for explaining a deviation of the
brightness distribution waveform.
Fig. 8 is a view displaying the result of discriminating
the type of optical fiber.
Fig. 9 is a flowchart showing the embodiment of the
invention.
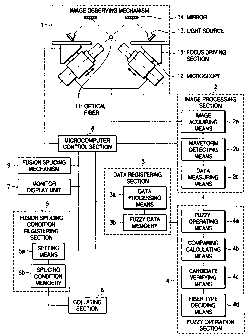
In these drawings, reference numeral 1 denotes an image
observing mechanism, 2 denotes an image processing section,
3 denotes a data registering section, 4 denotes a fuzzy operation
section, 5 denotes a fusion splicing condition registering
6
CA 02431138 2003-06-04
section, 6 denotes a collating section, 7 denotes a monitor
display unit, 8 denotes a control section, 9 denotes a fusion
splicing mechanism, 11 denotes an optical fiber, 12 denotes
a microscope, 13 denotes a light source, 14 denotes a mirror,
and 15 denotes a focus driving section.
<Best Mode for Carrying Out the Invention>
Fig. 1 is a block diagram for explaining an embodiment
of the present invention. In Fig. 1, reference numeral 1 denotes
an image observing mechanism, 2 denotes an image processing
section, 3 denotes a data registering section, 4 denotes a fuzzy
operation section, 5 denotes a fusion splicing condition
registering section, 6 denotes a collating section, 7 denotes
a monitor display unit, 8 denotes a control section, 9 denotes
a fusion splicing mechanism, 11 denotes an optical fiber, 12
denotes a microscope, 13 denotes a light source, 14 denotes
a mirror, and 15 denotes a focus driving section.
The image observing mechanism 1 picks up an image of a
pair of optical fibers 11 butted and held by the fusion splicing
mechanism (not described in detail and not shown) from two
directions using the microscopes 12 with the CCD cameras disposed
orthogonal to each other. The light source 13 for illumination
to pick up the image is disposed to illuminate the optical fiber
11 via the mirror 14 from the background side. The microscope
12 of high magnification and high resolution has the focus
7
CA 02431138 2003-06-04
driving section 15 for adjusting the focal point, which is
controlled by the control section 8 with a microprocessor.
An optical fiber image observed by the microscope 12 is
measured to acquire the predetermined data of optical fiber
from the brightness distribution waveform in the image
processing section 2. For the measured data, a degree of
attribution is calculated by referring to the data of a fuzzy
data memory registered in advance in the data registering section
3 in the fuzzy operation section 4. The degree of attribution
for each of a plurality of types of optical fiber is compared
and calculated to select a candidate for the type of optical
fiber, verify the validity of the candidate and decide the type
of optical fiber.
If the type of optical fiber is decided, the collating
section 6 collates the type of optical fiber and the fusion
splicing conditions of that type registered in advance in the
fusion splicing condition registering section 5. If the fusion
splicing conditions are matched with the set conditions, the
optical fibers are spliced under the set fusion splicing
conditions using the fusion splicing mechanism 9. If the fusion
splicing conditions are unmatched with the set conditions, an
instruction for retry or splicing is made. The collation result
of the collating section 6 is displayed on the monitor display
unit 7. The execution of fusion splicing is made under the
registered fusion splicing conditions by controlling the fusion
8
CA 02431138 2003-06-04
splicing mechanism 9 in the control section 8 with the
microprocessor. The details of each section will be described
below.
First of all, the image processing section 2 comprises
image acquisition means 2a for acquiring the optical fiber image
picked up by the image observing mechanism 1, waveform detecting
means 2b for detecting the image as a brightness distribution
waveform (hereinafter referred to as a brightness profile),
and data measuring means 2c for measuring the data from the
brightness profile.
Fig. 2 is a view showing an image pick-up screen of the
optical fibers to be acquired by the image acquisition means
2a. In Fig. 2, the ends of a pair of optical fibers to be fusion
spliced are butted before being fusion spliced. Light passing
through the optical fiber is condensed because the optical fiber
serves as a rod lens, and has a brightness distribution where
light is centrally condensed. Therefore, the transmitting light
is condensed in the dark portion as a shadow against the
background light brightness.
On the image pick-up screen, a strip image is displayed,
consisting of a bright portion 21 of the transmitting light
appearing horizontally in the central section and a dark portion
22 as a shadow appearing on both the upper and lower sides of
the bright portion 21. A brighter portion 23 appears in the
center of the bright portion due to a core portion having a
9
CA 02431138 2003-06-04
different refractive index. This picked up image is extracted
along a sampling line 24 and arithmetically operated to obtain
the brightness profile. The sampling is made at several points
(four to five points), whereby the average value data is
obtained.
Fig. 3 is a graph showing the brightness profile of the
optical fiber in cross section for the image of Fig. 2, in which
the brightness of the optical fiber is indicated along the
longitudinal axis and the position in diameter direction is
indicated along the transverse axis. This brightness profile
consists of a bright portion 25 in the central section, a dark
portion 26 on both sides thereof, and a bright portion indicating
the background brightness in its outside. The bright portion
25 in the central section has a projecting crest 27 in the center,
and crests 28 on the left and right sides thereof. The number
of crests, its interval and the height of crest may be different
depending on the type of optical fiber. The central crest 27
indicates the core portion, and is relatively easily identified
to be located almost in the center of the optical fiber. A trough
30 is also easily recognized on both sides of the central crest
27.
Differentiating the brightness profile of Fig. 3, a
differential value waveform is obtained as shown in Fig. 4.
The position and number where the differential value is equal
to zero are different depending on the number of crests, but
CA 02431138 2003-06-04
a vertex position 29 of the crest 27 for the core portion is
easy to obtain. The distance between the maximum differential
values across the vertex position 29 as the center where the
differential value is zero is defined as a core diameter A,
and the distance between the differential values of zero on
both sides of the vertex position 29 is defined as a core diameter
B. As shown in Fig. 3, the core diameter A indicates a variable
density boundary distance (width) at the middle abdomen of the
crest 27 in the core portion, and the core diameter B indicates
a distance between the troughs 30. Also, the number of crests
is equal to the number of peaks in the angular waveform, and
a brightness difference (or a core height) between the vertex
position 29 of the crest 27 and the trough 30 in the core portion
is measured and acquired as the data. Besides, the height of
crest 27 may be represented by the brightness level from the
dark portion 26, but not from the trough 30, or the contrast
may be obtained as the data.
Usually, the SM fiber has a waveform of three crests as
shown in Fig. 3, in which a central crest indicates the core
portion. Each of the DS fiber and the ED fiber has actually
a small core diameter and a large difference in refractive index
between the core and the cladding, whereby the central crest
27 for the core portion is slender and higher. Further, since
the refractive index distribution is convex, the light
condensing is so complex that the bottom of the crest is spread
11
CA 02431138 2003-06-04
or the number of crests is increased. On the other hand, the
MM fiber (GI type) has a refractive index that graduallychanges,
with the height of crest tending to decrease conspicuously.
In this manner, the brightness profile of optical fiber
is different depending on the type of optical fiber, andmeasured
by the data measuring means 2c. The degree of attribution is
substituted for the data measured from the brightness profile
by the fuzzy operation section 4. The type of optical fiber
is identif ied f rom the degree of attribution obtained. In making
a fuzzy operating process, it is required to prepare for the
membership f unction. Turning back to Fig.1,the data registering
section 3 will be described below.
The data registering section 3 stores in advance the data
for discriminating the types of optical fibers to be fusion
spliced. The data registering section 3 includes data processing
means 3a and a fuzzy data memory 3b. The data processing means
3a createsthe membershipfunction data by calculating an average
value and a standard deviation value from the data measured
by the image processing section. Also, it acquires the newly
measured data as the additional data and updates the data. The
fuzzy data memory 3b accumulates the optical fiber type data
subjected to the fuzzy operation by the data processing means
and is used for calculating the degree of attribution for the
optical fiber that is newly measured.
Fig. 5 is a typical example of the membership function
12
CA 02431138 2003-06-04
useful in the fuzzy operation of the invention, in which the
membership function is a convex type. This function represents
the fuzziness of data in the distribution width, and has a
probability that the degree of attribution is one at the central
value. However, other forms or the general fuzzy theory may
be employed, so long as the distribution of data is represented
bythe function. Themembership function of Fig. 5 is represented
by a triangle with a vertex at the central value and the
distribution width as the bottom side, in which the degree of
attribution is taken along the longitudinal axis, and the
parameter data along the transverse axis. The central value
is an average value of data and the distribution width is a
standard deviation value. By making the distribution width
several times (e.g., five times on one side) the standard
deviation value, the membership function is so reasonable that
measurement values are not deviated from the average value and
do not become zero over the broad range.
Fig. 6 shows the examples of the membership function from
the actual measurement data. Fig. 6(A) is a membership function
with the core diameter A, Fig. 6(B) is a membership function
with the core diameter B, Fig. 6(C) is a membership function
with the core height, and Fig. 6(D) is a membership function
with the number of crests. As will be seen from these figures,
in the core diameter B (distance between the troughs 30 in Fig.
3), there is no vivid di f f erence between the SM f iber and the
13
CA 02431138 2003-06-04
MM fiber, and in the core diameter A, there is also no apparent
difference between the DS fiber (DS1 indicates an ordinary
dispersion shift optical fiber and DS2 indicates a dispersion
shift optical fiber of core expansion type) and the ED fiber,
when the standard deviation is included. In creating the
membership function, the application range may be misjudged
to be narrow.
Fig. 7 is a graph showing the variation of the brightness
profile when the focus positions (three positions) of the SM
fiber are changed. As shown in Fig. 7, the brightness profile
is varied by changing the focus position for picking up the
image even with the exactly same optical fiber. Accordingly,
it is necessary to extend the distribution width of the
membership function by intentionally dispersing the profile,
including the values measured at the positions before and after
the focus set-up position, to increase the adaptability.
The membership function is necessary to be created in
advance from the known data or by the data registration. However,
when the fusion splicing is made by newly discriminating the
type of optical fiber, it is possible that the measured data
for discrimination is newly added to the already existing
membership function. Also, the types of optical fiber can be
further distinguished by adding the new fiber as defined by
the usersuccessively and learning it. By the successive addition
of data, the amount of database for discrimination can be
increased, and the type of optical fiber can be identified more
14
CA 02431138 2003-06-04
minutely and precisely.
The additional data can be managed in accordance with
the following expression,
AVn+1 =( n=AVn + Dn+1) /( n+ 1) (1)
6n+i2 = [(n-1) -6"2+n=AVn2+Dn+12- (n+l ) =AVn+i2l /n (2)
where n is the number of data, AVn is an average value, 6n is
a standard deviation value, and Dn+l is the addition data.
Herein, if the number n, the average value and the standard
deviation value are already known, the optimization can be
performed due to the addition of data. Since the weight in adding
the data is changed by changing the number n, the extent of
adaptability or the learning speed (number of additions) can
be set up.
Turning back to Fig. 1, the fuzzy operation section 4
for discriminating the type of optical fiber will be described
below. The fuzzy operation section 4 includes fuzzy operating
means 4a, comparing calculating means 4b, candidate verifying
means 4c and fiber type deciding means 4d. The fuzzy operating
means 4a substitutes the degree of attribution for the data
measured by the image processing section 2. The substitution
of the degree of attribution is made for the measured data as
the type of optical fiber from the membership function of Fig.
6 stored in the fuzzy data memory 3b.
Table 1 lists an instance of calculating the degree of
attribution. The numerical values of Table 1 are only exemplary
CA 02431138 2003-06-04
for explanation, but differ from the actual values.
Table 1
Type Number of Core Core height Minimum
crests diameter B (60)
(3) (9Wn)
SM 0.8 0.5 0.8 0.5
MM 0.9 0.8 0.3 0.3
DS1 0.9 0.8 0.9 0.8
ED 0.5 0 0.8 0
Maximum 0.8
The calculation of Table 1 will be described below.
Assuming that the number of measured crests for the bright
portion is three, it will be found from the membership function
of Fig. 6D that the SM fiber, the MM fiber, the DS1 fiber and
the ED fiber have the degrees of attribution of 0.8, 0.9, 0.9
and 0.5, respectively. Similarly, assuming that the core
diameter B is 9 m, and the core height is 60 steps, those optical
fibers have the degrees of attribution for the type of optical
fiber as listed in Table 1, which are calculated from the
membership function for each parameter of Fig. 6.
The numerical values calculated by the fuzzy operating
means 4a are employed by the comparing calculating means 4b
to select a candidate for the type of optical fiber of measured
data. The candidate selection is made using a minimum/maximum
method. This minimum/maximum method involves firstly selecting
the minimumdegree of attribution for each type of optical fiber.
16
CA 02431138 2003-06-04
In Table 1, the SM fiber is 0.5 for the core diameter B, the
MM fiber is 0.3 for the core height, the DS1 fiber is 0.8 for
the core diameter B, and the ED fiber is zero for the core diameter
B. Then, the maximum degree of attribution is selected from
among the minimum degrees of attribution for each type of optical
fiber. That is, since the maximum degree of attribution is 0.8
for the DS1 fiber, it is judged that the candidate for the type
of optical fiber is the DS1 fiber.
An arithmetical expression for the minimum/maximummethod
is represented in the following manner. Herein, F is a degree
of confidence having a numerical value of the degree of
attribution, m is a membership function, "i, j, k, 1,.." are
parameters, and t is the type of optical fiber.
F = max[min(mi,tr mjitr mkit., m1itr --) I t
The type of optical fiber as determined in the above manner
is verified by the candidate verifying means4c.The verification
of the candidate is uncertain, when the degree of attribution
for the type of optical fiber determined as the candidate is
small, because the degree of attribution selected for the
candidate is the degree of confidence. Accordingly, if a
threshold is set for the degree of attribution, the
identification ofthe candidate maybe unclear when the candidate
has the degree of attribution smaller than this threshold. In
selecting the candidate with the maximum degree of attribution,
17
CA 02431138 2003-06-04
two candidates having the same maximum degree of attribution
or with a smaller difference in the degree of attribution between
the first and second candidates than a certain value, if any,
are displayed. In this case, the type of optical fiber may be
decided by making the measurement again, or on the basis of
the ranking.
As a result that the type of optical fiber is verified
by the candidate verifying means 4c, if the verification is
good, the candidate is decided by the fiber type deciding means
4d. A Table 2 below lists the results of sampling test, which
are almost satisfactory. The precision of identification can
be further raised by addition and accumulation of data, as
previously described.
Table 2
Fiber Type Number of Correct Correct Answer Ratio
SM 36/36 100%
MM 35/36 97%
DS1 34/36 94%
(Normal type)
DS2 36/36 100%
(Expanded core
area type)
ED 35/36 97%
The result of determining the type of optical fiber is
displayed, along with the fiber image, on the monitor display
unit 7, as shown in Fig. 8. The determination for the type of
optical fiber is made separately for each of the left and right
18
CA 02431138 2003-06-04
optical fibers. The type of optical fiber is displayed for each
of the left and right optical fibers, in which the splicing
conditions may be displayed. The operator may be prompted to
perform the fusion splicing or retry by once interrupting the
operation during this display. In deciding the type of optical
fiber, the type of optical fiber and the measurement data are
added to the data registering section 3.
If the type of optical fiber is decided, the type of optical
fiber is collated by the fusion splicing condition registering
section 5 and the collating section 6. The fusion splicing
condition registering section 5 includes setting means 5a for
inputting the splicing conditions and a memory 5b for storing
the splicing conditions. The splicing conditions include the
preheating time, end face spacing, discharge current, and
discharge time for each type of optical fiber, for example.
After the type of optical fiber and the fusion splicing
conditions are collated by the collating section 6, the fusion
splicing is performed automatically or by confirmation of the
operator. If the collation results are matched with the type
of optical fiber and the fusion splicing conditions selected
beforehandby the operator prior to splicing, the fusion splicing
is automatically performed without interruption. In this case,
the results are not displayed on the monitor display unit 7,
thereby lightening the labor of the operator. Only if the
collation results are unmatched with the type of optical fiber
19
CA 02431138 2003-06-04
and the fusion splicing conditions, the results are displayed
on the monitor display unit 7 to prompt the operator to perform
the fusion splicing or retry in accordance with the display
contents. The fusion splicing itself is performed by driving
the fusion splicing mechanism 9 (not shown in detail) on the
basis of the above-mentioned fusion splicing condition under
the control of the control section 8 with microprocessor,
employing the well-known method and mechanism.
Referring to a flowchart of Fig. 9, a fusion splicing
method of the invention will be described below. In Fig. 9,
the automatic processing is shown within the frame of the dotted
line, and the manual processing is shown outside the frame.
A flow of fiber registration to create the fiber data for
determining the type of optical fiber is shown on the left side
of the flowchart, and a flow of fusion splicing is shown on
the right side.
First of all, the flowchart of the fiber registration
on the left side will be described below. Herein, a pair of
optical fibers with clear type of optical fiber are set in the
fusion splicing apparatus, as is the case of fusion splicing.
Firstly, the optical fibers are set. Then, at step Sl, the type
of optical fiber (one of the choices if already known or its
name if unknown) is selected and input. The next steps D2 to
D5 involve the image processing of optical fiber.
At step D2, light adjustment is made by the image observing
CA 02431138 2003-06-04
mechanism (Fig. 1) so that an observed picked-up image of the
optical fiber may be in an optimal state. Then, at step D3,
the butt position is adjusted so that the pick up position of
the optical fiber may be located in the center of the screen
to be easily observed. Thereafter, at step D4, focusing is made
to set the focal point of observed image at a preset focus
position.
At step D5, the data of the optical fiber is measured.
The data measurement is made by sampling several points on a
butt screen (Fig. 2) of the optical fiber and creating the
brightness profile (Fig. 3) of the optical fiber through the
image processing. A differentiating processing (Fig. 4) is
performed on the basis of this brightness profile to acquire
the parameter data, including the core diameter, core height
and the number of crests.
At step D6, the measured data is processed. The data
processing involves creating the membership function (Figs.
and 6) on the basis of the measured data, in which the created
data is registered as the fiber data in the database. Thereafter,
at step D7, the optical fiber is removed from the fusion splicing
apparatus.
A flow of the fusion splicing on the right side will be
described below. Herein, the type of optical fiber may be already
known but uncertain, or unknown absolutely. A pair of optical
fibers to be fusion spliced are set in the fusion splicing
21
CA 02431138 2003-06-04
apparatus as is the case with the fiber registration. After
the optical fibers are set, at step Sl firstly, the fusion
splicing conditions are selected and input. The fusion splicing
conditions that are relevant with the type of optical fiber
maybe selected by the type of optical fiber. The fusion splicing
conditions are selected from among the pieces of splicing
condition data registered in the database on the basis of the
presumption of the type of optical fiber, if it is estimated
in advance. If the type of optical fiber is unknown absolutely,
an item "automatic selection" provided on the selection menu
may be chosen.
The light adjustment at step S2, the butting at step S3,
the focusing at step S4, and the fiber measurement at step S5
are involved in the image processing as previously described,
with the exactly same flow as the fiber registration, and not
described.here . The data measured in the fiber measurement at
step S5 may be added to the database, as needed, or the processing
of fiber registration at step D6 may be performed in parallel.
The steps S6 to S8 are involved in the determination of
the type of optical fiber and the splicing collation of the
fusion splicing conditions. At step S6, the type of optical
fiber that has been set is identified. Identification of the
type of optical fiber is made by calculating the degree of
attribution for the data measured at step S5 by referring to
the fuzzy operated data (Fig. 6) in the database, and identifying
22
CA 02431138 2003-06-04
the type of optical fiber by the minimum maximum method.
After the fiber type is identified at step S6, the fusion
splicing conditions for each type of optical fiber registered
in the database are collated. If they are matched with the fusion
splicing conditions selected at step S1, the operation proceeds
to the next fusion splicing processing. If unmatched with the
fusion splicing conditions selected at step S1, the collation
result is displayed on the display unit at step S8. I f the splicing
is determined to be unsuitable from the displayed data, the
operation returns to step Si to set the fusion splicing
conditions again. If it is determined that the splicing is
possible though the displayed data is unmatched, the operation
proceeds to the next fusion splicing processing.
The next steps S9 to S13 involve performing the fusion
splicing of the optical fibers by the well-known method. First
of all, in measuring the end face of optical fiber at step S9,
the end face spacing between optical fibers, the end face shape
of the optical fiber, and attachment of dust are measured. At
step S10, if the end face shape is checked to be false, the
optical fiber is removed from the apparatus, and cut again.
If there is no abnormality on the end face of optical fiber,
the optical fibers are aligned with their axes at step Sil.
Subsequently, at step S12, the optical fibers are fusion spliced
at a discharge current and for a discharge time set in the fusion
splicing conditions. And in the check after fusion splicing
23
CA 02431138 2003-06-04
at step S12, appearance of the spliced portion for thickness
or thinness, the mixture of dust and air bubbles, the inclination
of core portion, and misalignment are checked. Thereafter, at
step S14, the optical fiber is removed from the fusion splicing
apparatus.
A single core optical fiber has been described above,
but the invention is also applicable to a ribbonized optical
fiber, employing the image observing mechanism with high
magnification. In this case, if the ribbonized optical fiber
is apparently composed of optical fibers of the same kind, one
of the ribbonized optical fibers may be subjected to the
identification processing.
Though this invention has been described above in
connection with the specific embodiments, it will be apparent
to those skilled in the art that various variations or
modifications may be made thereto without departing from the
scope or spirit of the invention.
This application is based on JP-A-2000-369681, dated on
December, 5, 2000, its contents being incorporated herein by
reference.
<Industrial Applicability>
As will be apparent from the above description, with this
invention, the optical fibers can be suitably fusion spliced
by identifying all the types of optical fibers correctly and
24
CA 02431138 2003-06-04
selecting the fusion splicing conditions suitable for the type
of optical fiber. Also, it is possible to add to the database
for identification automatically, and increase the
identification precision.