Note: Descriptions are shown in the official language in which they were submitted.
CA 02472156 2004-06-29
WO 2003/057029 PCT/US2003/000292
1
SYSTEM AND METHOD OF ASSESSMENT OF NEUROLOGICAL
CONDITIONS USING EEG BISPECTRUM
Background of the Invention
This invention relates to assessing neurological conditions and more
particularly to the
diagnosis and monitoring of progression of dementia, the assessment of
depression and
the prediction of depression treatment efficacy. The invention may also be
applied to
diagnosing and monitoring epilepsy, Parkinson's disease, attention deficit
(hyperactive)
disorder, stroke, delirium, vigilance and sleep assessment.
Dementia is a generalized designation for a state of mental deterioration,
manifested in
cognitive dysfunction, such as memory loss, impaired thinking, and strange
behavior.
There are many types and causes of dementia, including vascular dementia,
Alzheimer's
type dementia (ATD), HIV/AIDS -related dementia, alcoholic dementia,
depression,
Huntington's disease, tumors and Parkinson's disease. ATD is the most common
type of
dementia and is a progressive, neurological disorder of the brain. ATD is the
fourth
leading cause of death in adults, after heart disease, cancer, and stroke.
Early diagnosis of ATD is desirable for several reasons. If the dementia is
due to a cause
other than Alzheimer's disease, it is often treatable. Identification of a
cause other than
Alzheimer's disease also relieves concern about the prognosis. Finally, a
diagnosis of
ATD at an early stage allows the afflicted and their family an opportunity for
medical and
financial planning. In addition, while the current treatment methods for ATD
offer only
short-term symptomatic relief, there are numerous treatments and prevention
methods in
development that promise a radically improved level of treatment. The
widespread
application of such therapies will require a much more effective method of
diagnosing
ATD in its earliest stages, before other symptoms have made their appearance.
Even at
present, early diagnosis is important to identify other symptomatically
similar disease
processes that are often easily treated and possibly reversed.
There is no definitive test for ATD; only by studying brain sections obtained
during an
CA 02472156 2004-06-29
WO 2003/057029 PCT/US2003/000292
2
autopsy may one conclusively arrive at a diagnosis of "definite ATD". The most
definitive diagnosis that may be obtained during the course of the illness is
that of
"probable Alzheimer's type dementia". This diagnosis is typically arrived at
by a rule-
out procedure. Other disease processes that could produce similar symptoms are
systematically ruled out using a standardized decision tree, generally the
NINCDS-
ADRDA criteria. This diagnosis of "probable ATD" is not always correct,
however.
When histopathological findings are compared with the clinical diagnosis
following
autopsy, it appears that 80-88% of clinical diagnoses are correct. The
application of the
NINCDS-ADRDA criteria is time-consuming and requires a degree of expertise
that is
not available to all general practitioners, internists and psychologists.
Moreover, these
methods are only applicable after the onset of symptoms such as memory loss
and
confusion.
Patients with dementia of many types (ATD, vascular, etc.) exhibit changes in
EEG in
comparison to age-matched normal subjects. Typical changes include increased
EEG
activity in the delta (0-4 Hz) and theta (4-8 Hz) bands and decreased EEG
activity in the
beta band (12-30 Hz). This is in contrast to elderly normal subjects, who
exhibit
decreased low frequency activity and increased high frequency activity with
increasing
age. In addition to differences between normal patients and those with
dementia, there
are characteristic changes in the EEG power spectra observed at progressively
worsening
levels of cerebral function, implying a progressive change in EEG parameters
that may
be used to stage the progression of the dementia. The change in theta power as
a percent
of the total power has been shown to distinguish between mild, moderate and
severe
dementia, as well as controls.
The EEG observed in patients with ATD exhibits specific characteristics that
are
different from those observed in cognitively normal, aged patients. Numerous
published
studies have reported on the analysis of electroencephalographic signals (EEG)
with the
objective of identifying patients with ATD. These studies and methods are
generally
designed to differentiate ATD patients from normal subjects and / or patients
having
dementias with similar symptoms but different etiologies, such as vascular
infarcts.
CA 02472156 2004-06-29
WO 2003/057029 PCT/US2003/000292
3
These methods generally utilize discriminant analyses or neural networks based
upon
various processed EEG parameters designed to quantify the changes in EEG
typically
observed in ATD (e.g., alpha power, the power observed in the 8-14 Hz band of
the EEG
power spectrum). The median accuracy of a variety of methods for
differentiating ATD
patients from cognitively normal controls in a series of 16 EEG studies was
81%, with a
range of 54 - 100%. In general, these methods have reported sensitivities and
specificities in the 80% range, approximately equivalent to that achievable by
an expert
clinician deriving a diagnosis from a clinical interview and history. However,
it must be
noted that in almost all studies the criteria used to differentiate normals
from ATD were
defined using the data in the analysis. There are few prospective studies that
used a first
population to develop a criterion and then applied that criterion to a second
population.
Thus, the actual accuracy of existing methods is difficult to determine.
Several investigators have proposed the use of a drug challenge for the
assessment of
dementia. Holschneider reported differential changes in the power in the 20-28
Hz
spectral band in normal, ATD and vascular dementia subjects following
administration
of a thiopental bolus. While both normal and vascular dementia subjects showed
significant increases in 20-28 Hz log power compared to baseline, the ATD
subjects
exhibited no change from baseline. Neufeld used a similar protocol to
determine the
differential effect of a dose of scopolamine between age-matched normal
subjects and
those with ATD. At baseline, ATD patients exhibited smaller absolute and
relative alpha
amplitudes (8-11.5 Hz) and larger relative theta amplitudes (4-7.5 Hz)
compared with
normal subjects. After intravenous administration of 0.5 mg scopolamine, the
normal
subjects exhibited a larger increase in absolute and relative delta amplitude
(1-3.5 Hz)
than the ATD subjects in comparison to a placebo. Scinto demonstrated a method
of
diagnosing Alzheimer's disease using an automated apparatus that can
continuously
monitor pupil diameter before and after the administration of a neural
transmitter
mediator to the targeted eye. The presence of hypersensitivity to the
administered neural
transmitter mediator serves as a marker of Alzheimer's disease.
Depression is a mood disorder that affects 17 million Americans each year, and
is
CA 02472156 2011-08-09
53710-2
4
responsible for 9.7 million doctor visits. It affects sufferers in a variety
of ways, resulting
in depressed mood, irritability, sleep disorders, feelings of agitation, guilt
and
worthlessness, loss of energy and initiative, an inability to concentrate and
an increased
incidence of suicide. It is difficult to diagnose, due to comorbidities and
the fact that it is
largely self-reported. There are a number of antidepressant pharmacological
agents, and
once the proper treatment is determined, their effectiveness is quite high.
Selection of
the most efficacious agent and the initial dose is largely by trial and error.
There is thus a
need for an objective measure of depression as well as a method of predicting
efficacy of
antidepressant treatment. Diego, et al. found that the level of depression was
correlated
with frontal EEG alpha asymmetry and left frontal EEG alpha power. In another
study,
EEG theta activity was correlated with pre-treatment level of depression, and
improved
level of depression with treatment was correlated with slow (delta and theta)
activity and
fast (beta) activity at frontal recording sites. Still others have
demonstrated that
prefrontal EEG response to antidepressant medication therapy was seen as early
as 48
hours after initiation of treatment and such changes preceded clinical
response. These
changes were absent in non-responders. Another earlier study reported small
but
statistically significant differences in pre-treatment theta power between
responders and
non-responders to an antidepressant medication. None of these methods have
resulted in
a device with high enough sensitivity and specificity to be clinically useful.
A commercially available device that uses bispectral analysis of the EEG is
the
Bispectral Index'' (BIS'). BIS is a univariate processed EEG parameter derived
from surface electrodes placed on the forehead and temple. The Bispectral
Index is
described in U.S. Patent Nos. 4,907,597; 5,010,891; 5,320,109 and 5,458,117.
BIS is
a complex parameter, consisting of a set of components that include power
spectral
and higher order (bispectral) components as well as time domain components.
These
components are combined into a single number scaled from 0 to 100. BIS has
been
designed to reflect the hypnotic state of an individual, both while awake and
while
undergoing anesthesia. In a patient under the influence of anesthetic agents,
the
probability of recall is closely related to the hypnotic
CA 02472156 2011-08-09
53710-2
state. For this reason, BIS is highly correlated with the probability of both
free and
cued recall in subjects under the influence of anesthetic and sedative agents.
Decreased formation of new memories and an impaired ability to recall
preexisting
memories are hallmarks of various dementias. In certain progressive dementias,
5 such as ATD, the degree of memory impairment increases as the disease
progresses. BIS was observed to be lower at unmedicated, presurgical baseline
in
patients with dementia (ATD and multiinfarct dementia) compared to age-matched
control subjects. It is well known that cerebral glucose metabolism is
decreased in
patients with ATD in comparison to age-matched patients with normal cognitive
function. BIS was shown to be correlated with reduction of cerebral glucose
metabolism resulting from anesthetic agents, as determined using positron
emission
tomography imaging. It is thus a reasonable conjecture that the one of the
underlying
technologies of BIS, bispectral analysis, might be useful in assessing
neurological
function in a global sense.
Summary Of The Invention
An embodiment of the present invention may provide a system and method that
produces features and indices that indicate the presence or absence of a
disease or
condition, or of the progression of a disease or condition. The system and
method of
an embodiment of the present invention may also produce features and indices
that
predict responsiveness to medication from a premedication baseline. The system
and method of an embodiment of the present invention may further incorporate a
testing methodology to improve the performance characteristics of the features
or
indices. To obtain such features and indices, power spectrum, time domain,
bispectrum and higher order spectrum values are derived from biopotential
signals
taken from the subject being tested.
In another embodiment, the invention provides a system of assessing
neurological
conditions comprising one or more electrodes for acquiring biopotential
signals, and a
processor for deriving, from said biopotential signals, Kth-order spectral
values,
where K is an integer greater than 1 and for deriving from said Kth-order
spectral
CA 02472156 2011-08-09
53710-2
5a
values at least one feature indicative of neurological conditions using a
differential
testing methodology.
In a further embodiment, the invention provides a system of assessing
neurological
conditions comprising one or more electrodes for acquiring biopotential
signals, and a
processor for (a) deriving, from said biopotential signals, Kth-order spectral
values,
where K is an integer greater than 1, (b) deriving from said Kth-order
spectral values
features indicative of neurological conditions using a differential testing
methodology,
and (c) combining said features into an index indicative of neurological
conditions.
In another embodiment, the invention provides a method of assessing
neurological
conditions comprising the steps of acquiring biopotential signals from a human
subject, and deriving from said biopotential signals Kth-order spectral
values, where
K is an integer greater than 1, and deriving from said Kth-order spectral
values at
least one feature indicative of neurological conditions using a differential
testing
methodology.
In yet a further embodiment, the invention provides a method of assessing
neurological conditions comprising the steps of acquiring biopotential signals
from a
human subject, deriving, from said biopotential signals, Kth-order spectral
values,
where K is an integer greater than 1, deriving from said Kth-order spectral
values at
least one feature indicative of neurological conditions using a differential
testing
methodology, and combining said features into an index indicative of
neurological
conditions.
In another embodiment, the invention provides a method of assessing
neurological
conditions comprising the steps of acquiring biopotential signals, deriving,
from said
biopotential signals, Kth-order spectral values, where K is an integer greater
than 1,
and deriving from said Kth-order special values at least one feature
indicative of
neurological conditions using a differential testing methodology.
CA 02472156 2011-08-09
53710-2
5b
Brief Description of the Drawings
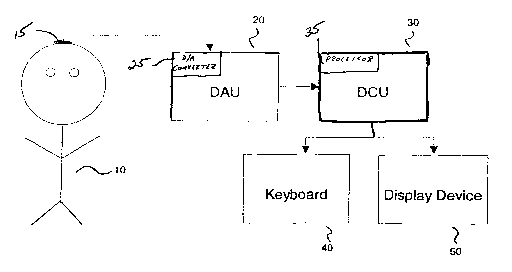
Figure 1 is a block diagram of the system of the present invention.
Figure 2 is a flow chart of a method of computation of the auto/cross
bispectral arrays
of the present invention.
CA 02472156 2004-06-29
WO 2003/057029 PCT/US2003/000292
6
Figure 3 is flow chart of an alternate method of computation of the auto/cross
bispectral
arrays of the present invention.
Figure 4 is a graph of a Spearman correlation between EEG auto bispectral
density and
Mini Mental State Exam score.
Figure 5 is a graph of a Spearman correlation between EEG auto bispectral
density and
pre-medication baseline Hamilton Depression score.
Figure 6 is a block diagram of an alternate embodiment of the system of the
present
invention, incorporating an infusion pump.
Detailed Description of the Preferred Embodiments
A preferred embodiment of the present invention shown in Figure 1 incorporates
a Data
Acquisition Unit (DAU) 20 that is used to acquire an EEG signal from a subject
10 for
subsequent processing. The DAU 20 typically consists of a computer system with
an
integral analog-to-digital (A-D) converter 25 and a set of electrodes that is
representatively shown placed on the scalp of a subject 10. While only a
single electrode
15 is shown, any montage of electrodes used to obtain EEG signals may be used
in the
invention. The A-D converter 25 is used to transform the analog EEG signals
obtained
from the electrodes 15 into a sampled set of signal values that may then be
analyzed by
the processor 35 of a Data Computation Unit (DCU) 30. The DCU 30 incorporates
a
processor 35 and a communications device that receives the sampled values from
the
DAU 20. In the described embodiment, the processors of the DAU 20 and DCU 30
are
one and the same. In an alternate embodiment, however, the DAU 20 may acquire
the
EEG signals and transmit the sampled EEG signals over a communications link to
a
remote DCU 30. Such a communications link may be a serial or parallel data
line, a
local or wide area network, a telephone line, the Internet, or a wireless
connection. The
clinician conducting the assessment may communicate with the DCU 30 using a
keyboard 40 and display device 50. In the alternate embodiment that utilizes a
DCU 30
remote from the DAU 20, an additional keyboard and display device may be
attached to
the DAU 20 for the use of the clinician.
CA 02472156 2004-06-29
WO 2003/057029 PCT/US2003/000292
7
After the DCU 30 receives the sampled values from the DAU 20, the DCU 30 first
examines the sampled EEG signals for artifact arising from patient movement,
eye
blinks, electrical noise, etc. Detected artifact is either removed from the
signal, or the
portion of the signal with artifact is excluded from further processing. The
EEG signal is
also filtered to reduce or remove artifact from high and / or low frequency
noise sources,
such as electromyographic and radio frequency interference and movement
artifact,
respectively. High-pass filtering is also employed to reduce the tendency of
power at
frequencies above the signal band of interest from appearing at lower
frequencies due to
an inadequate sampling frequency (aliasing). The DCU 30 next computes the set
of
bispectral arrays from the artifact-free EEG data, as well as additional non-
bispectral
parameters. Non bispectral parameters may include power spectral arrays,
higher-order
spectral arrays (trispectrun, etc.), cordance (such as described in US Patent
No. 5,269,315
and US Patent No. 5,309,923), z-transformed variables, entropy parameters, and
time-
domain parameters, including but not limited to template matching, peak
detection,
threshold crossing, zero crossings and Hjorth descriptors. Such parameters,
bispectral or
otherwise, which quantify some aspect of the data are referred to as features.
An index
is a function incorporating one or more features as variables. The index
function may be
linear or nonlinear, or may have an alternative form such as a neural network.
The DCU
30 calculates from all the bispectral arrays and non-bispectral parameters a
series of
features and indices that are indicative of the subject's level of
neurological dysfunction,
the severity of a neurological condition, or the likelihood of responsiveness
to
pharmacological treatment. These features and indices maybe displayed to the
user on
the display device 50. In the embodiment in which the DCU 30 is remote from
the DAU
20, the result may be transmitted back to the display device on the DAU 20, or
transmitted to the patient's physician via e-mail or made available via a
secure internet
World Wide Web page.
When the electrodes are all to be placed below the hairline, the electrodes
are preferably
of the Zipprep " type manufactured by Aspect Medical Systems, Inc. (Newton,
MA).
When electrodes are placed within the hair, gold-cup type electrodes may be
used, held in
place by either collodion or a physical restraint such as an electrode cap
placement
CA 02472156 2004-06-29
WO 2003/057029 PCT/US2003/000292
8
device, as provided by various manufacturers. A variety of different electrode
placements, or montages, may be used.
Calculation of the Bispectral Arrays
The bispectral arrays may be calculated using frequency domain (Fourier
transform)
methods as well as time domain (autoregressive) methods. The term bispectral
arrays or
bispectrum includes all or any of the following arrays, for both auto and
cross
formulations: complex triple product, real triple product, bispectral density,
biphase and
bicoherence arrays. In addition, the power spectral arrays are calculated as
an
intermediate step and are available for the derivation of parameters to be
used as features
in an index. Both methods will be illustrated here, and those skilled in the
art will
recognize that other methods may potentially be derived, as well. The
invention is
intended to incorporate all computational methods.
Referring now to Figure 2, the frequency domain based procedures for producing
the
autobispectral or the cross-bispectral arrays will now be described. In step
802, the
system checks whether the computation to be performed is an autobispectral or
cross-
bispectral computation. Autobispectral analysis is a special case of cross-
bispectral
analysis and therefore different rules of symmetry apply.
In step 804, the system sets the following symmetries in order to proceed with
autobispectral computation:
fl + f2< _ fs/2
0<f2<f1
where fs is the sampling rate (128 samples / second in the preferred
embodiment which
uses 128 2-second records, resulting in a frequency resolution of 0.5 Hz), and
fl and f2
(also referred to as Frequency 1 and Frequency 2) denote the frequency pairs
over which
CA 02472156 2004-06-29
WO 2003/057029 PCT/US2003/000292
9
bispectral computation will be carried out. In addition, for the
autobispectral
computation,
Xi(t) = Yi(t) -* Xi(f) = Yi(f)
Xi(t) and Yi(t) denote the individual time series records used for bispectral
computation.
Xi(f) and Yi(f) denote the Fourier transforms of the time series records Xi(t)
and Yi(t),
respectively, and i denotes the record number.
In step 806, the following symmetries are adhered to for cross-bispectral
analysis:
fl + f2 _< fS/2
0_fi<fs/2
OSf25fs/2
Xi(t) # Yi(t) -4 Xi(f) # Yi(f)
where all variables represent the same values as they do for autobispectral
analysis,
except that for cross-bispectral analysis Xi(t) and Yi(t) represent
individually derived
time series records.
The fast Fourier transform (FFT) Xi(f) and Yi(f) of the selected records is
computed
using a standard IEEE library software routine or any other publicly available
software
routine in step 808.
In Step 810, the power spectra Pxi(f) and Py1(f) of each of the selected
records is
computed by squaring the magnitudes of each element of the Fourier transforms
Xi(f) and
Yi(f), respectively.
The system computes the average complex triple product in step 812 by
utilizing the
CA 02472156 2004-06-29
WO 2003/057029 PCT/US2003/000292
following equations where bci(f1,f2) is the individual complex triple product
from one
record and BC(f1,f2) is the average complex triple product:
bci(f1,f2) = Xi(f1) Yi(f2) Yi*(f1+f2)
where Yi*(fl+f2) is the complex conjugate of Yi(f1+f2), and
M
BC(f1,f2) = n~ bc (f1,f2)
where M is the number of records (128 in the preferred embodiment).
The average real triple product is computed in step 814 by using the following
equations
where Pxi(f) and Py (f) are the power spectra from one record, bri(f1,f2) is
an individual
real triple product from one record and BR(f1,f2) is the average real triple
product:
br1(fi,f2) = Pxi(f1) PYi(f2) PYi(f1+f2)
M
BR(f1,f2) _ f ~br(f1,f2)
i=1
Note that PYi is real valued, and therefore PYi = PYi*.
In step 816, the bispectral density array BD(f1,f2) is computed as the
magnitude of
BC(f1,f2) using the following equation:
BD(f1,f2)= I BC(f1,f2) I
In step 818, the system computes the biphase array 4(f1,f2) using the
following equation:
CA 02472156 2004-06-29
WO 2003/057029 PCT/US2003/000292
11
O(ff,f2) =tan-1 Im(BC(fi,f2))
Re(BC(f1, f2))
0 _< 0 _< 2ic (radians)
In step 820, the system computes the bicoherence array R(fl,f2) using the
following
equation:
R(.fi, f2) = BD(.fi, f2)
BR(f1,f2)
0<R<1
In step 822, the system returns the requested auto/cross bispectral arrays to
the Data
Computation Unit 30.
Turning now to Figure 3, a parametric based method for calculating the auto /
cross
bispectral arrays will now be described. In steps 902, 904, and 906 the system
sets the
symmetries and time series records in the same manner as described above in
steps 802,
804, and 806 respectively. The power spectra of Xi(t) and Yi(t) are estimated
in steps
908, 910, and 912. This estimation method includes two major stages, the
autoregressive
(AR) model order selection and the power spectrum computation for Xi(t) and
Yi(t). In
step 908, the system computes two sequences of autocorrelations, { R2X(m) }
and
{ R2y(m) } using the following equation.
M N-Intl
R2.( (MM:N Zi(t)zi(t + M)
i=1 t=0
z = X, Y, and m = 0, 1, ...,L
where M is the number of records and N is the number of samples per record
(128 and
256, respectively, in the preferred embodiment), and L is much greater than
the possible
CA 02472156 2004-06-29
WO 2003/057029 PCT/US2003/000292
12
AR filter order (L=50 in the preferred embodiment). The Final Prediction
Errors,
FPEx(m) and FPEy(m) are calculated for all orders, m=0, 1, 2, ... L, by
performing a
Levinson recursion function on each autocorrelation sequence in step 910 in
order to find
the order of the AR filter. The locations of the minima of FPEx(m) and
FPEy(m), Qx
and Qy, respectively, are chosen to be the orders of the AR filters of power
spectra of
Xi(t) and Yi(t) respectively, i.e.,
FPEx(Qx)=min { FPEx(m) }
FPEY(QY)=min{FPEx(m) }
Once the orders of the AR filters for power spectra are chosen, the
autocorrelation
sequences, {R2X(m)} and {R2Y(m)}, are entered into Levinson recursion with
orders Qx
and Qy, respectively, instead of L. The coefficients, {cix, i=0, 1, . . . ,
Qx} and {ciy, i=0,
1, ... , Qy }, obtained from the recursion are the coefficients of the AR
filters for the
power spectra of Xi(t) and Yi(t), respectively. Then, in step 912, the power
spectra Px(f)
and Py(f) are computed as the prediction error (a,2) divided by square of the
magnitude
of the Fourier transform of the coefficients, i.e.,
PI (f) 6Z 2
1+ ~c1ze J2 i
i=1
z=X, Y
The system estimates the auto/cross real and complex triple products in steps
914, 916,
and 918. The estimation process includes two major stages: the order selection
and real
and complex triple product computation. In step 914, two sequences of third-
order
moments, { R3X(ti) } and { R3Y(ti) } are computed using the following
equation.
M S2
R3z(2) M*NII zi(t)z~(t+Z)
i=1 t=s1
CA 02472156 2004-06-29
WO 2003/057029 PCT/US2003/000292
13
z = X, Y, and 't = -L, ..., L
where si =max (1,1-ti), s2 =min (N, N-'t), and L is much greater than the
possible AR
filter orders (e.g. 50).
In step 916, two super matrices Tx and Ty are formed as follows.
R3z (-L) R3z (-L + 1) ... R3z (0)
R3z (-L -1) R3, (-L) ... R3,(-l)
Tz =
R3,(-2L) R3,(-2L + 1) ... R3z (-L)
z=X,Y
From the assumption we made about the AR filter of the bispectral arrays, the
orders Ox
and Oy of the AR filters of the bispectral arrays of Xi(t) and Yi(t) are the
ranks of the
super matrices Tx and Ty. Therefore, Ox and Oy are chosen by means of singular
value
decomposition. Having found the orders, the coefficients of the AR filters of
the
bispectral arrays are then obtained by solving the following linear system of
equations:
R3, (O) Ric (1) ... R3z (Oz) 1 )6z
R3,(-1) R3, (O) ... R3z (Oz -1) b1z 0
R3,(-Oz) R3z (-Oz + 1) ... R3z (0) b0ZZ 0
z=X,Y
where the skewness ((3Z) and the coefficients (biz, . . . , bozz), z = X, Y,
can be obtained
by solving the linear system of equations.
The average auto/cross complex triple product of Xi(t) and Yi(t) are computed
in step 918
as the cubic root of the triple product of the skewnesses, ((3x (3y (3y)1"3,
divided by the
triple product of the Fourier transforms of the AR filter coefficients
(HZ(f)), i.e.,
CA 02472156 2004-06-29
WO 2003/057029 PCT/US2003/000292
14
BC(f1,f2) _ ((3x (3y Ry)1/3 / (HX(f1) Hy(f2) Hy*(fl+f2) )
oz
HZ (f) =1 + Yb;Ze-'2'f
z=X,Y
and BR(f1,f2) is the average auto/cross real triple product:
BR(f1,f2) = Px(fl) Py(f2) Py(f1+f2)
After obtaining the average auto/cross complex and real triple products, the
system
computes the bispectral density, biphase, and bicoherence arrays in step 920
the same
way as in steps 816, 818, 820. In step 922, the system returns the requested
bispectral
arrays to the Data Computation Unit 30.
Development and Utilization of Diagnostic / Monitoring Indices
An index may be constructed using the bispectral arrays and / or other
frequency and
time domain features. Such an index may be designed to be predictive of the
presence or
absence of a given disease state. The index may be designed as a classifier,
in which an
individual to be assessed is predicted as having the disease or not, or in
which the
probability of having the disease is used as a measure of disease progression.
The index
may alternately be designed as a continuous predictor of neurological function
or disease
state / progression. Development of such indices requires a data set
consisting of EEG
data from individuals with the specified pathological condition, at different
levels of
progression, as well as control individuals without the specified condition.
The data set
must also include an independent assessment of the disease state that the
index is
designed to predict.
In the preferred embodiment, an index is constructed as a continuous predictor
of disease
CA 02472156 2004-06-29
WO 2003/057029 PCT/US2003/000292
state. EEGs are recorded from elderly normal controls and from patients with
either mild
to moderate Alzheimer's type dementia (ATD) or multi-infarct dementia (MID).
EEG
data is recorded when the subjects are in an awake, resting state. To fulfill
the need for
an independent assessment of disease progression, a Mini-Mental State Exam
(MMSE;
Folstein, 1975) is performed on each subject as a measure of dementia. The EEG
autobispectral arrays are calculated for all frequency triples of the form
(fl, f2, fl+f2) at 1
Hz resolution using 2-sec records of the first 30 seconds of non-drowsy,
artifact-free
EEG recorded from T3-Fpl (International 10/20 Electrode Montage System).
Statistical
assessments are calculated using Spearman rank correlation and Mann-Whitney U
non-
parametric tests, as appropriate. A statistical significance level of P < 0.05
is considered
statistically significant.
The level of dementia as measured by mean MMSE score is statistically
different
between the control group and each dementia group, but not between dementia
groups
(Table 1).
Table 1
Group Number of Subjects MMSE
(mean SD)
Control 18 29.0 1.1
Alzheimer's Type Dementia 11 16.6 8.6
Multi-infarct Dementia 7 19.4 7.5
The Spearman correlation between the values of individual frequency pairs (fl,
f2) of the
autobispectral density array and MMSE of all subjects is shown in Figure 4.
Recall that
due to symmetry conditions, the bispectral density arrays are limited to 0 -<
f2 <- fl, and f1
+ f2 <- fS/2. Here, the upper frequency bound, fS/2, is set to 64 Hz. The
correlation with
MMSE score is systematically negative for low frequencies [f1 < 6 Hz, f2 < 6
Hz],
reaching a minimum of -0.659 at (f1= 3 Hz, f2 = 2 Hz). Similarly, the
correlation with
MMSE score is systematically positive for high frequencies [f1 > 34 Hz, f2 >
10 Hz],
CA 02472156 2004-06-29
WO 2003/057029 PCT/US2003/000292
16
reaching a maximum of 0.529 at (f1= 40 Hz, f2 = 10 Hz).
A diagnostic or monitoring index is often specified to have the form of a
linear predictor.
Those skilled in the art will readily recognize that other forms, such as non-
linear
predictors, neural networks, measures derived from fractal spectral analysis
and
information theoretic metrics such as entropy and complexity may be used as
well. In the
preferred embodiment, the index has the general form
P
Index = co + ciF
e=1
where co is a constant, {Fi, i=1,2,...,p} are a set of features, {ci,
i=1,2,...,p} are a set of
coefficients corresponding to the features and p is the number of features. In
the
preferred embodiment, a set of features is constructed from the mean value of
the regions
within the EEG bispectral density array of a single EEG channel that exhibits
a strong
correlation with MMSE score, as noted above and in Figure 4. Although the
preferred
embodiment uses one channel of EEG data, alternate embodiments may include
data
from a plurality of channels. The features derived from the bispectral density
array that
best correlated with MMSE score are the mean values of the regions [0 Hz <_ fl
<_ 5 Hz, 9
Hz 5 f2 < f1 Hz] and [35 Hz 5 fl S 53 Hz, 11 Hz S f2 5 upper limit].
i~
F = a, BD(fi =i,f2 = J)
i=0 j=0
53 64-i
F2 A2IIBD(fi=i,f2=J)
i=35j=11
where Al and A2 are the number of frequency pairs in the summation in the
calculation
of F1 and F2, respectively, and 0 _< j <_ i. The correlations of F1 and F2
with MMSE are -
0.59 and 0.49, respectively.
Features may also be specified as ratios of values derived from the bispectral
arrays. In
CA 02472156 2004-06-29
WO 2003/057029 PCT/US2003/000292
17
the preferred embodiment, a third feature F3 is specified as the ratio of Fl
to F2.
F3 - F2
A simple index to track progression of dementia, as quantified by MMSE score,
may be
constructed as
- 100min(F3 )
co _ (max(F3) - min(F3) )
100
C3 _ (max(F3) - min(F3 ))
IndexDent- progression = CO + C3F3
Here, c3 is defined such that the range of IndexDem_progression will be
between 0 and 100,
inclusive by using the values min and max, the minima and maxima,
respectively. Based
upon the database used to derive this example, min(F3) = 0.9, max (F3) = 2.6 ,
resulting
in co = -52.9 and c3 = 58.8. The correlation of F3 and thus of
IndexDem_progression with
MMSE is -0.64, indicating that IndexDem-progression is a sensitive measure of
the degree of
dementia.
Alternatively, an index may be derived to diagnose disease state. In an
alternate
embodiment, the described data set was used to derive an index capable of
discriminating
patients with diagnosed dementia from normal controls. The features derived
from the
bispectral density array that best discriminated controls from demented
patients are the
mean values of the regions [39 Hz 5 fl < 41 Hz, 9 Hz S f2 < 11 Hz] and [2 Hz <
fl < 4
Hz, 1 Hz < f2 < 3 Hz].
CA 02472156 2004-06-29
WO 2003/057029 PCT/US2003/000292
18
41 11
F4 A4 JYBD(fi fiJ)
i=39 j=9
4 3
FS-aSEYBD(fi.f2J)
i=2 j=1
F
F6 F
As before, A4 and A5 are the number of frequency pairs in the summation in the
calculation of F4 and F5.
-100min(F6)
co _ (max(F6) - min(F6))
100
C6-1
m (F6) - mm(F6))
IndexControl-Derr = CO + C6F6
As before, co and c6 are defined such that the range of IndexControl_Dem will
be between 0
and 100, inclusive. Based upon the database used to derive this example,
min(F6) = 0.4,
max (F6) = 1.1 , resulting in co = -57.1 and co = 142.9. Using a threshold
value of 50,
IndexControi-Dem differentiated patients diagnosed with dementia from normal
control
subjects with a sensitivity of 94%, a specificity of 83%, and area under the
receiver
operating curve (AUC) of 95%.
Similarly, the region that best separated ATD from MID patients was the mean
value of
the region [5 Hz 5 fl < 7 Hz, 5 Hz 5 f2 < 7 Hz].
7 7
F7A,BD(fi=i,A=J)
i=5 j=5
As before, A7 is the number of frequency pairs in the summation in the
calculation of F7.
CA 02472156 2004-06-29
WO 2003/057029 PCT/US2003/000292
19
C -100min(F7)
O (max(F7) - min(FF ))
100
C7 (max(F7) - min(F7) )
IndexATD F
_AIID = CO +C77
As before, co and c7 are defined such that the range of IndexATD_MID will be
between 0
and 100, inclusive. Based upon the database used to derive this example,
min(F7) = 0.5,
max (F7) = 6.5 , resulting in co = -333.3 and c7 = 66.7. Using a threshold
value of 50,
IndexATD_MID differentiated ATD patients from MID patients with a sensitivity
of 82%, a
specificity of 86%, and an AUC of 91%.
In another alternate embodiment of the invention the system and method
generate an
index that predicts the efficacy of drug treatment or measures the state of a
disease or
condition. Such indices that assess the level of depression or use pre-
treatment EEG data
to predict the response of patients with depression to pharmacological
treatment will now
be described.
EEGs were recorded from 50 adults with major unipolar depression entered in a
double-
blind study evaluating the efficacy of antidepressant medications. Patients in
the study
were treated with either fluoxetine (n=12) or venlafaxine (n=13) versus
placebo (n=25).
Serial EEG recordings were made from awake, resting patients at pre-treatment
(unmedicated) baseline, drug wash-in, and 48 hrs, 1, 2, 4, and 8 weeks after
initial
treatment. Hamilton Depression Rating Scale (Hamilton-D; Hamilton, 1960) was
assessed at each recording period. Responders were defined as having Hamilton-
D score
<- 10 at week 8. The EEG bispectral density arrays were calculated for all
frequency pairs
(fl, f2) at 1 Hz resolution using 2-second records of the first 20-32 seconds
of artifact-free
EEG recorded from T3-Fpl (International 10/20 Electrode Montage System).
Statistical
assessments were calculated using Spearman rank correlation and Mann-Whitney U
non-
parametric tests, as appropriate. A statistical significance level of P < 0.05
was
considered statistically significant.
CA 02472156 2004-06-29
WO 2003/057029 PCT/US2003/000292
The Spearman correlation between the values of individual frequency pairs (fl,
f2) of the
autobispectral density array and Hamilton-D scores at baseline of subjects
receiving
venlafaxine is shown in Figure 5. Baseline depression, as quantified by
Hamilton-D
scores at baseline, was not significantly different between patients who
responded to
antidepressant treatment (responders) and those who did not (non-responders)
(Table 2).
Table 2
Group Number of Subjects Hamilton-D Score
(mean SD)
Responders 18 21.9 2.6
Non-responders 11 23.1 4.2
The EEG bispectral density array was greater at all frequencies in more deeply
depressed
patients (i.e., lower Hamilton-D score), particularly in the region [12 Hz <
f1 < 24 Hz, 0
< f2 < 6 Hz]. An index to assess severity of depression may be derived from
this data as
23 5
Flo=RioEYBD(f1=i,f2=J)
i=13 j=1
-100min(F1o)
Co (max(F10) - min(Fio ))
_ 100
c'o (max(F1o)-inin(Fio))
IndexDepressio,i-Severity, = co + C10F1o
As before, co and clo are defined such that the range of IndexDepression-
severity will be
between 0 and 100, inclusive. Based upon the database used to derive this
example,
min(Flo) = 3.9, max (Flo) = 6.1 , resulting in co = -177.3 and clo = 45.5. The
correlation
of Flo and thus IndeXDepression_severity with Hamilton-D score is 0.31 (p <
0.001).
IndexDepression_severity may be used as an objective method of assessing the
level of
depression, as a method of making a diagnosis or as a method of assessing the
efficacy of
CA 02472156 2004-06-29
WO 2003/057029 PCT/US2003/000292
21
treatment.
The EEG bispectral density measured at the pre-treatment baseline showed
characteristic
differences between responders and non-responders to medication, but not
placebo. The
largest differences were observed in the regions incorporated in features F11
and F12-
9 i
F 1 =-L
I L BD(fl =', f2 = j)
i=1 j=1
32 64-j
F12=A2 I YBD(f1=z,f2=l)
j=25 i=j
Patients who responded to venlafaxine had smaller F11 values, a quantification
of low
frequency mean bispectral density in the range [0 < fl < 10 Hz, 0 < f2 < 10
Hz].
Responders also had larger F12 values, a quantification of high frequency mean
bispectral
density in the range [24 Hz < f1 < 38 Hz, f2 > 24 Hz]. A new feature (F13) was
defined as
the ratio of the mean bispectral density in these two regions.
F12
F13 F, I
_ -100 min(Fi3 )
C (max(F13) - min(Fi3 ))
100
C13 (max(F13) - min(F13))
Index Veelafaxine-Response = co + C13F13
As before, co and c13 are defined such that the range of the venlafaxine
response index
(IndexVenlafaxine_Response) will be between 0 and 100, inclusive. Based upon
the database
used to derive this example, min(F13) = 0.4, max (F13) = 0.9 , resulting in co
= -80.0 and
C13 = 200Ø Using a threshold value of 50, IndexVenlafaxine_Response
predicted responders
with a sensitivity of 75%, a specificity of 77%, and an AUC of 81%.
Indexvenlafaxine_Response may be used to predict the responsiveness of a
specific patient to
treatment with venlafaxine. Other indices may be derived from databases of
patients
treated with different antidepressant agents, such as fluoxetine. By using
such a set of
CA 02472156 2004-06-29
WO 2003/057029 PCT/US2003/000292
22
indices, a physician may determine which antidepressant agent is likely to
have the
greatest treatment response, thus simplifying the trial and error aspect of
treating
depression. Such a set of indices could also be used to predict the success of
treatment
with any particular set of antidepressant agents. These indices may be further
refined by
including in the development database different initial dosages of the various
antidepressant agents. This will enable the index or indices to predict not
only the most
efficacious agent but also the most efficacious initial dose.
Although the invention has been described with respect to indices derived from
the
bispectral density array, it is not limited to such indices. Features may be
calculated from
other regions of the various bispectral arrays (i.e., complex triple product,
real triple
product, biphase and bicoherence, all for both auto and cross formulations).
Other
features may also be used to derive features, such as medians, standard
deviations and
variances, percentiles, absolute power within a region bounded by specified
frequencies,
relative power (absolute power as a percentage of total power within a region
bounded by
specified frequencies), neural networks, fractal spectral analysis, measures
derived from
information theory such as entropy and complexity, and other statistical
measures known
to those skilled in the art. Features may also be derived from the power
spectrum and
from various methods of time domain analysis such as pattern matching and
fractal
analysis. Features may also quantify the presence or absence of a specific
condition over
time period, or the degree to which a specific condition is met over a
specific time period
(e.g., the percent of time in a recent period that the power in a specific
frequency band of
a power or bispectral array was less than a threshold value). Detectors of
specific
conditions or signal types may also be used as features or as an index having
just two
states.
A further refinement of the system and method of the present invention is to
incorporate
features derived from the EEG with features derived from analysis of images of
the
structure under examination (e.g., the brain). Such images may be obtained
from CAT
(computer-aided tomography), MRI (magnetic resonance imaging), PET (positron
emission tomography), X-ray and other modalities. Yet another refinement is to
CA 02472156 2004-06-29
WO 2003/057029 PCT/US2003/000292
23
incorporate both features derived from the EEG with features derived from the
analysis
of images of the function of the structure under analysis. Images of function
such as
glucose metabolism may be obtained with techniques such as functional PET
imaging.
Features derived from metrics of the instantaneous or time-averaged glucose
metabolism
in the entire brain or a specified sub-region of the brain may be combined in
an index of
CNS function to quantify cognitive function, disease state, disease
progression, and other
parameters of interest.
Testing Methodologies to Improve Sensitivity and Specificity
The sensitivity and specificity of the invention may be increased through the
use of
differential testing methodologies. Differential test methodologies use 2 or
more
consecutive assessments, and analyze the change in the value of the test
metric as well as
the actual values at each of the assessments. The assessments are generally
conducted
under different conditions, such as sleep or under the influence of a stressor
such as a
mental task; these are compared to a baseline assessment. Patients with
dementia,
depression and other neurological disorders exhibit EEG responses different
from that of
normal subjects in a differential testing methodology. Several differential
testing
methodologies may be used to increase the performance of the derived indices.
Preferably, the test metric is an index derived from the EEG bispectral
arrays, as well as
other non-bispectral parameters, and will be denoted in the description below
as INDEX.
The first test methodology uses the difference between a first value of INDEX
calculated
from EEG acquired with the subject's eyes open and a second value of INDEX
calculated
from EEG acquired with the subject's eyes closed. The electrodes 15 are first
applied to
the subject 10, who is instructed to sit quietly with eyes open. A segment of
EEG is
acquired by the DAU 20 and transmitted to the DCU 30 for analysis. Generally,
segments of several minutes are used to calculate the INDEX values. The
subject 10 is
next directed to sit quietly with eyes closed, and a second segment of EEG is
acquired by
CA 02472156 2004-06-29
WO 2003/057029 PCT/US2003/000292
24
the DAU 20 and transmitted to the DCU 30 for analysis. The DCU calculates
INDEX
values for both the first and second periods of acquired data, referred to as
INDEXeyes_open
and INDEXeyes_closed= Examining the acquired data for artifact and either
removing the
detected artifact or excluding the artifacted portion of the acquired data
from analysis is
an integral part of calculating an INDEX value. The numerical difference
between
INDEXeyes_open and INDEXeyes_closed is a metric that is indicative of the
level of
neurological dysfunction, the severity of a condition or a prediction of the
efficacy of
treatment.
A second test methodology uses the difference between a first value of INDEX
calculated
from EEG acquired with the subject in a relaxed state and a second value of
INDEX
calculated from EEG acquired while the subject is performing a mental
calculation task.
The subjects may be directed to keep their eyes open during both recording
periods.
Alternatively, the subjects may be directed to close their eyes during both
recording
periods, though this may restrict the mental calculation tasks that may be
chosen. The
mental calculation task may be any simple task or set of tasks chosen to
provide adequate
difficulty yet universal enough to not require special training or a level of
education not
universal in the population to be tested. Two example tasks are mental
addition and
subtraction of numbers, as would be required in balancing a check book, and
the
calculation of the number of days between two dates. The electrodes are first
applied to
the subject, who is instructed to sit quietly with eyes open. A segment of EEG
is
acquired by the DAU 20 and transmitted to the DCU 30 for analysis. Again,
segments of
several minutes are used to calculate the INDEX values. The subject is next
given
instruction in the mental task and then asked to complete it. A second segment
of EEG is
acquired by the DAU 20 during the period of mental calculation. The acquired
data is
then transmitted to the DCU 30 for analysis. The DCU 30 calculates INDEX
values for
both the first and second periods of acquired data, referred to as
INDEXbasellne and
INDEXtask. The numerical difference between INDEXbaseline and INDEXtask is a
second
metric that is indicative of the level of neurological dysfunction, the
severity of a
condition or a prediction of the efficacy of treatment.
CA 02472156 2004-06-29
WO 2003/057029 PCT/US2003/000292
It has been reported that EEG methods of differentiating subjects with ATD
from normal
controls exhibit higher sensitivity and specificity during REM sleep than
during
wakefulness. Therefore, a third test methodology uses the difference between a
first
value of INDEX calculated from EEG acquired with the subject in an awake,
relaxed
state and a second value of INDEX calculated from EEG acquired while the
subject is
sleeping. The electrodes 15 are first applied to the subject 10, who is
instructed to sit
quietly with eyes either open or closed. A segment of EEG is acquired by the
DAU 20
and transmitted to the DCU 30 for analysis. Again, segments of several minutes
are used
to calculate the INDEX values. The subject then goes to sleep and EEG data is
acquired
continuously while the subject is sleeping. The second INDEX value is
calculated from
EEG recorded while the subject is sleeping, preferably in REM sleep. For this
reason, it
is preferable that the DCU software implements any of the algorithms known in
the art
that perform automated identification of REM sleep. These algorithms generally
make
use of EEG data as well as electrooculograph (EOG) data. Alternately, a
trained observer
who visually reviews the recorded EEG and enters the starting and ending times
of REM
sleep into the DAU 20 may identify periods of REM sleep manually. In this
case, it is
necessary that the DAU 20 have a data entry device such as a computer
keyboard. The
acquired data is then transmitted to the DCU 30 for analysis. The DCU 30
calculates an
INDEX value for the first period of acquired data, which is referred to as
INDEXawake.
The DCU 30 next calculates an INDEX value from the second period of acquired
data,
referred to as INDEXSI,,p. Because INDEXsieep is preferably calculated during
a period of
REM sleep, the automatic REM sleep identification algorithm must first process
the data
in order to identify a suitable segment of REM sleep from which to calculate
INDEXsieep.
If the recorded EEG data is manually reviewed for periods of REM sleep, the
starting and
ending times transmitted to the DCU 30 are used instead. The numerical
difference
between INDEXawake and INDEXsieep is a metric that is indicative of the level
of
neurological dysfunction, the severity of a condition or a prediction of the
efficacy of
treatment. This type of processing extends to any observation of INDEX changes
between or during the awake and asleep states, not simply the comparison with
baseline.
A further embodiment of the invention utilizes the difference between the
value of an
CA 02472156 2004-06-29
WO 2003/057029 PCT/US2003/000292
26
INDEX computed from a subject's resting, awake EEG and the value of the INDEX
computed from EEG obtained after administration of a hypnotic anesthetic
agent.
Preferably, the anesthetic agent is administered manually by means of a
syringe.
Alternatively, a means of administering such an anesthetic agent is
incorporated into the
system as shown in Figure 6, generally a computer-controlled infusion pump 70,
or in the
case of an inhalational agent, an anesthesia machine designed for
administering volatile
agents. The infusion pump may be a commercially available type such as a
Graseby
Model 3400/3500. The infusion pump is controlled by the DAU 20 via a standard
RS-
232 communication link.
The EEG electrodes are first applied to the subject 10. If an infusion pump 70
is used, an
intravenous line is placed in the subject's forearm by the clinician who is
administering
the examination, the pump is loaded with a syringe of the chosen hypnotic
anesthetic
agent and the intravenous line is connected to the infusion pump. Preferably,
the subject
is directed to keep his/her eyes open during both recording periods.
Alternately, the
subject may be directed to close his/her eyes during both recording periods. A
segment
of EEG is acquired by the DAU 20 and transmitted to the DCU 30 for analysis.
Segments of several minutes are used to calculate the INDEX values. Upon
completion
of the baseline recording period, the clinician administers a bolus of
hypnotic agent,
preferably 0.5 mg/kg of thiopental. If an infusion pump is in use, the DAU 20
instructs
the infusion pump to deliver the bolus of anesthetic agent. A second segment
of EEG is
acquired by the DAU 20 after the bolus of anesthetic agent has reached its
maximal
effect, generally 3-5 minutes in the preferred embodiment. The acquired data
is then
transmitted to the DCU 30 for analysis. The DCU 30 calculates INDEX values for
both
the first and second periods of acquired data, referred to as INDEXbaseline
and INDEXagent.
The numerical difference between the pre-medication baseline value
INDEXbaseline and
the post-medication value INDEXagent is a metric that is indicative of the
level of
neurological dysfunction, the severity of a condition or a prediction of the
efficacy of
treatment. For example, subjects with ATD exhibited smaller differences in
absolute
beta power than non-demented control subjects between baseline and post
thiopental
administration.
CA 02472156 2004-06-29
WO 2003/057029 PCT/US2003/000292
27
The DAU 20 may be equipped with display and data entry devices, such as a
computer
monitor and keyboard, respectively. The DAU 20 will execute an interface
program that
will allow communication between the infusion pump and the DAU 20. The DAU 20
may also calculate the volume of infusate, requiring the clinician to enter
only the
subject's weight and the dilution of the anesthetic agent. If the infusion
pump is in use,
the clinician may also control the rate of infusion of the anesthetic agent
via the interface
program. Conversely, the infusion pump may provide information to the DAU 20,
confirming its operational status and the administration of the desired bolus
of anesthetic
agent.
In another alternate embodiment, the anesthetic agent may be increased in a
step-wise
regimen consisting of at least two steps, or it may be increased continuously.
This is
most easily implemented using the infusion pump and interface program
previously
described and may be preprogrammed into the interface program. This embodiment
makes use of a pharmacokinetic (PK) model, which provides a calculated blood
plasma
concentration from a time series of discrete doses of an anesthetic. The PK
model may
be integrated with the interface software of the infusion pump, the calculated
time series
of anesthetic agent doses being communicated to the pump interface software
and being
used by that software to determine the pump infusion rate. PK software is
readily
available from several public domain sources; the preferred embodiment uses
the
RUGLOOP software freely available from Michel Struys, M.D., Department of
Anaesthesia, University of Gent, De Pintelaan 185, B-9000 Gent, Belgium.
Alternatively, the PK software STANPUMP may be used (freely available from the
author, Steven L. Shafer, M.D., Anesthesiology Service (1 12A), PAVAMC, 3801
Miranda Ave, Palo Alto, CA 94304).
While the foregoing invention has been described with reference to its
preferred
embodiments, various alterations and modifications will occur to those skilled
in the art.
All such alterations and modifications are intended to fall within the scope
of the
appended claims.
CA 02472156 2004-06-29
WO 2003/057029 PCT/US2003/000292
28
In another alternate embodiment, the anesthetic agent may be increased in a
step-wise
regimen consisting of at least two steps, or it may be increased continuously.
This is
most easily implemented using the infusion pump and interface program
previously
described and may be preprogrammed into the interface program. This embodiment
makes use of a pharmacokinetic (PK) model, which provides a calculated blood
plasma
concentration from a time series of discrete doses of an anesthetic. The PK
model may
be integrated with the interface software of the infusion pump, the calculated
time series
of anesthetic agent doses being communicated to the pump interface software
and being
used by that software to determine the pump infusion rate. PK software is
readily
available from several public domain sources; the preferred embodiment uses
the
RUGLOOP software freely available from Michel Struys, M.D., Department of
Anaesthesia, University of Gent, De Pintelaan 185, B-9000 Gent, Belgium.
Alternatively, the PK software STANPUMP may be used (freely available from the
author, Steven L. Shafer, M.D., Anesthesiology Service (112A), PAVAMC, 3801
Miranda Ave, Palo Alto, CA 94304).
While the foregoing invention has been described with reference to its
preferred
embodiments, various alterations and modifications will occur to those skilled
in the art.
All such alterations and modifications are intended to fall within the scope
of the
appended claims.
What is claimed is: