Note: Descriptions are shown in the official language in which they were submitted.
CA 02484313 2008-07-18
-1-
COHERENT AVERAGING FOR MEASURING TRAVELING WAVE TUBE
AMPLIFIER NONLINEARITY
BACKGROUND OF THE INVENTION
1. Field of the Invention
[0001] The present invention relates to systems and methods for transmitting
data, and
in particular to a system and method for improving traveling wave tube
amplifier curve
measurements using coherent averaging.
2. Description of the Related Art
[0002] Digital signal communication systems have been used in various fields,
including digital TV signal transmission, either terrestrial or satellite. As
the various
digital signal communication systems and services evolve, there is a
burgeoning demand
for increased data throughput and added services. However, it is more
difficult to
implement either improvement in old systems or new services when it is
necessary to
replace existing legacy hardware, such as transmitters and receivers. New
systems and
services are advantaged when they can utilize existing legacy hardware. In the
realm of
wireless communications, this principle is further highlighted by the limited
availability
of electromagnetic spectrum. Thus, it is not possible (or at least not
practical) to merely
transmit enhanced or additional data at a new frequency.
[0003] The conventional method of increasing spectral capacity is to move to a
higher-
order modulation, such as from quadrature phase shift keying (QPSK) to eight
phase shift
keying (8PSK) or sixteen quadrature amplitude modulation (16QAM).
Unfortunately,
QPSK receivers cannot demodulate conventional 8PSK or 16QAM signals. As a
result,
legacy customers with QPSK receivers must upgrade their receivers in order to
continue
to receive any signals transmitted with an 8PSK or 16QAM modulation.
CA 02484313 2008-07-18
-2-
[0004] It is advantageous for systems and methods of transmitting signals to
accommodate enhanced and increased data throughput without requiring
additional
frequency. In addition, it is advantageous for enhanced and increased
throughput signals
for new receivers to be backwards compatible with legacy receivers. There is
further an
advantage for systems and methods which allow transmission signals to be
upgraded from
a source separate from the legacy transmitter.
[0005] It has been proposed that a layered modulation signal, transmitting non-
coherently both upper and lower layer signals, can be employed to meet these
needs.
Such layered modulation systems allow higher information throughput with
backwards
compatibility. However, even when backward compatibility is not required (such
as with
an entirely new system), layered modulation can still be advantageous because
it requires
a traveling wave tube amplifier (TWTA) peak power significantly lower than
that for a
conventional 8PSK or 16QAM modulation format for a given throughput.
[0006] To provide a layered modulation scheme (as described in detail below),
a
reconstructed upper layer signal is subtracted from a received composite
signal to reveal a
lower layer signal. As such, the lower-layer signal performance is impacted by
how
closely the upper-layer signal can be reconstructed relative to the original
signal. In other
words, the lower layer signal performance is impacted by the fidelity of the
reconstructed
signal. Thus, layered modulation requires clean cancellation of the upper-
layer signal to
expose the lower-layer signal for further processing. Clean cancellation
requires TWTA
non-linearity/distortion to be accurately reproduced in the reconstruction of
the upper-
layer signal.
[0007] On-line estimation of the required TWTA characteristics is imperative
in
minimizing the required TWTA power and the complexity of satellite operation.
In
addition, the non-linearity measurement may be used to monitor the health of
satellite
TWTAs and perform other communications diagnostics. However, such an accurate
reproduction and knowledge of the TWTA non-linearity presents a significant
roadblock.
CA 02484313 2008-07-18
-3-
[0008] With a TWTA, there is a region of approximate linearity, in which the
output
power is nearly proportional to the input power, followed by a curved
transition to a point
where the output power levels off and reaches a maximum. At this point (i.e.,
when the
TWTA curve is well in the non-linear region), the amplifier is said to have
reached
saturation. Due to this non-linearity and to avoid intermodulation, the input
power is
often "backed off' by a particular amount (e.g., 6 dB). The resulting point on
the curve
after the input power is "backed off' is referred to as the operating point of
the TWTA.
When subsequently reconstructing the upper layer signal, the amount of
distortion/non-
linearity used to create the original signal serves to increase the fidelity
of the
reconstructed signal. Thus, to produce a high fidelity reconstructed upper
layer signal,
knowledge of the non-linearity (and the operating point) is important.
Accordingly, the
inclusion of (or taking into account) TWTA non-linearity may improve upper-
layer signal
cancellation ratio by 10 dB or more (the cancellation ratio is the ratio
between non-
linearity-induced noise before and after cancellation is improved).
[0009] Errors in the estimation of the operating point can have a significant
impact
when reconstructing the upper layer-signal. The impact of amplitude (AM-AM
[amplitude modulation to amplitude modulation]) and phase (AM-PM [amplitude
modulation to phase modulation]) nonlinearity due to operating point errors
may be
individually analyzed based on shift analysis. Individual impacts may then be
combined
for total impact. To evaluate performance impacts, the synthesis of a layer-
modulated
signal with known TWTA non-linearity and system/representative operating CNR
(carrier
to noise ratio) may be used. The upper-layer cancellation error may then be
calculated for
each amount of simulated operating point error in the signal reconstruction
process.
Thus, the upper layer cancellation ratio may be plotted against the operating
point
displacement.
[0010] The cancellation error can then be converted into an amount of lower-
layer CNR
degradation, which increases the CNR required for signals of both upper and
lower layers.
Such an increased CNR illustrates the impact of operating point estimation
errors.
CA 02484313 2008-07-18
-4-
[0011] FIGS. 14A and 14B illustrate the impact of operating point errors in
signal
reconstruction with an example AM-AM and AM-PM nonlinearity. In FIGs. 14A and
14B, the sensitivity of signal reconstruction error is plotted against the
TWTA input
operating point error. The effective noise is calculated as a measure of
signal
reconstruction error.
[0012] In FIG. 14A, a set of generic TWTA non-linearity curves are used. The
signal
reconstruction process is assumed to have full knowledge about the non-
linearity curves
but is otherwise uncertain about the operating point. The performance plots of
FIG. 14A
indicate that cancellation errors are below -25 dB for an input operating
point error up to
about +/- 1 dB.
[0013] In FIG. 14B, the performance plots are based on the same TWTA non-
linearity
but with an input backoff of 8 dB. With such an input backoff, the linearity
is improved
and is less susceptible to TWTA operating point error. As a result,
reconstruction and
cancellation errors are greatly reduced as indicated in FIG. 14B. The
effective noise is
below -33 dB with the same input operating error up to about +/- 1 dB as in
FIG. 14A.
[0014] Accordingly, there is a need for systems and methods for implementing
layered
modulation systems that accurately determine TWTA non-linearity and the
operating
point.
[0015] In the prior art, TWTA non-linearity measurements are performed on the
ground
before a satellite is launched. The TWTA operating point is then obtained from
telemetry
tracking and control (TT&C) commands that set the operating point of the TWTA
(the
procedure assumes that TWTA characteristics have little changed since the
satellite was
launched).
[0016] In other words, the operating point set by TT&C commands during pre-
launch
measurements is used post-launch after receiving the signals from the
satellite. However,
TWTA characteristics including the non-linearity and the effective operating
point may
change over time (including after satellite launch) and temperature. In this
regard, the
upper-layer signal cancellation in layered modulation may not be as accurately
done
without non-linearity updates.
CA 02484313 2008-07-18
-5-
[0017] Another prior art method is to estimate the non-linearity by trial and
error,
hoping to converge to a required accuracy within a reasonable effort and cost.
[0018] Accordingly, what is needed is a system and method for accurately
determining
the non-linearity of a TWTA as it changes over time/temperature. Further, what
is desired
is the capability to make such determinations at any time, from anywhere
within the
satellite downlink footprint, automatically and accurately. The present
invention meets
this need and provides further advantages as detailed hereafter.
SUMMARY OF THE INVENTION
[0019] To address the requirements described above, the present invention
discloses a
method and apparatus for using coherent averaging for measuring traveling wave
tube
amplifier (TWTA) nonlinearity. In this regard, the invention aids in the
accurate
extraction of a lower-layer signal in a layered modulation scheme. Such an
accurate
extraction minimizes the amounts of power required for both layers of a signal
and also
helps to monitor the health of a TWTA.
[0020] To measure the non-linearity of the TWTA, the measurement procedure
begins
with capturing a received signal and generating an ideal signal that is
noiseless and
without TWTA nonlinearity. The ideal signal may be generated by re-encoding
and re-
modulating the symbols decoded with quasi-error-free (QEF) performance.
[0021] The ideal signal represents the input to the TWTA and the captured
signal
represents the output of the TWTA plus downlink noise and other impairments.
The two
signals are aligned sample-for-sample by the timing recovery loop of a
demodulator.
Data pairs are then formed for all corresponding samples. Data sorting sorts
the data pairs
to the powers/magnitudes of the ideal signal samples.
[0022) After data sorting, the averaging process of the invention coherently
adds a
given number (representing the averaging ratio) of adjacent TWTA input signals
to reduce
the noise (i.e., thereby effectively increasing the CNR). The same process is
performed
on the TWTA output signal. The averaging ratio to be used depends on the
signal CNR
CA 02484313 2008-07-18
-6-
and on the quality of the non-linearity measurement that is required for a
given
application.
[0023] The presence of filters along the signal path before the data is
collected may
reduce the accuracy of the estimate. Accordingly, inverse filtering and
equalization may
be used to undo the filtering effect so that a full TWTA non-linearity may be
restored for
most accurate measurements.
[0024] In accordance with one aspect of the present invention, there is
provided a
method of measuring a transmission performance characteristic for a traveling
wave tube
amplifier of a satellite, comprising:
receiving, in a receiver, a signal that has been amplified by said traveling
wave
tube amplifier, transmitted from the satellite;
demodulating, in the receiver, the received signal;
generating, in the receiver, an ideal signal from the demodulated signal, said
ideal
signal representing the input signal to the traveling wave tube amplifier;
coherently averaging, in the receiver, the received signal to reduce noise;
and
estimating the performance characteristic for the traveling wave tube
amplifier
from a difference between the ideal signal and the coherently averaged
received signal for
use in a layered modulation scheme.
[0025] In accordance with another aspect of the present invention, there is
provided a
system for measuring a transmission performance characteristic for a traveling
wave tube
amplifier of a satellite, comprising:
(a) a demodulator, in a receiver, for demodulating a received signal that has
been amplified by said traveling wave tube amplifier and that has been
transmitted from a
satellite;
(b) a signal generator, in the receiver, for producing an ideal signal from
the
demodulated signal, said ideal signal representing the input signal to the
traveling wave
CA 02484313 2008-07-18
-6a-
tube amplifier; and
(c) a processor, in the receiver, adapted to:
(i) coherently average the received signal to reduce
noise; and
(ii) estimate the performance characteristic for the traveling wave tube
amplifier from a difference between the ideal signal and the coherently
averaged received signal for use in a layered modulation scheme
BRIEF DESCRIPTION OF THE DRAWINGS
[0026] Referring now to the drawings in which like reference numbers represent
corresponding parts throughout:
[0027] FIG. 1 is a diagram illustrating an overview of a single satellite
video
distribution system;
[0028] FIG. 2 is a block diagram showing a typical uplink configuration for a
single
satellite transponder;
[0029] FIG. 3A is a diagram of a representative data stream;
[0030] FIG. 3B is a diagram of a representative data packet;
CA 02484313 2004-10-08
_7_
[0031] FIG. 4 is a block diagram showing one embodiment of the modulator for
the
uplink signal;
[00321 FIG. 5 is a block diagram of an integrated receiver/d.ecoder;
100331 FIGS. 6A - 6C are diagrams illustrating the basic relatioriship of
signal layers in
a layered modulation transmission;
100341 FIGS. 7A - 7C are diagrams illustrating a signal constellation ofa
second
transmission layer over the first transmission laycr after first Iayer
d8modulation;
[0035] FYG. 8A is a diagram shorsving a system for transmitting and receiving
Iayered
moduiation sigaals;
100361 FIG. 8'E is a diagram showing an exemplary satellite transponder for
receiving
and transrnitting layered modulation signals;
[0037] FIG. SC is a diagram illustrating details of a simulation of an
exemplary satellite
transponder and signal processii-ig; ,
[0038] FYG. 9 is a block diagram depicting one embodiment of an enhanced iRD
capable of receiving layered modulation signals;
[0039] FIG. ].OA is a block diagratxz of one sinbodiment o{'th.e enhanced
tuner/modulator and FEC encoder;
[0040] FIG. 1013 depicts another embodiment of the enhanced tuner/modulator
wherein
layer subtraction is performed on the received layered signal;
[0041] FICS. I1A and l tI3 depict the relative power levels of example
embodirnents of
the present invention;
[0042] FIG, 12 illustrates an exemplaty computer systtm that could be used to
implement selected modules or functions the present invention;
[0043] FIGS. 13A., 13E, and 13C are block diagrams of a basic system for
rneasuring
parformance maps in accordance with one or more embodiments of the invention;
100441 FTG. 13D outlines the flow of a method of the presertt invention;
[0045] FIGS. 14A and 148 illustrate the irnpact of operating point errors in
signal
reconstruction.
CA 02484313 2004-10-08
-g-
[004G1 FIG. 15 shows an estimate of the TW"Y'A nonlinearity;
[40471 FIG. 16 shows a subset of data pairs of raw data from FIG. 1 S before
averaging;
[00481 FIG. 17 shows averaged and fitted TWTA nonlinearity curves;
[00491 FiG. 18 shows the quality of AMI.I'M fitting polynoraials;
100501 FIG. 19 illustrates the layered signal AMJAlv1 and AM/PM data after
averaging;
[U0511 FIG. 20 illustrates the layered signal raw AM-PM data;
[0052] FIG. 21 illustrates the layered signal fitted AMIAM and AM/PM data;
[00531 FIG. 22 illustrates the layered signal quality of AM/f'M estimatcs;
(0054j FIG. 23 illustrates the effect of an IMUX filter to AMIPM cstimates;
(A05S] FIG. 24 illustrates thg et'fect of adding a baud rate offset ratio of
i0'5 to AMI.PM
estimates;
[0056] FIG. 25 illustrates a sample history of the estimation pBrforniance
over a subset
of the data pairs of FIG. 24;
[0057) FIG. 26 illustrates the effect of adding an OMUX filter to the AM/PM
estimates;
1E10583 FYG. 27 illustrates the effect of tlie addition of a 4-th order
Butterworth LP'F
filter to the AM/PM estimates;
[00591 FIG. 28 plots the measured nonlinearity from the emulated layer-
modulated
signal;
[0060) FIG. 29 illustrates the AMIPM estimate RMSF (root mean square error)
history
and contains only one data segment processed fmm the captured data;
[0061) FIG. 30 illustrates a signal saauple power histogram and error
contributions of
the reconstructed signal from the processed data.segrnent;
100621 FIG. 31 is a signal processing diagram for TWTA nanlinearity impact
calculations from satellite signals;
[00631 FIG. 32 displays the spectrum of the upper layer input (liriesr)
signal;
1011641 FIG. 33 iilustratcs the upper layer output signal with actual AM/Y'M
noniinearity;
104+551 FIG. 34 illustrates the upper layer output signal with measured AM/PM
t~o~1l1TNBtirity;
_-~. ~....-~ ._..~ a
CA 02484313 2004-10-08
100661 FIG. 35 illustrates the difference between actual and measured
nonlinear signals;
and
[00671 FIG. 36 illustrates the difference between nonlinear signals and linear
signais.
DETAELED 1]ESCRIETION? CQF PREpERREI.~~tJl7bMNTS
100681 In the following description, refcrcncc is rnade to the accompanying
drawings
whicn form a part hcrcot, and whicb is shown, by way o#`itlustratian, several
cmbodiments of the present invention. It is understood that other embodiments
may be
utilized and structural chattges may be made without departing from the scope
of the
present invention.
1. Overview
[00691 The invention provides a method of determinanglestirnating on-line non-
linearity
measurernents of a TWTA. A coherent averaging technique maximizes processing
gains
for best TWTA AM-AM and AN!-PM measurement accuracy. The technique does not
create a measureinent floor in the low carrier-to-noise ratio (CNR) region
that biases the
estiinat$. Allowing current TWTA non-linearity to be rneasursd for
cornpensation from
layer-fnodulated sigiials provides for continuous layered modulation operation
without
service disruptions and with best CNR performance. Additioaa.Uy, a systcm
desigxt option
is available for indiviciual receivers to gcncrate non-linearity ourves
locally, thereby
eliminating thc ncod to tr=sxnit the curves from the brc+adcast center.
100701 In addition to the above, an equalizer andlor inverse filter may be
used to restore
part cafthe TWTA non-linearity that is non-observable because of linear
filters along the
signal path.
2. Video Distributiori, Syste~s}
[00711 FYG. 1 is a diagram iDliistrating an overview of a single satellite
video
distribution system 100. The video distribution system 100 comprises a eontrol
center
CA 02484313 2004-10-08
102 in communication with an uplink center 104 via a ground or other link 114
and with a
subscriber receiver station 1 10 via a public switched telephone network
(PSTN) or other
link 120. The coutrol center 102 provides program material (e.g. video
programs, audio
prograans and data) to the uplink center 104 ancl coordinates with thc subsr-
ribor receiver
stations 110 to offer, fbr exumple, pay-per-vicw (PPV) program services,
including billing
and associated decryption of video programs.
[0072] The uplink center 104 receives program material and program control
infoxamation from the control center 102, and using an uplink antenna 106 and
transmitter
105, transmits the program material and program control information to the
satellite 108
via uplink signal 116. The satellite receives and processes this inforraation,
and transmits
the video programs andcontrc-l information to the subscriber receiver station
110 via
downlink signal 118 using transmitter 107. The subscriber receiving station 1
10 receives
this information using the outdoor unit (ODU) 112, whiah includes a subscriber
antenna
and a low nflise block converter (LNB).
[00731 In one embodiment, the subscriber receiving station antenna is an 18-
inch
sliglitly oval-shaped Ku-band antgxuia. The slight oval shape is due to the
22.5 degree
offset feed of the T.NB (low noise biock converter) which is used to receive
signals
reflected frc-rn the subscriber antenna. The offsct feed positions the LN13
out of the way
so it does not block any surface area of the antenna minimizing attenuation of
the
incoming microwave signal.
[0074] The vidco distribution syatcm 100 can comprise a plurality of
satellites 108 in
order to provide wider terrestrial covErage, to provide additional channels,
or to provide
additional baudwidth per channel. In one embodiment of the invention, eaah
satellite
comprises 16 transponders to receive and transmit program material and other
controi
data from the uplink center 104 and provide it to the subscriber receiving
stations 110.
Using data compression and multiplexing techniques the channel eapabilities,
two
satellites 108 working together can receive and broadcast over 150
conventional (non-
HDT'V) audio and video channels via 32 transponders.
CA 02484313 2004-10-08
[0075] While the invention disclosed herein will be described with reference
to a
satellite-based video distribution system 100, the present invention may also
be practiced
with t+etrestrial-based transmission of program information, whether by
broadcasting
means, cable, or other means. Further, the different functions collectively
allocated
among the control center 102 and the uplink center 104 as descri6ed above can
be
reallocated as desired without departing from the intended scope of the
present invention.
[00761 Although the foregoing has been described with rospoct to an embodiment
in
which the program matcriat delivc.~resd to the subscriber 122 is video (and
audio) program
rnatcrial such as a movie, the foregoing method can be used to deliver
prograin material
comprising purely audio information or other data as well.
2.1 jlrli~f'~gfi ion
100771 FIG. 2 is a block diagrarn showing a typical uplink configuration for a
single
satellite 108 transponder, showing how video program matarial is uplinked to
the satellite
108 by the control center 102 and the uplink center 104. FIG. 2 shows three
video
channels (which may be augmented respectively with one or more audio channels
for high
fidelity music, soundtrack information, or a secondary audio program for
tra.nsntitting
foreign languages), a data channel from a prc-Sram guide subsystem 206 and
computer
data information from a computer data source 208.
[0078] The video channels are provided by a program source 200A-200C of video
material (collectively referred to herefn.after as program soarcc(s) 200). The
data froin
each program source 200 is providod to an cncoder 202A-202C (collectively
referred to
hereinafter as encoder(s) 202). Fach of the encoders accepts a program time
stamp (PTS)
from the controller 216. The PTS is a wrap-around binary time stamp that is
used to
assure that the video information is properly synchronized with the audio
information
after encoding and decoding. A PTS time stanzls is sent with each I-frarne of
the MPEG
encoded data.
[0079[ In one embodiment of the present invention, each encoder 202 is a
second
generation Motion Picture Experts Group (MPEG-2) eneoder, but other decoders
CA 02484313 2004-10-08
-12-
implementing other coding techniques can be used as well. The d4ta channel can
be
subjected to a similar compression scheme by an encoder (not shown), but such
ooxnpression is usually either unnecessary, or performed by computer programs
in the
computer data source (for example, photographic data is typically compressed
into *.77F
files or *.xPG fjles before t=smission). After encoding by the encoders 202,
tho signals
are converted into data packets by a packetizer 204A-204F (collectively
referred to
hereinafter as packetizer(s) 204) associatcd with cach program sourese 200.
{00$0] The data paclCcts are asscrnbled using a referer-ce fronti the system
clock 214
(SCR), and from the conditional acaess manager 210, which provides the service
cha.nnel
In identifier (SCID) to the packetizers 204 for use in generating the data
packets. These data
packets are then inultiplexed into serial data and tran.srraitted.
2.2 RroAdcast Data Strogm Format #nd Protocol
(00811 FIG. 3A is a diagranz of a representative data stream. The first packet
segment
302 comprises information from video channel 1(data coming from, for example,
the first
video program source 200A). The next packet segment 304 comprises computer
data
information that was obtained, for example from the computer data source 20$.
The next
packet segment 306 comprises information &om video channel S(from one of the
video
prograAl sources 200). The next packet segment 308 comprases.prograrn guide
information such as the inform.ation provided by the program guide $ubsystcm
206. As
shown in FIG. 3A, null packets 310 created by thh null packet module 212 maybe
inserted into the data stream as dcsircd followed by further data packets 312,
314, 316
from the program sources 200.
100821 The data etream therefore comprises a series of packets (302-316) from
any one
of the data sources (e_S. program sources 200. program guide subsystem 206,
computer
data source 208) in aii order deternzined by the controller 216. The data
stream is
encrypted by the encryption module 218, modulated by the modulator 220
(typically using
a QPSK modula.tion scheme), and provided to the transmitter 1 t16/222, which
broadcasts
the modulated data stream on a frequency bandwidth to the satellite via the
antenna 106.
= CA 02484313 2004-10-08
-13-
The receiver 500 at the receiver station 110 receives these signals, and using
the SCITa,
reassembles the packets to regenerate the program material for each of the
channels.
100831 FIG. 3B is a diagram of a data packet. Each data packet (e.g. 302-316)
is 147
bytes loiig, and comprises a number of packet segments. The first packet
seginent 320
comprises two bytes of inforniation containing the SCM. and flags. The SCID is
a uniquo
12-bit number that uniquely identifies the data packet's data channel. The
flags include 4
bits that are used to control other faatures. The scc4nd paok+st segment 322
is rreade up of
a 4-bit packet typc indioa.tor and a 4 -bit continuity counter. The packet
type identifies the
packet as one of the four data types (video, audio, data, or null). When
combined with the
SCIA, the packet type determines how the data packet wi11 be used. The
continuity
counter increments once for each packet type and SC1Ll. The next packet
segment 324
comprises 127 bytes of payload data, which in the cases of packets 302 or 306
is a
portion of the video program provided by the video program source 200. The
final packet
segment 326 is data required to perform forward error correction.
100841 FIG. 4 is a block dia,gram showing one embodiment of the modulator 220.
The
modulator 220 optionally comprises a forward en-or correction (FEC) encoder
404 which
accepts the first signal symbols 402 and adds redundant in#'ormation that are
used to
reduce transmission errors. The coded symbols 405 are modulated by modulator
406
according to a first carrier 408 to produce an upper layer modulated
signa.1410. Second
symbols 420 are likewise provided to an optional second FEC encodcr 422 to
produce
coded second symbols 424. The codled second syxnbols 424 are provided to a
second
modulator 414, which modulatas the coded second symbols 424 acwirding to a
second
carrier 416 to produce a lower layer modulate,d signal 418. The upper layer
modulated
signal 410 and the lower layer modulated signal 418 are therefore
uncorrelated. Thus, the
upper layer signa1410 and the lower layer signal 418 aan be transmitted to
separate
transponders on one or more satellites 108 via separate uplink si,gnals 116.
Thus, the
lower layer signa1418 can be implemented from a. separate satellite 108 that
receives a
separate uplink signal 116. However, in the downlink signal 118 the upper
layer signal
CA 02484313 2004-10-08
-14-
410, must be a sufftciently greater amplitude signal than the lower layer
si8na1418, to
maintain the signal constellations shown in FIG. 6 an.d FIG. 7.
r00851 It should be noted that it may be more efficient to retrofit an
existing system by
using a transponder ora a separate satellite 108 to transmit the lower 14yer
dcswnlink signal
over the existing legacy downlink signal rather than r$placing the legacy
sateifito with one
that will tranarnit both downlink signal layers. .Fmphasis can be given to
accommodating
the downlinSc legacy signal in iaripiemcnting a layered doyrnlinlr broadcast.
2.3inteMted Re~3eivp~rl,~~s~
100$61 FIG. 5 is a block diagram of an integrated receiver/decoder (M) 500
(also
hereinafter alternatively referred to as receiver 500). The reoeiver 500
corp.prises a
tuner/demodulator 504 communicatively coupled to an ODU 112 having one or more
low
noise blocks (LNBs) 502. The L]V13 502 converts the 12.2- to 12.7 GH, downlink
118
signal from the satellites 108 to, e.g., a 950-1450 MHx signal required by the
M.D's 500
tuner/demodulator 504. Typically, the LNB 502 may provide either a dual or a
single
output. The single-outpttt LNB 502 has only one RF connector, while the dual
output
LNB 502 has two RF outpiat connectors and can be used to feed a second tuner
504, a
second receiver 500, or some other form of distribution system.
100871 The tuner/demoduiator 504 isolates a single, digitally modulated 24 MHz
transponder signal, and converts the modulated data to a digital data strcam.
Further
details regarding the demodulation of the received sigraal follow.
100881 The digital data stream is then supplied to a forward error correction
(F8C)
decoder 506. This allows the fRD 500 to reassemble the data transmitted by the
uplink
center 104 (which applied the forward error correction to the dosired signal
before
transmissiota to the subscriber receiving sta.tion 110) verifying that the
correct data signal
was recaived, and correcting errors, if any. The error-corrected dFtta may be
fed from the
F1rC decoder module 506 to the transport module 508 via an 8-bit parallel
interface.
[00891 The transport module 508 performs many of the data processing functions
performed by the IRp 500. The transport module 508 processes data received
from the
CA 02484313 2004-10-08
-1 S-
FBC decoder module 506 and provides the processed data to the video MPEG
decoder
514 and the audio MPEG decoder 517. As needed the transport module employs
systern
RAM 528 to process the data. Jn one caribodiment of the present invention, the
transport
module 508, video MPEG decoderS 14 and audio MPEG decoder 517 are a11
im;piementoct
on integrated circuits: This design promotes both space and power efficaency,
and
increases the security of the functions perforracd within the transport module
508. The
transport module 508 also provides a passage for comn-,unicatione between the
microcorttroller 510 and thc video and audio MPEG decoders 514, 517. As set
forth more
fully hervinafter, the transpnrt module also works with the conditional access
module
(CAM) 512 to cletermine whether the subscriber receiving station 110 is
pennitted to
access certain prograr.n material. Data from the transport module 508 can also
be supplied
to external communication module 526.
[00901 The CAM 512 functions in association with other elements to decode an
encrypted signal from the trarisport module 508. The CAM 512 may also'be used
for
tracking and billing these services. In one embodiment of the present
invention, the CAM
512 is a removable sntart card, having contacts cooperatively interacting with
contacts in
the IRD 500 to pass inforcnation. In order to implement the processing
perfornnad in the
CAM 512, the UM 500, and specific,alTy the transport module 508 provides a
clock signal
to the CAM 512.
[0091] Video data is processed by the MPEG video decoder 514. Using thc video
random access rrienzory (17.AM) 536, the IvIPF-0 vidoo decoder $14 deeodea the
compressed video data and sends it to an encoder or video processor 516, which
converts
the digital video information received from the video WEG module 514 into an
output
signal usable by a display or rather output device. By way of ex.ample,
processor 516 may
comprise a National TV Standards Corurnittee (NTSC) or Advanced Television
Systems
Conimittee (ATSC) encoder. In one embotiimertt of the invention both S-Video
and
ordinary video (NTSC or ATSC) signals are provided. Other outputs may also be
utilized, and are advantageous if high definition progranmsning is processed.
CA 02484313 2008-07-18
-16-
[0092] Audio data is likewise decoded by the MPEG audio decoder 517. The
decoded
audio data may then be sent to a digital to analog (D/A) converter 518. In one
embodiment of the present invention, the D/A converter 518 is a dual D/A
converter, one
for the right and left channels. If desired, additional channels can be added
for use in
surround sound processing or secondary audio programs (SAPs). In one
embodiment of
the invention, the dual D/A converter 518 itself separates the left and right
channel
information, as well as any additional channel information. Other audio
formats may
similarly be supported. For example, other audio formats such as multi-channel
DOLBY
DIGITAL AC-3 may be supported.
[0093] A description of the processes performed in the encoding and decoding
of video
streams, particularly with respect to MPEG and JPEG encoding/decoding, can be
found in
Chapter 8 of "Digital Television Fundamentals," by Michael Robin and Michel
Poulin,
McGraw-Hill, 1998.
[0094] The microcontroller 510 receives and processes command signals from the
remote control 524, an IRD 500 keyboard interface, and/or another input
device. The
microcontroller 510 receives commands for performing its operations from a
processor
programming memory, which permanently stores such instructions for performing
such
commands. The processor programming memory may comprise a read only memory
(ROM) 538, an electrically erasable programmable read only memory (EEPROM) 522
or,
similar memory device. The microcontroller 510 also controls the other digital
devices of
the IRD 500 via address and data lines (denoted "A" and "D" respectively, in
FIG. 5).
[0095] The modem 540 connects to the customer's phone line via the PSTN port
120. It
calls, e.g. the program provider, and transmits the customer's purchase
information for
billing purposes, and/or other information. The modem 540 is controlled by the
microprocessor 510. The modem 540 can output data to other I/O port types
including
standard parallel and serial computer UO ports.
[0096] The present invention also comprises a local storage unit such as the
video
storage device 532 for storing video and/or audio data obtained from the
transport module
508. Video storage device 532 can be a hard disk drive, a read/writable
compact disc of
CA 02484313 2004-10-08
-i~-
IaVD, a solid state RA.M, or any other suitable storage mediuttt. In one
embodiment of
the present invention, the video storage device 532 is a hard disk drive with
specialized
parallel readJwrite capability so that data may be read from the video storage
device 532
and writteit to the device 532 at the saine time. To accomplish this feat,
additional buffer
memory accessible by the video storage 532 or its controller may be used.
Optionally, a
video storage processor 530 can be used to manage the storage and retrieval of
the video
data from the video storage device 532. The video storagc processor 530 may
also
comprise memory for buffcring data passing into and out of the video storage
device 532.
Alternatively or in combination witli the foregoing, a plurality of video
storage devices
532 can be used. Also alternatively or in combination with the foregoing, the
mioroeontroller 510 can alsc, perfori-n the operations required to store and
or retrieve video
and other data in the video storage device 532.
100971 The video processing module 516 input can be directly supplied as a
video
output to a viewing device such as a video or computer monitor. In addition,
the video
andlor audio outputs can be supplied to an RF modulator 534 to produce an RF
output
andlor 8 vestigal side band (VSB) suitable as an input signal to a
conventional television
tuner. This allows the raceiver 500 to operate with televisions without a
video output.
[00981 Each of the satellites 108 comprises a transponder, which accepts
program
infonnation froin the uplink center 104, and relays this information to the
subscriber
receiving station 110. Known nzultiplexing techniques are used so that
multiple channels
can be provided to the user. These multiplexing techniques include, by way
of'cxaznplo,
various statistical or other tirne domain n3ultiploxing techniques and
polarization
multiplexing. In otie embodiment of the jttvention, a single transponder
operating at a
single frequency band carries a plurality of channels identified by respective
service
channcl identication (S+CID).
[00091 Preferably, the Ei.D 500 also receives and stores a program guide in a
memory
available to the microcontroller 510. Typically, the program guide is rewived
in otte or
more data packets in the data strearn from the satellite 108. The program
guide can be
accessed and searclied by the execution of suitable operation steps
implemented by the
CA 02484313 2004-10-08
-18-
microcontroller 510 and stored in the processor ROM 538. The program guide may
include data to map viewer channel numbers to satellite transponders and
service channel
identifications (SCIDs), and also provide TV program listing information to
the
subscriber 122 identifying program events.
[0l00j The functionality implemented in the IRD 500 depicted in FIG. 5 cati be
implemented by one or more hardware modules, one or more software mQdules
deflning
instrttctions performed by a processor, or a combination of both.
(01011 The present invention provides for the modulation of signafs at
different power
levels and a+civantageously for the signals to bc non-coherent from each
layer. in addition,
independent modulation and coding of the signals may be performed. Backwards
compatibility with legacy receivers, such as a quadrature phase shift keying
(QPSK)
receiver is enabYad and new services are provided to new receivers, A typical
new
receiver of the present invention uses two demodulators and one remodulator as
will be
described in detail hereafter.
101021 In a typical backwards-compatible embodimertt of the present invention,
the
legacy QPSK signal is boosted in power to a higher transmission (and
reception) level.
This creates a power "room" in which a new lower layer signal may operate. The
legacy
receiver will not be able to distinguish the new lower layer signal from
additive white
Gaussian noise, and thus operates in the usual manner. The optimum selection
of the
layer power levels is based on accommodating the legacy equipment, as well as
the
desired new throughput and services,
[01031 The new lower layer signal is provided with a sufficicut carricr to
thermal noise
ratio to ftunction properly. 'The new lower layer signal and the boosted
legacy signal are
non-cahcrcnt with respcct to each other. Therefore, the new lower layer signal
can be
impleinented from a d.ifferont TWTA and even from a different satellite. The
nevs- lower
layer signal fornzat is also independent of the legacy format, e.g., it may be
QPSK or
8PSK, using the conventional concatenated FEC code or using a new Turbo code.
The
lower layer signal may even be an analog signal.
___._.., ,w..~..~,..~.~,=_~a
CA 02484313 2004-10-08
-19-
101041 The combined layered signal is demodulated and decoded by first
demodulating
the upper layer to remove the upper carrier. The stabilized layered signal may
then have
the upper layer FEC decoded and the output upper layer symbols communicated to
the
upper layer transport. The upper layer symbols are also employed in a
remodulator, to
generate an idealized upper layer signal. The idealized upper layer signal is
then
subtracted from the stable layered signal to reveal the lower layer signal.
The lciwer layer
signal is then demodulated and FFC decoded and communicated to tho lower
la.yer
transport.
[01Q5) Signals, systems and mcthods using the present invention rn.ay be used
to
supplement a pre-existing transmission compatiblE with legacy receiving
hardware in a
backwards-cornpatible applx"cation or as part of a preplanned layered
modulation
architecture providing one or more additional layers at a present or at a
later date.
2.4 I.ayered Signals
[0106] FIGS. 6A - 6C illustrate the basic relationship of signal layers in a
received
layered modulation transmission. FIG. 6A illustrates an upper layer signal
constellation
600 of a transmission signal showing the signal points or symbols 602. FrQ. 6B
illustrates the lower layer signal constellation of symbols 604 over the upper
layer signal
constellation 600 where the layers are coherent (or synchronixed). FIG. 6C
illustrates a
lower layer signal 606 ofa second transmission layer over the tipper layer
consteilatfon
where the layers are non-c herent. The lower layer 606 rotates about the uppor
layer
constellation 602 4ue to the relative modulating frequcncits of the two layers
in a non-
coherent transmission. Both the upper and lower layers rotate about the origin
due to the
first layer modulation frequency as desQribad by path 608.
[flY 07] FIGS. 7A - 7C are diagrams illustrating a non-coheretit relationship
between a
lower transix-ission layer over the upper transmisaion layer after upper layer
demodulation. FIG. 7A shaws the constellation 700 before the first carrier
recovery loop
(CRL) of the upper layer and the constellation rings 702 rotate around the
large radius
circle indicated by the dashed line. FIG. 7B shows the constellation 704 aftr
CRL. of the
~... _ ....... _... . ..., ._..~__..~.__ .. . _ ~ ....,..,~
CA 02484313 2004-10-08
-20-
upper layer where the rotation of the constellation rings 702 is stopped. The
cotistellation
rirtgs 702 are the signal points of the lower layer around the nodes 602 of
the upper layer.
FIG. 7C depicts a phase distribution o9'the received signal with respect to
nodes 602.
[01081 Relative modulating frequencies of the non-coherent upper and lower
layer
signals cause the lower layer constellation to rotate around the nodes 602 of
the upper
layer constellation to forrn rings 702. After the lower layer C1tL this
rotation is
eliminated and the nodes of the lower ]ayer are revealed (as shown in FIG.
6B). The
radius of the lower layer constellation rings 702 is indicativc of the lower
layer power
Ievel. The thickness of the rings 702 is indicative of the cRrrier to noise
ratio (CNR) of
the lower layer. As the two layers are non-coherent, the lower layer may be
used to
transmit distinct digital or analog signals.
[01091 rIG. SA is a diagram showing a system for transmittiug and receiving
layered
modulation signals. Separate transmitters I07A, 107B (that include TWTAs to
amplify
the signals), as may be located on any suitable platform, such as satellites
108& 108B.
are used to non-coherently transniit different layers of a signal ofthe
present invention.
Uplink signals 116 are typically transmitted to each satellite 108A, 1088 from
one or
more uplink centers 104 with one or more transmitters l OS via an antanna 106,
10110] FIG. 8f3 is a diagrani illustrating an exernplary satellite transponder
107 for
receiving and transmitting layvred modulation signals on a satellite 108. The
uplink
signal 116 is received by the satellite 108 and passed through an input
multiplexer
(INICJX) 814. FQllowing this the signal is arnplified with a traveling wave
tube amplifier
(TWTA) 816 and then through an output muliplexor (OMLTX) 8I 8before the
downlink
signal 118 is transmitted to the receivers 802, 500.
101111 FIG. 8C is a diag,ram illustrating details of a simulation of an
exemplary satellite
tra sponder and signal processing in aaccordance with one or more
elnbodimeitts of the
invontion. Specifically, FIG. 8C illustrates how a layer-modulated signal can
be
simulated to generate results as described hereirt. In FIG. SC, the blocks
with potential
impact on nonlinearity measurement accuracy of the upper layer TWTA. are
highlighted.
CA 02484313 2004-10-08
-21-
As illustrated and described in more detail below, no adjacent or co-channel
interferences
820 are included.
[0I12] The FEC encoders 404 and 422 accept the first and second signal symbois
402
and 420 respectively and add redundant information that are used to reduce
traxismission
errors. The encoded signals are modulated, up-converted in frequency, up-
linked, and
received in the satellite 108 with relatively small impairment.
[0113] In the sitnulatiion, the upper and lower signals ara proccssed by
signal mappers
824A and 82413 respectively. Thc signal mappers 824A and 824B converts the FEC
output bits into cor,steliaticsn symbols. To ensure that the funclamental
shapes of the
pulses of the signal do not interfere witli one another at an optimal sampling
point later in
the receiver, pulse shaping filters 826A and 826B may be used to establisll a
desirable
pulse shape. In this regard, the pulse shaping filters 826A and 826B may
comprise a root-
raised cosine filter (RRCF) in which the frequency filter provides for
expressing the
frequency response as the square root of the magnitude spectrum of a full
raised cosine
filter (RCF).
(01141 Continuing the simulation, the pulse shaped signals are independently
offset by
the baud and earrier offset inodules 828A and 828B. As illustrated in FIG. 8B,
the signal
is then passed through satellite input multiplexer (AvTLTX) filters 814A and
81413.
Following this the signal is amplified with traveling wave tube amplifiers
(TWTA) 816A
and 81 66 and then through output muliplexers (OMUX) 818A and 8188. Thc: upper
layer signal and lower layer signal arc combined with xdjaccnt and Go-channel
interferences 820, as ma.y be required, bcfore downlinlc tranamission. In the
simulation
illustrated in FIG. 8C, additive white Gaussian noise (AWGN) 830 may be added
to test
the robustness of the invention.
101151 As part of the simulation, phase noise 832 maybe added to the signal. A
receiver front-end filter 834 (e.gõ a 4th order Butterworth Low Pass Filter
(J'PF) as an
anti-aliasing filter) may be included to model receiver implementation that
outputs a
simulated received signal for an off lyne receiver processing block 836 to
measure TWTA.
nonlinearity. Alternatively, a down-linked signal 838 may be captured by
receiver 500 for
CA 02484313 2004-10-08
-22-
TWTA nonlinearity measurement. As illustrated and described herein, the baud
and
carrier offset module 828A, satellite TWTA 816A, Satellite OMiTX Filter 8I8A,
Iaownlink AWGN 830, Phase Noise 832, and Iteceiver Front-end Filter 834 have a
more
significant .effect on the accuracy of the TWTA nonlineaaity measureinent than
other
components of the satellite and receiver.
101161 Referring agaitt to FIG. 8A, the layered signals 808A, 808B (e.g.
multiple
downlink signals I 18) are received at receiver antennas 812A, 812B, such as
satellite
dishes, each with a low noise block (LNB) 810A, 81 QB where they a.r+a then
coupled to
integrated receivcr/dccodars (1R.13s) 500, 802. For example, first satellite I
08A. and
transtnitter 107A can transmit an upper layer legacy signal 808A. and second
satellite
1088 and transrrmitter 107H can transmit a lower layer signa18081'3, Although
both signals
809A, 80813 arrive at each antenna 812A, 8128 and LNB 810A, 8108, only the
layer
modulation Tit)] 802 is capable of decoding both signals 808A, 8088. The
legacy
receiver 500 is only capable of decoding the upper layer legacy signal 808A;
the lower
layer signal 808B appears only as noise to the legacy receiver 500.
[0117] Because tt3e sigmat layers may be transmitted non-coherentiy, separate
transmission layers may be added at any time using different satellites 108A,
10RD or
other suitable platforms, such as ground based or high altitude platforms.
Thus, any
composite signal, including new additional sigtaallayers will be backwards
cornpatible
with legacy receivers 500, which will disregard the new signal layers. To
ensure that the
signals do not interfere, the combined signal and noise levcl for the lowcr
layer must be at
or below the allowed noise floor for the upper layer at the particular
reoeiver antenna
812A, 812B.
101181 Irayercd modulation applications include backwards compatible and non-
baclcwardscompatible applications. "Backwards compatible "in this sense,
describes
systems in which legacy receivers 500 are not rendered obsolete by the
additional signal
layer(s). Instead, even if the legacy receivers 500 are incapable of decoding
the additional
signal layer(s), they are capable of receiving the layered modulated signal
and decoding
the original signal layer. In these applications, the pre-existi-Ag system
architecture is
., _ _ _. . _..,...
CA 02484313 2004-10-08
-23-
accommodated by the architecture of the additional signal layers. "Non-
backwards
compatible" describes a system architecture which makes use of layered
xuodulation, but
the modulation scheme employed is such that pre-existing equipment is
incapable of
receiving and decoding the information on additional signal layer(s).
(01191 The pre-existing legacy IRDs 500 decode and make use of data only frDm
tlie
layer (or layers) they were designed to receive, unaffected by the additional
layers.
However, as wi11 be described hereafter, the legacy signais may bc mod.ified
to optimally
itnplement the new layers. The pxesent invention may be applied to existitig
direct
satellite services which are broadcast to individual users in order to enable
additional
features and services with new receivers without adversely affecting legacy
receivers and
without requiring additional signal frequency.
2-5 Dg od lLator a..nd Dec.~r~r
[41241 FIG. 9 is a block diagram depicting one embodiment of an enhanced ][lZD
802
capable of receiving layered modulation signals. The enhanced IRD $02 includes
a
feedback path 902 in which the FEC decoded symbols are fed back to an
enhartced
modified tuner/demodulator 904 and transport module 908 for decoding both
signal layers
as detailed hereafter.
[01211 FYG. I OA is a block diagram of one embodiment of the enhanced
tunerlmodulator 904 and FBC encoder 506. FYG. IOA depicts reception where
layer
subtraction is performed oa1 a signal where the upper layer carrier has
already bccn
demodulated, The upper layer of the received comUincd signal 1016 from the
LAJI3 502,
which may contain legaClr modulation format, is provided to and processsd by
an upper
layer demodulator 1004 to produce the stable demodulated sigiial 1020. The
demodulated
signal 1020 is oom aunicatively coupled to a FEC decoder 1002 which decodes
the upper
layer to produce the upper layer symbols which are output to an upper layer
transport
module 908. The upper layer symbols. are also used to generate an idealized
upper layer
signal. The upper layer syinbols may be produced from the decoder 402 after
Viterbi
decoding (HSR<l 0'3 or so) or after Reed-Solornon (RS) decoding (BEIt< 04 or
so), in
CA 02484313 2004-10-08
-24-
typical decoding operations lrnowri to those skilled in the art. The upper
layer sytnbols
are provided via feedback path 902 from the upper layer deaodcr 7002 to a
remodulator
1006 which effectively produces au idealized upper layer signa1. The idealized
upper
level signal is subtracted from the demodulatscl upper layer signal 1020.
101221 In order for the subtraction to yield a clean lower layer signal, the
upper iaycr
signal must be precisely reproduced. The nzodulated signal has beer,
distorted, #or
example, by traveling wave tube atnplifier (TWTA) non-linearity or other non-
linear or
1lnear distortions in the transniission channal. The distortion effects may be
estimated
from the rcccived signal after tho fact by this invention method with which
TWTA
characteristics may be downloaded into the AtD in AM - AM and/or AM - PM maps
1018, used to eliminate. the distortion (see detailed description below). The
tirne domaiFi
response p(t) 1014 is incorporated as a signal characteristic. AIternatively,
in accordance
with one or inore embodiments of the invention, the individual TRDs 500 and
802 rnay
generate the nonlinearity curves locally, thereby eliminating the need to
transmit the
curves from the broadcast center.
[0123] A subtractor 1012 then subtracts the idealized upper layer signal from
the stable
demodulated signal 1020. '1'his leaves the lower-power second layer signal.
The
subtractor 1(312 may include a buffer or delay function to retairt the stable
demodulated
signal 1020 while the idealized upper layer signal is being constructed. The
second layer
signal is demodulated by the lower level demfldulator 10 10 and FF-C docaded
by decoder
1008 aceording to its signal Forrnat to produce the lowcr layer symbols, which
are
provided to the transport module 908.
10124J FIG. 1013 depicts another embodiment wherein layer subtraction is
perforraed on
the received layered signal (prior to upper layer demodulatiota). In this
case, the upper
layer demodulatQr 1004 produces the upper carrrier signal 1022 (as well as the
stable
demodulat$d signal output 1020). An upper carrier signal 1022 is provided to
the
recoderiremodulator 1006. The recoder/remodulator 1006 provides the
recoded/rernodulated signal w the tlort-linear distortion mapper 1018 which
effectively
produces an idealized upper layer signal. t,7nlike the embodiment shown in
FIG. 10A, i~r-
CA 02484313 2004-10-08
-25-
this embodiment, the idealized upper layer signal includes the upper layer
carrier for
subtraction from the received combined signa1808A., 808B.
[01251 Other equivalent methods of layer subtraction will occur to those
skilled in the
art and the present iixvention should not be limited to the examples provided
herc.
Furthermore, those skilled in the art will understand that the prescsnt
invention is not
limited to two layers; additional layers may be included. Idealized upper
layers are
produced through remodulation from thcir rospeative layer symbols and
sulstracted.
Subtraction may bo pcrformc,d on either the received oorrxbined signal or a
demodulated
signal. FinaUy, it is not necessraiy for all signal layers to be digital
transmissions; the
lowest layer may be an analog transmissiott.
[01261 The following analysis describes the exesnplar,y two layer demodulation
and
decoding. It will be appareilt to those skilled in the art that additional
layers maybe
demodulated and decoded in a similar manner. The incoming combined signal is
represented as:
l
SuLt t)= fu~Jll~, exp(.i~U~`-~9') 1 S,,~,la(t-mT) I
dle-an J
+fLML exp(ja),t + 9L) ~ Sj,.p(t - mT + AT.)~ + n(t)
where, Mu is the magnitude of the upper layar QPSK signal and Mi, is the
mggnitude of
the lower layer QPSK sige-ml and in general ML << Mu . The signal frequencies
and
phase for the upper and lower layer signals are respectively tvu, 8u and
nL,Br, . The
symbol timing misalignment between the upper and lower layers is AT,.õp(t -
mT)
represents tlle tirne shifted version of the pulse shaping filter p(t) 414
employed in signaI
modulation. QPSK symbols S',,,,, and S.,,, are elements of
{exPc/!)n0,1,2,3~for
CA 02484313 2004-10-08
-26-
exemplary QPS.K signals, fu(=) and f4 (-) denote the distortion function ofthe
TWTAs
for the respective signals.
101271 Ignoring fu (=) and fi (=) and noise n(#), the following represents the
combined
signal after removing the upper carrierc
.~ m
41 uL(t) - Adu Sun,P(t-naT)+Mt,expfj(o)l -- fvL,)t -f- Bi `=Oij I YSa.mp(t -
m7'+G1T,R)
m=-oo ,qo..m
Because of the magnitude difference between Mu and M,
, , the upper layer demodulator
1004 and decoder 1002 disregard the ML component of the s'r,a, (t) .
[012191 After subtracting the upper layer from s,,f (t) in the subtractor
1012, the
following remains:
.sL(t)=MLexPtJ`(a)L- wu)t+81.-BuSj,õp(t-m7'+ AT,)
~=~-~
Any distortion effects, such as TWTA nonlirsearity csffects are estimatecl for
signal
subtraetion. In a typical embociitnent of the present invention, the upper and
lower layer
frequena-es are substantially equal. Sign.ificant improvements in system
efficiency can be
obtsd.ned by using a frequency offset 'hetween layers.
(0129] Using the present invention, two-layered backward compatible modulation
with
QPSK doubles a current 6/7 rate capacity by adding a'fWTA. approximately 6,2
dA above
an. existing TWTA power. New QPSK signals may be transmitted from a separate
transmitter, fron=i a different satellite for example. In addition, there is
no need for linear
travelling wave tube amplifiers (TWTAs) as with 16QAM. Also, no phase error
penalty
is imposed on higher order modulations such as 8PSK and 16Q.AM.
CA 02484313 2004-10-08
-27-
3A Power Leyels of ModLayers
101301 In a layered modulation system, the relationship between the individual
modulation layers can be structured to facilitate backward compatible
applications.
Alternately, a new layer structure can be designed to optimize the combined
efficiency
S and/or performance of the layered modulation systeni.
3.1 Backward Compat}b1e ,,6;p,pltions
101311 The present inventiott tnay bc used in Baakw$rd Compatible
Applications. In
sucl; applica.tions, a lower layer signa] may take advantage of advanced
forward error
correction (FL'C) coding techniques to lower the overall tra.nszxaission power
required by
the system.
[0132] FXC _ i 1 A depicts the relative power levels 1100 of example
ei*rtbodiments of the
present invention. FT(i. 11A is not a scale drawing. This embodiment doubles
the pre-
existing rate 6/7 capacity by using a TWTA 6.2 dH above a pre-existing TWTA
equivalent isotropic radiated power (FMP) and second TWTA 2 di3 below the pre-
existing TWTA power. This embodiment uses upper and lower QPSK layers which
are
non-coherent. A code rate of 6/7 is also used for both layers. In this
embodiment, the
signal of the legacy QPSK signa.l 1102 is used to generate the upper layer
1104 and a new
QPSK layer is the lower layer 1110. The CNR of the legacy QPSK signal 1102 is
approximately 7 ci}3. In the present invention, the legacy QPSK signal 1102 is
boostcd in
power by approximately 6.2 dF3 bringing the new powcr lcvel to approximately
13.2 dB
above thermal noise as the upper layer 1104, The noise floor 1106 of the upper
layer is
approximately 6.2 d]3. The new lower QPSK layer 1110 has a CNR of
approximately 5
48 with an advanaed FRC such as a turbo code. The total signal and noise of
the lower
layer is kept at or below the tolerable noise floor 1106 of the upper layer.
The power
bcaosted upper layer 1104 of the present invention is also very robust, making
it resistant
to rain fade. It should be noted that the invention may be extended to
multiple layers with
mixed modalations, coding and code rates.
CA 02484313 2004-10-08
-28-
101331 In an alternate embodiment of this backwards compatible applicatiom, a
code rate
of 2/3 rnay be used for both the upper and lower layers 1 I04, 1110. In tbis
case, the CNR
of the legacy QPSK signal 1102 (with a code rate of 2/3) is approximately 5.8
dx3. The
legacy signal 1102 is boosted by approximately 5.3 dB to approximately 11.1
4l3 (4.1 d8
above the legacy QPSK signal 1102 with a code rate of 2/3) to form thc upper
QPSK layer
1104. The new lower QPSK. tayer 11 10 has a CNIt of approximatcdy 3.8 dB. The
total
signal and noise of the lower layer 1110 is kolat at or below approximately
S.3 t113, the
tolerable noise floor 1106 of the iipper QPSK layer. In this case, overall
capacity is
improved by 1.55 and the effective rate for legacy lxtDs will be 7/9 of that
before
implementing the layered modulation.
101341 In a further embodiment of a backwards conzpatible application of the
present
invention the code rates between the upper and lower layers 1104, 1110 may be
mixed.
For example, the legacy QPSK signa1502 may be boosted by approximately 5.3 dB
to
approximately 12.3 dB witli the code rate unchanged at 6/7 to create the upper
QPSK
layer 1104. The new lower QPSK layer 1110 may use a code rate of 213 with a
CNR of
approximately 3.8 dB. In this case, the total capacity relative to the legacy
signal 1102 is
approxinlately 1.78. In addition, the legacy II2,Ds will suffer no significant
rate decrease.
3.2 Non-Backward Cot~paõfible Ap.plicgtions
[01351 As previously discussed the present inveni3on may also 1c uaed in non-
backward compatible" applications. In such applications, both upper and lower
layer
signals rtiay taks advantagc of advanced forward error aorrectioti (FEC)
cad,ing techniques
to lower th.e overall transmission power required by the system. In a first
example
embodirnent, two QPSK Iayws 1104, 1110 are used each at a code rate of 2/3.
The upper
QPSIC layer 504 has a CNR of approximately 4.1 dB above its noise floor 1106
and the
lower QPSK layer I 1 10 also has a CNR of approximately 4.1 dB. The total code
and
noise level of the lower QPSK layer 1 110 is approximately 5.5 413. The total
CNR for the
upper QPSK signal 1104 is approximately 9.4 dB, merely 2.4 dB above the legacy
QPSK
signal rate 6/7. The capacity is approximately 1.74 compared to the legacy
rate 6/7.
CA 02484313 2004-10-08
-29-
jUl3b] FIG. 1113 depicts the relative power levels of an alternate embodiment
wherein
both the upper and lower layers 1104, 1110 are below the legacy signal level
1102. Thti
two QPSK iayers 1104, 1110 use a code rate of 1/2. In this example, the upper
QPSK
layer 1104 is approximately 2.0 dB above its noise floor 1106 o#'approximately
4.1 dB.
The lower QPSK layer has a CNR. of approximately 2.0 dB and a total code and
noise
leriel at or below 4.1 dB. The capacity of this enib¾diment is approximately
1.31
compared to the legacy rate 6/7.
4. ijardware Environmrni
101371 FIG. 12 illustrates an exemplary computer system 1200 that could be
used to
implement selected modules anci/or fuilctiozts of the pr4sent invention. Tht3
computer
1202 oomprises a processor 1204 and a memory.1206, such as random access
memory
(1tAlvi). The computer 1202 is operatively coupled to a display 1222, which
presents
images such as windows to the user on a graphical user interface 1218B. The
computer
1202 rnay be coupled to other devices, stcch as a keyboard 1214, a mouse
device 1216, a
printer, eta. Of course, those skilled in the art will recognize that atzy
combination of the
above components, or any number of different components, peripherals, and
other
devices, may be used with the computer ] 202:
[0138] Generally, the computer 1202 operates under control of an operatirtg
system
1208 stored in the memory 1206, and interfaces with the user to accept inputs
and
commands and to present results through a graphical user interface (ta1CTI}
module 1218.A..
Although the GUI module 1218f1. is depicted as a separate mociule, the
instractiQns
performing the GUI functions can be resident or distributed in the operating
system 1208,
the computer program 1210, or irnplcmented with special purpose memory and
proccssors. The computer 1202 also ianplements a compiler 1212 which allows an
application program 1210 written in a programming language such as COBOLr,
C++,
FORTRAN, or other language to be translated into processor 1204 readable code.
After
completion, the application 1210 accesses and manipulates data stored in the
rnemory
1206 of the computer 1202 using the relationships and logic that was generated
using the
CA 02484313 2004-10-08
-30-
compiler 1212. The computer 1202 also optionally comprises an external
communication
device such as a modem, satellite link, Ethernet card, or other device for
cotnmunicating
with other computers.
101391 ln one embodiment, instructions impleme ting the opEratiag system 1203,
the
computer program 1210, and the compiler 1212 are tangibly embodied in a
computer-
readable medium, e.g., data storage device 1220, which could include one or
more fixed
or removable data storage devices, such as a zip drive, floppy disc drive
1224, hard drive,
CD-ROM drive, tape drive, etc. Further, the operating systerin 1208 and the
computer
program 1210 are comprised of instructions which, when read and executed by
the
computer 1202, causes the computer 1202 to perform the steps necessary to
implement
andJor use the present invention. Computer program 1210 andlor operatittg
instructions
may also be tangibly embodied in niemory 1206 and/or data communications
devices
1230, thereby making a computer program product or article of manufacture
according to
the invention. As such, the terms "article of manufacturee," "program storage
device" and
"computer prograsn product" as used herein are intended to encompass a
computer
program accessible from any computer readable device or media.
[0)401 Those skilled in the art will recognize many modifications may be made
to this
cQr,figuration without departing from the scope of the present invention. For
example,
those skilled in the art will recognize that any combination of the above
components, or
any number of different components, peripherals, and other devir.es, may be
used with the
present invention.
5. Estirnatina Non- ' uitv
[0141] Referring again to FIGS. l0A and 10B, non-linear distortion maps 1018
that
depiot the uon-lineatzty of the TWTA may be used by a non-linear distortion
map module
during the layered modulation signal reconstruction process. As described
above, irt. an
exemplary receiver 802, TWTA AM-AM and AM-PM maps are applied using atx
estimated operating point to a re-encoded and re-modulated signal to more
accurately
recons"ct the upper layer signal.
CA 02484313 2008-07-18
-31-
[0142] While FIGS. I OA and l OB illustrate the use of the non-linear
distortion maps,
knowledge of the non-linear distortion maps (and operating point) must be
determined. It
should be noted that the measurement of non-linearity may be conducted in a
variety of
manners as part of the layered modulation scheme. The TWTA non-linearity may
be
measured at the local IRDs 500 or 802, in which case the operating point may
be
automatically calculated from the nonlinearity measurements. The TWTA non-
linearity
may also be made at a broadcast/uplink center 104 with the operating point
similarly
obtained, in which case information on TWTA non-linearity and operating point
can be
downloaded to individual IlZDs 500/802, such as through the downlink signal
118, to
support the layered modulation signal receiving process.
6. Measuring Non-Linearity
[0143] As described above, the measurement of non-linearity may be conducted
in a
variety of manners as part of the layered modulation scheme. A first mechanism
for
TWTA non-linearity measurement is fully described in United States Patent
Application
Publication No. 2002/0158619 Al, entitled "SATELLITE TWTA ON-LINE NON-
LINEARITY MEASUREMENT", filed on June 7, 2002 by Ernest C. Chen.
[0144] A second measurement mechanism (as described herein) may provide an
improvement over the first mechanism. In the second measurement mechanism, non-
linearity may be measured at the broadcast center or in each local IRD 500/802
(e.g.,
using a coherent averaging technique that maximizes processing gains).
[00145] The IRD 500/802 which receives the downlink signal 118 (e.g., from the
LNB
502) may also include a signal processor which extracts the symbol stream and
carrier
frequency from the incoming signal and generates an ideal signal, i.e. a
signal without the
effects of the TWTA and noise. The ideal signal is then used in a comparison
processor
to produce TWTA characteristic maps (which provide the measurements for TWTA
non-
linearity). As described herein, the signal processor and comparison processor
may be
incorporated in IRD 802 within the tuner/demodulator 904, FEC 506. The details
CA 02484313 2004-10-08
..32-
concerning the generatiori c,f the characteristia maps will be described below
in the
discussion of FIGS. 13A - 13D.
[4146] Typically, the TWTA characteristic maps comprise measurements of the
output
amplitude modulation versus the input amplitude modulation (the AM-AM map) and
the
S output phase xnodulation versus the input arnplitude modulation (the AM-PM
map). The
received signal represents the TWTA amplifier output (plus noise) and the
genemted ideal
signal represents the amplifier input. ln addition to diagnosing and
monitoring the
amplificr, thcse charaetcristic maps raay then be used to fsciiitate artcl/or
improve
reception of lower layer signals of a system using a layersd tnodul.ttion
tra.nemissiois
scheme.
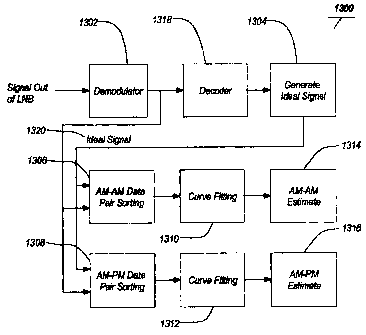
[0147] FIGS. 13A. 13B, and 13C are block diagrams of the basic system 1300 for
measuring the characteristic maps. All of the described functions may be
carried out
within a receiver 802 used in a direct broadcast satellite system having a
basic architecture
as described above. The appropriate signal section is captured and demodulated
by
demodulator 1302 which aligns syzubol timing and removes any residual carrier
frequency
and phase in the signal. The demodulated signal is used in a signal generator
1304 to
generate an ideal signal, i.e. one representing the pre -trannsmitted signal.
In the aase of a
digital signal, the signal will be further decoded to obtain the signal
symbols which will
be used to generate the ideal signal. The difference between the ideal signal
and the
received signal is used by processors 1346, 1310, 1308, 1312 to estimate a
transmission
non-linearity characteristie. Only a sniall section of the rcccived signal,
typically
thousands of symbols, may be nccdcci to obtain an estimate depending on the
CNR of the
received signal.
[01481 FIG. 13A depicts an embocliment where the non-linearity characteristic
is
estirnated from a difference between the generated ideal signal (noise-free
and without
TWTA non-iinearity) and the received signal after demod'ulation (and FEC
decoding and
remodul$tion as necessary). Because the ideal signal can be easily generated
from only
the syinbols and syrnbol tiniing, obtaining the estimate from the received
signal after
demodulation simplifies the processing.
CA 02484313 2004-10-08
-33-
[0149] FIG. 1313 depicts an entbodiixtent where the perfortnance
characteristic is
estimated from a difference between the ideal signal and the received signal
before
demodulation. In this case, the ideal signal must also be generated with the
carrier
frequency of the received signsl. This may be done by adding the demodulated
symbol
timing and carrier frequency end phase to the ideal signal.
101501 FIG. 13C is similar to F.iG. 13A in that it depicts an embodiment where
the non-
lineatity aharacteristic is estirnatcd from a dif#'ercnce betvveen the
gencrated idcal signal
(noise-free and without TWTA tlon-linearity) snd the reoeived signal after
demodulation.
As in FIGS. 13A and 13r3, the measaarement procedure starts with capturing a
received
signal and generating (1304) an icieal signal 1320 that is noiseless and
without TWTA
nonlinearity. The ideal signal 1320 is generated by re-encoding and re-
modulating the
symbols decoded with qua$i-error-free (QEF) performance (as described above).
The
ideal signal 1320 represents the input to TWTA 816 and the captured signal
represents th+e
output of TWTA 816 (with noise).
(01511 In normal cQnditions, non-Iinearity widens the signal bandwidth through
1'M-3
(third-order inter-modulatioti), etc.. Ftuther, various noise and interference
may impair the
non-linearity measurements. laor example, thermal noise (additive downlink),
phase nc+ise
(I.NB, tuner) and other interferetices (CCI, ACI, lower-layer signal) may
impair the
measurements. Such impairments typically will not bias the AM-AM and AM-PM
estimates. On the other hand, tiltering along signal path generally reduces
the observable
non-lfne$rity.
101521 To account for the filtering effects, an inverse Filterlequalizer 1322
may be used
to improve the measurenzent accuracy by restoring the u.n-filtered signal
(i.e., it recovers
invisible non-linearity)_ Accordingly, thE embodiment illustrated in FIG_ 13C
provides
for using an inverse filter andlor equaliz,er 1322 to undo the filtering
effect so that TWTA
nonlinearity may be restored for most aecura#e measurements. A linear
equalizer 1322
may be used to estimate and reniove linear channel distortions and multi-path
ef`fects over
the entire signal path. Thus, the linear equalizer/inverse tilters 1322
effectively perfortns
inverse filtering to "cancel" the combined filter effects. For exatnpla, the
inverse filters
CA 02484313 2004-10-08
-34-
1322 rnay estimate and remave linear ehannel distortion caused by satellite
+DMt'!X filters
(which may have a significant effect), IRD front-end low pass filters (LPF)
(which may
also have a major effect since bandwidth is usually limited), and/or other
filters between
the TWTA and the received/captured data. However, certain filters may not
effect the
signal. For example, an iMUX filter may have little effect since it happens
prior to the
bandwidth-widoning effect of TWTA nonlinearity.
141531 In all of the einbodiment (i.e., illustrated in FIGS. 13A, 13B, and/or
13C) the
ideal signal and the received sigrlal are next used in processors 1306,1308 to
pair and sort
data points of the two signals in a two-dimensional scattcrgram (a scattergram
for
purposes herein is the collection of paired points with input and output
values represented
along X and Y axes, respectiveiy). Thefie processors 1306, 1308 characterize a
relationship betweeii an input sivi*al aiid an output signal of the arnplifier
plus noise. In
this case, the input signal is represented by the generated ideal signal 1320
(re-modulated
or otherwise) and the output signal is represented by the received sigrial.
The X-axis of an
AM-AM scattergratia plots the inagnitudes of the ideal signal samples before
TWTA
nonlinear distortions, and the Y-axis consists of the magnittides ofthe
received signai
samples including the TWTA non-iinearity (and noise). An AM-PM scattergram is
similarly formed. The X-aais is the same as that for the AM-AM saattergrarn,
and the'Y-
axis consists of all phase differences between the corresponding samples with
and without
TWTA non-linearity.
[0154] Accordingly, the two signals are aligned sample-for-sample by ehe tiini
g
recovery loop of the demodulator 1302, and data pairs arc formui for all
corresponding
samples. The data sorting (1306 and 1308) sorts the data pairs to the powers
of the ideal
eignal aamples. For example, the re-generated ideal (lin+a$r) signal samples
are sorted in
power/magnitude. The received (nonlinear) signal samples rernain tagged to the
re-
generated signal samples after rG-ordering.
[0155] At this point in the process, the embodiment of FIG. 13C diverges from
the
embodiments of p'1GS. 13A and 13B. The averaging process illustrated in FIG.
13C
coheretitly adds a given nunzber (representing the averaging ratio) of
adjacent sorted
CA 02484313 2004-10-08
-35-
TWTA input signals for averaging (i.e., using coherent averaging processors
1324 and
1326) to reduce noise effect. The averaging ratio to be used depends on signal
CNR and
on the quality of the nonliuearity meastirexnent that is required for a given
application.
Accordingly, measurement inapairments may be compensated by increasing the
averaging
ratio. For uncorrelated or little correlated noise and interference samples,
the averaging
process can increase the quality of ata unbiased estimate by 3 dI3 for every
doubling of the
averaging ratio. However, as described above, the presence of filters along
the signal path
before the data is collected caaa reduce the accuracy of the estimate.
Including the satellite
OMUX tilter and IRD fYont-anct low pass filter (>:.JPF), in-path filters can
hide a part of the
nonlinearity from the coptured data.
101561 The use of coherent averaging improvoe TWTA AM-AM and AM-PM +estirnates
without creating a measurement floor across all input signal powers and works
with both
clas$ic or layer-modulated signals. Further, the coherent averaging permits
TWTA non-
linearity to be measured by individual IR17s thereby avoiding the need to
downioad
TWTA tables to the W if desired.
[01 S7j As part af tlie coherent averaging, the average powers (operating
poitit) of the
input and output signals as well as the actual AM-AM and AM-PM curves may
first be
rescaled to 0 dI3 and 0 degree respectively for convenience of subsequent
processing. The
sorted linear and nonlinear signals are then coherently averaged with the
averaging ratio
depending on the input signal CNR and quality of non-linearity measureinsnt
required as
de.scribed above.
101S81 If necessary, forward error correction (FEC) may be applied to the
demodulated
signal followed by a re-encodin,g and remodulation process to ensure that all
recovered
syrnbols are orror-fraa.
101591 After the sorting (i.e., in FIGS. 13A and 13B) and coherent averaging
(i.e., in
FItI. 13C), the data points of the ideal signal and the corresponding data
points ofthe
received signal are processed by a processor 1310, 1312 to forin a line
through curve
fitting, such as with a polynomial. The result is an estimate of the desired
performance
characteristic of the TWTA 131 4, 1316.
CA 02484313 2004-10-08
-3b-
[OX6a1 FIG. 13D outlines the flow of a method of the present inventiQn. A
signai is
received at block 1328. The signal is deniodulatedi at block 1330. Then an
ideal signal is
generated from the demodulated (and decoded, re-euooded and remodulated as
necessary)
signal at block 1332. At step 1334, the received signal (either before or
after
demodulation) and/or the ideal signal (eitlier with or without re-modulation
correspo.ndingly) is coherently averaged to redttce noise. Finally, a
performance
characteristiG (i.e., a TWTA non-linearity curve) is estimated from a
difference between
the ideal signal (coherently averaged or prior to averaging) and the
coherently averaged
received signal at block 1336.
[0161] As describeci above, the coherent averaging 1334 and estimatinZ 1336
steps may
be pcrformcd by alignitig the rcceived signal and the ideal signal sample-for
sample,
forming data pairs for corresponding samples, sorting the data pairs to powers
of the ideal
signal sazxzples, artd coherently averaging the received signals to reduce
noise. Such
coherent averaging provides the capability to average complex numbers instead
ofinerely
exainining the rnagnitude of the sigrtals. In this regard, the coherent
averaging process
coherently adds a nuiatber of adjacent recciving signal samples, with the
number of
samples representing the averaging ratio. In addition, as described above, an
inverse filter
andlor lineAr equalizer may be used to process the received signal to restore
visible
nonlinearity.
7. C9f.t'se ing( hifting) the TWTA Non-linearityAdeasuremen1
[01 G2j Ttidependent of the operating point estimation described above, the
measured
AM-AM and AM-PM curves may be deliberately offset or shifted to simpiify the
reconseruction of the upper layer signal during the signal reconstruction and
cancellation
process. Such an offset does not alter the performance of layered modulation
proceseing
(or non-linearity oompensation perforn-iance). XLn fact, offsetting the
operating point may
result in a simple and consistent representation of TWTA non-linearity
regardiess of input
aaturation, input backoff, etc.
CA 02484313 2004-10-08
-87-
(q1631 To offset the measurement curves, the input and output amplitude values
(i.e.,
used during the non-tineArity curve nieasuremetit) may be resealed so that the
operating
point is at a desired reference point (e.g., 0 dB), for both input and output
(e.g., thereby
providing referenced opcrating point values). In the log domain, such
rescaling may be
performed by subtracting the measured (AM) input operating point value (in dB)
from all
input values (in dB). Likewise, the tiieasured output (AM) operating point
value (in d8)
may be subtracted from values of all output points (in dH). Thus, by
offsetting the
measurement curves, the curves may be more easily referenced. In silicon and
other
hardware implementations, however, it may be desirable to scale the input and
output
operating points or signals back (e.g., to -3 d13 or -S dH) to avoid signal
saturation or
ftctianal value rcpresontation overflow for incoming (idea)) and outgoing
(received)
signals. The shifting process can be done similarly to that described above.
101641 With a stiifteci AM scale as desired. the output PM value may also be
rescaled by
subtracting the measured (angular) phase value at the output operating point
from the
phase value of aIl output points.
(0165) The results of the above scaling is that the operating point will
provide
convenient reference values, such as (0 dB, 0 dF3) for the AM-AM map, and
(Ddf3. 0) for
the AM-PM map. In this example case, the input signal is scaled to 0 dB to
match the
operating point. To guard agaitzst signal out-of-range errars (and to avoid
the need for a
look-up-table CL,LIT) extrapolation), bounding points may be placed beyond the
measured
sig"t interval in the constructed naniinearity rnaps. The values for the
bounding points
may be obtained by extrapolating or replicating values from the endpornts of
the TW'.CA
measurement values.
.1'igs 14A and 1 4B sinzulate the recciver pcr.formance impact of an error
(o.fbst
point or U.P.) in the assumed operating points on example TWTA nonlinearity
curves.
The perfox-mance is expressed as aai effective noise in M relative to signal
power. Fig.
14A shows the effective noise when the actual operating point is at TWTA
saturation.
1~'ig. 14B shows the effective noise when the actual operating point is 8 dB
backed off
from TWTA saturation. Errors are calculated assuming uniform (unweighted)
CA 02484313 2004-10-08
-38-
distribution of the signal power as well as assuming weighting by the
histogram of the
signal samples in power. Fig. 14B is significantly better than Fig. 14A. due
to the reduced
nonlinearity with TWTA. backoff.
8. Effect pf Coherext Averaging
[01661 Various cotYtputer simulations may be used to illustrate the effect of
coherent
averaging in accordance witli one or more embodiments of the invention. The
simulations described hereiu use a generic set of TWTA nonlincarity curves and
the
signals for all layers assuxue a QPSK forrnat.
(0167] FIG. 15 shows atZ estimate of the TWTA nonlinearity in a benign
scenario, in
which there is only one layer of signal (such as with a convcntional QPSK
signa.l) and no
noise is added. Howcver, a sigtYificant amount of phase noise is added in the
raw data,
neGessitating the demodu}ator 1302 to track out most phase errors and reveal a
stable
constellation in the (1,Q) space. The averaging ratio is 1024, n-ieaning that
groups of 1024
neighboring data are coherently averaged for the individual input and output
signals. This
results in 128 collapsed coinplex data pairs from a raw data set of 131,072
(1024 * 128),
covering 1.3 ms in real tiane based on a san-tple rate of 100 NrMz and a
symbol rate of 20
MHz (with a $: l over-sampling ratio). The 128 complex numbers each of the
input and
output signals are converted to (input amplitude, output amplitude) and (input
amplitude,
phase difference) before they are separately fitted with a 5-th order
polynomial (with a
total of 6 polynomial coefficients). 1'ncreasing the degree of fitting
polynomial might
improve nleasurement accuracy for AM-PM curves that are more compiex.
[0168] The fitting AM-AM and AM-PM curves are showtY to very closely track the
actual. AM-AM and AWPM curves in the Figure. The difference power bctwcen the
measured curve and the actual curvc, wcightcd by the histogram of the input
signal power,
is -40.6 ti13 rclativo to the input signal power. The weighting histogram is
formed from
the input signal and can be seen overlaid with the nonlinearity curves uz FIG.
15. For
coxnpaTison and rESferenCe ,ptitposes, au unweighted error is calculated to be
-37.4 dB.
CA 02484313 2004-10-08
-39-
4nly the weighted performance wi11be relevant to the present appliaatian since
ths
satellitc signa! has an ainplitud$ distribution depicted by the signal
histogram in FIG. 15.
d
[0169) FIG. 16 shows the first 16,384 of the 131,072 data pairs of raw data
from FIG.
1S before av raging. The 16,384 pairs represent a duration of 164 s in real
time.
Without noise added to the raw data, the demodulated signal moderately spreads
out in
amplitude and phase consistent witii the performance of the oaxrier recovery
loop in the
demodulator 1302. Note liow averaging and subsequent polynomial fitting reduce
the
data to curves closely inatchir,g the true ones shown in FIG. 1S. Naturally,
one may use
templates or polynomials other tlian power polynomials for curve fitting, such
as the
Legendre polynomials.
101701 FIG. 17 is similar to FIG. 15, except that a redticed number of 16,384
data pairs
a.re included. The averaging ratio is 128, meaning that groups of 128
neighboring data are
coherently averaged for the individual input and output signals. This results
in 128
collapsed complex data pairs from a raw data set of 61,384 (128 * 128). The
error
perforniance is -41.1 dB. Comparing the error pcrformance with the performance
from
131,072 samples in FIG. 15, it may be concluded that as few as 16,384 data
pairs can
provide nearly full measurement accuraay for a signal with a strong carrier to
noise ratio
(CNR).
101711 The averaging and fitting process for FIG. 17 is repeated for sixteen
(16)
consecutive sets of 16,384 data pairs each. The short-term performance of the
error
performance is plotted in FIG. 18 that illustrates the quality of the fitted
AMlPM curves.
FIG. 18 demonstrates a Consistent nieasurement accuracy around --40,7 ctB.
[01721 A lower-layer signal atld sonle Gaussian noise may be added to test the
robustness of the measurement me:thod described herein. FIG. 19 illustrates
the layered
signal AMIAM and AIvill"M data after averaging (and the addition of the lower-
layer
$ignal and Gaussian noise). The lower-layer signal is at -8.4 dH from the
upper-layer
signal, and the.thermal noise is at -16 d.B frony the upper-layer signal. The
lower-layer
signal and additive noise combine to form an eftlective noise floor for the
uppor layer
signal 4t -7.7 d13 &om the upper-layer signal. The weighted measurement error
is -38.5
CA 02484313 2004-10-08
-40^
dB. Sucll good measurament performance is very significant consldertng that lt
is only
2,1 dB worse than that in FIG. 15, which did not include noise or interference
impairments. This level of perfonnance is expected to be sufficient for most
layer
modulation applications. One can therefore draw a conclusion that a local IRD
can
measure TWTA nonlinearity with the accuracy needed for lay'ered modulation
applications. Furthernaore, the perforrnance of FIG. 19 may be improved by
increasing
the averaging ratio, at the expense of increased data buffer and processing
time.
101731 Showing much spreadiii,g in A.M and PM curves, FIG. 20 (illustrating
the layered.
signal raw AM-PM data) is the counterpart to the noiseless case of FIG. 16.
Afker
averaging and fitting, the segnient of 16,384 data pairs is'reduced to the
curves in FIG. 21
(illustrating the layered signal fitted AM/AM and AM.IPM data), which has a
weighted
error of -36.3 di3. A sllort history of errcr perfornxance similar to that in
Gha.rt 18 is
shown in FIG. 22 (illustrating the layered signal quality of A.MIPM
estYmat.es), with 16
segments from 16,384 adjacent data pairs each. The average error over 41116
segments is
-36.4 cif3.
101741 FIG. 23 adds the effect of an example WUX filter. Within the CNR
c.alculation
accuracies, the weighted performance of -39.1 dB for FIG. 23 is little changed
from the --
3F.5 dB value of p'IG. 19 witlzout the filter. Such results are consistent
with the #iact that
the input signal into the TMUX filter is well constrained within the
designated signal
bandwidth and that thci iiaput signal is generally little affected by the
IM1(.)'X filter.
[0175] To continue addiiig impairitlents to the data to test the nonlinearity
measurement
technique, a symbol baud rate offset ratio of 10-5 is next included in the
received data as
iUustrated in FIG, 24. The slipping between data symfaois and A/D clock forces
the
timing recovery loop in. tii+e demodulator 1302 to employ an interpolator that
brings along
certain filtering effects that are commensurate with the interpoiator
perfortnance, The
results in FIG, 24 show an error of-:36.s d8. This coinpa,ros with -=39.1 irt
FIG. 23
without the baud rate offset.
CA 02484313 2004-10-08
-41-
101761 Likewise, a sample history of the estimatian performance over the
series of
16,384 data pairs is showxz in FIG. 25, indicating an average performat7ce of-
35 d13. This
compares with -36.4 d13 in FIG. 22 without the baud rate offset,
J01771 Next, an OM1JX filter is added to the simulated data. The performarlce
of-33.S
dB in FIG. 26 compares with -36.8 dB of IFIG. 24 before adding the filter.
101781 FIG. 27 illustrates perforinaiice with the addition of a 4-th order
Butterworth
f.PF filter, which represents an atiti-aliasing filter at tlte receiver front
end, with a 3-dB
bandwidth of 14 MHz. The error pcrformance drops significantly to -23.6 d8,
indicating
a large impact of the LPF filter on nonlinearitymeasurement performa.nae, As
illustrated,
the 14 MHz filter is much nan-ower than the (7M'UX filter and therefore
irnposes a heavier
impact an the observability of the TWTA nonlinearity.
[01791 The next several figures present measurement results from a laycr-
modulatod
signal emulated from two QPSK satellite signals. The laycr-modulated signal is
processed to prc+duce tiieasurecl AM/AM and AM/PM curves. The measured curves
are
compared with tise known eurves provided for perfortnrance evaluation.
[4180) Comparing with FIG. 27, FIC~.T. 28 plots the measured nonliriearity by
emulating
layer-modulated signal from captured signal-layer signal. The upper-layer
signal is from
an exasilple non-iinearized TWTA with ati input backoff, and the lower-layer
sign4l is
from another example linearized TWTA. driven at saturation. The lower-layer
signal is
attenuated appropriately before it is combir.ed with the upper-layer signal to
from the
emulateci laycr-niodulaterl sigiial. The 3-4B bandwidth of the i1ZS.] front-
o.nd LPF is 21.4
MHz. Other, processing parameters are similar to those described above.
Results from
processing a 1.3 ms worth of drata captured at 100 MHz show an error
performance of--
27.8 dB. Accordingly, FIt3. 28 illustrates the diff+erence between the
measured TWTA
nonlinearity and the manufacttirer-provided TWTA nonlinearity, the latter
being'based to
form the sirnulated data.
(01$11 FIG. 29 ilitistrates the AM/PM estimate RMSE (root mean square error)
history
which contains only one data segnaent processed from a short captured data
ireterval
length. The figure illustrates an unweighted nanlinearity measurement error of
20.9 dB.
CA 02484313 2004-10-08
-42-
101821 FIG. 30 illustrates a signal power histogram and error contributions of
the
recQnstructed signal from the processed data segment. The signal power
histogram is
shown as a thin curve in the top half of the window. The histogram is
accompanied by an
etxor contribution profile shown as a thick solid curve, which is the product
of the signal
histogram arzd the error between measured and actual nonlinear curves of p'1G.
28, The
error contribution profile integrates to the weighted error of -27.8 dH.
Likewise, in the
lower half of the window, a uniform "histogram" and a corresponding error
contribution
prohie are overlaid for unweighted perfommce. The error contribution profile
integrates
to an unweighted error of -20.9 dk3.
[0183] FIG. 31 is a sigtzal proeessing diagram for the production of several
subsequent
p1Qts/Figures to show how TWTA noi1linearity reduces available signal power
and how a
raceiver matched filter actually reduces the apparcnt impact of TWTA
nonlinearity in
terms of residual CNR that was calculated above. To evaluate measurernent
performance,
an ideal linear signal, denoted as L1No, is again first generated from the QEF
syrnbols
decoded from the upper-layer signal as part of the layer-detttodtilation
process. LINa is
distorted with the actual AM/AM and AM/PM curves to form signal ACTo. The
idGal
signal is also distorted With the nieasursd AM/.A.IYI and Alb!/PM curves to
form signal
MEAo. After rnatclling the.overall magnittide and phase between signals being
cornpared.,
two error signals are comptited: cl is the difference between ACTa an.d
1r.INo, and e3 is the
difference between MEAo and ACTo. LTNq, ACTo and M`..EA.e are processed with
the
receiver matched-filter, which is a root-raised cosine filter (RRCF),
resulting in signals
LINM, ACTM, and MEAM, respec:tively. Two error signais ttre formed ftom the
match-
filtered signals: E2= ACTM _. LINm and c4 - 1VIP-Am - ACTM. P+awers of the
above signals
are computed by adding the squares of the inagnitudes of the signal samples to
.normalixe
the results.
101841 FIG. 32 overlays the spectrum of signal f.INo which is boftrre rantchod-
filtering
and the spectY'utn of signal 1/INm which is after matched-filtering. Both
si$ttals are well
confinGd within a bandwidth of+I- 12 MIKz from the oentor frequency. The two-
sided ~...~,._.
CA 02484313 2004-10-08
-43-
bandwidth of 24 Iv.EHz corresponds to a symbol rate of 20 MHz plus an excess
bandwidth
ratio of 20%.
101851 FIG. 33 illustrates the upper layer output signal with actual AMJI'M
nonlinearity.
Specifically. FIG. 33 sliows the spectruitt of signal AG"To with the actual
TWTA
nonlinearity. Two tiers are visible on either side of the spectrum: a near
tier that comes
from IM-3 (inter-modulation order 3) and a far tier that comes fram lM-5
(inter-
modulation order 5). These tiers reduce signal power by approximately 0.25 dB.
In
comparison, the matched filter reduces sigital power by 0.28 dfi. The dotted
curve for the
matched-filtered signal indicates that the nonlineatity beyond +/- 12 MHz is
removed by
the receiver RtCF.
[012I6j F1G. 34 illustrates the upper layer output signal with measured
AM/Plvf
nonlinearity. Specifically, FIt<"s. 34 shows the spectnun of signal M1rAo at
the output of
the measured nonlinear'x'WTA. '1'hc two tiers of intermodulation are down
fxorn those in
FIG. 33. Such a reductior, is due to thc: ainount of observaGle TWTA
nonlinearity
becoming arnaller after the fi3t+arisig tlarraws down the re-grown spectrurri.
[4187] FIG. 35 illustrates the difference between actual and tneasured
nonlinear signals,
i.e., the measurctilent errors. The solid curve shows the spectrurn of the
difference, signal
between ACTo and .MfiAo. The difference signal integrates to approximately -28
dB
relative to the linear signal. Tho dotted curve represents the difference
signal between
matched-filtered A.CTM and signal MEAM. This second difference signal
i.ntegrates to -
33 dB relative to the linear signal. The improvement of 5 dB after matched-
#iltering is
due to the receiver RRCF filtering out a signiftcant portion of the
nonlinearity which does
not contribute to the desired signal, Tlie -33 dB value is for the portion of
the curves
within the 24 MHz signal bandwidth. Further, it should be noted that arl
errcars presented
in FIGS 15-31 were measured over the entire speciruyn without matched
flltcring. It is
observed that matched filtering can reduce thc nontinearity cffect by 4 to S
d8, by
removing the error power due to IM3 which expands the signal bandwidth by
approximately a factor o f 3.
_, .. .,. : .U.._
_ _ ._...,..~
CA 02484313 2004-10-08
-44-
jU1 gSj FIG. 36 illustrates the difference between nonlinear signals and
linear signals.
Specifically, FIG. 36 illustrates the iinpact of TWTA nonlinearity without
nonlinearity
compensation. The solid curve draws the spectrum of the differettce signal
between
AC'To and LINo which are without matched filtering. This error signal
integrates to -19.6
dB relative to the linear signal. The dotted curve with matched filtering in
FIG. 36
integrates to -22.9 dB, for a 3.3 dl3 reduGtion. Recall that the TWTA for the
captured and
simulated data is backed off by 8 dB in input power to operate in a more
linear region.
Naturally, operating closer to saturation could significantly increase the
difference signal
power. Comparing the -22.9 dB value of rYG. 36 with the -33 da value of FTG.
35, one
realizes that cornpensating with the measured TWTA. nonlinearity reduces the
nonlinearity impact by about 10 dB in this case.
Cflnclusion
101891 This concludes the description of the preferred embodiments ofthe
present
invention. The foregoing dcscription of the preferred ertlbodiment of the
ilivention has
been presented for the purposes of illustration and description. It is not
intended to be
exhaustive or to limit the invention to tlae precise form disclosed. Many
modifications
and variations arc possible in Dight of the above teaching. For example, it is
noted that the
uplink configurations depicted and desciibed in the foregoing disclosure can
be
implemented by one or more hardware modul.es, one or more so#iware modules
defining
instructions performed by a processor, or a combination of both.
[Qf 9QJ As described above, coherent averaging enhances tlte processed signal
and
downplays the non-coherent noise and interference. As a result, 4veraging
significantly
improves the performance of TWTA AM-AM and AM-PM estimates. Since coharcnt
a.veragirtg is zero-meanuat;, the rneasurement floor disappcars with the
process. One does
nox neect a very strong singlc-layored signal with a large r+aceiving antenna
to accurately
estirnate the TWTA nonlinearity. In other words, TWTA nonlinearity may be
measured
from a layer-modulated signal and at an individual IItD in the field rather
than at the
broadcast center with a large antenna. This operation flexibility may
significantly reduce
CA 02484313 2004-10-08
-45-
the cornplexity of the communicatiorys system, with eliminated needs to
transmit TWTA
nonlinearity data in the traffic.
(01911 In addition to the above, linear filters in signal propagation path
prior to data
capfi.urrng can reduce observable TWTA nonlinearity. Lost nonlinearity may be
recovered
by using an inverse filter or equalizer. Further, the memory buffer required
to store the
captured data for data sorting and coherent averaging may be shared with the
delay buft'er
that is already part of a layered mcdulation receiver.
[0192] it is intended that the scope of the invention be limited not by this
detailed
description, but rather by the clain3s appended hereto. The above
specitlcation, exauuples
and data provide a complete description of the manufacture and use of the
apparatus and
method of the invention. Since many erxltiodirnents of thc invention can be
maie without
departing from the scope of iha invantion, the invention resides in the claims
hereinafter
appersdcd.