Note: Descriptions are shown in the official language in which they were submitted.
CA 02567137 2006-11-17
WO 2005/116623 PCT/US2005/016463
1
POINT OF CARE HEPARIN DETERMINATION SYSTEM
Field of the Invention
The present nvention is related generally to medical patient care systems.
More
specifically, the present iiivention is related to systems for measuring
polyion levels in a
solution. Even more specifically, the present invention is related to systems
for measuring
heparin (including low molecular weight and unfractionated) levels in blood.
Background
Heparin is an anti-coagulant commonly used in some surgical procedures.
Heparin
is used in high doses in most open-chest heart procedures. The two most common
types of
open-chest heart procedures are the arrested heart surgical procedure, in
which the patient
is put on a heart-lung bypass machine, and the beating heart surgical
procedure. The
heparin significantly reduces clotting or coagulation of the patient's blood.
At the end of a procedure, the normal clotting of the blood is once again
desirable.
In order to effectively remove the heparin from the patient's blood, protamine
is added.
The protamine binds to the heparin, deactivating the heparin. The heparin-
protamine
coinplex is then cleared from the body by the liver.
It is necessary to determine the amount of heparin in the patient's blood at
several
points in time. As some patients may have heparin already in their system, an
initial
determination of the baseline heparin concentration may be required. After
heparin is
added, the heparin concentration is determined to insure that the heparin has
been properly
added. While the patient is heparinized, the heparin concentration is
monitored to insure
that the heparin concentration is maintained above a threshold level. In order
to determine
the proper amount of protamine to add to deactivate heparin, the concentration
of heparin
should be determined. After protamine is added, the heparin concentration may
again be
determined to insure that the heparin has been properly deactivated.
Several methods of determining or inferring heparin concentrations are
currently
used. In one method, the patient's blood is drawn and sent to a laboratory. In
the
laboratory, the heparin may be titrated with protamine until the heparin has
been entirely
bound to protamine. The concentration of heparin may then be determined as a
function
CA 02567137 2006-11-17
WO 2005/116623 PCT/US2005/016463
2
of the stoichiometry of the protamine titrant used. The stoichiometry of the
protamine
may be determined by titration against standard heparin samples. The method is
far from
ideal for use in providing timely feedback to the treating physician, due to
the time lag in
obtaining results.
A more commonly used method for heparin measurement in the central lab setting
is a colorimetric anti-Factor Xa (FXa) assay. This assay is a standard feature
on several
analyzers and is performed on plasma samples. It uses the principle of heparin-
mediated
inhibition of FXa. The drawback of this assay is that it needs to be corrected
for
hematocrit (since it is performed on plasma) as well as the source of heparin
(if it is a
variable). This assay is more suited for testing high number of samples and is
not
conducive for testing a few samples. Another significant drawback is a high
turnaround
time, since this is a central lab test)
In another metliod, an Activated Clotting Time (ACT) test is used. In this
test, the
time required for the patient's blood to clot is measured and used to infer a
likely heparin
level. This method is indirect, and may produce misleading results, as the ACT
values
may be affected by hemodilution and hypothermia. This method does not directly
measure heparin and has limited accuracy.
In still another method, the heparin concentration is localized to a range
using
multiple protamine samples by using a property of the heparin-protamine
interaction. The
time required for the heparin and protamine to bind is minimized when the
amount of
protamine approximates the stoichiometric amount needed to exactly bind the
heparin.
Insufficient or excess protamine results in longer clotting times. The HEPCON
Hemostasis Management System (HMS) available from Medtronic, Inc. (Minneapolis
Minnesota) makes use of this property.
The HMS assay system is based on a protamine titration and uses clot formation
for end-point detection. The assay is performed in a cartridge containing four
to six
channels that contain different ainounts of protamine as well as dilute
thromboplastin (to
accelerate clot fonnation). The end-point of the titration is the detection of
clot formation,
which is determined by measuring the rate of fall of a plunger mechanism in
each
cartridge. The channel containing the smallest quantity of protamine that
completely
neutralizes the heparin exhibits the shortest clotting time. The heparin
concentration is
measured from the quantity of protamine in that channel (on the basis of the
heparin-
CA 02567137 2006-11-17
WO 2005/116623 PCT/US2005/016463
3
protainine stoichiometry). Each Hepcon cartridge thus tests a limited range of
blood
concentrations.
The HMS system can utilize up to 12 different cartridges having differing,
known
protamine amounts within. The treating physician can estimate the expected
range of
heparin and select a limited nuinber of cartridges in this range, nominally
two from the
range of cartridges. A syringe filled with blood is inserted into a machine
that injects the
blood into the selected cartridge. Clot formation is used for end point
detection. Within a
few minutes, the cartridge having the proper amount of protamine is
automatically
indicated, along witli a heparin concentration. Use of this device requires
the initial
correct estimation of heparin, requires a few minutes to run, and has accuracy
limited to a
discrete range of heparin concentrations based on the resolution of the
protamine titration.
Numerous cartridges must be stocked if the entire range of possible heparin
concentrations
is to be measurable. The cartridges have a limited shelf life and must be
discarded if not
used within the shelf life.
The titration of heparin with protamine has been studied in academic,
laboratory
settings, but has not resulted in any patient point of care devices that could
be used to
provide timely heparin concentrations to a treating physician. Several
obstacles should be
overcome in order to provide the ideal point of care heparin measuring device.
A rapid
and accurate measurement sensor, an accurate reference or baseline determining
system,
suitable disposable cartridges, and systems for handling and analyzing all of
the above
would be desirable and have not yet been developed.
Summary of the Invention
The present invention provides methods and devices for automatically
determining
heparin (including low molecular weiglit and unfractionated heparin)
concentration in
fluids such as blood. The devices and methods of the present invention can be
used in a
point of care device, providing rapid determination of a patient's blood
heparin
concentration automatically.
Cartridges including protamine ion sensitive electrodes (ISEs) and reference
electrodes and systems for automatically determining heparin concentration in
the
cartridges are provided. Some systems add blood to a protamine bolus
sufficient to bind
all heparin, leaving excess protamine. The excess protamine concentration can
be
CA 02567137 2006-11-17
WO 2005/116623 PCT/US2005/016463
4
determined by measuring the initial slope of the electrode potential rate of
change, and
comparing the slope to known protamine concentration slope values. In some
cartridges,
an oscillating pressure source moves the blood-protamine mixture back and
forth across
the protamine ISE.
In one method according to the present invention, a known volume of the blood
sample is drawn or injected into a cartridge sample port, where the cartridge
has been
preloaded with a known quantity or bolus of excess protamine sufficient to
bind all the
heparin expected in the blood sample. The protamine can be positioned in the
sample port
or fluid path such that the protamine is mixed with the blood. The mixing is
effected in
some metllods by applying a varying or oscillating pressure to the cartridge
fluid path
through a pressure port, which may be the same port or a different port as the
sainple port.
This varying pressure can be applied through a motor driven syringe to vary
vacuum
and/or positive pressure to the fluid path, which can move the blood sainple
and protamine
back and forth in the coluinn to achieve mixing.
The blood-protamine coinbination can be moved to the protamine ISE region of
the fluid path in the cartridge through application of pressure or vacuum, and
allowed to
wet the protamine ISE. The back and forth movement of the fluid column can be
begun
again, and the change in EMF measured for about one minute in some methods. A
few
EMF measurements can be taken at around 30 seconds after the renewed fluid
movement,
and the slope of the EMF vs. time determined. A previous set of calibration
values taken
for kknown concentrations of heparin using a similar cartridge and method can
then be used
to obtain the unknown heparin concentration.
In one method, blood samples having known heparin concentrations have the
initial slope measured using the apparatus. A plot of the log of the initial
slope vs. the
heparin concentration yields a substantially straight line. The higher heparin
concentrations leave lower remaining protamine concentrations which produce a
smaller
protamine ISE EMF rate of change (lower curve slope). A calibration log plot
of the
initial slopes produces a substantial straight line relating the log of the
initial slope to
heparin concentration. Thus, taking the log of the initial slope can provide
the heparin
concentration for an unknown, by using the calibration data.
Protainine ISEs can include polyurethane polymer, DNNS ionophore, and NPOE
plasticizer. The polyurethane may include hard segments and soft segments,
where both
CA 02567137 2006-11-17
WO 2005/116623 PCT/US2005/016463
hard and soft segments may include cyclic and straight chain aliphatic
moieties having
essentially no ester or ether groups. Some hard segments may include methylene
diphenyl
groups. Some reference electrodes have the same polymer, plasticizer, and
ionophore as
the measurement electrode, but with a different concentration of ionophore.
5 In one aspect of the invention, a method is provided for more rapidly
performing
an automatic titration of heparin with protamine. One such method includes
dispensing
protamine drop wise at a first rate into a heparin-containing sample while
measuring an
output from an ion selective electrode responsive to the protamine
concentration. The
protamine can be dispensed at a second rate that is less than the first rate
after the
electrode output exceeds a first threshold. The dispensing can be stopped when
a stop
condition is met, and the total amount of protamine dispensed into the sample
determined,
typically for a time prior to the stop point time. The heparin concentration
can be
determined as a function of the total protamine dispensed into the sainple.
The stop
condition is often the determination that an inflection point or maximum rate
of change of
potential with respect to time has been passed.
One method further includes dispensing protamine into the sample at a third
rate
that is less than the second rate, after the electrode output exceeds a second
tllreshold. In
some methods, a rate of change in electrode output per time is determined and
the
maximum rate of change is tracked. Once this maximum rate of change has been
passed
and the rate of change has dropped below a change threshold, below the maximum
rate of
change, titration can be stopped. In some methods, the dispensing includes
dispensing
drops of protamine and counting the drops.
In another aspect of the invention, a method is provided for determining an
initial
heparin concentration in a sainple, not requiring titration. In this method, a
bolus of
protamine is added to the sample sufficient to bind all the expected heparin
in the sample.
The heparin and protamine can be mixed and allowed to bind to each other. The
amount
of protainine remaining in the sample can then be determined using the
electrical potential
from a protamine ion selective electrode. The initial heparin concentration in
the sample
can be calculated using the protamine binding stoichiometry, the protamine
remaining, the
protamine consumed, and the initial amount of protamine. The protamine
remaining is
determined by measuring the slope of the voltage read from the electrochemical
sensor,
after a suitable time is allowed for stabilization of the sensor membrane emf.
CA 02567137 2006-11-17
WO 2005/116623 PCT/US2005/016463
6
In another method, the sample can be divided into a plurality of samples, and
several different protamine concentrations added to the plurality of samples.
The
electrode potential from a plurality of ion selective protamine sensitive
electrodes in
communication with the samples can be obtained. An electrode can then be
selected
having an intermediate output as between the plurality of electrode
measurements. The
heparin concentration in the original sample can be determined at least in
part as a
function of this electrode output. In one method, the electrode is selected
that has the
closest value to the mid-point between the maximum and the minimum electrode
outputs
observed.
In yet another aspect of the invention, a more accurate measurement of the
heparin
concentration is obtained by creating a sample blank using the blood sample to
be
measured. In this method, essentially all of the heparin in the blood sample
is neutralized,
bound, or degraded to create a reference saniple. The output of a first ion
selective
electrode pair is measured after exposing the first electrode pair to the
reference sainple.
A second ion selective electrode pair is exposed to the blood sample not
having the
heparin inactivated, bound, or degraded. In one inactivating method, the
inactivating
includes binding the heparin to polycations immobilized on to a solid matrix,
for example,
sepharose beads or magnetic beads.
The original heparin concentration is determined by correcting the second
electrode pair output using the first electrode pair output. The original
blood sample may
be split into two streams, one with heparin and one without, and both measured
at about
the same time. This method can improve the accuracy of the heparin
ineasurement by
correcting for non-heparin contributions to the ion selective electrode. This
aspect of the
present invention can compensate for matrix related effects (e.g.)
hemodilution, which
could cause variations in the end-points measured by the electrode pair.
In a related method, the second electrode pair is exposed to a subsequent
blood
sainple containing a different blood sample than the first electrode pair. In
this method, a
reference, baseline signal may be obtained first for the patient's blood
having the heparin
removed or inactivated, followed by a series of subsequent heparin determining
measurements that are corrected using the first, blank sample ineasurement.
Such
nleasurements can include binding the heparin using an immobilized protamine,
poly(lysine), polymer A (cross-linked PEI (polyethyleneiinine)), or the like
(other
CA 02567137 2006-11-17
WO 2005/116623 PCT/US2005/016463
7
polycations that are capable of strong binding to heparin such as polybrene).
In a variation
of this method, the heparin may be degraded using the enzyme heparinase.
In still another aspect of the present invention, an improved reference
electrode
design is used. A polyion selective electrode pair can be used including a
first electrode
having an ion sensitive meinbrane comprising a polymer, a plasticizer, and an
ionophore
present in a first, non-negligible concentration. A second electrode is also
included,
having an ion sensitive membrane comprising the polymer, the plasticizer, and
the
ionophore present in a second concentration that is higher than the first
ionophore
concentration. The electrode containing the ionophore present in the higher
concentration
can be used as the reference electrode, and used to correct the potential
drift resulted from
the sample matrix effect. In some ion selective electrode pairs, the polymer
is a
polyurethane, the ionophore includes dinonyl naphthalene sulfonate (DNNS), and
the
plasticizer includes 2-nitrophenyloctyl ether (NPOE).
The improved reference electrode can be used in a method including exposing a
first electrode to the solution and obtaining a first electrical potential.
The second,
reference electrode can also be exposed to the solution to obtain a second
electrical
potential. The polyion concentration can be determined by the potential
difference
between the two electrodes. There is typically only one electrode potential
measured - the
difference between the working electrode and the reference electrode.
The present invention can include use of an ion selective electrode (ISE)
sensitive
to protamine that includes alternating hard and soft polyurethane segments. In
some
polymers, the soft segment includes straight chain aliphatic groups and cyclic
aliphatic
groups joined by the uretliane groups. The straight chain aliphatic groups and
the cyclic
aliphatic groups preferably have no ether or ester groups, creating a
lipophyllic backbone.
In one such polyurethane soft segment, the soft segment is formed as a
reaction product of
dimer diisocyanate, witli butanediol and/or dimer diol.
The polyurethane hard segment can include alternating methylene
diphenylisocyanate portions and diols, for example, butanediol and/or dimer
diol. The
hard segment regions between the isocynate derived groups can thus be either
llydrogen or
straight chain aliphatic hydrocarbons or cyclic aliphatic hydrocarbons which
may have
hydrogen or straight chain aliphatic groups pendent from the cyclic portions.
CA 02567137 2006-11-17
WO 2005/116623 PCT/US2005/016463
8
In some embodiments, this polyurethane having the above-described hard and
soft
segments can be mixed or blended together with one or more other
polyurethanes, e.g.,
Pellethane. A polymer blend may provide improved performance relative to the
each of
the blended polyurethanes alone. In still another embodiment, a co-polymer
formed of the
above-described soft segments and hard segments, as well as segments found in
one or
more other polyurethanes, e.g., Pellethane, can provide a single polymer
backbone that has
the desired properties.
An ion selective electrode (ISE) that is sensitive to protamine can comprise
one or
more of the specialized polyurethane polymers described above. Some electrodes
may
include the plasticizer NPOE and/or the ionophore DNNS.
In yet another aspect of the invention a fluid column agitation and mixing
method,
and a related cartridge, is used to mix the titrant and the sample across the
measuring
electrode pair. In one embodiment, an analyte sample cartridge includes a
body, a saniple
chamber disposed within the body, and an ion selective electrode disposed
within the body
and in communication with the sample chamber. A reference electrode is also
disposed
within the body and in communication with the sample chamber. The chamber can
have a
blind cavity disposed on a first side of the sample chamber and containing a
compressible
fluid. The chamber can further have a port disposed on a second side of the
sample
chamber opposite the blind cavity. This port can be coupled to an oscillating
pressure
source. The oscillating pressure source can cause the liquid sainple placed
between the
oscillating pressure source and the blind cavity to move back and forth over
the electrodes
in the sample chamber responsive to the oscillating pressure source. An air
column can be
used for the oscillating pressure source. The fluid column agitation can be
used to replace
the magnetic stirring bar or magnetic stirring beads in some devices according
to the
present invention. Additionally, the fluid column agitation could be used
jointly with a
moving mechanical element like a stirring bar or beads in order to increase
the amount of
stirring activity.
In another aspect of the invention, a protamine titrant dispenser is provided
for
accurately and repeatedly dispensing the protamine titrant, for example, in a
drop-by-drop
manner. A flexible pouch containing a protamine solution can be disposed
within a rigid
housing hermetically sealed about the pouch. A volatile liquid can be disposed
within the
housing and outside of the pouch. A dispensing tube can be provided that is in
CA 02567137 2006-11-17
WO 2005/116623 PCT/US2005/016463
9
communication with the pouch and extending through a gas tight seal in the
housing. The
volatile liquid will provide a vapor pressure in the hermetically sealed
housing against the
liquid containing pouch. The vapor pressure of the liquid will be a function
of the
temperature of the liquid. A controllable heating device for heating the
housing can be
provided and coupled to a controller. In this way, heating the housing
increases liquid
vapor pressure, which increases pressure on the pouch, which increases the
fluid pressure
through the dispensing tube. The measured pressure of the dispensing tube, the
pressure
within the hermetically sealed housing, and/or the inside or outside
temperature of the
hennetically sealed housing can be used to provide feedback control to the
heating
element disposed against the hermetically sealed housing. A controlled
pressure can be
used in conjunction with a Lee valve to drop wise dispense titrant. Use of
such a vapor
pressure source can replace syringe pumps currently in use for some
titrations.
In one device according to the present invention, numerous several dried
protamine
aliquots which may each have the same concentration, are provided at several
points along
a tubular path. Dried protamine may be used as the aliquot. The quantity of
dried
protamine in each aliquot corresponds to the amount required to neutralize a
known
amount of heparin (e.g. each aliquot may correspond to 5ug protamine which is
sufficient
to neutralize 0.5 units of heparin). The numerous aliquots of protamine can
have ion
selective electrodes positioned between the aliquots in the path, where the
ion selective
electrodes are sensitive to protamine. A predetermined volume of blood sample
can be
forced through the path, encountering in sequence, first a first protamine
aliquot and
mixing the blood sample (containing heparin) with this protamine aliquot. The
blood
sainple, now having some of the heparin bound to the dissolved protainine,
continues over
the first protamine measuring electrode pair. The response of the electrode
pair is
proportional to the concentration of the free protainine in the sample. A
negligible
electrode response is seen if the quantity of protamine is insufficient to
completely
neutralize the heparin in the sample. The blood sample can then continue to a
the second
protamine aliquot and mix with the next aliquot, fu.rther binding more of the
heparin in the
blood sample. The blood sainple having the initial heparin further bound by
protainine
from the second aliquot can then continue to a second protamine sensor where
the
response is again measured. This may continue until the blood sample has
flowed through
all of the numerous protamine aliquots, mixing with the aliquots, and passing
across all of
CA 02567137 2006-11-17
WO 2005/116623 PCT/US2005/016463
the protamine measuring electrodes, recording the responses of each of the
sensors in
sequence.
The electrical potentials from all of the numerous protamine sensitive
electrodes
can be analyzed. The electrode having an intermediate value between the
extremely low
5 and extremely high values can be used to approximate the similar point which
would be
found in the titration of the heparin containing blood sample with sequential
aliquots of
protamine. In one inetllod, the electrode having the value most closely
approximating the
mid-point between the highest and lowest electrical potential outputs is used
as the
inflection point in this "titration."
10 In another method, the blood sample can be split into numerous equal volume
streams in parallel, with each stream each passing through and mixing with a
different
aliquot of protamine at essentially the same time. Each stream thus encounters
a different,
sequentially increasing, known predetermined amount of protainine. In some
methods,
this protamine is dried protamine that has been preloaded into the flow
channels of the
measurement cartridge. Each flow channel, after mixing with the respective
protamine
aliquot, then encounters an electrode pair disposed within the respective flow
charmel.
The values from all the numerous protamine sensitive electrode pairs can be
analyzed in
parallel, with the electrode pair having an intermediate value between the
extremely high
and extremely low values used to approxinlate the potential at the titration
"inflection
point." The amount of protamine within this flow channel can be used to
deterinine the
initial heparin concentration in the sample through the normal heparin-
protamine
stoichiometric relationship known for that protamine sample heparin type.
In still another method, a device having a single electrode pair and numerous
protamine aliquots along a tortuous path is used. Each of the protamine
aliquots has the
same concentration. A heparin-containing sample can be admitted through a
sample port
and pushed/pulled (e.g. through application of positive/negative pressure) to
advance
across the electrode pair. After a baseline reading is taking measured, the
sample can be
advanced across a first protamine slug, with back and forth movement to help
mix in the
protamine in the sample. The dissolved protamine from the slug neutralizes the
heparin in
the sample having the first protamine slug dissolved within and is can be
retracted to the
electrode pair and measured again. A potentiometric response is noted to the
extent of free
protamine in the sample. If the amount of protamine is insufficient to
neutralize the
CA 02567137 2006-11-17
WO 2005/116623 PCT/US2005/016463
11
heparin in the sample, no change from the baseline response is seen. This can
be is
repeated for each subsequent protamine slug, and stopped when the last slug is
reached,
until the inflection point is reached, or until a plateau is reached,
depending on the method
used.
In one method, dried protamine is preloaded into the sample chamber. Heparin
containing fluid is later added and the initial change in electrical potential
between the
working ISE and the reference electrode is measured. A linear relationship
between
heparin concentration in the sample and the logarithm of the change in
electrical
potential/time i.e. log(dEMF/dt) , can be used to detennine the amount of
heparin in the
sample. The system can be calibrated by using samples containing known amounts
of
heparin and measuring the change in differential electrical potential with
time, using
similar electrode pairs to those that will be used to measure the unknown
samples.
Some electrode pairs according to the present utilize a different protamine
ISE
composition. The membrane can include heparin in the polymeric material of the
working
ISE. Heparin binds very efficiently to protamine and can be used instead of
the DNNS.
Also, protamine can be used in a heparin ISE to bind the heparin and generate
an electrical
potential in response. The protamine and heparin can be used as ion exchangers
for
polyanion and polycation assays, respectively. The protamine and heparin can
be
immobilized in the polymeric matrix, and may be coupled to the polymeric
backbone, for
example, to polyurethane, in some embodiments.
Description of the Drawings
FIG. 1 is a schematic diagram of an automatic, point of care heparin
concentration
determination system including generally a controller, a titrant delivered
using a pressure
source, and a cartridge including a protamine ion selective electrode pair and
a mixing
element;
FIG. 2A is a side view of a heparin concentration measurement cartridge
including
a vessel sealed using a puncturable seal, a protamine ion selective electrode,
a reference
electrode, and a protamine syringe needle all in a vacutainer tube;
FIG. 2B is a prophetic plot of differential electrical potential between the
working
and reference electrodes versus time as protamine is infused into a heparin-
containing
sample;
CA 02567137 2006-11-17
WO 2005/116623 PCT/US2005/016463
1'L
FIG. 3A is a side view of a heparin concentration point of care determination
device including two, tubular sealed vessels, each including a protaniine ion
selective
electrode, a reference electrode, and a protamine syringe, where one of the
two cartridges
has had the heparin removed or inactivated to create a blank sample;
FIG. 3B is a prophetic plot similar to that of FIG. 2B, having differential
EMF
versus protamine infusion time for a heparin containing sample and a blank
sainple having
the heparin removed;
FIG. 4A is a side view of another point of care heparin concentration
determination
device including a coaxially disposed protamine selective electrode and
reference
electrode, together with a protainine syringe;
FIG. 4B is a top, cross sectional view through the coaxial electrode pair of
FIG.
4A;
FIG. 4C is a top, cross sectional view of an alternate configuration of 4A,
with a
side-by side electrode pair;
FIG. 4D is a side view of the electrode pair of FIG. 4C, showing the
insulation
removed over each electrode, with the working electrode covered with a
protamine
selective ISE membrane;
FIG. 5A is a front view of a screen printed planar protamine ion selective
electrode, including a protamine ion selective membrane and a reference
electrode, both
printed on a substrate and extending to a bottom sample exposure region;
FIG. SB is a transverse cross sectional view of the electrode pair of FIG. 5A,
showing a protamine delivery channel disposed within the substrate;
FIG. 5C is a front view of the electrode pair of FIG. 5A incorporated into a
cartridge having a sample well at bottom;
FIG. 5D is a side view of the cartridge of FIG. 5C;
FIG. 6 is a side, transverse, cross sectional view of a protamine ion
selective
electrode including a protamine ion selective electrode and a reference
electrode on a
substrate;
FIG. 7A is a front view of a protamine titration sensor including a bottom
region
having multi-analyte sensing capability;
FIG. 7B is a fragmentary, perspective view of the bottom region of FIG. 7A,
having a protamine entry channel and a multiple sensor charmel;
CA 02567137 2006-11-17
WO 2005/116623 PCT/US2005/016463
13
FIG. 8A is a side view of a planar sensor having a screen printed protamine
ion
selective electrode and reference electrode;
FIG. 8B is a top, transverse, cross sectional view of the planar electrode of
FIG. 8A
after the flexible substrate has been formed into a tube;
FIG. 8C is a side view of the tubular electrode of FIG. 8B incorporated into a
cartridge having a sample,within and a protamine injection device below;
FIG. 8D is a diagrammatic side view of a cartridge similar to that of FIG. 8C,
but
having a protamine pouch advancing toward a needle to puncture the pouch to
inject the
protamine into the sample;
FIG. 9 is a top view of a differential planar sensor design with rotary
stirrers,
having a first chamber for heparin containing blood and a second chamber for
blood
devoid of heparin;
FIG. l0A is a top view of a serial protamine sensor having several protamine
ion
selective electrodes disposed between several protamine aliquots;
FIG. l OB is a top, detail view of a protamine ion selective electrode pair of
FIG.
10A;
FIG. l OC is a plot of electrical potential versus sensor number from FIG.
10A,
showing prophetic results for a low heparin concentration blood sample and a
high heparin
concentration blood sample;
FIG. 11 is a top view of a multiple array sensor device including several
serial
protamine sensors similar to that of FIG. 10A;
FIG. 12A is a front view of a parallel protamine ion selective sensor array
having
several flow channels in parallel, with each flow channel having a protamine
aliquot
upstreamof a protamine ion selective electrode;
FIG. 12B is a plot of electrical potential from the protamine ion selective
electrodes versus sensor number, show a prophetic result for both a low
heparin
concentration blood sample and a high heparin concentration blood sample;
FIG. 13A is a top view of a heparin concentration determination system
including
a tape bearing multiple ion selective electrode pairs extending from a sensor
spool to a
take up spool;
FIG. 13B is a front, detail view of the tape of FIG. 13A bearing the numerous
protamine ion selective electrode pairs;
CA 02567137 2006-11-17
WO 2005/116623 PCT/US2005/016463
14
FIG. 13C is a detail view of one ion selective electrode pair from FIG. 13B;
FIG. 13D is a detail view of the sensor head of FIG. 13A;
FIG. 13E is similar to FIG. 13A, but having the sensors and sample port pulled
away from each other;
FIG. 14A is a front view of a sensor having a single protamine electrode and
multiple protamine aliquots;
FIG. 14B is a front view of another sensor, having a single protamine
electrode,
multiple protamine aliquots, and a serpentine path;
FIG. 15A is a front view of yet another sensor having a single protamine
electrode
and multiple protamine aliquots disposed in channels having individually
addressable,
controlled sample entries;
FIG. 15B is a top view of the sensor of FIG. 15A;
FIG. 15C is a top view of yet another sensor having a single protamine
electrode
and multiple protamine aliquots disposed in channels oriented as spokes
radiating outward
from a sample port, having individually addressable, controlled sample
entries;
FIG. 16A is a schematic, top view of a heparin concentration determination
cartridge having fluid column agitation;
FIG. 16B is an end, transverse, cross sectional view of the sample cartridge
of FIG.
16A;
FIG. 16C is a diagrammatic, side view of one oscillating fluid pressure source
for
use with FIG. 16A including a rotating cam or eccentric bearing against a
bladder
containing air;
FIG. 17A is a side, transverse, cross sectional view of a titration constant
pressure
source including a protamine pouch in a hermetically sealed chamber having a
volatile
liquid and liquid vapor within;
FIG. 17B is a schematic representation of a system for controlling the
constant
pressure device of FIG. 17A.
FIG. 18 is a flow chart of a method for titrating heparin with protamine using
an
adjustable droplet dispensing rate dependent on the potential received from
the protamine
sensitive electrode;
FIG. 19 is an experimental result, a plot of potential versus time and rate of
change
of potential per time versus time, for the adjustable droplet dispensing
method of FIG. 18;
CA 02567137 2006-11-17
WO 2005/116623 PCT/US2005/016463
FIG. 20 is an experimental result, a plot of potential versus time, for
various
constant droplet dispensing rates, and the adjustable dispensing rate method
of FIG. 18,
where no heparin is present;
FIG. 21 is an experimental result, a plot of potential versus time, for
various
5 constant droplet dispensing rates and the adjustable method rate of FIG. 18
when 6 units
of heparin are present;
FIG. 22 is an experimental result, a plot of potential versus time, for
titrating
various amounts of heparin with both a slow, constant droplet dispensing rate,
and the
adjustable dispensing rate method of FIG. 18;
10 FIG. 23 is a table containing the experimental results of FIG. 22, showing
a
comparison of droplet counts for fixed versus adjustable droplet dispensing
methods;
FIG. 24A is a diagraminatic representation of the protamine ion selective
electrode
membrane, including the ionophore DNNS before diffusion of the protainine
polycation
into the membrane;
15 FIG. 24B is a diagrammatic representation of the protamine ion selective
electrode
membrane, including the ionophore DNNS after diffusion of the protamine
polycation into
the membrane;
FIG. 25 illustrates the experimental results of titrating various amounts of
heparin
with protamine, shown as a plot of potential versus time;
FIG. 26A shows the experiinental results of exposing a protainine ion
sensitive
electrode to varying concentrations of protamine, to determine the time of
peak rate of
change of potential versus time, which can be used to calibrate protamine ion
selective
electrodes for the so-called "bolus" method;
FIG. 26B shows the experimental results of exposing a protamine ion sensitive
electrode to varying amounts of heparin added to an excess protamine bolus, to
determine
the initial rate of change of differential electrical potential for various
heparin sample
concentrations, which can be used to calibrate protamine ion selective
electrodes for the
"bolus" method;
FIG. 26C shows the log of the dEMF/dt versus heparin concentration results
from
FIG. 26B, illustrating a linear relationship that can be used in some
embodiments to
determine heparin concentration in a sample, for the "bolus" method;
CA 02567137 2006-11-17
WO 2005/116623 PCT/US2005/016463
16
FIG. 27 shows a theoretical simulation plotting concentration immediately
inside
the ion selective electrode membrane versus time for both the conventional
protamine
valve dispensing in titration of heparin, and for the immediate exposure of
the membrane
to varying concentrations of protamine;
FIG. 28 is a chemical structure of one polyurethane that can be used in the
protamine ion selective electrode, including linear aliphatic and cyclic
aliphatic regions
between the urethane groups;
FIG. 29A is a pictorial diagram of a cartridge-based system using a positive-
displacement reversible fluid pump with a two sensor cartridge having a simple
fluid path;
FIG. 29B is a top view of the two sensor cartridge of FIG. 29A;
FIG. 29C is a bottom perspective view of the two sensor cartridge of FIG. 29A;
FIG. 29D is a top perspective view of the two sensor cartridge of FIG. 29A;
FIG. 30A illustrates the experimental results of EMF vs. time using a system
similar to that of FIG. 29A with various heparin concentrations in a bolus
method; and
FIG. 30B illustrates a log plot of the initial slope vs. sample heparin
concentration
from the experimental results of FIG. 30A.
Detailed Description
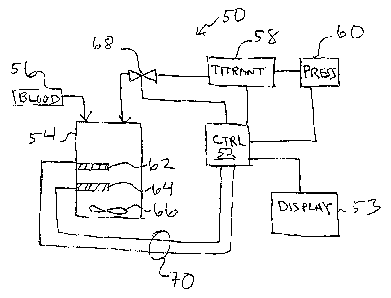
FIG. 1 illustrates generally a system 50 for measuring the heparin
concentration in
blood using a protamine titrant. System 50 can be implemented as a point of
care system,
which can provide rapid, non-clotting based methods for directly determining
the heparin
concentration in blood or other bodily fluids. This method is also broadly
applicable to
samples devoid/ deficient of clotting factors (e.g. aqueous, platelet poor
plasma etc.) and
not measurable by clotting assays as well as colored or turbid samples (e.g.
blood), which
are not measurable by colorimetric assays. System 50 will vary according to
the
embodiinent of the invention, as is discussed for the various embodiments
below.
System 50 includes a controller 52 coupled to a display device 53. Controller
52
can be a hard-wired, electronic device formed of discrete analog and digital
components in
some einbodiments. In other embodiments, controller 52 is a microprocessor-
based,
programmable device having at least one microprocessor therein. In yet another
embodiment, controller 52 is a general purpose computer, for example, a desk
top
coinputer, ninning control algorithms to implement the present invention. One
such
CA 02567137 2006-11-17
WO 2005/116623 PCT/US2005/016463
17
controller is a general purpose computer executing the Lab View computer
program.
Display 53 can be a dedicated, special purpose display on the device or it can
be a general
purpose computer display, for example, a CRT or LCD monitor. Various other
input
devices, for example, buttons, switches, knobs, keyboards, curser control
devices, and the
like may also be coupled to controller 52, but are not shown in FIG. 1.
System 50 includes a cartridge 54 which may also be viewed as a sample chamber
or a reaction chamber. Cartridge 54 is preferably a single use, disposable
cartridge that
can be readily coupled to the non-disposable portions of system 50. System 50
also
includes a titrant source 58, a titrant control valve 68, and a titrant
pressure source 60. .The
titrant is commonly protamine used at a pre-determined, fixed concentration.
Valve 68 is
a Lee valve (or any such precision fluid dispensing valve) in some
embodiments. In
other embodiments, a syringe pump or other precision fluid-metering device may
be
substituted for titrant pressure source 60, and titrant source 58. Cartridge
54 typically
contains a measurement electrode 62, a reference electrode 64, and a mixing
element 66.
Electrodes 62 and 64 as well as mixing element 66 can be electrically coupled
to controller
52, for example, by wires 70. One component coupled to controller 52 is a high
input
impedance buffer amplifier, which enables it to perform a potentiometric
measurement of
the difference in the electromotive force (EMF) between the measurement
electrode 62
and the reference electrode 64. A blood source 56 is also illustrated, to be
fed into
cartridge 54. For the purpose of titration, it is normally important that the
volume of the
blood sainple be constant.
In one, highly diagrammatic use of one embodiment of the invention, a known,
weight or volume of blood is injected into cartridge 54. The blood may be
mixed with
other, non-titrant cheinicals such as sodium citrate, and disodium EDTA
(ethylenediamine
tetra-acetic acid). These two chemicals are anticoagulant chemicals to prevent
the blood
sample from clotting, useful when heparinized fresh wliole blood is used as
the sample,
typically in liquid form. Mixing element 66 can be activated to mix the blood
and the
non-titrant chemicals, as well as the titrant, to be added later.
In a protamine titration of heparin, controller 52 can regulate the addition
of
protamine titrant at a fixed rate through valve 68, and monitor the difference
in potential
output from electrodes 62 and 64. In a general heparin-protamine titration,
the protamine
can be added until the inflection point in the sigmoidal titration curve has
been passed.
CA 02567137 2006-11-17
WO 2005/116623 PCT/US2005/016463
18
The amount (concentration) of protamine added at the inflection point of the
titration
curve can be determined by knowing the titrant (protamine) concentration, its
infusion
rate, and the sample volume. The amount of protamine required to reach the
inflection
point of the titration and neutralize the heparin is a function of the amount
of heparin in
the original sample. Since protamine binds to heparin with a fixed
stoichiometry, the
heparin concentration in the sample can be calculated from the protamine
concentration
required to reach the inflection point. Therefore, knowing the amount of
protamine
required to neutralize the heparin allows the calculation of the heparin in
the sample.
In common practice, the titrant can be added at a constant rate, until the
inflection
point in the electrical potential has been passed and surpassed. To enable a
rapid
measurement of heparin in the sample, a gradient infusion of protamine may be
einployed.
In such a method, the protamine titrant may be added rapidly until a first
level of potential
is reached, followed by a slower addition rate above that potential threshold.
In another
such method, the protamine titrant is added at a tllird, even slower rate
after a second
threshold has been surpassed. By using slower protamine infusion rates close
to the end-
point of the titration, better resolution of heparin concentrations may be
achieved. In
addition, it allows a more rapid determination of the heparin concentration in
the sample.
Heparin measurement in clinical sanlples may be "absolute" or "differential."
In
the absolute measurement of heparin levels, only one titration is performed
with the
sample. No correction is applied for any non-heparin contributions (matrix
effects) to the
end-point. In the "differential approacli", the blood is split into at least
two streams, with
one stream having the heparin completely removed, neutralized or bound prior
to entering
a cartridge. A blood "blank" can thus be titrated in parallel with the blood
still having the
heparin, allowing for the potential to be corrected for non-heparin
contributions. Different
methods, described below, offer variations on the general method described
above. In one
method, pressure source 60 is a controlled, gas pressure source used to force
titrant 58
through a valve at a known pressure and tlierefore a known rate, often in drop
wise
fashion. In some systems, the liquid is pushed through a narrow orifice. In
one method,
pressure source 60 is a vapor pump, formed of a titrant in a closed bladder
disposed within
a rigid canister having a volatile liquid-vapor mixture disposed outside of
the bladder but
within the rigid structure. Controlling the temperature of the rigid structure
thus controls
CA 02567137 2006-11-17
WO 2005/116623 PCT/US2005/016463
19
the vapor pressure of the liquid-vapor mixture and controls the pressure
brought to bear on
the bladder, which coiltrols the pressure source of the titrant.
In some methods, mixing element 66 is a magnetically driven bead or other
element. In some metliods, mixing element 66 is an air column mixing device,
described
further below.
In one metliod, different from the titration method previously described, a
bolus of
titrant is added to cartridge 54, sufficient to totally neutralize the
expected heparin in the
blood. The concentration of protamine remaining is detennined from electrodes
62 and
64, with the consumed protamine calculated and used to determine the initial
amount of
heparin present in the blood. This bolus method is described in greater detail
below
Cartridge Designs
FIG. 2A illustrates one cartridge 100 that can be used to determine the
heparin
concentration using either the titration or bolus methods. Cartridge 100
includes a
cartridge body 102 and a cartridge stopper or septum 104. Cartridge body 102
can be
formed of glass, while stopper 104 can be formed of silicone rubber or
KratonOO.
Cartridge 102 can be fornned within a vacutainer tube. The tube can be coated
with
EDTA, well known to those skilled in the art. Cartridge 100 can have a
protamine sensor
106 and a reference electrode 108. Protamine sensor 106 may be composed of a
protamine-sensitive polymeric membrane that is coated, e.g., dip-coated or
drop-coated,
over a silver (Ag)/silver chloride (AgCI) lead. The preferred composition of
the
protamine-sensitive membrane is described in other sections. The reference
sensor 108 can
consist of a Ag/AgCI lead that is directly exposed to the sample. A protamine
syringe 110
is illustrated piercing stopper 104.
In use, the cartridge can be formed of a vacutainer tube of fixed volume and
having
a sensor and reference electrode embedded in the cap or septum and into the
body. The
blood sample can be delivered by piercing the cap using a needle. The vacuum
can draw
in the exact sample volume through suction. The cartridge can be placed in the
instniment
such that the electrodes make contact with the system and mixing initiated
witli a mixing
element 112 to mix the heparin, protamine, and blood mixture. The protainine
syringe can
then pierce the cap and protamine injection coinmences the titration. In
cartridge 100, the
protamine pressure source previously discussed is the protainine syringe 110.
CA 02567137 2006-11-17
WO 2005/116623 PCT/US2005/016463
FIG. 2B illustrates the differential electrical potential between the working
electrode and the reference electrode over time as the protamine is injected
into the
sample.
FIG. 3A illustrates another cartridge 114. Cartridge 114 has electrodes 108
and
5 106 as previously described with respect to FIG. 2A. Stopper 104 and mixing
element 112
can also be as previously described. Cartridge 114 includes a first portion
116 ("sample
chamber") in which heparin will be present and a second portion 115 ("blank
chamber") in
which the heparin will be removed. The heparin can be removed from second
portion 115
using heparinase or any other heparin degrading enzyme. In another method, an
10 immobilized substrate, e.g., protamine, poly-lysine, poly-arginine,
polybrene, or
combinations thereof, can be used to bind essentially all the heparin prior to
the blood
being injected into "the blank chamber" cartridge second portion 115. In
either case, the
resulting fluid residing within cartridge second portion 115 will be
substantially heparin-
free, providing a control or blank which can be used to account for
contributions from
15 non-heparin contributions (such as matrix effects including hemodilution or
other drugs).
A protamine syringe 118 may be seen, having a first portion 119 inserted into
cartridge
first portion 116 and a second portion 117 to be inserted into cartridge
second portion 115.
As previously discussed, in some embodiments, two different channels of
injection may be
used, with one injection channel having heparinase or bound protaniine to
effectively bind
20 or inactivate the heparin prior to the blood entering cartridge second
portion 115.
FIG. 3B illustrates the differential electrical potential between the working
electrode and the reference electrode over time for both the blank (the left
curve) and
heparin containing sample (the right curve) as the protamine is injected into
each chamber.
The end point of the blank chamber curve at left corresponds to the matrix
effect. The end
point of the sample chamber curve at right corresponds to the matrix effect
plus the
heparin, which prolongs the end point.
FIG. 4A illustrates another cartridge 120 having a coaxial, tubular protamine
sensor and reference electrode. Cartridge 120 includes protamine syringe 110
and stopper
104 as previously described. Cartridge 120 also includes an EDTA coated
vacutainer tube
122 having a coaxial measurement and reference electrode together in a single
tubular
electrode pair 121. Electrode pair 121 includes a protamine sensing electrode
lead 126
disposed within an insulator 128 which is disposed within a tubular reference
electrode
CA 02567137 2006-11-17
WO 2005/116623 PCT/US2005/016463
21
124 disposed within an insulator 125. The insulator layers 125 and 128 may be
selectively
stripped to expose the reference lead and the protamine sensor leads. A
protamine
sensitive polymer membrane may be selectively dispensed or coated onto the tip
of the
exposed protamine sensor lead 126 at bottom. The electrode pair 121 can offer
the
advantage of ease of manufacture, as both are incorporated in the same
electrode cable.
FIG. 4B illustrates a transverse cross section of electrode 121. Proceeding
from
out to in, outer insulator layer 125 is followed by Ag layer 124 to be used as
the reference
electrode, followed by insulator layer 128, followed by Ag conductor 126 to be
used for
the working electrode. Proceeding from top to bottom, outer insulator 125 can
be stripped
to form the reference electrode, followed by inner insulator layer 128 which
can be
stripped to form the working electrode after coating with the ion selective
electrode (ISE)
membrane.
FIG. 4C illustrates a top, transverse, cross-sectional view of another an
alteinative
version of the coaxial design with the electrode pair 390 having an insulator
391, a
reference electrode lead 393, and a measurement lead 392. As shown in FIG. 4D,
leads
392 and 393 can extend in parallel within insulator 391, with the insulator
stripped off
near the end. Reference lead 393 can have an ISE membrane coating 394 or
remain
uncoated, depending on the embodiment. Sensor lead 392 can have an ISE
membrane
coating 394.
FIGS. 5A-5D illustrate a planar protamine sensor and cartridge design. FIG. 5A
illustrates a screen printed planar protamine sensor 130 from a top view.
Sensor 130 can
be made using screen printing or other depositing or layering technologies
well known to
those skilled in the art. Referring both to FIG. 5A and FIG. 5B, the sensor
and reference
leads as well as the protamine channels are incorporated in a substrate (base)
material,
which can be a thermoplastic polymer, polycarbonate, acrylic, or any other
suitable
substrate material. Substrate 132 can have a protamine delivery channel
recessed into the
substrate material, shown at 136. In some embodiments, channel 136 is a needle
or a
lumen. The protamine delivery channel 136 opens to the surface at the bottom
of the
substrate. The protamine channel 136 interfaces with the protamine delivery
mechanism,
for example, a syringe pump, to deliver protamine into the sample.
Continuing upward, conductive metallic strips may be deposited on the
substrate,
witll a first conducted strip 133 deposited for the protamine sensitive
electrode and a
CA 02567137 2006-11-17
WO 2005/116623 PCT/US2005/016463
22
second electrically conductive strip 134 deposited for the reference
electrode. Electrically
conductive strips 133 and 134 may be formed of silver/ silver chloride. The
conductive
strips may be deposited by appropriate tecliniques such as screen-printing,
sputtering or
chemical vapor deposition. An insulating layer 135 can be deposited over the
electrical
strips to electrically isolate them. The leads can be left exposed for
electrical contacts 133
and 134 to interface with the data acquisition equipment. A protamine-
sensitive polymer
meinbrane 137 can be deposited over conductor 133 to serve as the working
electrode.
The portion 138 can be left as Ag/AgCI over conductor 134 to serve as the
reference
electrode.
In practice, sensor 130 may be incorporated as a side of an enclosed
receptacle or
sample chamber 139, illustrated in FIGS. 5C and 5D. The chamber is filled with
blood (or
sample) to a level above the two electrodes (137 and 138) and the protamine
delivery
channel 136. During measurement, protamine is delivered through delivery
channel 136.
Similar devices not having the protamine delivery channel as illustrated in
FIGS. 5A and
5B may be used. In these, similar devices, protamine may be delivered using a
different
method such as a separate needle or channel incorporated elsewhere in the
cartridge.
FIG. 6 illustrates an electrode pair 140 including a measurement electrode 142
and
a reference electrode 144. Electrode pair 140 includes a substrate 143 having
a conductor
path 146 for the measurement electrode and a second conductor path 154 for the
reference
electrode. Conductor paths 146 and 154 can be formed of silver or any other
suitable
electrical conductor. Measurement electrode 142, in the embodiment shown,
includes a
first layer 147 fonned of silver chloride. A second layer 148 including a
hydrogel is
disposed over the silver chloride layer. Hydrogel layer 148 can be used in
some
embodiments to maintain the electrode in a moistened, hydrated condition, not
requiring
any hydrating prior to use. A third layer 149 includes the ISE layer. As is
discussed
below, one ISE layer includes a polymer, a plasticizer, and an ionophore to
enable
selective response to a specific analyte in the sample . As is discussed
below, some
electrodes use a lipophilic polyurethane having essentially no ether or ester
groups in the
backbone of the polymer. The polymer can include linear and cyclic aliphatic
portions of
the backbone as well as aromatic portions of the backbone, between the
urethane groups.
One set of electrodes utilizes DNNS as the ionophore for detecting protamine.
Some
electrodes utilize NPOE as a plasticizer. A top layer 150 may also be
included, forming a
CA 02567137 2006-11-17
WO 2005/116623 PCT/US2005/016463
23
protective layer over the other layers. The protective layer can be designed
to have a high
molecular weight cutoff, to allow only molecules below a threshold molecular
weight to
come in contact with ion selective electrode layer 149.
Reference electrode 144 varies with the various embodiments of the present
invention. In the embodiment illustrated in FIG. 6, reference electrode 144
includes a first
layer 155 formed of silver chloride, a second layer 156 formed of a hydrogel,
a third layer
157 formed of a polymer, and a fourth layer 158 formed of a protective
material. Layers
155, 157, and 158 can be similar to layers 147, 149, and 150, previously
described.
Polymeric layer 157 can, in some embodiments, be formed of the same polymer as
ISE
layer 149 and measurement electrode 142. Reference electrode 144 can have
polymeric
layer 157 be substantially similar to measurement electrode 142, but with
polymeric layer
157 not having an ionophore wliile ISE layer 149 does have the ionophore. In
some
embodiments, protective layer 150 and 158 can have pores formed into the
layers, to allow
for diffusion of large molecules to the layer beneath. The various layers
described in FIG.
6 can be deposited onto a substrate using many technologies well known to
those skilled in
the art, for example screen printing, casting, sputtering, chemical vapor
deposition, plasma
deposition, and/or drop wise deposition. Some such teclmologies utilize ink
jet printing
technologies which utilize specialized inks, dyes and/or chemicals. This ink
jet-type
printing can be used to repeatedly deposit materials in layers upon a
substrate fed through
the printing or layering device.
Some embodiments of the invention have no membrane or polymeric layer over
the AgCllayer in the reference electrode. Some embodiments of the invention do
include
an ionophore in a membrane or polymer layer over the AgCl layer in the
reference
electrode, but in a substantially different concentration than present in the
measurement
electrode, as is discussed in more detail below.
FIGS. 7A and 7B illustrate a protamine sensor 140 having multi-analyte sensing
capability. Sensor 140 includes generally an upper portion 141 which may have
flow
chaimels within and be enclosed, and a lower portion 142 which may have the
flow
channel exposed to a cartridge or sample chamber portion, as discussed with
respect to
FIGS. 5A-2DD. FIG. 7B illustrates part of top portion 141 and bottom portion
142, in a
perspective view, showing an exposed calibrant delivery channel 147 and an
exposed
protamine delivery channel 146. The sample may be introduced to the sample
chamber
CA 02567137 2006-11-17
WO 2005/116623 PCT/US2005/016463
24
and bottom portion 142 using a needle or a delivery channel, as previously
discussed. A
protamine sensor 148 is shown in channel 147, where the reference electrode
and other
sensors (shown in FIG. 7A) may also be disposed in channel 147. Channels 146
and 147
may be formed in a substrate, as previously described, having here a bottom
portion 143
and a top portion or cover 144.
Sensor 140 is a multi-analyte sensor. In the example illustrated, sensor 140
includes a reference electrode 150, a pH sensor 151, a sodium sensor 152, a
potassium
sensor 153, and protamine sensor or electrode 148. Other analyte sensors and
electrodes
can also be included in sensor 140. The sensors can be deposited in a cavity,
in calibrant
channel 147. The sensors other than the protamine sensor can be previously
calibrated for
their response slope prior to use.
Sensor 140 can include an actuator 155 to deliver the calibrant through
calibrant
channel 147, and a protamine actuator 156 to deliver protamine through
protamine channel
146. The other protamine delivery sources discussed elsewhere in the present
application
may be used to deliver protamine in some systems.
In use, prior to sample introduction, a calibrant solution, containing known
concentrations of each ion having a sensor, can be delivered through calibrant
channel 147
and passed over the sensors. The volume of the calibrant solution can be much
less than
the sample volume, for example, less than 5% of the sample volume. This can
serve to
establish a baseline response for the sensors. Once the sensors have reached a
steady
reading, the sensor values can be noted and recorded.
Sample can then be introduced into the cartridge to contact the bottom portion
142
of the sensor, with mixing using methods and devices described elsewhere in
the present
application. The sensor output changes, other than the protamine sensor, are
based on the
analyte concentrations, with the response change being proportional to the
analyte
concentration, such that the Nemst equation can be used to calculate the
analyte
concentration. The response of the protamine sensor, and any other polyion
sensors, can
be analyzed as described elsewhere in the present application. Protamine
titration (or
bolus infusion) can be initiated, and the response of the protamine sensor
output analyzed
to determine the protamine concentration as before. Sample mixing should be
continued
during titration, to ensure the mixing of the protamine from channel 146 with
the sample,
to be sensed in the region of the sensors.
CA 02567137 2006-11-17
WO 2005/116623 PCT/US2005/016463
FIGS. 8A, 8B, and 8C all demonstrate a planar sensor along with its substrate
material that has been formed into a tubular receptacle to hold a sample. FIG.
8A
illustrates a substrate 162 having a sensor lead 164 and reference lead 167
deposited on a
substrate, including contracts pads 165 and 168, and reference pad 163 and
ion, e.g.,
5 protamine, sensing pad 166. The leads can be deposited using screen printing
or other
methods described elsewliere in the present application. A dielectric layer
169 can be
deposited over the leads, except for the regions indicated by reference
numeral 161. An
ion sensitive ineinbrane such as a protamine sensitive meinbrane can be
deposited to form
a pad 171 over pad 166
10 FIG. 8B illustrates substrate 162 rolled into a tubular shape, with sensor
electrode
163 and reference electrode 166 disposed on the inside of the tube wall.
FIG. 8C illustrates the tube of 8B from the side, showing again substrate 162
bearing electrodes 163 and 166. From top to bottom, a top seal 170 may be
seen, followed
by a sample solution 172 carrying several EDTA coated magnetic beads 174
within
15 (EDTA coated magnetic beads may already be incorporated in the tube before
sample
introduction). The coated magnetic beads can be used to mix or stir the
sample. A bottom
plug 176 is also shown, which can be formed of Kraton . Kraton can be used as
the plug
material to ensure that the cartridge can be completely sealed to form a
vacuum to draw in
the sample. Kraton is easily pierced by a needle and forms a tight seal around
the needle,
20 thereby preventing the sample from leaking out. A needle 178 may be seen
for puncturing
plug 176. A protamine source is highly diagrammatically illustrated at 180,
being forced
through needle 178 by a pressure source 182. Pressure source 182 can be a
linear actuator,
such as a syringe. At the completion of the titration, the needle may be
pulled out.
FIG. 8D illustrates a cartridge similar to that of FIGS. 8A-8C, having
substrate
25 walls 162 containing sainple solution 172 as previously discussed. The
electrodes, etc, of
FIGS. 8A-8C are not shown in FIG. 8D. A hollow barb or needle 185 having a
lumen
186 within is shown, disposed against a protamine containing pouch 187, which
can be
made of Kraton. A linear actuator 188 is diagrammatically illustrated, for
pushing pouch
187 against needle 185. Needle 185 can have a gauge of 31 or higher (smaller
diameter).
In use, upon initiation of titration, linear actuator 188 can push pouch 187
into barb
185, puncturing the pouch. The protamine can be expelled as a function of the
needle
CA 02567137 2006-11-17
WO 2005/116623 PCT/US2005/016463
26
gauge and the pressure exerted against the pouch. The pouch should have a
reasonable
thickness to prevent it from bursting.
FIG. 9 illustrates a heparin-protamine sensor system 190 including a planar
sensor
design coupled with rotary or planar stirrers. System 190 includes a first
sample chamber
191 to contain blood having heparin and a second sample chamber 192 to contain
a blank
sample, blood not having heparin. First chamber 191 includes a protamine
sensor
electrode 195 coupled to a conductor 196 coupled to a pad 197. Sample chamber
191
also includes a reference electrode 201 coupled to a conductor strip 193
coupled to a pad
194. A planar stirrer 198 is disposed within sample chamber 191 for stirring
the sample
chamber contents. The rotary stirrer may be a shaped magnetic stirring element
that can
be rotated to mix the contents of the chamber.
Similarly, second sample chamber 192 includes a protainine sensor 200, a
reference sensor 202, and a rotary or planar stirrer 203. Chamber 191 and 192
can each be
vented through Teflon membrane plugs 216 and 215, respectively. This design
allows
for a self-regulating method for sample fill. As the user pushes the sample
through the air
or gas in the sample chamber, the air or gas is vented through the Teflon
plug. When the
liquid sample hits the plug, further introduction of liquid is made difficult
due to the nature
of the plug. The Teflon plug is typically in the form of a thin membrane or
tape. In this
configuration, it is typically microporous and functions as a good gas vent.
The low
wetability of Teflon and its small pore size prevents liquid from going
through. By
contrast, solid Teflon does not have this property.
A blood entry port 205 is coupled through a first channe1206 feeding first
sample
chamber 191 directly. A second channe1207 extends from blood entry port 205
through a
heparin reinoval or inactivating chamber 208 which leads to the second sample
chamber
192. Heparin removal or inactivating chamber 208 can include bound heparinase,
mobile
heparinase, bound poly(lysine) or bound protamine, poly-arginine, polybrene or
other
heparin-binding polycations, which can all remove, inactivate, degrade, or
neutralize the
heparin prior to the entry of blood into second sainple chamber 192. The
heparinase or
poly(lysine) may be immobilized on a suitable support, for example, cellulose
or other
suitable porous matrix that offers low resistance to sample flow.
A protamine solution source 212 is similarly coupled to the first sample
chamber
through channe1213, and second sample chamber through channe1214. In another
CA 02567137 2006-11-17
WO 2005/116623 PCT/US2005/016463
27
embodiment, there is no tee coupling, having instead a separate protamine
infusion
channel from each pressurized protamine source. A linear actuator or other
pressure
source 210 can be used to force the protamine solution into the first and
second sample
chainbers. Such differential measurement techniques employing a blank sample
in
conjunction with a heparinized sample provides a more accurate measure of the
heparin
concentration in the sample, because it accounts for the sensor response
variations caused
by matrix effects. The use of the heparin containing blood sample chamber and
the blank
sample chainber can be used to provide more accurate heparin measurements by
adjusting
the electrode potentials for the non-heparin contributions.
FIGS. l0A and 10B illustrate a heparin measurement system 220 utilizing
multiple
electrodes and multiple dried protamine contributions aliquots. System 200
includes a
substrate 222 having a blood source or port 224 coupled to a serpentine flow
channel 226
that is ultimately coupled to a sainple withdrawal or suction port 234. Blood
sample flow
channel 226 extends through numerous protamine measuring electrode pairs or
sensors
228. Protamine aliquots 230 (each preferably having the same concentration)
may be
disposed between the sensors 228. System 220 may be seen to have blood
containing
channel regions 232 leading up to a leading front 235 with essentially non-
blood
containing regions 234 thereafter. In some examples of the invention,
protamine
containing regions 230 contain dried protamine that can mix with the advancing
blood
flow and be carried to the subsequent protamine measuring sensors 228
downstream. In
some embodiments of the invention, flow channel 226 relies on normal mixing of
the
blood and protamine resulting from flow. In other examples, flow-enhancing
contributions such as turbulent inline mixers, sonication, or magnetically
moved beads can
be used to enhance the mixing.
FIG. lOB illustrates one protamine measuring sensor 228 in greater detail,
including blood flow channe1236 having a protamine ion-sensitive electrode 237
and a
reference electrode 238, previously described.
System 222 may be viewed as performing a stepwise titration of the blood
sainple
with aliquots of protamine. In this stepwise titration, the initial protamine
aliquots will be
likely totally consumed in binding to the heparin. The electrical potential
across the initial
protamine sensors should thus be very low. As more protamine aliquots are
added, at
some point the protamine added will exceed that needed to bind to the heparin
and will
CA 02567137 2006-11-17
WO 2005/116623 PCT/US2005/016463
28
result in a rise in the electrical potential from the protamine measuring
sensor. Further
additions of protamine will result in progressively higher responses of
successive
protamine sensors and will finally result in essentially a plateau of the
measurements
response changes from the protainine sensors. Measurements from the protamine
sensors
having an intermediate value may be used to bracket the heparin concentration
in the
blood. While the inflection point of the titration or the maxiinum change in
potential with
time may not be located exactly, this location may be localized to within one
or two
segments of the multiple segment sensor system. The amount of total protamine
added
from the several aliquots prior to the protamine sensor having the
intennediate potential
value may be used to determine the total protamine entered up to that point.
The
stoichiometric binding ratio of the protamine may then be used to determine
the heparin
concentration in the initial sample.
In use, a fixed volume of sample can be introduced into the sample inlet port.
The
volume of blood may be controlled with a suction device in conjunction with
valves. The
blood sample is advanced over the first sensor pad. The response difference
between the
working and reference electrode is noted. The response of the first sensor pad
is the
baseline response, as no protamine is present in the blood sainple at this
point. In some
inethods, the sample is moved back and forth over the first sensor pad to
allow the sensor
to be exposed to a more representative sample.
The sample may then be advanced over the first protamine slug. The protamine
can
dissolve in the sample and neutralize any heparin present, to the extent
possible by the
limited ainount of protamine present. Again, the sample may be moved back and
forth
over the slug to obtain better mixing. The sample can then be advanced over to
the second
sensor pad, and the differential response between working and reference
electrode noted.
The sample may be moved back and forth over any or all protamine slugs or
sensor pads,
depending on the embodiment. This advancement of the sample can be repeated
until the
sample is past the last sensor, until saturation is noted, or until an
inflection point is found,
again depending on the embodiment.
FIG. 10C illustrates a prophetic example of a result of a titration from the
sensor of
FIGS. 10A and lOB for two samples having low and a high heparin
concentrations. The
individual points are labeled with the sensor number, with sensor #1 being the
first sensor,
positioned before the first protamine aliquot. A The titration curve for a
first blood
CA 02567137 2006-11-17
WO 2005/116623 PCT/US2005/016463
29
sample having a low heparin concentration curve 240 may be seen in 240, having
a low
heparin concentration. In this example, the third protamine sensor in series
has registered
an intermediate value having a large rate of change of potential with respect
to time, seen
at 241. The total protamine in the two aliquots added prior to the third
sensor may be used
to determine the heparin concentration within a bracketed range. Continued
protamine
addition may be seen to result in a plateau at 244.
The titration curve for a second blood sample having higher heparin
concentration
may be seen at in 242. The lack of a response in the sensors 1 through 4
indicates that all
protamine is utilized to neutralize heparin. The observation of a response at
the fifth
sensor indicates that the protamine introduced in aliquot 5 is in excess after
neutralizing all
the heparin in the sample. At the fifth sensor, some protamine remains. A
maximum slope
at the sixth protamine sensor is seen at 243. Subsequent protamine addition
causes the
responses from sensors 8-10 to be saturated and essentially results in the
plateau seen at
245. The heparin concentration in the sample is proportional to the sensor
near the greatest
rate of change of differential potential versus sensor number. System 220 may
allow
disposing of eliminates the need for a syringe pump as sample advance may be
accolnplished by suction applied downstream of the sensors. In some systems,
both
positive and negative pressures may be used to move the sample back and forth
over the
sensors.
FIG. 11 illustrates another sensor system 260 that includes multiple sensor
systems
such as that illustrated in FIG. 10A. Sensor system 260, in the example shown,
shows
eight systems somewhat similar to that illustrated in FIG. 10A. System 260
includes a
first sensor pad array 262, a second sensor pad array 264, and a third sensor
array 266.
The eight sensor pad arrays can each include a serpentine or coiled mixing and
measurement flow path 273 having a first end 272 and a second end 270. Once
the
measurement is coniplete, the sensor array can be rotated to expose the next
sensing array
and the sample process repeated. Such rotation is indicated at arrow 268. The
multiple
measuring sensors and multiple protamine aliquots are illustrated, as
previously described
with respect to FIG. 10A.
FIG. 12A illustrates another multiple sensor system 280 which shares some
similarities with the system illustrated in FIG. 10A. System 280 operates in
parallel while
the system 220 of FIG. 1 0A operates serially. System 280 includes a sample
entry port
CA 02567137 2006-11-17
WO 2005/116623 PCT/US2005/016463
282, a sample distribution manifold region 284, and multiple paths leading to
a sample
suction or withdrawal port 298. System 280 in FIG. 12A includes eight sample
flow
channels 286 through 288. Eight protamine aliquots 290 through 292 may also be
seen.
The number of channels -eight, is only representative. In practice this could
very well be
5 more than that. Each of the multiple protamine contributing regions 290
through 292 can
include increasing amounts of protamine. Finally, eight protamine measuring
sensors 294
through 296 are also illustrated in FIG. 12A. The protamine measuring sensor
from the
array of sensors between 294 and 296 that registers an intermediate electrical
potential
value may be used to bracket the inflection point of the protamine "titration"
of heparin.
10 FIG. 12B illustrates a prophetic result of using a multiple sensor array
similar to
the one shown in FIG. 12A, except that in this case the multiple sensor array
has inore
than eight channels in parallel. FIG. 12B includes a plot of the protamine
concentration
versus sensor number at 300. Each sensor is exposed to a blood sample that has
been
mixed with an increasing concentration of protamine. The titration curve for a
first blood
15 sample having a low concentration of heparin is illustrated at 302, with
the third lowest
protamine concentration resulting in the electrical potential having the
greatest rate of
change. A second blood sample having a higher heparin concentration is shown
at 304,
with the sixth lowest protamine concentration channel having the greatest rate
of change.
A multi-sensor array system 280 may require more blood than system 220 of FIG.
10A.
20 However, the parallel array system of Fig. 12A may benefit from having less
sample loss
by adhesion to the walls of the tubes and may also avoid cumulative problems
of sensor
wet-up times, as the sensors are arrayed in parallel rather than in series. A
parallel design
can allow the sample to be measured in a relatively short time period relative
to a serial
design.
25 FIG. 13A illustrates yet another multiple sensor system 310 for measuring
heparin
concentration using protamine addition. System 310 includes a sample inlet 312
for
admitting blood samples coupled through a valve 313, a protamine reservoir
314, and a
measurement chamber 318 containing a sensor window 336. A suction or positive
pressure port 334 coupled through a valve 335 may be used to advance the blood
sample
30 from the sample inlet 312 through measurement chainber 318. A sensor tape
315 includes
numerous new sensors 316 passing the sample chamber 318 and becoming used
sensors
326. A sensor spoo1322 can feed tape 315 bearing the sensors and be taken up
by a take-
CA 02567137 2006-11-17
WO 2005/116623 PCT/US2005/016463
31
up spoo1324. A capstan 320 may be seen for carrying tape 315 past measurement
chamber 318.
A wash reservoir 328 may be seen which can contain wash fluid used to clean
measurement chamber 318 in-between samples and between use of the advan.cing
new
sensors 316. A waste reservoir 332 can be used to hold the used wash fluid
from wash
reservoir 328.
FIG. 13B shows tape 315 carrying numerous protamine measuring sensors 316.
FIG. 13 C illustrates one protamine measuring sensor 316 including a protamine
sensitive
electrode 317 and a reference electrode 319, as previously discussed. FIG. 13E
illustrates
ineasurement chamber 318 and capstan 320 retracted away from each other,
allowing
spools 322 and 324 to rotate to remove spent sensors 326 and advance unused
sensors 316
to measurement chamber 318.
FIG. 13D illustrates measurement chamber 318 in greater detail. Measurement
chamber 318 can include a sample port 340 (which is coupled to inlet 312 of
FIG. 13A)
coupled to a suction port 342 (wliich is coupled to port 334 of FIG. 13A) to
draw the
blood sample into the chamber 318. The blood sample is drawn into the chamber
past the
window 336. The sample chamber includes a sensor window 336 where the sensor
may be
positioned and held by the capstan 320 during sample measurement. A wash and
protamine entiy port 344 (which is coupled to 327 of FIG. 13A) may be seen
coupled to a
waste port 346 (which is coupled to 331 of FIG. 13A). Measurement chamber 318
is
supplied with protamine from the protamine reservoir 314 for determining the
heparin
concentration through use of sensor 316, followed by a wash fluid to clean the
sensor
head, supplied from wash reservoir 328.
In one embodiment, sample inlet port 340, waste port 346, and titrant/wash
port
344 are all located in bottom part of the sample chamber. Sample manipulation
port 342
is located in the top part of the sainple chamber, Electrical contact with the
sensors may
be made from the back of the sensors, with the electrical interface contained
in the capstan
mechanism 320, which also helps position the sensors 316 over the window 336.
In use, prior to starting the assay, the sensors can be positioned in the
sample
chamber window and the chamber window is sealed. In some devices, the seal is
effected
with the sensor tape being pushed into the window by capstan 320. Protamine
sensor 316
CA 02567137 2006-11-17
WO 2005/116623 PCT/US2005/016463
32
is shown pressed against the window 336. The sample inlet valves and
suctionlblowing
valves can be opened to actuate the sample.
Suction can be initiated through the suction port to draw the sample into the
sample
chamber. The sample volume can be controlled by the valve open time, metering,
suction
volume, or other suitable methods. The valves can be closed after the sample
is drawn
into the chamber. The valve on the titrant/wash port can then be opened to
begin
protamine titration. The linear actuator or other source dispenses protamine
into the
sample chamber and performs the titration. Once the titration is complete, the
valve on the
titrant/wash port can be closed. The tested sample solution can then be pushed
to waste
reservoir 332. This can be done by opening valves on the waste and suction/
blowing ports
and purging the sample chamber. Pressure can be applied from the blowing port
to push
the sample out of the chamber. Valves on suction/ blowing port and
titrant/wash ports can
then be opened to wash the chamber. Suction can be applied through the suction
port to
draw wash solution into the sample chamber. The stir bar or other mixing
element may be
turned on to help in the wash process. The sample chamber may then be purged
of the
wash solution and dried by performing the same actions used to purge the
sample
chamber, with the wash solution being pushed into the waste reservoir 332. The
sensor
interfacing mechanism can then retract, thereby pulling the sensor away. The
sensor spool
can then advance to position the next sensor pad in the window to seal the
chamber.
The suction/blowing port 334 of FIG. 13A can also be used (as shown in Fig.
13E)
to alternately provide suction to pull blood through measurement chamber 318,
followed
by a positive pressure used to blow the wash fluid from measurement head 318.
Thus,
suction and positive pressure may be used sequentially to provide blood flow
to the
measurement head, wash, and blow dry the measurement head for a subsequent
sample.
System 310 can thus provide a reusable well for containing sample and an
advancing spool that contains single use sensors. A cassette can hold the wash
and waste
solutions and can be activated by a suction or blowing mechanism actuated by
valves that
open sequentially. This design is adaptable for inline sampling and multiple
sample
handling. Sensor capabilities can also be extended as necessary.
FIG. 14A illustrates still another system 360 for measuring heparin
concentration
using dried protamine aliquots. System 360 is similar to system 220 of FIG.
10A, with
multiple slugs 365, 366, 367, etc, of the same concentration of protamine
along a channel
CA 02567137 2006-11-17
WO 2005/116623 PCT/US2005/016463
33
369. However, the difference is that there is only one sensor pad 363 for
making
measurements. Further in this case, the sample 364 is moved back and forth
between the
sensor 363 and the protamine slugs, rather than being advanced in the same
direction. The
sample can be introduced through inlet port 361 and moved back and forth by
positive/negative pressure being applied between inlet 361 and a second port
362.
In use, sample is introduced in the sample port 361. A fixed voluine of sample
is
drawn into channe1369. Sample flows over the sensor pad 363 and a measurement,
baseline response, is taken. Sample 364 is advanced to the first protamine
slug 365, where
the protamine dissolves in the sample. Protamine neutralizes any heparin in
the sample (if
present). The sainple slug may be manipulated appropriately to ensure good
mixing. The
sainple is pushed back to sensor pad 363 and a measurement is taken. If the
amount of
protamine is more than the amount of heparin in the sample, the sensor may
show a
response above the baseline. The sample is then advanced to the second
protamine slug
366 and mixed. The process is repeated and the sample is brought back to the
sensor pad
for measurement. The process of pull/ push is repeated. At every slug, more
protamine
dissolves in the sample. Eventually the protamine exceeds the heparin in the
sample. The
titration curve plots the response (dE) vs. the number of slugs that the
sample has been
exposed to. The titration curve for this design is similar to that of system
220 of FIG. 10A,
except that the x-axis corresponds to the number of the slug, rather than the
number of the
sensor.
FIG. 14B illustrates system 370 for measuring heparin concentration using
protamine addition. System 370 includes a first, sample port 371, a sensor pad
373, a
tortuous channel 379, a second port 372, and protamine slugs 375, 376, 377,
etc. System
370 is similar to system 360 of FIG. 14B, but having a tortuous channel.
System 370 can
be used in the same way as system 360.
FIG. 15A and 15B illustrate another system 380 having a sample port/sensor pad
381 in fluid communication with several channels 382 each having a protamine
slug
within. The channels have an increasing amount of protamine in each chaimel.
The
resulting metliod can be faster than a previous method because the protaniine
in all the
channels is dissolved at the same time (as opposed to each being sequentially
dissolved).
Most of the analysis tiine in a measurement is spent in dissolving the sample
and
CA 02567137 2006-11-17
WO 2005/116623 PCT/US2005/016463
34
advancing it back and forth to the sensor. That process is not involved here
which makes it
faster.
In a first step, sample introduction and mixing step, all the channels are
filled with
a fixed volume of the sample which dissolves the protamine aliquots in each
channel in the
sample. In a second step, there is the sequential passage of the sample over
the sensor. In
this process the "protainine-dissolved" sample from channel-1 is first passed
over the
sensor and the response is recorded. Following this, the sample from channel-2
is passed
and its response measured and so on. The order of passage of the samples is in
the order of
increasing protamine concentrations. As with the previous designs, once the
protamine
aliquot in a certain channel exceeds the heparin in the sample, the sensor
shows a response
corresponding to the free protamine in that channel (and increasing responses
for the
subsequent channels). This process is akin to the addition of incremental
amounts of
protamine to the sample.
Each channel can also have a gas penneable vent 383 which may include Teflon.
The top of system 380 can include a valve manifold 385 having several
individually
addressable and controllable valves 384, so allow sample to be pulled into an
individual
channel to contact a protamine aliquot. System 380 is similar to system 280 of
FIG. 12A,
with the feature that it enables the protamine aliquots to be dissolved in
parallel instead of
in series. However, there is only one sensor instead of multiple sensors. In
this feature it is
similar to system 360 of FIG. 14A.
In system 380, the protamine slugs increase in concentration across each
channel.
The cartridge may be designed to have a vent plug that is gas permeable but
liquid
impermeable. A Teflon film could achieve this effect. This feature ensures
that a fixed
volume of sainple is filled in each channel. Alternatively, the pump may be
used to draw
sample into each channel. Each of the channels are individually addressable
using a
system of valves (in the instrument). Suction/ pressure can be used to
manipulate the
sample. A single sensor pad 381 is present at the confluence of these
channels. This
contains a protamine sensor and a reference electrode.
In use, the sanlple is dispensed in the sample inlet port 381. A fixed volume
of the
sample is drawn (or pushed) into each channel. The sample mixes with protamine
in each
of the channels. Mixing may be enhanced with appropriate aids. Each channel is
individually addressed to push the sample over the sensor pad. The channels
are pushed in
CA 02567137 2006-11-17
WO 2005/116623 PCT/US2005/016463
order of increasing protamine concentration. The response of the sensor is
recorded. The
titration is performed by successively pushing each (protamine dissolved)
sample over the
sensor and measuring the response. Plotting the sensor responses vs. the
chamiel gives the
titration curve. The heparin in the sample corresponds to the channel at which
the
5 inflection point is observed. This method enables the sainple to be measured
in a
relatively short period of time.
FIG. 15C illustrates another system 390 similar to system 380 of FIG. 15A, but
circular. System 390 includes a central sample port/sensor pad 391, coupled to
multiple
channels 392 each having an increasing protamine aliquot in each channe1394 ,
and
10 individually addressable valves 393.
Protamine Bolus Method
As previously discussed, heparin can be measured in blood by using protainine
to
titrate heparin with the protamine-binding followed by using a protamine
sensitive
electrochemical sensor to monitor the titration endpoint. In this detection
metliod,
15 protamine is gradually introduced into the sample solution, with stirring
sufficient to
ensure a homogenous binding between the introduced protamine and the heparin
in the
sample. A relatively complex system would be required to infuse/dispense the
protamine
titrate, mix the heparin and protamine, and follow the titration progress.
In an alternate method, a bolus of protamine is preloaded into a cartridge.
This
20 protamine bolus should include a sufficient amount of protamine to
completely neutralize
the maximum expected heparin in the blood sample. The protamine bolus can be
preloaded into a sealed cartridge, for example, and a known quantity of blood
injected
through the seal and shaken or otherwise mixed. After a suitable time period,
the heparin-
protainine containing solution can be injected into a second cartridge
including a
25 protamine sensitive electrode. The mixing and reaction can thus be done
apart and away
from the ion selective electrodes used to measure the protamine concentration.
Calibration can be accomplished using methods described elsewhere in the
present
application. For example, time to maximum rate of change of differential
electrical
potential, maximum rate of change of electrical potential, and the log of the
initial rate of
30 change of electrical potential can be used in conjunction with previously
obtained
calibration values for samples having known concentrations of protamine or
heparin,
depending on the method.
CA 02567137 2006-11-17
WO 2005/116623 PCT/US2005/016463
36
Thus, the starting protamine concentration, the final remaining protainine
concentration, and the known stoichiometry of the protamine solution can be
used to
determine the heparin that bound the initial protamine. This bolus method can
also be
used where the mixing member is near the protamine sensitive electrode, by
preloading or
injecting a known excess quantity of protamine into the cartridge holding the
protamine
ion sensitive electrode.
With the use of preloaded dry protamine, the complex protamine
infusing/dispensing system can be eliminated, thus dramatically simplifying
the
instrumentation. This method may also provide improved sensitivity. Since the
sensor
response depends on diffusion, a bolus of analyte will contribute more
diffusion flux than
small increinental analyte additions in more typical titrations. Thus
applicants believe the
bolus method will be more sensitive.
With the improvement of sensitivity, as long as an excess of high
concentration of
protamine remains after the heparin is neutralized, there would be enough flux
into the
sensor to provide a meaningful signal even without sample stirring. Therefore
the stir
system may be eliminated, thus further miniaturizing the sensor system.
This method can also be used to conduct multiple tests on the same cartridge
and
therefore on board calibration and parallel tests can be performed. If a stir
bar or stir
element is removed from the design, then any need to control each stir bar the
same for
each chamber may be removed. The reduced chamber or channel size may make
parallel
tests more practical.
Fluid Column Agitation
FIGS. 16A-16C illustrate a system for mixing and agitating a solution across
the
measurement electrodes. Magnetic stir bars and magnetic stir plates have been
used to
mix heparin protamine mixtures during protamine titration of heparin. However,
this
mixing method can limit miniaturization of the system. The present invention
includes an
oscillating fluid column for mixing the heparin and protainine mixtures, which
can
eliminate the need for a magnetic stirring member within the sample, chamber
containing
the electrodes. This may also allow for further miniaturization of the sample
measuring
cartridge.
CA 02567137 2006-11-17
WO 2005/116623 PCT/US2005/016463
37
FIG. 16A illustrates a system 420 including a sample measuring cartridge 422,
an
oscillating fluid pressure source 422, and an electrode measuring system 424.
Cartridge
422 includes a sample chamber 426 within, containing electrode pair 432 that
is coupled
through wires 433 to measurement system 424. Sample chamber 426 may be seen to
include three portions, a compressible fluid or gas filled portion 440, a
liquid analyte
containing portion 438, and an oscillating pressure portion 436. Oscillating
pressure
source 422 is coupled through a tube 434 to a port 428 in communication with
the
oscillating pressure portion 436 of sample chamber 426. The oscillating
pressure source
422 may comprise air, wliich can be delivered with varying pressure through
tube 434 to
sample chainber portion 436. The compressible fluid or gas in sample chamber
portion
440 may be air. A sample introduction port 430 may be seen which can be used
for
injecting the blood sample and the protamine into sample chamber 426.
Protamine titrant
can be infused through port 430 in soine applications. Portion 440 is in
effect a blind
cavity which, being full of compressible fluid or gas, will shrink and expand
in size in
response to the varying pressure delivered through tube 434. A varying
pressure is
indicated at arrow 441 that causes the movement. Any fluid, gas or other
compressible
material not adversely affecting the measurement of electrodes and analyte can
be used in
portion 440.
Constant Pressure Titrant Source
Titration systems using a solenoid valve based liquid dispenser require an
accurate
pressure source to provide the driving force to dispense the liquid. Under the
same valve
opening parameters and constant pressure, accurate liquid droplet volumes down
to the
nanoliter can be dispensed. An easy to use, low maintenance, and low cost
pressure
source would be valuable for this application. In the present invention, this
system can be
used in heparin titration by precisely controlling the amount of protamine
titrant that is
dispensed. Current devices or titration volume dispensing often use a syringe
pump.
Others have used a liquid containing titrant pouch in a pressurized gas
chamber, where the
gas pressure is maintained by a gas puinp. An easier to use, lower cost and
easier to
control titrant pressure source would be advantageous. In particular, a system
not
requiring a controlled syringe pump would be beneficial.
CA 02567137 2006-11-17
WO 2005/116623 PCT/US2005/016463
38
FIGS. 17A and 17C illustrate a system 460 utilizing a chemical vapor pump. A
chemical vapor pressure driven fluid source is presently being used in the
Isomed
implantable drug delivery system, manufactured by Medtronic (Minneapolis,
Minnesota).
FIG. 17A shows system 460 including a hermetically sealed container including
a
bottqm portion 464 and a top lid 466 tlireadably secured to bottom portion
464. A fluid
filled, titrant containing pouch 462 is disposed within the hermetically
sealed container. A
volatile liquid, for example, the fluorocarbon FC87 (available from 3M,
Minneapolis,
Minnesota) can also be included within the hermetically sealed housing. The
volatile
liquid is shown at 471 in a liquid phase and at 470 in the gaseous phase. The
pressure
delivered by the volatile liquid and brought to bear upon pouch 462 is a
function of the
temperature of the liquid within the hermetically sealed housing. The
temperature of the
housing and of the liquid within can be provided by heating coils 472 wrapped
about
housing portion 464. The pouch contents can be delivered outside of the
hermetically
sealed housing through a delivery tube 468 hermetically passed through the
housing.
The pressure within tube 468 can be controlled directly or indirectly in
several
ways, depending on the embodiment of the invention utilized. A pressure
transmitter or
pressure transducer 474 can be used to directly measure the pressure of the
titrant being
delivered. Alteinatively, a pressure transducer 476 can be disposed within the
hermetically sealed housing to directly measure the pressure within the
hermetically sealed
housing. The pressure signal can also be passed hermetically through the
housing. In yet
another method, the temperature either inside the housing or of the housing
itself may be
measured by a temperature transducer 478. In any case, the delivery rate of
the titrant
should be used to calibrate the system, whether pressure or temperature
measurements are
used to control the delivery rate. It is expected that a drop wise delivery
system for the
titrant can be used in conjunction witll system 460.
FIG. 17B shows a highly diagrammatic control system for controlling the
pressure
source to titrant delivery to 468. A transducer 480, which can be either a
pressure or a
teinperature transducer, can deliver a measurement signal to a controller 482,
which can
be, for example, a PID controller. Controller 482 can accept a set point 484
given the
desired pressure or temperature. Controller 482 can then output a control
signal 486 that
is used to control the heating through a resistance heater at 488 around the
hennetically
sealed housing.
CA 02567137 2006-11-17
WO 2005/116623 PCT/US2005/016463
39
A saturated vapor pressure can be generated by heating a liquid reservoir
above its
boiling point. The saturated vapor will reach equilibrium with its liquid
phase in the same
chamber. Self adjustment of the vapor volume will occur if the volume to be
dispensed
from the liquid pouch is reduced by dispensing. Hence a constant driving
pressure is
always present.
Reference Electrode Design for Polyion Electric Chemical Sensors
Potentiometric sensors have been widely used in clinical laboratories to
measure
potassium, sodium, chloride, and ph, etc. Sensor performance, such as
precision,
accuracy, and useful life depends very much upon the reference electrode. In
particular,
the stability and useful life of the reference electrode. When applying
potentiometric
sensors in whole blood tests, protein absorption on both working electrode and
reference
electrode will cause potential drift on both electrodes, even though the
potential difference
is measured between the working electrode and the reference electrode, and
both
electrodes will normally be different in material and design. However, the
potential drift
will not be cancelled out. For a polyion potentiometric sensor, even though it
is a special
type of potentiometric sensor, good performance depends very much upon the
reference
electrode performance.
The signal via differential measurement between the working electrode and the
reference electrode will be a combination of the contribution by the true
analyte
activity/concentration difference and also by the contribution from the
unmatched protein
absorption, cell adhesion, and electrode hydration, etc. This contribution by
protein
absorption and cell adhesion is generally uncontrollable and irreproducible in
most
situations.
In another aspect of the present invention, this unmatched drift component
between
working and reference electrode is considered and at least in part accounted
for by taking
advantage of the unique response mechanism of the polyion potentiometric
sensor.
Surprisingly, the polyion sensor response time will be signiricaritly
different if the ion
selective membrane is doped with a different amount of ion exchanger. The
higher the ion
exchanger concentration, the more time delay is observed in response to the
same amount
of polyion analyte in the sample solution. In prior art systems, if we start
with a pair of
identical sensor substrates, for example, two identical silver/silver chloride
traces on
CA 02567137 2006-11-17
WO 2005/116623 PCT/US2005/016463
polyester in current practice, only the working silver/silver chloride
electrode contains the
ion sensitive polymer membrane containing the ion exchanger.
In this aspect of the present invention, both the working and the reference
electrodes are coated with the same polymer cocktail, but contain different
concentrations
5 of the ion exchanger. The reference electrode is preferably coated with the
solution that
has a higher concentration of ion exchanger, which will therefore be
significantly delayed
in response to the same amount of analyte in sample solution. Since by doing
this, surface
material of the working and reference electrode will be almost identical,
i.e., having the
same polymer and plasticizer, protein absorption and cell adhesion will be
almost
10 identical, and they can be cancelled out. The sensor hydration process will
also be similar
for both working and reference electrodes using this design. For comparison,
under the
previous design and fabrication, a significant potential drift will result
owing to surface
material difference between working and reference electrodes. Another property
of this
aspect of the invention is that any variation or variables in fabrication,
especially in
15 polymer membrane deposition, will likely be cancelled out by depositing the
similar
polymer cocktail on both electrodes.
In various embodiments, the ionophore concentration in the reference electrode
is
at least four, five, or ten times the concentration in the working or
measurement electrode,
depending on the embodiment.
Digitized Titration and Control Example for Protamine Sensitive Sensor System
The present invention provides an automatic, digitized titration control
system for
automatically determining the heparin concentration in a blood sample through
titration
with protainine using a protainine ion selective electrode to determine the
titration end
point. In one embodiment, the present invention provides an automatic heparin
protamine
titration system having a reduced titration time while maintaining or
improving accuracy.
This system may be visualized with respect to FIG. 1, previously discussed.
Instead of
using a syringe pump to continuously deliver protamine into a disposable
cartridge,
digitized titration is realized by replacing the syringe pump with a liquid
micro dispenser
(Lee valve), which is capable of discretely shooting protamine solution in
droplet form
(less than 30 nanoliters per drop in this example) into the sample. The volume
of every
liquid drop can be controlled via the solenoid valve opening times and back
pressure
CA 02567137 2006-11-17
WO 2005/116623 PCT/US2005/016463
41
exerted on the protamine reservoir. FIG. 1 illustrates the pressure 60 on the
protamine
reservoir 58 supplying the valve 68 that is under control of controller 52.
The control of
this Lee valve is simple and the dispensing unit cost is significantly less
than that of a
syringe pump. The total amount of protamine dispensed for each test can be
controlled on
the sensor response and can be determined by a counter monitoring the valve
opening
pulses.
FIG. 18 illustrates one method that can be used to perform the automatic
titration.
This method can be implemented using a system similar to that illustrated in
FIG. 1.
Method 500 illustrated in FIG. 18 can be implemented in discrete analog and/or
digital
components, as flrmware executable on a dedicated microprocessor control
instrument,
and/or as a computer program executed on a general purpose computer. Method
500, in
this case, was executed as a Lab View executable prograin on a general purpose
computer.
Beginning at step 502, the DPS (drops per second) counter is cleared. In step
504,
if the data acquisition is to start step 506 is executed, otherwise the
program loops at step
504 waiting for data acquisition to start. In step 506, baseline data is
collected, for
example, the beginning flat portion of the electrical differential plot.
Proceeding to step 508, titration is started if indicated. In one example,
after a
preset time has elapsed, for example 5 seconds, then titration may be begun.
With
execution proceeding to step 510, titration is started, for example at 10
drops per second,
and the DPS counter begins counting droplets. In step 512, monitoring of the
differential
electrical potential between the working or measurement electrode and the
reference
electrode is monitored. The rate of change of the differential potential is
tracked as well.
Thus, both the absolute differential measurement and the rate of change of the
differential
ineasurement with respect to time are tracked. Proceeding to step 514, if the
sensor
response indicates a differential potential of at least 10 millivolts, then
the titration rate is
slowed at step 516 to 5 drops per second. If the differential electrical
potential is not yet at
10 millivolts, then step 512 is executed again. In step 518, monitoring is
continued, both
of the differential electrical potential and the rate of change with time. At
step 520, if the
differential potential is at least 15 millivolts, then the titration rate is
further dropped to 2
drops per second, otherwise step 518 is executed again.
In step 524, monitoring is continued, both of the differential electrical
potential
and the rate of change.
CA 02567137 2006-11-17
WO 2005/116623 PCT/US2005/016463
42
At step 526 , if the differential electrical potential is at least 20
millivolts, then the
titration rate is decreased to one drop per second at step 528, otherwise step
524 is
executed again. At step 530, monitoring of the sensor response and the rate of
change of
the sensor is continued. The rate of change of the differential electrical
potential can be
monitored and stored, in various ways. In one, potentially noisy method, the
rate of
change is taken as the rate of change over two successive points. In another,
less noisy
method, a sliding window can be slid over a number of successive points, witli
the rate of
change taken to be the rate of change from the first point in the window to
the last point in
the window over the time length of the sliding window. A number of filtering
algorithms
may be used as well. At some point, the rate of change will peak and then
decrease. The
maximum rate of change can be stored in memory. When the current rate of
change has
dropped to a threshold value below that of the maximum rate of change, the
titration can
be stopped. Capturing the peak or maximum rate of change is seen at 532. In
step 534,
when the rate of change reaches 30% below the peak value, the titration is
stopped. In
step 536, the time at the peak rate of change can be used to determine the
total amount of
protamine added at this peak tiine. In one method, the total number of drops
is stored at
each time inteival along witli the differential measurement for that time slot
as well as the
rate of change of measurement with time for that time slot. Given the total
amount of
protamine at the peak rate of change, the stoichiometry binding properties of
the
protamine may be used to determine the heparin bound at that peak. This
determines the
amount of heparin in the sample.
FIG. 19 shows a plot of the electrical potential between the measurement
electrode
and the reference electrode for the protamine ion selective electrode pair
with respect to
time. The differential potential is plotted at 550 with the maximum rate of
change
indicated at 554. The rate of change with respect to tiine of the differential
electrical
potential is plotted at 552, with the maximum rate of change indicated at 556.
The rate of
change may sometimes be referred to as the "first derivative", although it is
typically
measured using discrete points. The first differential potential threshold is
shown at 558,
which in the present example, is 10 millivolts. As previously discussed with
respect to
FIG. 18, when the differential potential reaches 10 millivolts, the titration
rate drops from
10 drops per second to 5 drops per second. When the differential electrical
potential
reaches the second threshold at 560, which is 15 millivolts, the titration
rate is dropped
CA 02567137 2006-11-17
WO 2005/116623 PCT/US2005/016463
43
from 5 drops per second to 2 drops per second. When the third threshold at
562, 20
millivolts, was reached, titration rate was dropped to one drop per second.
This allows a
rapid infusion until threshold is reached, with a slower titration in order to
more accurately
capture the maximum rate of change of potential with respect to time at point
554.
FIG. 20 illustrates an experimental result showing a protamine ion selective
electrode response to protamine infusion in a sample having no heparin
present. The plot
of differential potential versus time for one drops per second is indicated at
580. As
expected, this takes the longest time to reach the maximum rate of change and
to plateau.
The plot for 5 drops per second is seen at 582 and that for 10 drops per
second seen at 586.
The plot for the adjustable rate described in inethod 500 of FIG. 18 is seen
at 584. The
addition of 10 drops per second plateaued first and reached the peak rate of
change first as
expected. However, as the peak rate of change was approached more slowly, this
point
could be determined with more accuracy.
FIG. 21 illustrates the protamine ion sensitive electrode response for
titrating 6
units of heparin with protamine. The plot of one drop per second may be seen
at 590, 5
drops per second at 592, 10 drops per second at 594, and the adjustable
titration rate of
Method 500 at 596. The adjustable rate achieves a result similar in time to
that of 10
drops per second.
FIG. 22 illustrates anotlier experimental result, showing the electrical
potential
versus time for various heparin amounts using one drops per second versus the
adjustable
method of FIG. 18. The plot showing the titration using one drops per second
for zero
units of heparin is indicated at 603, for 1 unit of heparin at 602, for 3
units of heparin at
601, and for 6 units of heparin at 600. The plots using the adjustable
titration rate method
may be seen for zero units of heparin at 604, 1 unit of heparin at 605, 3
units of heparin at
606, and 6 units of heparin at 607. As seen in FIG. 22, the adjustable rates
shortened the
test time significantly. For example, for 6 units of heparin present, the peak
rate of change
was located around 6 minutes using one drop per second while the corresponding
peak
rate of change was located around one minute using the adjustable method.
FIG. 23 illustrates the experiment results for the adjustable dispensing rate
versus a
5 drops per second fixed rate to titrate 1 unit, 3 units, and 6 units of
heparin. The
adjustable rate dispensing method produced results having higher accuracy.
FIG. 23
shows that for zero units of heparin, 262 drops were required to reach the
peak rate of
CA 02567137 2006-11-17
WO 2005/116623 PCT/US2005/016463
44
change compared to only 154 drops using the adjustable method. An overshoot or
a
reduced accuracy may be inferred from this result, in cases having non-zero
units. For the
zero unit case, this may be due to the ion flux provided being different, not
an indication
of overshoot or reduced accuracy. In the third column, the number of drops for
the I unit,
2 units, and 6 units of heparin have been corrected by the number of drops
required for the
zero units of lleparin. In the fourth column of FIG. 23, the ratio of the
number of drops
required for 3 units and 6 units relative to that for 1 unit is shown, which
represents that
the adjustable titration rate gives a truer ratio compared to the fixed fast
dispense rate i.e.
the numbers 1, 3, and 6.7 are closer to the 1U, 3U, and 6U of heparin compared
to the
numbers 1, 6, and 11.8.
By using the present system, the titration of heparin at high concentration
can be
done within two minutes. Data analysis and display is simplified by
correlating the sensor
response, micro dispenser dispensing rate, and by counting the number of drops
dispensed.
By comparing the results obtained with the fixed high rate dispensing rate,
the varied
dispensing rate scheme can provide more accurate results.
Protamine Ion Sensitive Electrode
FIGS. 24A and 24B illustrate a protamine ion sensitive electrode at 620
including
numerous ionophore or ion exchange molecules at 622. FIG. 24A illustrates the
membrane before protamine binding, and 24B after protamine binding. The
preferred
ionophore is DNNS, having S03- pendent groups. The DNNS ionophore may be seen
complexed with sodium ions at 624. A polycation, such at protamine, may be
seen at 626.
At the bottom of FIG. 24B, meinbrane 620 may be seen having ionophores 622
complexed
with protamine 626 which results in a positive electrical potential, either
measured directly
from the positive charge of membrane 620 or by driving off sodium ions 624
which then
increase the electrical potential of a conductor and cause current flow
through the
measuring circuit.
Potentiometric Polyion Sensors Using Iinmobilized Pol i~~ ons
Currently, for polyion sensors, the polymer membranes are doped with
appropriate
lipophilic anion or cation exchangers, such as tridodecylmetlhylammonium
(TDMA) for
polyanions and dinonylnapthalene sulfonate (DNNS) for polycations. The sensor
response
is based on the electrostatic interactions between DNNS or TDMA and polyions
inside the
CA 02567137 2006-11-17
WO 2005/116623 PCT/US2005/016463
membrane. However, these bindings are not effective, and the total voltage
change is
relatively small. One aspect of the present invention includes a new kind of
ion-exchanger.
Immobilized polyions such as protamine and heparin, for example, in the
backbone of the
polymer matrix molecule, can be used as ion exchangers for polyanion and
polycation
5 assays, respectively, which increase the total potential change and decrease
the detection
limit.
Coinpared with DNNS or TDMA, this new type of ion-exchanger may offer
several features. First of all, the interaction between iinmobilized protamine
or heparin and
other polyions are veiy strong with high binding constants. This would
increase the total
10 potential change of the polyion sensor. Secondly, since the ion exchanger
is immobilized
in the polymer matrix, the diffusion coefficient of ion-pair in the membrane
will be
decreased so that a low detection limit can be obtained. Due to the large
binding constants,
this new kind of sensor will show a high voltage change and increase the
signal to noise
ratio for polyion aneasurement in whole blood samples.
Calibrating a Protamine ISE
In previous methods, various amounts of heparin were first spiked separately
into 1
milliliter of phosphate buffer in disposable cups containing protamine
sensitive sensors.
Then protamine titrations were done by using drop by drop protamine injection
into the
cups. In the new method, various amounts of protamine were mixed with 1
milliliter of
phosphate buffer in disposable cups first, then the sensors were put into the
cups. This
mimics a real application scenario, where a known ainount of protamine will
mix with the
sample containing an unknown amount of heparin first, then the sensor is
applied to
measure the reduction of the protamine in quantity. This is referred to
elsewhere as the
bolus method in the present application.
FIG. 25 illustrates the experimental results obtained with the previous
method,
discussed above. The changes in electrical potential with time are shown for
various
ainounts of heparin. The x-axis of FIG. 25 is labeled time but may also be
viewed as the
cumulative amount of protamine added, rather than time. This assumes a
constant titration
rate for the protamine infusion. The increase in potential with time for zero
units of
heparin is indicated as 638, for 0.25 units at 636, for 0.50 units at 634, for
0.70 units at
632, and for 1 unit at 630.
CA 02567137 2006-11-17
WO 2005/116623 PCT/US2005/016463
46
FIG. 26 illustrates experimental results using the new method. In this new
method,
a fixed amount of protamine is added to the cup, and varying amounts of
heparin are
added. In FIG. 26, the same amount of protamine is present in all of the
sample cups for
all of the heparin concentrations shown. Various amounts of protamine were put
in 1
milliliter of phosphate buffer. 5 micrograms of protamine were put in 1
milliliter of
phosphate buffer, with the results indicated at 660. 6 micrograms, 7
micrograms, 8
micrograms, 10 micrograms, and 14 micrograms, were also put into 1 milliliter
of
phosphate buffer, with the results indicated at 658, 656, 654, 652, and 650,
respectively.
FIG. 26A illustrates the results of varying protamine concentrations of a test
system. The results of FIG. 26A can be used in interpreting the output of the
bolus
method electrodes. The results obtained for FIG. 26A are only the results of
varying
concentrations of protamine being exposed to the protamine sensitive
electrodes, with the
change in potential measured over time. The X-axis of FIG. 26A is thus purely
time, and
includes no infusion amount of anything or cumulative infusion of any other
substance.
FIG. 26A may be viewed as simultaneously inserting similar protamine ion
sensitive
electrodes into different protamine standards and the results noted.
The highest concentration protamine, 14 micrograms in 1 milliliter of
phosphate
buffer, is seen at 650. This achieves the most rapid rise in electrical
potential. The
slowest rise in electrical potential is seen with the protamine ion sensitive
electrode
inserted into the most dilute protamine sample of 5 micrograms per 1 mil. of
phosphate
buffer, seen at 660. The 14 microgram, concentrated protamine sample may be
seen to
achieve a maximum rate of change at about 15 seconds, with the most dilute, 5
microgram
protamine sample achieving the maximum rate of change at about 100 seconds.
The peak rate of change is also shown on FIG. 26A, with 651 representing the
rate
of change or first derivative of plot 650, for 14 micrograms of protamine per
milliliter of
phosphate buffer. The potential rate of change plots for 10 micrograms may be
seen at
653, for 8 micrograms at 654, for 7 micrograms at 656, for 6 micrograms at
658, and for 5
micrograms at 661.
An inset plot 670 may be seen in FIG. 26A, showing a plot of protainine
concentration versus peak time in seconds. Thus, the protainine concentration
of a sample
may be derived from the time required to achieve the peak rate of change of
electrical
potential versus time. In another method, the protamine concentration of a
sainple may be
CA 02567137 2006-11-17
WO 2005/116623 PCT/US2005/016463
47
derived from the maximum slope of the curve, i.e. the slope at the inflection
point. For
example, inspect the "first derivative" plots, the odd numbered plots from 651
through
661, taking note of the peak heiglit variation with protamine concentration.
This method, for determining protamine concentration, can be used to determine
heparin concentration. This can be done using the "bolus" inethod of the
present
invention. A known bolus of protainine can be added, sufficient to completely
bind the
heparin expected in a sainple, sufficient to leave excess protamine in
solution.
The protamine ion selective electrode can be exposed to the excess protamine
and
the time to peak potential rate of change noted. This time can be used in
conjunction with
a calibration curve such as 670 to obtain the remaining protamine in the
sample. Using the
initial, known protamine, and the stoichiometric binding of the known
protamine to the
heparin, the heparin concentration in the sample can be calculated. This
method would
require no titration. This method could also be used in conjunction with a
sample
cartridge having a known protamine amount preloaded into a cartridge, ready to
receive a
heparin sample injected into the cartridge.
Log (dEMF/dt) Bolus Method
FIGS. 26B and 26C illustrate experimental results and a method that can be
used
with the bolus method to determine the heparin concentration in a sample.
By way of introduction, detection of heparin can be accomplished with
automated
potentiometric titrations of heparin, using continuous addition of a standard
protamine
solution into a sample solution using a dispensing system, for example having
a pressure
pump and a micro-valve. However, the instrumentation is complex and may not
easily be
miniaturized.
To eliminate the dispensing system, applicants developed a method including
pre-
loading a fixed amount of dry protamine in the cartridge to neutralize heparin
in the
sample, and measuring the electrode potential response of the extra free
protamine. In this
method, the response process is recorded and the time required to achieve the
maximum
response rate is used for heparin quantization. However, this quantitative
method may be
time consuming, in order to get enough of the response curve, especially for
samples
containing high concentrations of heparin. In addition, there is no linear
relationship
between the endpoint time measured and the heparin concentration in the sample
(see FIG.
26A).
CA 02567137 2006-11-17
WO 2005/116623 PCT/US2005/016463
48
Here we describe a new quantitative method for the dry protamine bolus
concept.
In this method, the initial potential response rate (dEMF/dt) is measured (see
FIG. 26B)
and a good linear relationship between heparin concentration and the logarithm
of
dEMF/dt is used for heparin calibration (see FIG. 26C).
With this method, there is no need to wait for the whole response process; but
only
the initial response may need to be recorded, so the whole analysis can be
rapidly
completed. In addition, applicants believe that the optimum linear range for
heparin
measurement can be readily adjusted by changing the sample stir rate. Higher
stir rates
show a narrow linear range, but with a high resolution, for low concentrations
of heparin,
which is suitable for use in a Catheter Lab; while low stir rates show a wide
linear range
with a relative low resolution and can be used in CVOR.
Example Heparin Assay Cartridge System Using Bolus Method
FIG. 29A sliows a diagram of the primary elements of a cartridge-based system
700 using a positive-displacement bi-directional fluid pump 730 for fluid
transport and
stirring. System 700 includes a cartridge 750, a sample applicator 740, and a
controller/analyzer represented by a computer 728.
Cartridge 750 includes a cartridge body 752 containing a fluid path 756. Fluid
path 756 extends from a sample chamber or sample port 754, past a first sensor
chamber
758, past an optional second sample chamber 759, to a pressure port 760. Fluid
path 756
includes a first portion 720 disposed between sample port 754 and sensor
chambers 758
and 759, and a second portion 722 disposed between the sensor chambers and
pressure
port 760. A first sensor 762 is shown inserted into sensor chamber 758 to
bring the ISE or
ISEs into contact with fluid path 756. In some systems, the ISE is screen
printed on a
polyester substrate, and the sensor chamber is initially open to the bottom.
The ISE can be
adhesively applied to the sensor chamber bottom, sealing the sensor chamber.
The ISE
may include a protamine ISE and a reference ISE, and may includes a second ISE
and
corresponding reference ISE, where the second ISE may be used to measure a
different
analyte. Sample chamber 758 may contain an amount of dried protamine
sufficient to
neutralize the largest amount of heparin anticipated to be in the sample.
Bi-directional pump 730 may be attached through a pressure line 734 to
pressure
port 760 at the most distal point of the fluid path. The bidirectional pump
may be
CA 02567137 2006-11-17
WO 2005/116623 PCT/US2005/016463
49
controllable in discrete increments of linear travel, indicated at 732, by a
pump motor
736. Pump motor 736 can be controlled by a motor controller circuit 738, which
is in turn
connected by a motor controller cable 739 in some systems, to a lab instrument
interface
circuit installed in computer 728.
Sensor chamber 758 may be located midway through cartridge fluid patli 756,
and
may contain a protamine-sensitive sensor 762. The sensor may be connected
through a
sensor connector 708 to a sensor amplifier 724, which can buffer and amplify
the signal
from the high-impedance sensor. Sensor ainplifier 724 may be connected by a
sensor
amplifier cable 726 to a lab instrument interface circuit installed in
computer 728.
Coinputer 728 is used to represent a data acquisition and control device
generally. Such a
device can be used to drive pump 730 and monitor sensor 762. Any suitable
dedicated
device, programmable device, or microcontroller may used as this device.
A metered volume of sample containing heparin can be introduced into sample
chamber or port 754 using a sample applicator 740. The bidirectional pump 730
may be
activated to repeatedly draw the sample fioin the chamber into fluid path 756,
and then
push the sample back into the chamber, in order to agitate and dissolve the
protamine into
the sample. This action could be started either automatically by a sensor, or
by a user's
key press.
After the protamine is dissolved into the sample, bidirectional pump 730 may
draw
the sample into sensor chamber 754. The sample may be stationary in the sensor
chamber
for approximately 30 seconds to "wet" the sensor membrane in sensor 762, with
the
computer monitoring the sensor signal. Bidirectional pump 730 may then move
the
sample in a back-and-forth oscillation across the sample chamber 758 while the
computer
continues to monitor the sensor signal. The oscillation facilitates the
diffusion of ions into
the sensor membrane while the computer measures the sensor response, and the
heparin
concentration may be determined from the slope of the response curve to free
protamine
witliin the first minute or two after oscillation begins.
One Example of Bolus Method
One procedure for heparin measurement using a cartridge system with preloaded
dry protamine and citrate bolus are given below. This example utilized a
Labview program
CA 02567137 2006-11-17
WO 2005/116623 PCT/US2005/016463
running in a computer program interfaced to a bread boarded, prototype
embodiment
according to the present invention. A system similar to that of FIG. 29A was
utilized.
1. When the blood sample (0.15 mL) is added to the sample reservoir, the
operator
5 can click "Start Measurement" on the keyboard to start the program. The
piston of the
syringe pump can draw the sample into the cartridge channel and move the
sample back
and forth for about 1 min to mix with dry protamine and citrate preloaded in
the channel.
2. Then the resulting sample solution can be drawn into the sensor chamber and
the
10 Labview program will be activated to record the potentials of sensor
membrane
(measuring every second). The sample solution will be held on the sensor
surface for a
wetting period of 30 sec.
3. After wetting, the pump starts oscillation, and the membrane potentials
increase
15 dramatically due to the rapid protamine diffusion into membrane phase.
4. The oscillation takes 30 sec, and then the measurement is finished.
5. The pump piston will be reversed to its original position for the next
20 measurement.
6. The initial response rate (dEMF/dt, the slope of the linear curve) can be
calculated by using 5 potentials measured at 33, 34, 35, 36, and 37 sec. In
some methods,
the initial response slope is measured in the portion defined by three points
in which the
25 line segments on either side of the middle point are closest to the line
between the two
outer points, or the minimum distance between the middle point and a line
drawn through
the two points on either side of the middle point. In other methods, the
average of the
slope of the line segments between the measured points is used as the initial
slope.
30 7. Higher concentrations of heparin in blood neutralize more protamine in
the
cartridge, and therefore show less response. See FIG. 30A. After logarithm
conversion of
CA 02567137 2006-11-17
WO 2005/116623 PCT/US2005/016463
51
dEMF/dt for each concentration, a linear calibration curve can be obtained
(See FIG.
30B).
Two Sensor Cartridge
FIGS. 29B-29D further illustrate cartridge 750 having two ISE sensor chambers.
FIG. 29B is a top view, 29C a bottom perspective view, and 29D a top
perspective view of
the cartridge. Cartridge 750 includes body 752 having first sample chamber or
sample
port 754 coupled to fluid path 756 which includes first sensor chamber 758,
second sensor
chamber 759, and can terminate in either a blind cavity or a pressure port
760. First sensor
762 may be seen inserted into first sensor chamber 758, which, in this
embodiment, is
open at the bottom.
Viscosity Compensation Method
An advantage to the bidirectional pump system over a rotationally-stirred
sample
chamber is that the puinp system is positive-displacement, and should be
relatively
insensitive to changes in viscosity of whole blood due to varying hematocrit
and
hemodilution. If viscosity must be taken into account for greatest precision,
this could be
done by using an additional separate sensor and fluid path, where the fluid
path
dimensions cause capillary flow of the sample, and the time for the sample to
travel a
known fluid path length to reach the sensor is measured and used to calculate
the relative
viscosity of the sample.
Alternate Einbodiments for the Heuarin Assay Cartridge System
Several methods can be used to enhance the performance of the Heparin Assay
Cartridge System.
A method could be incorporated into the cartridge to automatically meter the
sample volume. This could be implemented by using a gas-permeable vent in
combination with the bidirectional pump. Alternatively, an arrangement using
valves or
two pumps could be used to isolate and transport a metered volume.
An anticoagulant such as sodium citrate or disodium EDTA can be combined into
the sample to increase the sensitivity of the system when used with whole
blood. This
CA 02567137 2006-11-17
WO 2005/116623 PCT/US2005/016463
52
can be done either prior to introduction of the sample into the sample
chamber, or as an
initial step within the sample chamber.
Two separate settings for bidirectional pump speed could be used for
optimizing
sensitivity vs. range for the differing requirements of the Cardiovascular
Operating Room
(CVOR) and the Cardiac Catheterization Laboratory. These could be used in
coinbination
with cartridges containing two different amounts of protamine, and could be
selected
either automatically by a code on the cartridge, or manually by the user.
Alternatively, an
adaptive algoritlun could be used to monitor the initial slope, and then
automatically
change the pump speed setting for best combination of sensitivity and range.
Separate settings could be selected by the user to apply different slope-to-
concentration algorithms for different types of low-molecular-weight heparin
as well as
unfractionated heparin. For low-molecular-weight heparin, the results could be
displayed
in various units including anti-Xa correlation. Alternatively, an algorithm
could be
selected to measure the combined effect of multiple heparin types contained
within the
sample.
The sample chamber could contain liquid protamine instead of dried protainine.
The protamine could be held within the chamber by a thin-stretched film over
the chamber
top, and the sample applicator could be used to simultaneously penetrate the
film and
introduce the sample into the chamber.
Direct Heparin Sensor
The above embodiments make use of a protamine sensor to measure the amount of
heparin through stoichiometry. A heparin sensor has also been developed that
responds
directly to the heparin in the sample. When a heparin sensitive electrode is
used in the
heparin assay cartridge system, there is no need to place protamine in the
cartridge, and
accurate sample volume may not be required. The heparin is directly measured
and the
response slope can be directly converted into the heparin concentration. The
use of a
sample blank, having the heparin inactivated, may be useful in this method.
CA 02567137 2006-11-17
WO 2005/116623 PCT/US2005/016463
53
Test Strip with Current-Driven Ion Exchange
Another embodiment of the heparin assay disposable and its instrument
interface
would produce a low-cost laminated test strip with no moving part required in
the
instrument. This embodiment uses a direct heparin sensor in combination with
disposable
designed to produce capillary flow of the sample to the sample chamber after
the user
deposits the sample on the disposable. Additionally, this embodiment does not
require a
bidirectional pump to stir the sample across the sensor. Instead, a voltage is
applied to the
sensor to facilitate ion exchange across the sensor membrane. This method
might use
alternating time periods of current drive and sensor monitoring, or a
compensated sensor
circuit might be devised to provide simultaneous current drive and sensor
monitoring.
Enhanced Sensitivity
Unlike many other electrochemical potentiometric sensors, protamine ion
selective
electrode sensors have a unique response that is not a typical Nernst
response. Instead, it
relies on the non-equilibrium steady state ion exchange process occurring at
the interface
between the sensor's polymer membrane and the sample solution. The protamine
sensitive sensor response is determined by both the protamine diffusion in the
sample
phase and the diffusion of the protainine-ion exchange complex inside the
polymer
membrane phase. The sensor's low detection limit can be significantly improved
by
rotating the sensor at a high speed, for example, 3,000 RPM, which may or may
not be
practicable when used in conjunction with various einbodiments of the present
invention.
In one method according to the present invention, diffusion is enhanced inside
the
polymer membrane by changing the boundary condition from constant
concentration
change/flux (as in a previous method) to a constant concentration. Diffusion
enliancement
inside the membrane phase is confirmed by theoretical simulation.
Specifically, a
theoretical simulation shows that in a constant boundary concentration case,
there is a
higher analyte concentration inside of the membrane phase than that in the
constant flux
case. This means a higher potential change of the sensor, which means improved
sensitivity.
FIG. 27 shows a theoretical plot indicating a concentration at 5 micrometers
from
the boundary, inside the membrane. Plots 684-696 indicate the concentration at
5
micrometers inside of sensor membrane boundary. Various amount of protamine
are
CA 02567137 2006-11-17
WO 2005/116623 PCT/US2005/016463
54
presented in the aqueous sample phase as constant concentration (684-696)
versus
continuous dispensing of protamine in the aqueous phase (682). In this
theoretical plot,
within the time frame of 250 seconds, when the ion exchange membrane is
exposed to a
high concentration of protamine, the concentration within the membrane rises
the most
rapidly, as seen at 684. Conversely, the concentration of protamine within the
meinbrane
rises the most slowly when exposed to a lower concentration of protamine, seen
at 696.
The results for varying concentrations of protamine, specifically, 5, 6, 7, 8,
9, 10, and 11
micromolar concentrations of protamine seen respectively at 696, 694, 692,
690, 688, 686,
and 684. The theoretical concentration of protamine 5 micrometers within the
membrane
using the previous valve-dispensing metliod is shown at 682. Thus, at 300
seconds, the
old method would show about 0.2 concentration (arbitrary units) of protamine
while the
10 micromolar concentration of protamine in the constant concentration case
would show
almost double that concentration (arbitrary units) within the membrane.
Thus, compared witli the previous titration method, the new bolus method is
more
sensitive and doesn't need protamine to be dispensed during the test. Hence,
instrumentation can be simplified. Also, simultaneous calibration can be
possible after
filtering or otherwise removing heparin from the sample separately, since
multiple tests
can be done on the same disposable cartridge without using multiple dispensing
units.
Lower detection limits and improved resolution can enable this sensor to
monitor
therapeutic level heparin (both higli and low molecular heparin).
Ion Selective Electrode Pol-vner
The present invention can utilize generally a polymeric meinbrane forming an
ion
selective electrode that is selective for protamine. Generally, this ion
selective electrode
may include a polymer, an ionophore or ion exchanger that preferentially binds
protamine,
and zero, one or more plasticizers that facilitate or enhance diffusion of
protamine into the
meinbrane. Various polymers, ionophores, and plasticizers and/or additives, if
so desired
or necessary, can be used, with varying degrees of success, in the present
invention. In
one embodiment of the invention, a specialized polyurethane is used as at
least one
polymer in the polymeric matrix. This specialized polyiner includes
alternating blocks of
so-called "soft" or rubbery segments (having easy segmental rotations at
ambient
temperature) and "hard" (crystalline, semi-crystalline or glassy) segments.
The hard and
CA 02567137 2006-11-17
WO 2005/116623 PCT/US2005/016463
soft segments may separate from each other, thereby forming hard and soft
segment
micro-domains. The first step of synthesis of this specialized polymer, which
is a
thermoplastic elastomer, is the production of a pre-polymer in which the ends
of the
polymer chain is terminated by isocyanate groups (-N = C = O) or hydroxyl
groups (-OH).
5 The production of the prepolymer may involve the use of a preformed chain
terminated by
hydroxyl groups, for example a polyester glycol, polyether glycol, hydrocarbon
glycol,
polydimethylsiloxane glycol, or a polycarbonate glycol. The glycol chain is
then reacted
with one or more diisocyanates, for example methylene-4, 4'-diphenyl
isocyanate (MDI),
dimer isocyanate, metlrylene-4,4'-dicycloxyl isocyanate (H12-MDI),
hexylmethylene
10 diisocyanate, or any other suitable diisocyanate. The resulting pre-polymer
is then reacted
with one or more diols and/or diamines, for example ethylene diamine and/or
butane diol,
to link the ends of the prepolymer chains together and thus generate the
polymer chains of
the thermoplastic elastomer.
One polyurethane used according to one embodiment of this invention is
illustrated
15 in FIG. 28 as having a combination of soft segments and hard segments. The
soft
segments are generally formed by the reaction of dimer isocyanate, for example
1-decyl-4-
nonyl cyclohexyl diisocyanate (having a pentyl group at ring position 2 and a
hexyl group
at position 3), with either butane diol and/or dimer diol, for example 1-decyl-
4-nonyl '
cyclohexyl diol (having a pentyl group at ring position 2 and a hexyl group at
position 3).
20 FIG. 28 shows one example of the soft segment that may be formed in the
reaction
product of dimer diisocyanate, dimer diol and butane diol when reacted in a
molar ratio of
2:1:2, respectively. In general, the soft segments contain botli straight
chain aliphatic and
cyclic aliphatic regions between the urethane groups. The cyclic aliphatic
regions may
have straight chain aliphatic groups pendent therefrom. In the example shown
in FIG. 28,
25 the cyclic aliphatic groups are shown to have pentyl and hexyl aliphatic
linear groups at
the 2 and 3 positions of the ring, respectively, however many other isomers
for dimer
isocyanate and dimer diol are possible. Applicants do not believe that the
length of the
straight chain aliphatic regions, such as the butane diol, is critical.
Applicants believe that
either straiglit chain aliphatic or cyclic aliphatic groups may be used to
form the ion
30 selective electrode soft segment region, however other hydrophobic moieties
may also
provide acceptable polyurethanes.
CA 02567137 2006-11-17
WO 2005/116623 PCT/US2005/016463
56
FIG. 28 also shows one example of a polyurethane hard segment that may be
formed as the reaction product of methylene diphenylisocyanate, dimer diol
(for example
1-decyl-4-nonyl cyclohexyl diol), and butane diol when reacted in a molar
ratio of 5:3:1,
respectively. The hard segments thus contain alternating regions of methylene
diphenylisocyanate with either cyclic aliphatic regions or straight chain
aliphatic regions,
as described above with respect to the soft segment.
Polyurethanes that can be used in the present invention are described in U.S.
Patent
No. 4,873,308, herein incorporated by reference in its entirety.
Example of Protamine Sensor Preparation
One example of how to prepare an ion selective electrode polymer solution to
be
used in the production of a protamine sensor follows:
Combine 21.0 mg of dinonyl naphthalene sulfonate (DNNS) from King Industries,
Norwalk, CT with 300 mg of 2-nitrophenyloctyl etlier (NPOE) from Fluka Chemika
Biocheinika, Ronkonkoma, NY in a glass container. Then add 3.0 mg of
tetradodecylammoniuni tetrakis (4-chlorophenyl) borate (ETH500) from Fluka
Chemika
Biochemika, Ronkonkoma, NY and 80 mg of Terpolyiner (PVC/ PVA/
polyhydroxypropyl aciylate) from Scientific Polymer Products, Ontario, New
York into
the same glass conitainer. Next add 197 mg of the polyurethane described
elsewhere in the
present application and 395 mg of Pellethane 2363-AE from Dow Chemical,
Midland, MI
into the same glass container. Then add 5.68 ml cyclohexanone solvent and stir
using a
stirrer bar and a magnetic stirrer. Allow components to dissolve coinpletely.
Preferably,
the resultant polymer solution will have no solids present and will have a
viscosity of
about 450 cp. If the viscosity of the polymer solution is to low, the polymer
solution can
be concentrated to raise the viscosity. If the viscosity of the polymer
solution is to high,
solvent can be added to the polymer solution to lower the viscosity.
The silver leads of a sensor are treated with 0.1 M 0.1 M FeCl3 solution
containing
0.5 M HCl for 5 min to form Ag/AgCl electrodes. The electrodes are then washed
with
de-ionized water and dried overnight in a fume hood at room temperature. One
drop (3
L) of the polymer solution is then applied on one electrode, for example the
right hand
side electrode. The other electrode or left hand side electrode is not coated
and serves as a
reference electrode. The polymer-covered sensors are placed in the fume hood
and dried
CA 02567137 2006-11-17
WO 2005/116623 PCT/US2005/016463
57
for 3 hours at room temperature. Additional applications of the polymer
solution to the
electrode followed by drying may be repeated as desired to achieve a desired
membrane
thickness. Following application of the last polymer coating step the
electrodes are
thoroughly dried, for example by placing the electrodes in fume hood at room
teinperature
for 24 hours.
Preferably, the tip of the silver is completely covered by the membrane. The
performance of the sensors is not affected if the side of the meinbrane
coating (not the
silver) is cut or has small bubbles. If the viscosity of the polymer solution
is too low, the
polymer may spread into a larger area and cover the reference electrode so
that the sensor
may be scrapped. On the other hand, if the viscosity of the polymer solution
is too high, it
will be difficult to get an optimum sized droplet. The sensors are generally
acceptable if
the tip of the silver is completely covered by the polymer membrane and the
polymer does
not cover the reference electrode.
Concentration ranges (in terms of weight percent) of membrane components for
various embodiments of the protamine sensor are given below. The "specialized
polyuretliane" is the polyurethane illustrated in FIG. 28 and discussed in the
associated
text. ETH 500 is a lipophilic salt commonly used as an additive in polymeric
sensor
membrane to reduce the membrane impedance. The chemical name is
Tetradodecylammonium tetrakis (4-chlorophenyl) borate, purchased from Fluka
Chemika
Biochemika, Ronkonkoma, NY. Pellethane is a trademark of The Dow Chemical
Company, it includes a group of polyurethanes. The pellethane used in the
sensor
membranes below is Pellethane 2363-80AE from Dow Chemical, Midland, MI. More
information may be currently found at the Dow website at
littp://www.dow.com/engineeringplasties/-P-rod/na/loel.htm.
Terpolymer (PVC/ PVA/ polyhydroxypropyl acrylate) is available from Scientific
Polymer Products, Ontario, New York. The composition is vinyl chloride 80%,
vinyl
acetate 5%, and hydroxyl propyl 15%.
First Composition:
DNNS (0.5-8%)
NPOE (15-60%)
CA 02567137 2006-11-17
WO 2005/116623 PCT/US2005/016463
58
ETH 500 (0.1-1%)
Terpolymer (2-15%)
Specialized Polyurethane(10-50%)
Pellethane (10-60%)
Second Composition:
DNNS (1-5%)
NPOE (20-40%)
ETH 500 (0.2-0.5%)
Terpolymer (5-12%)
Specialized Polyurethane (15-30%)
Pellethane (30-50%)
Third Composition:
DNNS (2%)
NPOE (30%)
ETH 500 (0.3%)
Terpolymer (8%)
Specialized Polyurethane (20%)
Pellethane (40%)
Self-Plasticizing Membranes
In one aspect of the invention, in an alternative embodiment, the ISE
membrane/polymer is self-plasticizing. Plasticizers are typically used in ISE
membranes
and may fonn a considerable portion of (e.g. even half) of the membrane
weight. The
plasticizer allows the analyte to migrate througli the ISE membrane. In some
ISE
membranes according to the present invention, there is no, or essential no
unbound
plasticizers in the ISE membranes. The membrane may be formulated from a
polymer
CA 02567137 2006-11-17
WO 2005/116623 PCT/US2005/016463
59
with a backbone, which may be an acrylate backbone and have a plurality of
pendant
lipophilic plasticizing groups.
The membrane can be formulated from a polymer having an acrylate backbone
and a plurality of pendant lipophilic plasticizing groups to provide the
polymer with a Tg
of -IO C or less. The Tg of the polymer can be measured directly using any
suitable
apparatus. The polymer Tg lies in the range from-10 C to-70 C, or from -30 C
to -60 C,
in some einbodiments. The lipophilic plasticizing groups are C3-7 alkyl groups
in soine
polymers used in the present invention. Use of C3-7 alkyl acrylates in the
polymer can
provide a polymer that is inherently soft and does not require added
plasticizer, i.e. the
polymer is in effect self- plasticizing.
Other Membrane Materials
Materials such as ceramics, metal-oxides, glass, and polyiners could be used
as
part of the membrane carrying the ionophore in some alternate embodiments. In
a less
preferred embodiment, if porous glass or ceramic were used, the pores may be
loaded with
ion-selective cocktail or polymer solution. Some polymers can include
polyurethane, PVC,
and silicone rubber. Some polymers may not require a separate, added
plasticizer. The
polymer used according to the invention may have an acrylate backbone and may
be a
polymer or copolymer of one or more of the following monomers: propyl
acrylate, butyl
acrylate, pentyl acrylate, hexyl acrylate, lleptyl acrylate. The polymer may
be a
homopolymer or may be a co-polymer including two or more different monomer
units.
The different monomer units may be derived from C3-7 alkyl acrylates as
described
above.
Example Titration Procedure Using Protamine Sensor
Heparin solutions containing 1,000 U/mL and 100 U/mL of heparin are prepared
by serial dilution with phosphate buffered saline (PBS) (pH =7.4) of a heparin
USP stock
solution containing 10,000 U/mL. The 100 U/mL heparin stock solution is used
to prepare
the heparin sainples required for titration in buffer, whole blood or pooled
plasma (2, 4, 6
U/mL, etc.). A protamine solution is then prepared in saline (0.9%) from a
stock solution
of Protamine Sulfate USP Injectable, which contains 250 mg activity per 25 ml
of
solution. The final concentration of the protamine solution is 10 mg/ml. The
stock solution
is refrigerated. The protamine test solution is usually stable at room
temperature for one
week. PBS buffer solution is prepared by dissolving 1 foil pouch of dry PBS
powder
1
CA 02567137 2006-11-17
WO 2005/116623 PCT/US2005/016463
(Sigma-Aldrich) into 1 liter of de-ionized water. Citrated whole blood is
prepared by
mixing 5 ml of 3.4% sodium citrate per 50 ml of whole blood. Plasma is
prepared by
centrifuging citrated whole blood. Plasma (about 150 ml) may be stored at -20
C in 10
mL centrifuge test tubes. The frozen plasma is generally stable for 24 weeks.
5 The sensor is connected to the appropriate hardware, e.g., an electric
circuit board
from Alberta Printed Circuits and an electronic control circuit from National
Instruments.
Make sure the electrode is placed in the correct position. Following
connection of the
sensor to the appropriate hardware and software, the sensor may be calibrated.
When
ready to calibrate the sensor, start running the data acquisition or control
software (e.g.,
10 Labview Software) on an appropriate computer, e.g., a Toshiba satellite
2065 CDS laptop
computer, connected to the appropriate hardware. The control software
implements
algorithms described in the present application. Alternatively, the titration
could be
perforined manually. While running Labview, click on "STARTDAQ". The potential
(EMF) response of the sensor will be shown in the window. The green line
indicates the
15 EMF change with time, while the red line shows the first differential of
the EMF response
(dEMF) change with time. When the baseline is stable, click" Start LEE-VALVE".
The
protamine will be dispensed into the sample as a titrant at 1 drop per second
from a
inicrodispensing valve with an integral nozzle (part number: INKA2437210H, VHS-
LT
valve, Lee Co., Essex, CT). The dispensing rate can be multiplied by 2, 5 -or
10 times if
20 clicking "SO", "S1" or both of them. Click "STOP DISPENSE", when the
response curve
reaches a stable maximum potential. Click "SAVE DATA" and give an appropriate
file
naine. Repeat the steps for another titration. Exit LABVIEW when all the
measurements
are completed. The concentration of the heparin present in the solution and
the amount of
protamine needed to neutralize the heparin can be calculated by the
calibration time and
25 the response time from the heparin unknowns using the same Excel work
sheet.
A calibration curve is made for each of the samples used, such as buffer,
plasma or
whole blood. The calibration time for plasma and whole blood is greater than
that of the
buffer solution. A minimum of 2 calibration curves/titration curves can be
taken for each
of the samples tested. The samples used for the calibration do not have any
heparin in it.
30 The time in seconds to reach the end point is used to calculate the heparin
concentration of
the unknown samples. One (1) minute incubation time is given for each of the
sensors
CA 02567137 2006-11-17
WO 2005/116623 PCT/US2005/016463
61
tested before running the experiment in whole blood or pooled plasma (no
incubation time
for buffer solution).
For a titration experiment, pipette one (1) ml of the fresh sample solution
into a
sample cup. Add a magnetic stirrer bar into the sample solution. The sample
solution is
then stirred at a constant speed (e.g. 600 rpnl) using a magnetic stirrer
(American
Scientific Products) in order to achieve a rapid mixing of the solution. It is
preferable to
maintain a constant speed of mixing to get reliable data. Make sure the sensor
is
connected to the electric circuit board. Double check to confirm the electrode
is placed in
the correct position. Place the membrane end of the sensor in the sample
solution. It
should be placed in such a way that the sensor does not touch the magnetic
stirrer and the
polymer membrane is in the sample solution. Start an air pump (DP0105, Nitto
Kohki, Co.,
Ltd.) and apply an air pressure of 300 inmHg (-5.9 psi) using a pressure
regulator (Type
100, Controlair Inc.) around the liquid protainine pouch. In this case, the
volume of one
drop of protamine solution dispensed through Lee valve is 25 nL. Follow the
procedures
described above.
Each unit of heparin present in the sample solution prolongs the response
time.
(e.g.: Beef lung heparin I U/ml Heparin - 30 seconds, Porcine Mucosa Heparin -
25
seconds, LMWH Fragmin - 22.5seconds, LMWH Normiflow - 35 seconds, LMWH
Lovenox - 40 seconds The concentration of heparin present is calculated using
the
calibration time, titration end point for the unknown samples and the type of
heparin. The
amount of protamine required to neutralize the heparin can be calculated using
the heparin
- protamine binding stoichiometry (1 mg of protamine reacts with 100 U of
heparin).
All publications, patents and patent documents are incorporated by reference
herein, as though individually incorporated by reference. The invention has
been
described with reference to various specific and preferred embodiments and
techniques.
However, it should be understood that many various and modifications may be
made
while remaining within the spirit and scope of the invention.