Note: Descriptions are shown in the official language in which they were submitted.
CA 02591926 2007-03-16
WO 2006/034427 PCT/US2005/034083
DIAGNOSIS OF FETAL ANEUPLOIDY
Background of the Invention
Field of the Invention
The present invention relates to a method for the early non-invasive diagnosis
of fetal
aneuploidy. In particular, the invention concerns the diagnosis of fetal
aneuploidy by
identifying protein expression patterns characteristics of aneuploidy in a
maternal biological
fluid, such as maternal serum or amniotic fluid.
Description of the Related Art
Proteomics
The large-scale analysis of protein expression patterns is emerging as an
important and
necessary complement to current DNA cloning and gene profiling approaches
(Pandey and
Mann, Nature 405:837-46 (2000)). DNA sequence information is helpful in
deducing some
structural and potential protein modifications based on homology methods, but
it does not
provide information on regulation of protein function through post-
translational modifications,
proteolysis or compartmentalization.
Traditional gel-based methods, such as one- and two-dimensional gel
electrophoresis are
useful for small-scale protein detection (<1,000 proteins), but these require
large sample quantity
(Lilley KS, Razzaq A, Dupree P: Two-dimensional gel electrophoresis: recent
advances in
sample preparation, detection and quantitation. Curr Opin Chem Biol. 6(l):46-
50, 2002).
Approaches to overcome this limitation include matrix-assisted or surface-
enhanced laser
desorption/ionization (MALDI or SELDI) time-of-flight mass spectrometers that
accurately
generate profiles showing the masses of proteins in a sample. These patterns
or profiles can be
used to identify and monitor various diseases. The second level of
identification comes from
coupling peptide mapping to tandem mass spectrometry to generate amino acid
sequence
information from peptide fragments. This can, for example, be achieved by
coupling the
MALDI/SELDI or ESI to quadrupole time- of-flight MS (Qq-TOF MS). The latter
method can
also be used for quantification of specific peptides (ICAT technology).
~
SUBSTITUTE SHEET (RULE 26)
CA 02591926 2007-03-16
WO 2006/034427 PCT/US2005/034083
Fetal AneuEloidy
Fetal aneuploidies are aberrations in chromosome number and commonly arise as
a result
of a meiotic nondisjunction during oogenesis or spermatogenesis, however
certain aneuploidies,
such as trisomy 8, result more often from postzygotic mitotic disjunction
(Nicolaidis & Petersen,
Human Reproduction, 13(2):313-319, (1998)). Such abberations include both
reductions and
increases in the normal chromosome number and can involve autosomes as well as
the sex
chromosmes. An example of a reduction aneupolidy is Turner's syndrome, which
is typified by
the presence of a single X sex chromosome. Examples of increases in chromosome
number
include Down's syndrome (trisomy of chromosome 21), Patau syndrome (trisomy of
chromosome 13), Edwards syndrome (trisomy of chromosome 18), and Kleinfelter's
syndrom
(an XXY trisomy of the sex chromosomes). Aneuploidies commonly lead to
significant physical
and neurological impairments which result in a large percentage of affected
individuals failing to
reach adulthood. In fact, fetuses having an autosomal aneuploidy involving a
chromosome other
than 13, 18, or 21 generally die in utero. However, certain aneuploidies, such
as Kleinfelter's
syndrome, present far less pronounced phenotypes and those affected with other
trisomies, such
as XXY & XXX, often will mature to be fertile adults.
Down's syndrome is the most common single pattern of malformation in man, and
is one
of the most common serious congenital abnormalities found at birth, with a
prevalence of one in
660 live births (Jones, K., Down's Syndrome, in Smith's recognizable patterns
of human
malformation, Jones, K., Editor, 1997, Philadelphia, PA, pp. 8-13).
Approximately a third of all
fetuses with Down's syndrome who are alive in the second trimester will not
survive to term;
thus, the true prevalence of Down's syndrome in the second trimester is closer
to 1 in 500
pregnancies-(Cuckle, H., Epidemiology of Down Syndrome, in Screening for Down
Syndrome in
the First Trimester, J. Grudzinkas and R. Ward, Editors, 1997, RCOG Press,
London, UK, pp. 3-
13.). A majority of infants with Down's syndrome have serious cardiac,
gastrointestinal, or other
abnormalities that lead to significant morbidity and mortality. In addition,
most have an IQ of
less than 50, making this syndrome one of the leading causes of mental
deficiency in the United
States. Approximately 2.5 million pregnant women undergo serum screening for
Down's
syndrome each year in the United States, and, in the absence of screening,
approximately 4,000
of these pregnancies may result in birth of a baby with Down's syndrome
(Palomaki, G.E., et al.
Am. J. Obstet. Gynecol. 176(5):1046-1051 (1997)).
While Down's syndrome is the most prevalent aneuploidy in live births,
aneuploidies of
chromosomes 13, 18, and the sex chromosomes affect a significant number of
individuals.
2
SUBSTITUTE SHEET (RULE 26)
CA 02591926 2007-03-16
WO 2006/034427 PCT/US2005/034083
Trisomy 18, for example, has a prevelance of approximately 1 in 7000 births
and Trisomy 13 has
a prevalence of approximately 1 in 29,000 births (Nicolaidis & Petersen,
supra). Other
aneuploidies occur at significant rates during pregnancy, but result in
spontaneous abortion
before the fetus reaches term, usually within the first 15 weeks of pregnancy
(Nicolaidies &
Petersen, supra). For example, Trisomy 16 is single most prevelant human
trisomy and is
thought to affect 1.5% of all recognized pregnancies, however it is a lethal
chromosomal
abberation (Nicolaidies & Petersen, supra). Trisomies 15 and 8 occur at much
lower rates
(approximately 1.4% and 0.7% of all sponateous abortions, respectively) but
are also lethal
aberrations (Nicoladies & Petersen, supra).
Diagnosis ofFetal Aneuplody
Definitive prenatal diagnosis of fetal aneuploidies requires invasive testing
by
amniocentesis or Chorionic Villus Sampling (CVS), which are associated with a
0.5% .to 1%
procedure-related risk of pregnancy loss (D'Alton, M.E., Semin Perinatol
18(3):140-62 (1994)).
Screening for fetal aneuploidies, such as Down's syndrome, is commonly
performed during
pregnancy to provide patients an assessment of their risk of carrying an
affected fetus. Due to
the risks associated with these invasive testing methods, much interest has
developed in
noninvasive methods of screening for aneuploidy.
While different approaches have been employed in connection with specific
aneuploidies, in the case of Down's syndrome, screening was initially based
entirely on maternal
age, with an arbitrary cut-off of 35 years used to define a population of
women at sufficiently
high risk to warrant offering invasive fetal testing. This approach results in
a detection rate of
20% to 30% of fetuses with Down's syndrome, with a 5% to 7% invasive fetal
testing rate.
Therefore, approximately 140 amniocenteses are required to detect each case of
Down's
syndrome, and one normal fetus is lost for every two affected fetuses detected
(Vintzielos and
Egan, Am J. Obstet Gynecol 172(3):837-44 (1995)).
Because of these limitations, second-trimester serum screening techniques were
introduced in order to improve detection rate and to reduce the invasive
testing rate. Current
standard-of-care for screening for Down's syndrome requires offering all
patients a triple-marker
serum test between 15 and 18 weeks gestation, which, together with maternal
age (MA), is used
for risk calculation. This test assays a-fetoprotein (AFP), human chorionic
gonadotropin
(PhCG), and unconjugated estriol (uE3). If the risk derived from this "triple
screen" is greater
than a predetermined cut-off, the patient is offered invasive testing for
fetal karyotype analysis.
The most commonly used risk cut-off is I in 380 (the term risk of a 35-year-
old woman), which
results in a 65% to 70% detection rate for Down's syndrome, with 5% to 7% of
the pregnant
3
SUBSTITUTE SHEET (RULE 26)
CA 02591926 2007-03-16
WO 2006/034427 PCT/US2005/034083
population offered invasive fetal testing (Wald et al., J Med Screen 4(4):181-
246 (1997)). It is
estimated that 60 arnniocenteses are performed to detect one case of Down's
syndrome, using
MA combined with this second trimester serum "triple screen" (Vintzielos and
Egan, supra).
The current standard-of-care serum "triple screen" for Down's syndrome is now
evolving
into a "quad test", in which the serum marker inhibin-A is added to the other
three analytes. The
quad test has been offered clinically since August 1996 at the Wolfson
Institute of Preventive
Medicine in London, under the direction of Professor Nicholas Wald. The
performance of
inhibin-A in everyday practice has been as predicted. Estimates of the
performance of inhibin-A
as a screening marker have been very consistent. In six published studies,
maternal serum
inhibin-A levels in cases of Down's syndrome pregnancy were, on average, 1.9-
fold greater than
those found in unaffected pregnancies (Wald et al., 1997, supra). It has been
estimated that
inhibin-A is almost as good as the most powerful single marker, (3hCG, as a
univariate predictor
of a Down's syndrome pregnancy (at a fixed 5% screen-positive rate, inhibin-A
has a 44%
detection rate compared with a 49% detection rate for (3hCG) (Wald et al.,
1997, supra). The
addition of inhibin-A to the triple test may improve the Down's syndrome
detection rate of the
"triple screen" to 77% to 80%, for a 5% to 7% invasive testing rate (Wald et
a1.,1997 supra;
Wald et al., Prenat Diagn 16(2):143-53 (1996)). Alternatively, the quad test
may be used to
maintain a 70% detection rate for Down's syndrome, while reducing the invasive
testing rate to
5%, and significantly reducing the number of amniocenteses performed.
In an effort to reduce further the frequency of amniocenteses, second-
trimester screening
ultrasonography has been applied to Down's syndrome screening. The
identification of certain
major fetal structural abnormalities significantly increases the risk of
Down's syndrome and
other aneuploidies, and is then considered an indication for invasive fetal
testing. However, this
approach does not improve population screening for Down's syndrome, since 98%
of fetuses in
the general population do not have structural abnormalities.
Further work has been performed evaluating the role of sonographic markers of
aneuploidy, which are not structural abnormalities per se, and, in the
presence of a normal
karyotype, may not confer any risks to the fetus. Such sonographic markers
employed in Down's
syndrome screening include choroid plexus cysts, echogenic bowel, short femur,
short humerus,
minimal hydronephrosis, and thickened nuchal fold. While some investigators
have suggested
that a sonographic approach may identify up to 73% of fetuses with Down's
syndrome for a 5%
screen-positive rate, these studies have all been derived from populations
already at high risk for
aneuploidy (Benacerraf et al., Radiology 193(1):135-40 (1994)). It is
impossible to accurately
extrapolate the performance of these tests from high-risk populations to
general or unselected
4
SUBSTITUTE SHEET (RULE 26)
CA 02591926 2007-03-16
WO 2006/034427 PCT/US2005/034083
populations since the prevalence of the diseases in question will be
significantly reduced. The
value of this "genetic sonogram" is, therefore, severely limited when applied
to screening of the
general population. In addition, because of the subtlety of the findings, the
performance of
sonographic methods of screening are extremely dependent on the skill and
experience of the
operator, which may not be reproducible when sonographic screening is applied -
outside of
tertiary centers (Ewigman, B.G., et al., N Engl J Med 329(12):821-7 (1993)).
Although the
"genetic sonogram" does not appear to be useful as a primary screening tool,
it may have a role
in reducing the risk of aneuploidy following an initial positive screening
test (Vintzielos and
Egan, supra).
A major problem with second-trimester screening for Down's syndrome is that it
is
performed at 15 to 18 weeks gestation, with diagnostic amniocentesis
subsequently performed, if
indicated, at 16 to 20 weeks gestation. This leads to significant time
pressure on patients and
providers if termination of pregnancy is desired before the commonly used
upper gestational age
limit of 24 weeks is reached. In addition, such later pregnancy terminations
are associated with
increased maternal morbidity (Lawson, H.W., et al., Am J. Obstet Gygecol
171(5):1365-72
(1994)). The value of a sonographic aneuploidy screening program based in the
first trimester
would include safe methods of pregnancy termination if an abnormality is
confirmed, as well as
improvement in patient privacy and confidentiality if abnormalities are
detected at an.early stage
of pregnancy.
Investigators from the Fetal Medicine Foundation in London have suggested an
80%
detection rate for Down's syndrome from screening using a combination of MA
and first-
trimester ultrasound evaluation of the fetus (Pandya, P.P. et al., Br J Obstet
G eacol
102(12):957-62 (1995); Snijders, R.J., et al.,Lancet 352(9125):343-6 (1998)).
This relies on the
measurement of the translucent space between the back of the fetal neck and
overlying skin,
which has been reported to be increased in fetuses with Down's syndrome and
other
aneuploidies. This nuchal translucency (NT) measurement is reportedly easy to
obtain by
transabdominal or transvaginal ultrasonography between 10 and 14 weeks
gestation (Snijders,
R.J., et al., Ultrasound Obstet Gynecol 7(3):216-26 (1996)). The vast majority
of data
supporting first-trimester screening for Down's syndrome is from the Fetal
Medicine Foundation
in London (Pandya et al., 1995, supra; Snijders et al., 1996, supra). However,
the detection
rates for Down's syndrome have not been consistent between different centers
and, to date, no
center outside of the Fetal Medicine Foundation network has been able to
replicate their results. -
There are also data suggesting that first-trimester concentrations of a
variety of
pregnancy-associated proteins and hormones differ in chromosomally normal and
abnormal
SUBSTITUTE SHEET (RULE 26)
CA 02591926 2007-03-16
WO 2006/034427 PCT/US2005/034083
pregnancies. The two most promising first-trimester serum markers with regards
to Down's
syndrome and Edwards syndrome appear to be PAPP-A and free PhCG (Wapner, R.,
et al., N
Engl J Med 349(15):1405-1413 (2003)). It has been reported that first-
trimester serum levels of
PAPP-A are significantly lower in Down's syndrome, and this decrease is
independent of nuchal
translucency (NT) thickness (Brizot, M.L., et al.,Obstet Gynecol 84(6):918-22
(1994)). In
addition, it has been shown that first-trimester serum levels of both total
and free j3-hCG are
higher in fetal Down's syndrome, and this increase is also independent of NT
thickness (Brizot,
M.L., Br J Obstet Gynaecol 102(2):127-32 (1995)). PAPP-A and free PhCG are
also
independent of each other when applied to Down's syndrome screening (Wald and
Hackshaw,
Prenat Diagn 17(9):921-9 (1997)). In a multicenter prospective study, the
combination of.PAPP-
A and free PhCG resulted in a 60% detection rate for Down's syndrome, for a 5%
invasive
testing rate (Haddow, J.E., et al., N Eng J Med 338(14):955-61 (1998)).
Mathematical models
have suggested that a combined first-trimester screening program utilizing MA,
NT thickness,
serum free .(3hCG, and serum PAPP-A will detect more than 80% of fetuses with
Down's
syndrome for a 5% invasive testing rate (Wald and Hackshaw, supra). These
trials and models
have recently been reviewed by Nicolaides (LJltrasound in Obstretics and
Gynecology 21:313-21
(2003)).
While these data suggest that a combination first-trimester screening program
or an
integrated first and second-trimester screening program for fetal
aneuploidies, such as Down's
syndrome, would be superior to standard second-trimester screening, this
hypothesis has not
been validated in clinical practice.
To define the efficacy of first-trimester screening for Down's syndrome, and
to compare
the diagnostic performances of first and second-trimester screening, the NIH
recently sponsored
a multi-center First and Second Trimester Evaluation of Risk (FASTER) trial.
In this
prospective study, patients underwent an ultrasound for NT and had maternal
serum obtained for
PAPP-A and free (3hCG at 10 3/7 -13 6/7 weeks of gestation, and results were
blinded from
patients until after a second risk screening at 15 - 18 6/7 weeks of
gestation, which included a
quad screen (AFP, (3hCG, uE3, and inhibin-A). Over 38,000 patients completed
the study, from
which 117 cases of fetal trisomy-21 were identified, 87 of which had complete
first and second-
trimester data. The diagnostic performance of each test was analyzed by
screening method,
including: cornbined first-trimester screen (NT/PAPP-A/free PhCG /MA); second-
trimester
serum screen (maternal AFP/free PhCG /uE3/inhibin-A/MA); or integrated first
and second-
trimester screen.
6
SUBSTITUTE SHEET (RULE 26)
CA 02591926 2007-03-16
WO 2006/034427 PCT/US2005/034083
While these data confirm the utility of first-trimester, or combined first and
second-
trimester integrated screening, there are important limitations. First, these
tests are highly
dependent upon gestational age, and become less discriminatory as gestation
advances.
Secondly, to optimize the detection of Down's syndrome, all of these tests
have low screen-
positive rates (5%) and extraordinarily high true false-positive rates (in
excess of 90%), resulting
in patient anxiety and unnecessary invasive amniocentesis for genetic testing.
Thus, there is an
urgent need for alternative tests that are reliable and robust across a wide
range of gestational
ages and that have a lower rate of false positives.
It is particularly desirable to develop new, efficient and reliable non-
invasive methods for
the diagnosis of Down's syndrome as well as other fetal aneuploidies.
Summary of the Invention
In one aspect the invention concerns a method for diagnosis of fetal
aneuploidy,
comprising comparing the proteomic profile of a test sample of a maternal
biological fluid with a
normal or a reference proteomic profile of the same type of biological fluid,
and determining the
presence of fetal aneuploidy if the proteomic profile of said test sample
shows at least one unique
expression signature representing at least one biomarker selected from the
group consisting of
the biomarkers listed in Tables 1-2 and 5-6, absent from said normal proteomic
profile or present
in said reference proteomic profile.
In an additional aspect, the invention concerns a method for diagnosis of
fetal
aneuploidy, comprising comparing the proteomic profile of a test sample of a
maternal biological
fluid with a normal or a reference proteomic profile of the same type of
biological fluid, and
determining the presence of fetal aneuploidy if the proteomic profile of said
test sample shows at
least one unique expression signature representing at least one biomarker
selected from the
group consisting of the biomarkers listed in Table 3, absent from said normal
proteomic profile
or present in said reference proteomic profile.
In one embodiment, the invention concerns the use of a test sample obtained
from a
pregnant female human.
In another embodiment of the invention, the proteomic profile is a mass
spectrum.
In an additional embodiment of the invention, the test sample is matemal
serum.
7
SUBSTITUTE SHEET (RULE 26)
CA 02591926 2007-03-16
WO 2006/034427 PCT/US2005/034083
In another embodiment, the unique expression signature is in one or more of
molecular
weight regions 16 to 20 kDa, 35 to 38 kDa, 38 to 42 kDa, 40 to 45 kDa, 50 to
55 kDa, 60 to 68
kDa, and 125 to 150 kDa.
In another embodiment, the test sample is maternal amniotic fluid.
In another embodiment, the unique expression signature is in one or both of
molecular
weight regions of 6 to 7 kDa and 8 to 10 kDa.
In another embodiment, the method is performed in the first trimester of
pregnancy.
In another embodiment, the method is performed in the second trimester of
pregnancy.
In an additional embodiment, the method further comprises determining the
level of
transcribed mRNA or the level of translated protein of at least one biomarker
of fetal aneuploidy
in the test sample, and confirming the presence of fetal aneuploidy if said
level of transcribed
mRNA or level of translated protein is different relative to its level in a
normal biological
sample.
In another embodiment, The fetal aneuploidy being diagnosed is Down's
syndrome,
trisomy 13, trisomy 18, X chromosome trisomy, X chromosome monosomy,
Kleinfelter's
syndrome (XXY genotype), or XYY syndrome (XYY genotype).
In another embodiment, the biomarker whose level of transcribed mRNA or level
of
translated protein is being detected is selected from the group consisting of
PAPP-A, a-
fetoprotein (AFP), human chorionic gonadotropin (bhCG), unconjugated estriol
(uE3), and
inhibin A.
In an additional embodiment, The method further comprising subjecting the
pregnant
female human to one or more of additional diagnostic techniques.
In another embodiment, the additional diagnostic techniques are selected from
the group
consisting of ultrasonography, techniques to test chromosomal abnormalities,
and nuchal
translucency (NT) measurement.
In an additional embodiment, the invention involves that comparison of the
unique
expression signature of more than one biomarker. In additon, the number of
expression
signatures can be of 2, 3, 4, 5, 6, 7, 8, or more biomarkers.
In an additional embodiment the biomarker or biomarkers are selected from the
group
consisting of complement factor H (CFAHHUMAN, SwissProt Accession No. P08603);
8
SUBSTITUTE SHEET (RULE 26)
CA 02591926 2007-03-16
WO 2006/034427 PCT/US2005/034083
pregnancy zone protein (PZP HUMAN; SwissProt Accession No. P20741); afamin
(AFAM HUMAN; SwissProt Accession No. P43652); angiotensinogen (ANGT HUMAN;
SwissProt Accession No. P01019); alpha-2-hs-glycoprotein (A2HS HUMAN;
SwissProt
Accession No. P02765); clusterin (CLUS_HUMAN; SwissProt Accession No. P10909);
apolipoprotein AI (APA1 HUMA.N; SwissProt Accession No. P02647);
apolipoprotein AIV
(APA4_HUMAN; SwissProt Accession No. P06727); apolipoprotein E(APE HUMAN;
SwissProt Accession No. P02649); pigment epithelium-derived factor (PEDF
HUMAN;
SwissProt Accession No. P36955); serum amyloid A protein (SAA HUMAN; SwissProt
Accession No. P02735); AMBP protein (AIVIBP HUMAN; SwissProt Accession No.
P02760);
plasma retinol binding protein (RETB HUlVIAN; SwissProt Accession No. P02753);
serotransferrin precursor (TRFE HUMAN; SwissProt Accession No. P02787); alpha-
l-
antitrypsin precursor (AlAT HUMAN; SwissProt Accession No. P01009); alpha-2-
macroglobulin precursor (A2MG HUIv1AN; SwissProt Accession No. P01023);
complement C3
precursor (C03 HUMAN; SwissProt Accession No. P01024); angiotensinogen
precursor
(ANGT HUMAN; SwissProt Accession No. P01019); ceruloplasmin precursor
(CERU HUMAN; SwissProt Accession No. P00450); haptoglobin precursor (HPT
HCTMAN;
SwissProt Accession No. P00738); antithrombin-III precursor (ANT3 HUMAN;
SwissProt
Accession No. P01008); hemopexin precursor (HEMO HUMAN; SwissProt Accession
No.
P02790); alpha-l-acid glycoprotein 1 precursor (A1AG HUMAN; SwissProt
Accession No.
P02763); apolipoprotein A-I precursor (APAl HUMAN; SwissProt Accession No.
P02647);
alpha lb-glycoprotein (SwissProt Accession No. P04217); kininogen precursor
(KNG HLTMAN;
SwissProt Accession No. P01042-2); inter-alpha-trypsin inhibitor heavy chain
H2 precursor
(ITH2 HUMAN; SwissProt Accession No. P19823); alpha-2-hs-glycoprotein
precursor
(A2HS HUMAN; SwissProt Accession No. P02765); alpha-1-antichymotrypsin
precursor
(AACT HUMAN; SwissProt Accession No. P01011); inter-alpha-trypsin inhibitor
heavy chain
H4 precursor (ITH4 HUlVlAN; SwissProt Accession No. Q14624-2); complement
factor H
precursor (CFAH HUMAN; SwissProt Accession No. P08603-1); plasma protease Cl
inhibitor
precursor (ICI HUMAN; SwissProt Accession No. P05155); heparin cofactor II
precursor
(HEP2 HUMAN SwissProt Accession No. P05546); complement factor B precursor
(CFAB_HUMAN; SwissProt Accession No. P00751-1); alpha-2-glycoprotein 1, zinc
(ZA2G_HUMAN; SwissProt Accession No. P25311); vitronectin precursor (VTNC
HUMAN
SwissProt Accession No. P04004); inter-alpha-trypsin inhibitor heavy chain Hl
precursor
(ITHl -H-UMAN; SwissProt Accession No. P19827); complement component C9
precursor
(C09 HUMAN; SwissProt Accession No. P02748); fibrinogen alpha/alpha-E chain
precursor
9
SUBSTITUTE SHEET (RULE 26)
CA 02591926 2007-03-16
WO 2006/034427 PCT/US2005/034083
(FIBA_HUMAN; SwissProt Accession No. P02671-1); fibrinogen beta chain
precursor
(FIBB HUMAN; SwissProt Accession No. P02675); fibrinogen gamma chain precursor
(FIBG_HUMAN; SwissProt Accession No. P02679-1); prothrombin precursor
(THRB HUMAN; SwissProt Accession No. P00734); clusterin precursor (CLUS_HUMAN;
SwissProt Accession No. P10909); alpha-1B-glycoprotein precursor (A1BG HUMAN;
SwissProt Accession No. P04217); alpha-l-acid glycoprotein 2 precursor (AIAH
HUMAN;
SwissProt Accession No. P19652); apolipoprotein D precursor (APOD HUMAN;
SwissProt
Accession No. P05090); pregnancy zone protein precursor (PZP HUMAN; SwissProt
Accession
No. P20742); histidine-rich glycoprotein precursor (HRG HUMAN; SwissProt
Accession No.
P04196); sex hormone-binding globulin precursor (SHBG HUMAN; SwissProt
Accession No.
P04278=1); plasminogen precursor (PLMN HUMAN; SwissProt Accession No. P00747);
apolipoprotein C-III precursor (APC3 HUMAN; SwissProt Accession No. P02656);
leucine-rich
alpha-2-glycoprotein precursor (A2GL HUMAN; SwissProt Accession No. P02750);
apolipoprotein E precursor (APE HUMAN; SwissProt Accession No. P02649); fetuin-
B
precursor (FETB HUMAN; SwissProt Accession No. Q9UGM5); myosin-reactive
immunoglobulin light chain variable region (SwissProt Accession No. Q9UL83);
complement
C 1 S component precursor (C 1 S HUMAN; SwissProt Accession No. P09871); .
ambp protein
precursor (AMBP HUMAN; SwissProt Accession No. P02760); and complement C4
precursor
(C04 HUMAN; SwissProt Accession No. P01028).
In a particular embodiment, the biomarkers employed in the invention are
complement
factor H (CFAHHUMAN, SwissProt Accession No. P08603); and pregnancy zone
protein
(PZP HUMAN; SwissProt Accession No. P20741).
In a particular embodiment, the biomarkers employed in the invention are
complement
factor H (CFAHHUMAN, SwissProt Accession No. P08603); and afamin (AFAM HUMAN;
SwissProt Accession No. P43652).
In a particular embodiment, the biomarkers employed in the invention are
pregnancy
zone protein (PZP HUMAN; SwissProt Accession No. P20741); and alpha-2-hs-
glycoprotein
(A2HS HUMAN; SwissProt Accession No. P02765).
In a particular embodiment, the biomarkers employed in the invention are
complement
factor H(CFAH_HLJMAN, SwissProt Accession No. P08603); angiotensinogen
(ANGT HUMAN; SwissProt Accession No. P01019); and clusterin (CLUS HUMAN;
SwissProt Accession No. P 10909). -
SUBSTITUTE SHEET (RULE 26)
CA 02591926 2007-03-16
WO 2006/034427 PCT/US2005/034083
In a particular embodiment, the biomarkers employed in the invention are
apolipoprotein
E(APE HUMAN; SwissProt Accession No. P02649); AMBP protein (AMBP HUMAN;
SwissProt Accession No. P02760); and plasma retinol binding protein (RETB
HUMAN;
SwissProt Accession No. P02753).
In a particular embodiment, the biomarkers employed in the invention are
complement
factor H (CFAHHUMAN, SwissProt Accession No. P08603); afamin (AFAM HUMAN;
SwissProt Accession No. P43652); angiotensinogen (ANGT HUMAN; SwissProt
Accession
No. P01019); and clusterin (CLUS HUMAN; SwissProt Accession No. P10909).
In a particular embodiment, the biomarkers employed in the invention are
complement
factor H (CFAHHUMAN, SwissProt Accession No. P08603); afamin (AFAM HUMAN;
SwissProt Accession No. P43652); pigment epithelium-derived factor (PEDF
HUMAN;
SwissProt Accession No. P36955); serum amyloid A protein (SAA_HUMAN; SwissProt
Accession No. P02735); angiotensinogen (ANGT HUMAN; SwissProt Accession No.
P01019);
and clusterin (CLUS HUMAN; SwissProt Accession No. P 10909).
In a particular embodiment, the biomarkers employed in the invention are
apolipoprotein
E(APE HUMAN; SwissProt Accession No. P02649); AMBP protein (AMBP HUMAN;
SwissProt Accession No. P02760); plasma retinol binding protein (RETB HUMAN;
SwissProt
Accession No. P02753); serotransferrin precursor (TRFE HUMAN; SwissProt
Accession No.
P02787); alpha-2-macroglobulin precursor (A2MG HUMAN; SwissProt Accession No.
P01023); and histidine-rich glycoprotein precursor (HRG HUMAN; SwissProt
Accession No.
P04196).
In a particular embodiment, the biomarkers employed in the invention are inter-
alpha-
trypsin inhibitor heavy chain H1 precursor (ITH1 HUMAN; SwissProt Accession
No. P19827);
complement component C9 precursor (C09 HUMAN; SwissProt Accession No. P02748);
fibrinogen alpha/alpha-E chain precursor (FIBA HUMAN; SwissProt Accession No.
P02671-1);
apolipoprotein C-Ill precursor (APC3_HUMAN; SwissProt Accession No. P02656);
leucine-rich
alpha-2-glycoprotein precursor (A2GL HLTMAN; SwissProt Accession No. P02750);
apolipoprotein E precursor (APE HUMAN; SwissProt Accession No. P02649); fetuin-
B
precursor (FETB HUMAN; SwissProt Accession No. Q9UGM5); and complement C4
precursor
(C04 HUMAN; SwissProt Accession No. P01028).
In a particular embodiment, the inventions involves the use of proteomic
profiles that
include at least one glycoprotein.
SUBSTITUTE SHEET (RULE 26)
CA 02591926 2007-03-16
WO 2006/034427 PCT/US2005/034083
In a particular embodiment, the invention involves the glycoprotein or
glycoproteins
employed in the proteomic profile are selected from the group consisting of
sialic acid
glycoproteins, mannose binding glycoproteins, and 0-linked glycoproteins.
In a particular embodiment, the invention involves the detection of a fetal
aneuploidy that
is an autosomal aneuploidy.
In an additional embodiment, the invention involes the detection of a trisomy
of
chromosomes 13, 18, or 21.
In a particular embodiment, the invention involves the detection of a fetal
aneuploidy that
is a sex chromosome aneuploidy.
In an additional embodiment, the invention involes the detection of an
aneuploidy
selected from the group consisting of= X chromosome trisomy, X chromosome
monosomy,
Kleinfelter's syndrome (XXY genotype), and XYY syndrome (XYY genotype).
Brief Description of the Drawings
Table 1. Candidate maternal serum biomarkers in Down's syndrome, identified
from the
initial 7 areas of interest (Figure 2). Tandem MS/MS analysis of the ingel
digests of 2D spots
followed by de novo sequencing and database search using OpenSea revealed the
relative
abundance of each protein in these areas.
Table 2. Candidate maternal serum biomarkers in Down's syndrome identified.
Tandem
MS/MS analysis of the ingel digests of 2D spots followed by de novo sequencing
and database
search using OpenSea revealed the relative abundance of each protein in these
areas.
Table 3. Candidate anuuotic fluid biomarkers in Down's syndrome identified.
Tandem
MS/MS analysis of the ingel digests of 2D spots followed by de novo sequencing
and database
search using OpenSea revealed the relative abundance of each protein in these
areas.
Table 4. Preferred maternal serum and amniotic fluid biomarkers for diagnosis
of fetal
Down's syndrome.
Table 5. Candidate maternal serum biomarkers in Down's syndrome, identified
from the
initial areas of interest (Figure 7). Tandem MS/MS was employed to identify
the specific
candidate biomarkers.
Table 6. Candidate maternal serum biomarkers in Down's syndrome, identified
from the
initial areas of interest (Figures 8-11). Tandem MS/MS was employed to
identify the specific
candidate biomarkers.
12
SUBSTITUTE SHEET (RULE 26)
CA 02591926 2007-03-16
WO 2006/034427 PCT/US2005/034083
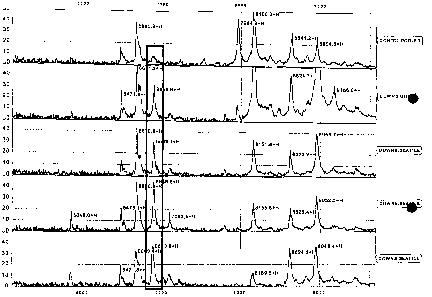
Figure 1. SELDI-TOF-MS analysis of maternal serum from 2 d trimester Control
and
Down's samples. Top panel represents pooled control from all 4 matched cases.
Area of interest
was boxed showing a potential peak that is differentially expressed between
the two groups.
Figure 2. 2-D gels of maternal serum samples (20 g of protein) purified using
Agilent
immunoaffinity columns labeled with 100 pm of Cus5 (Down's syndrome) or Cy3
(Control).
Gels were scanned at 600 PMT voltage in a Typhoon 94100 Scanner (Amersham
Biosciences).
Images overlaid using Phoretic 2D Evolution (nonlinear Dynamics).
Figure 3. Immuno-MALDI-TOF-MS assay. Spectra of immunoprecipitated
apolipoproteins A). apolipoprotein Al. B). apolipoprotein A2. C).
apolipoprotein E from
maternal control (blue trace) and Down's (red trace) serum. Panel D is an
inset taken from the
2D DIGE gel in Figure 2 frorn which several apolipoprotein species were
identified by tandem
mass spectrometry.
Figure 4. Detection of differential protein expression in maternal serum.,. 2-
D western
immunolbots probed with human complement factor H antibodies. A) control serum
2nd
trimester; B) Down's syndrome maternal serum 2nd trimester.
Figure 5. Schematic representation of de novo protein sequence identification
of
candidate biomarkers in Down's syndrome. Spectra representing peptide
sequences that belong
to Complement factor H.
Figure 6. Schematic representation of de novo protein sequence identification
of
candidate biomarkers in Down's syndrome. Sequence coverage map of peptide
sequences
identified that belong to Complement factor H. Lighter shading peptides
identified, darker
shading represent potential protein modifications of these amino acids.
Figure 7. MS analysis of collected differential 2-D liquid chromatography
fractions. A)
The 2D-LC maps generated using ProteoVue software display the pI of the eluted
protein from
CF on the x-axis and the retention time, or hydrophobicity, of the eluted
protein from RP-HPLC
on the y-axis. B) the 2D map of the control sample is depicted in red on the
left and the 2D map
of the DS sample is depicted in green on the right. The center of the figure
displays the
difference map (displayed separately in B) of the two samples, where bands
seen in green are
proteins up-regulated in the DS sample and bands seen in red are proteins up-
regulated in the
control sample.
Figure 8. Fluorescent 2-dimensional gel image representing differential
expression of
total glycoproteins in second trimester Control (Red) and DS (Green) maternal
serum.
Figure 9. Fluorescent 2-dimensional gel image representing differential
expression of
Sialic-glycoproteins in second trimester Control (Red) and DS (Green) maternal
serum.
13
SUBSTITUTE SHEET (RULE 26)
CA 02591926 2007-03-16
WO 2006/034427 PCT/US2005/034083
Figure 10. Fluorescent 2-dimensional gel image representing differential
expression of
Mannose binding glycoproteins in second trimester Control (Red) and DS (Green)
maternal
serum.
Figure 11. Fluorescent 2-dimensional gel image representing differential
expression of
0-linked glycoproteins in second trimester Control (Red) and DS (Green)
maternal serum.
Figure 12. MALDI-TOF of total glycoproteins trypsin digest. Maternal serum of
control
(top) and Down's syndrome (bottom). Significant differences in peptides
expressed in Down's
syndrome are boxed.
Figure 13. MALDI-TOF of Sialic acid glycoproteins trypsin digest. Maternal
serum of
control (top) and Down's syndrome (bottom). Significant differences in
peptides expressed in
Down's syndrome are boxed.
Figure 14. MALDI-TOF of Mannose binding glycoproteins trypsin digest. Maternal
serum of control (top) and Down's syndrome (bottom). Significant differences
in peptides
expressed in Down's syndrome are boxed.
Figure 15. MALDI-TOF of 0-linked glycoproteins trypsin digest. Maternal serum
of
control (top) and Down's syndrome (bottom). Significant differences in
peptides expressed. in,
Down's syndrome are boxed.
Figure 16. 2-D gels of maternal serum samples (20 Ag of protein) purified
using Agilent
immunoaffinity columns labeled with 100 pm of Cus5 (Trisomy 18) or Cy3
(Control). Gels
were scanned at 600 PMT voltage in a Typhoon 94100 Scanner (Amersham
Biosciences).
Images overlaid using Phoretic 2D Evolution (nonlinear Dynamics).
Figure 17. 2-D gels of maternal serum samples (20 g of protein) purified
using Agilent
immunoaffinity columns labeled with 100 pm of Cus5 (Trisomy 13) or Cy3
(Control). Gels
were scanned at- 600 PMT voltage in a Typhoon 94100 Scanner (Amersham
Biosciences).
Images overlaid using Phoretic 2D Evolution (nonlinear Dynamics).
Figure 18. 2-D gels of maternal serum samples (20 g of protein) purified
using Agilent
immunoaffinity columns labeled with 100 pm of Cus5 (Neural Tube Defects) or
Cy3 (Control).
Gels were scanned at 600 PMT voltage in a Typhoon 94100 Scanner (Amersham
Biosciences).
Images overlaid using Phoretic 2D Evolution (nonlinear Dynamics).
Detailed Description of the Preferred Embodiment
A. Definitions
Unless defined otherwise, technical and scientific terms used herein have the
same
meaning as commonly understood by one of ordinary skill in the art to which
this invention
14
SUBSTITUTE SHEET (RULE 26)
CA 02591926 2007-03-16
WO 2006/034427 PCT/US2005/034083
belongs. Singleton et al., Dictionary of Microbiology and Molecular Biology
2nd ed., J. Wiley
& Sons (New York, NY 1994) provides one skilled in the art with a general
guide to many of the
terms used in the present application.
The term "proteome" is used herein to describe a significant portion of
proteins in a
biological sample at a given time. The concept of proteome is fundamentally
different from the
genome. While the genome is virtually static, the proteome continually changes
in response to
internal and external events.
The term "proteomic profile" is used to refer to a representation of the
expression pattern
of a plurality of proteins in a biological sample, e.g. a biological fluid at
a given time. The
proteomic profile can, for example, be represented as a mass spectrum, but
other representations
based on any physicochemical or biochemical properties of the proteins, or
fragments thereof,
are also included. Thus the proteomic profile may, for example, be based on
differences in the
electrophoretic properties of proteins, as determined by two-dimensional gel
electrophoresis, e.g.
by 2-D PAGE, and can be represented, e.g. as a plurality of spots in a two-
dimensional
electrophoresis gel. Altematively, the proteomic profile may be based on.
differences in protein
isolectric point and hydrophobicity, as determined by two-dimensional liquid
chromatography,
and can be represented, e.g. as a computer generated virtual two-dimensional
map. Furthermore,
lectin-based affinity purification can be combined with the techniques
described herein to
generate proteomic profiles that highlight the specific glycosylation
properties of various
proteins found in a biological sample.
Differential expression profiles may have important diagnostic value, even in
the absence
of specifically identified proteins. Single protein spots or chromatographic
eluents can then be
detected, for example, by immunoblotting, and multiple spots, eluents, or
proteins can be
identified using protein microarrays. The proteomic profile typically
represents or contains
information that could range from a few peaks to a complex profile
representing 50 or more
peaks. Thus, for example, the proteomic profile may contain or represent at
least 2, or at least 3,
or a least 4, or a least 5, or at least 6, or at least 7, or at least 8, or at
least 9, or at least 10, or at
least 15, or at least 20, or at least 25, or at least 30, or at least 35, or
at least 40, or at least 45, or
at least 50 proteins, and the like.
The term "unique expression signature" is used to describe a unique feature or
motif
within the proteomic profile of a biological sample (e.g. a reference sample
or a test sample) that
differs from the proteomic profile of a corresponding normal biological sample
(obtained from
the same type of source, e.g. biological fluid) in a statistically significant
manner.
SUBSTITUTE SHEET (RULE 26)
CA 02591926 2007-03-16
WO 2006/034427 PCT/US2005/034083
The term "normal proteomic profile" is used to refer to the proteomic profile
of a
biological sample of a maternal biological fluid of the same type as a test
sample, that has been
obtained from a pregnant female carrying a fetus not having an aneuploidy, or
other
chromosomal abnormality.
The term "reference proteomic profile" is used to refer to the proteomic
profile of a
biological sample of a maternal biological fluid of the same type as a test
sample, that has been
obtained from a pregnant female carrying a fetus having an aneuploidy.
"Patient response" can be assessed using any endpoint indicating a benefit to
the patient,
including, without limitation, (1) inhibition, at least to some extent, of the
progression of a
pathologic condition, (2) prevention of the pathologic condition, (3) relief,
at least to 'some
extent, of one or more symptoms associated with the pathologic condition; (4)
increase in the
length of survival following treatment; and/or (5) decreased mortality at a
given point of time
following treatment.
The tenn "treatment" refers to both therapeutic treatment and prophylactic or
preventative measures, wherein the object is to prevent or slow down (lessen)
the targeted
pathologic condition or disorder. Those in need of treatment include those
already with the
disorder as well as those prone to have the disorder or those in whom the
disorder is to be
prevented.
"Congenital malformation" is an abnormality which is non-hereditary but which
exists at
birth.
"Sensitivity" of a diagnostic assay or "diagnostic sensitivity" is defined as
the probability
of the test finding disease among those who have the disease, or proportion of
people with
disease who have a positive test result. In statistical terms: sensitivity =
true positives/(true
positives + false negatives).
The term "one or more" in the context of the proteomics profiles, protein
markers, and
unique expression signatures herein is used used mean any one, two, three,
four, etc. of the listed
members within a group, in any permutation. Accordingly, the term "one or
more" includes any
two, any three, any four, etc. of the members spepcifically listed within a
group. While specific
subgroups are listed throughout the specification and the claims, these are no
limiting. It is
emphasized that the term "one or more" is used in the broadest sense, and is
used to designate
any subgroup within a group with multiple members. Similarly, the terms "at
least 2," "at least
3," "at least 4," etc., cover any combinations of the members within a
particular group, provided
that the total number of members within the combination is at least 3, at
least 3, at least, 4, etc.
16
SUBSTITUTE SHEET (RULE 26)
CA 02591926 2007-03-16
WO 2006/034427 PCT/US2005/034083
B. Detailed Description
The present invention concerns methods and means for an early, reliable and
non-
invasive testing of fetal Down's syndrome and other chromosomal aneuploidies,
based upon the
proteomic profile of a maternal biological fluid. The invention utilizes
proteomics techniques
well known in the art, as described, for example, in the following textbooks,
the contents of
which are hereby expressly incorporated by reference: Proteome Research: New
Frontiers in
Functional Genomics (Principles and Practice), M.R. Wilkins et al., eds.,
Springer Verlag, 1007;
2-D Proteome Analysis Protocols, Andrew L Link, editor, Humana Press, 1999;
Proteome
Research: Two-Dimensional Gel Electrophoresis and Identification Methods
(Principles and
Practice), T. Rabilloud editor, Springer Verlag, 2000; Proteome Research: Mass
Spectrometry
(Principles and Practice), P. James editor, Springer Verlag, 2001;
Introduction to Proteomics, D.
C. Liebler editor, Humana Press, 2002; Proteomics in Practice: A Laboratory
Manual of
Proteome Analysis, R. Westermeier et al., eds., John Wiley & Sons, 2002.
One skilled in the art will recognize many methods and materials similar or
equivalent to
those described herein, which could be used in the practice of the present
invention. Indeed, the
present invention is in no way limited to the methods and materials described.
1. Identification ofProteins and Polypeptides Expressed in Biological Fluids
According to the present invention, proteomics analysis of biological fluids
can be
performed using a variety of methods known in the art.
Typically, protein patterns (proteome maps) of samples from different sources,
such as
normal biological fluid (normal sample) and a test biological fluid (test
sample), are compared to
detect proteins that are up- or down-regulated in a disease. These proteins
can then be excised for
identification and full characterization, e.g. using peptide-mass
fingerprinting and/or mass
spectrometry and sequencing methods, or the normal and/or disease-specific
proteome map can
be used directly for the diagnosis of the disease of interest, or to confirm
the presence or absence
of the disease.
In comparative analysis, it is important to treat the normal and test samples
exactly the
same way, in order to correctly represent the relative abundance of proteins,
and obtain accurate
results. The required amount of total proteins will depend on the analytical
technique used, and
can be readily determined by one skilled in the art. The proteins present in
the biological
samples are typically separated by two-dimensional gel electrophoresis (2-DE)
according to their
pI and molecular weight. The proteins are first separated by their charge
using isoelectric
focusing (one-dimensional gel electrophoresis). This step can, for example, be
carried out using
17
SUBSTITUTE SHEET (RULE 26)
CA 02591926 2007-03-16
WO 2006/034427 PCT/US2005/034083
immobilized pH-gradient (IPG) strips, which are commercially available. The
second dimension
is a normal SDS-PAGE analysis, where the focused IPG strip is used as the
sample. After 2-DE
separation, proteins can be visualized with conventional dyes, like Coomassie
Blue or silver
staining, and imaged using known techniques and equipment, such as, e.g. Bio-
Rad GS800
densitometer and PDQUEST software, both of which are commercially available.
Individual
spots are then cut from the gel, destained, and subjected to tryptic
digestion. The peptide
mixtures can be analyzed by mass spectrometry (MS).
Alternative methods of comparative analysis, and combinations of these various
methods,
may also be used within the scope of the instant invention. For example,
proteins present in the
biological samples may be separated by two-dimensional liquid chromatography
according to
their isoelectric point and hydrophobicity as described in Example II below.
Of course, the
chromatographic separation need not be based on hydrophobicity, as a wide
range of separation
materials are well known in the art including, but not limited to, materials
capable of separation
based on molecular weight, pH, or specific binding affinities such as antibody-
antigen
interactions. Furhthermore, once an initial separation step is complete, the
peptides present in an
individual spot or eluant sample can be separated by capillary high pressure
liquid
chromatography (HPLC) and canbe analyzed by MS either individually, or in
pools.
As detailed in Example III, glycosylation is an important posttranslational
protein
modifications in eukaryotes, and thus a system for separation and
identification of the
glycosylation state of a biological sample can be a valuable tool in mining
protein biomarkers.
Lectin based affinity purification is the method of choice for isolating
different classes of
glycosylated proteins due to their ability to specifically and reversibly bind
to glycan moieties in
glycoproteins. The major classes and types of glycoproteins can be
individually isolated from
the test samples and once separated, mass spectrometry can- be employed to
generate a
differential glycosylation profile to compare control versus disease.
A discussed in detail below, a wide variety of lectins and their specificities
are known in
the art. One or more of these lectins, as well as any permutation of the
possible combination of
these and other lectins, can be used in practicing the instant invention.
Mannose binding lectins
are known to include, but are not limited to, the following: Concanavalin A
from Canavalia
ensiformis which binds branched a-mannosidic structures, high-mannose type,
and hybrid type
and biantennary complex type N-Glycans; Lentil lectin from Lens culinaris
which binds the
fucosylated core region of bi- and triantennary complex type N-Glycans; and
Snowdrop lectin
from Galanthus nivalis which binds a 1-3 and a 1-6 linked high mannose
structures. Galactose I
N-acetylgalactosamine binding lectins include, but are not limited to, the
following: Ricinus
18
SUBSTITUTE SHEET (RULE 26)
CA 02591926 2007-03-16
WO 2006/034427 PCT/US2005/034083
communis Agglutinin (RCA120) from Ricinus communis which binds Galfll-
4GlcNAcfll-R;
Peanut Agglutinin from Arachis hypogaea Gal(31-3Ga1NAca1-Ser/Thr (T-Antigen);
Jacalin from
Artocarpus integrifolia which binds (Sia)Gal(31-3Ga1NAcca1-Ser/Thr (T-
Antigen); and Hairy
vetch lectin frorn Vicia villosa which binds GalNAca-Ser/Thr (Tn-Antigen).
Sialic acid / N-
acetylglucosamine binding lectins include, but are not limited to, the
following: Wheat Germ
agglutinin from Triticum vulgaris which binds .G1cNAcfl1-4G1cNAca1-4G1cNAc,
and Neu5Ac
(sialic acid); Elderberry lectin from Sambucus nigra which binds Neu5Aca2-
6Ga1(NAc)-R;
Maackia amurensis lectin from Maackia amurensis which binds Neu5Ac/Gca2-
3Ga1fl1-
4G1cNAco1-R. Fucose binding lectins include, but are not limited to, the
following: Ulex
europaeus agglutinin from Ulex europaeus which binds Fucal-2Gal-R; Aleuria
aurantia, lectin
from Aleuria aurantia which binds Fucal-2Ga1(31-4(Fucal-3/4)Gal(31-4G1cNAc,
and R2-
G1cNAcfl1-4(Fucal -6)G1cNAc-Rl
Mass spectrometers consist of an ion source, mass analyzer, ion detector, and
data
acquisition unit. First, the peptides are ionized in the ion source. Then the
ionized peptides are
separated according to their mass-to-charge ratio in the mass analyzer and the
separate ions are
detected. . Mass 'spectrometry has been widely used in protein analysis,
especially since the
invention of matrix-assisted laser-desorption ionisation/time-of-flight (MALDI-
TOF) and
electrospray ionisation (ESI) methods. There are several versions of mass
analyzer, including,
for example, MALDI-TOF and triple or quadrupole-TOF, or ion trap mass analyzer
coupled to
ESI. Thus, for example, a Q-Tof-2 mass spectrometer utilizes an orthogonal
time-of-flight
analyzer that allows the simultaneous detection of ions across the fiill mass
spectrum range. For
further details see, e.g. Chemusevich et al., J. Mass Spectrom. 36:849-865
(2001).
If desired, the amino acid sequences of the peptide fragments and eventually
the proteins
from which they derived can be determined by techniques known in the art, such
as certain
variations of mass spectrometry, or Edman degradation.
A method for determining sequences of molecules from mass spectrometry data is
disclosed in co-pending application Serial No. 10/789,424 filed on February
27, 2004, the entire
disclosure of which is hereby expressly incorporated by reference. The method
involves de novo
sequencing and database searching, and can also be used to identify sequence
variations and
unknown proteins, which have not been completely sequecnes but have close
sequence
homology to sequences present in sequence databases.
2. Chromosomal Aneuploidies
Chromosomal abnormalities are a frequent cause of perinatal morbidity and
mortality.
Chromosomal abnormalities occur with an incidence of 1 in 200 live births. The
major cause of
19
SUBSTITUTE SHEET (RULE 26)
CA 02591926 2007-03-16
WO 2006/034427 PCT/US2005/034083
these abnormalities is chromosomal aneuploidy, an abnormal number of
chromosomes inherited
from the parents. One of the most frequent chromosomal aneuploidies is trisomy-
21 (Down's
syndrome), which has an occurrence of 1 in 800 livebirths (Hook EB, Hamerton
JL: The
frequency of chromosome abnormalities detected in consecutive newborn studies:
Differences
between studies: Results by sex and by severity of phenotypic involvement. In
Hook EB, Porter
IH (eds): Population Cytogenetics, pp 63-79. New York, Academic Press, 1978).
The primary
risk factor for trisomy-21- is maternal age greater than 35, but 80% of
children with trisomy-21
are born to women younger than 35 years of age. Other common aneuploidic
conditions include
trisomies 13 and 18, Turner Syndrome and Klinefelter syndrome.
3. Diagnosis of Fetal Chromosomal Aneuploidies Using the Proteomic Profile of
Biological Fluids or Biomarkers Identif ed in Biological Fluids
The present invention provides an early and reliable, non-invasive method for
the
diagnosis of fetal chromosomal aneuploidies base upon proteomic analysis of
biological fluids,
such as, for example, amniotic fluid, serum, plasma, urine, cerebrospinal
fluid, breast milk,
mucus, or saliva of a pregnant female.
As noted before, in the context of the present invention the term "proteomic
profile" is
used to refer to a representation of the expression pattern of a plurality of
proteins in a biological
sample, e.g. a biological fluid at a given time. The proteomic profile can,
for example, be
represented as a mass spectrum, but other representations based on any
physicochemical or
biochemical properties of the proteins are also included. Although it is
possible to identify and
sequence all or some of the proteins present in the proteome of a biological
fluid, this is not
necessary for the diagnostic use of the proteomic profiles generated in
accordance with the
present invention. Diagnosis can be based on characteristic differences
(unique expression
signatures) between a normal proteomic profile, and proteomic profile of the
same biological
fluid obtained under the same circumstances, when the chromosomal aneupliody
to be
diagnosed, such as Down's syndrome of the fetus, is present. The unique
expression signature
can be any unique feature or motif within the proteomic profile of a test or
reference biological
sample that differs from the proteomic profile of a corresponding normal
biological sample
obtained from the same type of source, in a statistically significant manner.
For example, if the
proteomic profile is presented in the form of a mass spectrum, the unique
expression signature is
typically a peak or a combination of peaks that differ, qualitatively or
quantitatively, from the
mass spectrum of a corresponding normal sample. Thus, the appearance of a new
peak or a
combination of new peaks in the mass spectrum, or any statistically
significant change in the
amplitude or shape of an existing peak or combination of existing peaks in the
mass spectrum
SUBSTITUTE SHEET (RULE 26)
CA 02591926 2007-03-16
WO 2006/034427 PCT/US2005/034083
can be considered a unique expression signature. When the proteomic profile of
the test sample
obtained from a pregnant female subject is compared with the proteomic profile
of a reference
sample comprising a unique expression signature characteristic of a
chromoromal aneuploidy the
fetus is diagnosed with such chromosomal aneuploidy if the test sample shares
the unique
expression signature with the reference sample.
A particular chromosomal aneuploidy, such as fetal Down's syndrome, can be
diagnosed
by comparing the proteomic profile of a biological fluid obtained from the
maternal subject
tested, with the proteomic profile of a normal biological fluid of the same
kind, obtained and
treated the same manner. If the proteomic profile of the test sample is
essentially the same as the
proteomic profile of the normal sample, the fetus is considered to be free of
the tested
chromosomal aneuploidy. If the proteomic profile of the test sample shows a
unique expression
signature relative to the proteomic profile of the normal sample, the fetus is
diagnosed with the
chromosomal aneuploidy.
Alternatively or in addition, the proteomic profile of the test sample may be
compared
with the proteomic profile of a reference sample, obtained from a biological
fluid of a pregnant
female independently diagnosed with the condition in question. In this case,
the fetus' is
diagnosed with the pathologic condition if the proteomic profile of the test
sample shares at least
one feature, or a combination of features representing a unique expression
signature, with the
proteomic profile of the reference sample.
In the methods of the present invention the proteomic profile of a normal
biological
sample plays an important diagnostic role. As discussed above, if the
proteomic profile of the
test sample is essentially the same as the proteomic profile of the normal
biological sample, the
fetus is diagnosed as being free of the chromosomal aneuploidy to be
identified. The data are
analyzed to determine if the differences are statistically significant. -
The sensitivity of the diagnostic methods of the present invention can be
enhanced by
removing the proteins found both in normal and diseased proteome at
essentially the same
expression levels (common proteins, such as albumin and immunoglobulins) prior
to analysis
using conventional protein separation methods. The removal of such common
proteins, which
are not part of the unique expression signature, results in improved
sensitivity and diagnostic
accuracy. Alternatively or in addition, the expression signatures of the
common proteins can be
eliminated (or signals can be removed) during computerized analysis of the
results, typically
using spectral select algorithms, that are machine oriented, to make
diagnostic calls. The results
detailed in the Examples below present proteomic profiles characteristics of
aneuploidies that
differ from the normal proteomic profile of the maternal serum or amniotic.
fluid in a statistically
21
SUBSTITUTE SHEET (RULE 26)
CA 02591926 2007-03-16
WO 2006/034427 PCT/US2005/034083
significant manner. In addition, the Example and the enclosed Figures identify
individual
biomarkers, groups of biomarkers, and unique expression signatures
characteristic of
aneuploidies.
Statistical methods for comparing proteomic profiles are well known in the
art. For
example, in the case of a mass spectrum, the proteomic profile is defined by
the peak amplitude
values at key mass/charge (M/Z) positions along the horizontal axis of the
spectrum.
Accordingly, a characteristic proteomic profile can, for example, be
characterized by the pattern
formed by the combination of spectral amplitudes at given M/Z vales. The
presence or absence
of a characteristic expression signature, or the substantial identity of. two
profiles can be
determined by matching the proteomic profile (pattern) of a test sample with
the proteomic
profile (pattern) of a reference or normal sample, with an appropriate
algorithm. A statistical
method for analyzing proteomic patterns is disclosed, for example, in
Petricoin III, et al., The
Lancet 359:572-77 (2002).; Issaq et al., Biochem Biophys Commun 292:587-92
(2002); Ball et
al., Bioinformatics 18:395-404 (2002); and Li et al., Clinical Chemistry
Journal, 48:1296-1304
(2002).
In a particular embodiment, a sample obtained from the mother is applied to a
protein
chip, and the proteomic pattern is generated by mass spectrometry. The pattern
of the peaks
within the spectrum can be analyzed by suitable bioinoformatic software, as
described above.
The data presented in the Examples below provide several unique expression
signatures
characteristic of fetal aneuplodies. For example, as shown in Figures there
arecharacteristic
differences between the mass spectrum of normal maternal serum and maternal
serum when the
fetus has an aneuploidy in the molecular weight ranges of about 125 to 150 kD
(area 1), about
60 to 68 kDa (area 2), about 50 to 55 kDa (area 3), about 40 to 45 kDa (area
4), about 38 to 42
kDa (area 5), about 16 to 20-kDa (area 6), and about 35 to 35 kDa (area 7). In
amiotic fluid,
there are characteristic expression signatures in the molecular weight regions
of about 6 to 7 kDa
and/or 8 to 10 kDa. Accordingly, the entire mass spectrum, or one or more of
the listed regions,
each representing a unique expression signature, can be used to diagnose a
fetal aneuploidy
using maternal serum. In addition, the mass spectrum comprising these
expression signatures, or
one or more of areas 1-7, in any combination, can be used as positive control
in a diagnostic
method for fetal aneuploidy.In addition, or alternatively, a method to
diagnose an aneuploidy
can include the detection of one or more proteins differentially expressed in
a biological fluid of
a female carrying a fetus with an aneuploidy (briefly referred to as "
aneuplodal biological
fluid), or fragments of such differentially expressed proteins. Differential
expression includes
both over- and underexpression, provided that there is a characteristic
difference between the
22
SUBSTITUTE SHEET (RULE 26)
CA 02591926 2007-03-16
WO 2006/034427 PCT/US2005/034083
expression level of the protein in aneuploidal biological fluid relative to
its expression level in
normal biological fluid of the same type.
Biomarkers suitable for the detection of fetal aneuploidy using maternal serum
are listed
in Tables 1, 2, and 5-6. Biomarkers suitable for the detection of
fetalaneuploidy using maternal
amniotic fluid are listed in Table 3. Preferred biomarkers present in maternal
serum and
amniotic fluid, respectively, are listed in Table 4. A diagnostic assay can be
based on, or can use
as part of the assay, one or more of the polypeptides listed in Tables 1-6. In
a specific
embodiment, 1-20, or 1-15, or 1-20, or 1-15 or 1-10, or 1-9, or 1-8, or 1-7,
or 1-6, or 1-5, or 1-
4,or 1-3, or 1 or 2 biomarkers listed in Tables 1-6 are used, alone or
combination with other
biomarkers of aneuploidy, or with one or more unique expression signatures of
aneuplody.
Examples of potential coinbinations of biomarkers include the following:
complement factor H
and pregnancy zone protein; complement factor H and afamin; pregnancy zone
protein and
alpha-2-hs-glycoprotein; complement factor H, angiotensinogen, and clusterin;
apolipoprotein,
AMBP protein, and plasma retinol binding protein; complement factor H, afamin,
angioteiisinogeti, and clusterin; complement factor H, afamin, pigment
epithelium-derived factor,
serum amyloid A protein, angiotensinogen, and clusterin; apolipoprotein E,
AMBP protein,
plasma retinol binding protein, serotransferrin precursor, alpha-2-
macroglobulin precursor, and
histidine-rich glyroprotein precursor; inter-alpha-trypsin inhibitor heavy
chain H1 precursor,
complement component C9 precursor, fibrinogen alpha/alpha-E chain precursor,
apolipoprotein
C-III precursor, leucine-rich alpha-2-glycoprotein precursor, apolipoproteiri
E precursor, fetuin-
B precursor, and complement C4 precursor. It is noted, however, that the
invention is not limited
to these examples but rather all permuations of possible combinations can find
use in the instant
invention.
A combination of different biomarkers and/or characteristic expression
signatures, as
described above, might significantly iniprove diagnostic accuracy. For
examp;e, individual
biomarkers can typically detect a fetal aneuploidy, such as Down's syndrome,
in about 30% to
80% of occurrences. With a combination or biomarkers and/or characteristic
expression
signatures a diagnostic accurance of at least about 80%, more preferably at
least about 85%, even
more preferably at least about 90%, even more preferably at least about 95%,
most preferably at
least about 98% can be achieved. The combination of biomarkers which act
independently,
through distinct biological pathways is particularly advantageous, since such
combinations are
expected to significantly increase diagnostic sensitivity.
The diagnostic methods of the present invention are equally applicable in the
first and
second trimester of pregnancies essentially with the same detection rate.
23
SUBSTITUTE SHEET (RULE 26)
CA 02591926 2007-03-16
WO 2006/034427 PCT/US2005/034083
While the screening methods of the invention provide an outstanding detection
rate and
accuracy when used alone, they can also be combined with existing screening
techniques for the
detection of fetal aneuploidy. Thus, the diagnostic methods herein can be
combined one or
more of known biomarkers, such as, for example in the case of Down's syndrome
or trisomy 18,
with one or more of serum biomarkers PAPP-A, a-fetoprotein (AFP), human
chorionic
gonadotropin (j3hCG), unconjugated estriol (uE3), and inhibin A. In
particular, the present
screening techniques can be combined with a test using PAPP-A and (3hCG as
independent
biomarkers, or the triple-marker serum test, based on AFP, (3hCG, and uE3,
especially if
screening is performed in the second trimester. The test might, additionally
or alternatively,
include inhibin-A. Markers capable of identifying other aneuploidies that may
be combined with
the diagnostic methods described herein are well known in the art.
The screening assays herein can further be combined with or supplemented by
other
techniques in clinical or experimental use to detect fetal aneuploidy,
including, ultrasonography,
including transabdominal and translucent ultrasonography; various techniques
to test
chromosomal abnormalities; and nuchal translucency (NT) measurement.
4. Protein and Antibody Arrays
The diagnostic assays discussed above can be performed using protein arrays.
In recent
years, protein arrays have gained wide recognition as a powerful means to
detect proteins,
monitor their expression levels, and investigate protein interactions arid
functions. They enable
high-throughput protein analysis, when large numbers of determinations can be
performed
simultaneously, using automated means. In the microarray or chip format, that
was originally
developed for DNA arrays, such determinations can be carried out with minimum
use of
materials while generating large amounts of data.
Although proteome' analysis by 2D gel electrophoresis, 2D liquid
chromotograhy, and
mass spectrometry, as described above, is very effective, it does not always
provide the needed
high sensitivity and this might miss many proteins that are expressed at low
abundance. Protein
microarrays, in addition to their high efficiency, provide improved
sensitivity.
Protein arrays are formed by immobilizing proteins on a solid surface, such as
glass,
silicon, micro-wells, nitrocellulose, PVDF membranes, and microbeads, using a
variety of
covalent and non-covalent attachment chemistries well known in the art. The
solid support
should be chemically stable before and after the coupling procedure, allow
good spot
morphology, display minimal nonspecific binding, should not contribute a
background in
detection systems, and should be compatible with different detection systems.
24
SUBSTITUTE SHEET (RULE 26)
CA 02591926 2007-03-16
WO 2006/034427 PCT/US2005/034083
In general, protein microarrays use the same detection methods commonly used
for the
reading of DNA arrays. Similarly, the same instrumentation as used for reading
DNA
microarrays is applicable to protein arrays.
Thus, capture arrays (e.g. antibody arrays) can be probed with fluorescently
labelled
proteins from two different sources, such as normal and diseased biological
fluids. In this case,
the readout is based on the change in the fluorescent signal as a reflection
of changes in the
expression level of a target protein.= Alternative readouts include, without
limitation,
fluorescence resonance energy transfer, surface plasmon resonance, rolling
circle DNA
amplification, mass spectrometry, resonance light scattering, and atomic force
microscopy.
For further details, see, for example, Zhou H, et al., Trends Biotechnol.
19:S34-9 (2001);
Zhu et al., Current Opin. Chem. Biol. 5:40-45-(2001); Wilson and Nock, Angew
Chem Int Ed
Engl 42:494-500 (2003); and Schweitzer and Kingsmore, Curr Opin Biotechnol
13:14-9 (2002).
Biomolecule arrays are also disclosed in United States Patent No. 6,406,921,
issued June 18,
2002, the entire disclosure of which is hereby expressly incorporated by
reference.
Further details of . the invention will be apparent from the following non-
limiting
examples.
Example I
Identification of Proteins and Polypeptides Expressed in Maternal Serum and
Aminotic Fluid Samples
Materials and Methods
Maternal serum and amniotic fluid samples evaluated (matched for gestational
age).
Control Down's syndrome
lst trimester 25 25
jnd trimester 25 25
Immunodepletion of abundant proteins in human serum
Human serum was depleted of six major proteins (albumin, IgG, IgA, anti-
trypsin,
tranferrin, and haptoglobin) using the Agilent multiple affinity system. The-
multiple affinity
column is based on antibody-antigen interactions and optimized buffers for
sainple loading,
washing, eluting, and regenerating. The column removes six high-abundance
proteins (80-90%
of total protein mass) from human serum such as albumin, IgG, IgA, anti-
trypsin, transferrin, and
haptoglobin, and allows the enrichment of low-abundance proteins for proteomic
analysis.
SUBSTITUTE SHEET (RULE 26)
CA 02591926 2007-03-16
WO 2006/034427 PCT/US2005/034083
Human serum (40 l) was diluted five times with Agilent buffer A (35 l of
serum with
180 l of buffer A). Particulates were removed by filtering through a 0.22 m
spin filter for 1
min at 16,000xg. 160 l of the diluted serum was injected into an Agilent
immunoaffinity
column (4.6 x 100 mm) attached to a Waters HPLC system equipped with an
autosampler, W
detector, and a fraction collector. The flow rate was set to 0.5ml//min for
the first 10 min with
0% B, and 10-17 min at lmUmin with 100% B and 17-28min at 1ml//min with 0% B.
Low-
abundance flow-through fractions 2-5 were collected, concentrated, and buffer
exchanged with
mM Tris, pH 8.4, using 5000 MWCO filters. Protein concentration was determined
using the
Bio-Rad DC protein assay kit.
Fluorescent 2-DGE
High-abundance proteins from serum (1-3 mg) were depleted using Agilent
immunoaffinity columns as described above. Serum proteins (20-50 g) were then
labeled with
CyDye DIGE Fluor minimal dye (Amersham Biosciences) at a concentration of 100-
400 pm of
dye/20-50 g of protein. Different dyes (Cy5, Cy3, and Cy2) were used to label
control or test
or reference serum samples. Labeled proteins were purified by acetone
precipitation and
dissolved in IEF buffer and rehydrated on to a 24 or 13-cm IPG strip (pH 4-7)
for 12 h at room
temperature. After rehydration, the IPG strip was subjected to 1-dimensional
electrophoresis at
65 -70 kVhrs. The IPG strip was then equilibrated with DTT equilibration
buffer I and IAA
equilibration buffer II for 15 minutes sequentially; before second dimension
SDS-PAGE
analysis. The IPG strip was then loaded on to a 8-16% SDS-PAGE gel and
electrophoresis
conducted at 80-90 V for 18 hrs to resolve proteins in the second dimension.
After the second dimension, the gel was scanned in a Typhoon 9400 scanner
(Amersham)
using appropriate lasers and filters with PMT voltage between 550-600 range.
Images in
different channels (control and test) were overlaid using selected colors, and
differences were
monitored using ImageQaunt software (Amersham Biosciences). Quantitation of
the gel images
was done using Evolution software (Nonlinear Dynamics).
For protein identification, serum proteins (500 g to 1500 g) were subjected
to 2-DGE
without labeling. The gel was stained with Coomassie Blue R-250 and imaged.
Individual spots
were cut from the gel, destained, and digested in-gel with trypsin for 24 hrs
at 37 C. The
peptides were extracted with 0.1%TFA and purified using Zip Tipc18 pipette
tips from Millipore.
Western immunoblottiniz and immunoprecipitation
50-100 g of serum proteins were run on 4-20% SDS-PAGE at 200 V for 60 minutes
and
transferred to PVDF membranes at 90 mA for 75 minutes. The membrane was
blocked with 5%
26
SUBSTITUTE SHEET (RULE 26)
CA 02591926 2007-03-16
WO 2006/034427 PCT/US2005/034083
milk-PBST for 45 min at room temperature and incubated with 1 g/ml primary
antibody (Santa
Cruz and Dako) overnight at 4 C. After washing with TBST 3 times, the
membrane was
incubated with an IgG-HRP secondary antibody (Sigma) for 90 min at room
temperature and
visualized with ECL (Pierce). For immunoprecipitation, 20 g of primary
antibody was mixed
with 600 g of serum protein and incubated at 4 C overnight. 15 l of protein
G-Sepharose
beads were then added and incubated on a shaker for 60 minutes at room
temperature. The beads
were washed with IP buffer for 6 times prior to elution and PAGE.
SELDI-TOF anal sy is of maternal serum
A total of 0.5-3.0 g protein from amniotic fluid and serum samples was
spotted on a
Normal-phase NP20 (Si02 surface), Reverse-Phase H4 (hydrophobic surface: C-16
(long-chain
aliphatic), or immobilized nickel (1MAC) SELDI ProteinChip arrays (Ciphergen
Biosystems,
Inc., Fremont, CA). After incubation at room temperature for 1 h, NP1 and H4
chips were
subjected to a 5- l water wash to remove unbound proteins and interfering
substances (i.e.,
buffers, salts, detergents). After air-drying for 2-3 min, two 0.5- l
applications of a saturated
solution of sinapinic acid in 50% acetonitrile (v/v), 0.5% trifluoroacetic
acid (v/v), was added
and mass analysis was performed by time-of-flight mass spectrometry in a
Ciphergen Protein
Biology System II (PBS Il).
Isotope-coded a anity tagging(ICAT)
ICAT is a recently developed complementary technique that can be used to
overcome
some of the limitations of 2DGE by providing protein identification and
quantification data on
differentially expressed proteins in control and diseased samples. The ICAT
peptide labeling
technique differentiates between two populations of proteins by using reactive
probes that differ
in isotope composition. A commercially available cleavable ICAT reagent from
Applied
Biosystems was used, which consists of a protein-reactive group
(Iodoacetamide) that alkylates
free cysteines on a protein, a 12C or 13C isotopically labeled linker region,
and an affinity (biotin)
tag to selectively isolate the cysteine-containing peptides. Two samples,
control and diseased,
are treated with the isotopically light (12C) or heavy (13C) ICAT reagents,
respectively. The
labeled protein mixtures are then combined, and proteolytically digested.
Labeled peptides are
then isolated using immobilized monomeric avidin affmity capture of the
biotinylated peptides.
The biotin label on the labeled peptides is then cleaved and the peptides
analyzed by nanoscale
liquid chromatography combined with electrospray ionization tandem mass
spectrometry (LC-
ESI MS/MS). The resulting MS and MS/MS spectra are analyzed using MCAT
software
(Waters) to determine the relative abundance of the tagged peptide pairs in
control and diseased
27
SUBSTITUTE SHEET (RULE 26)
CA 02591926 2007-03-16
WO 2006/034427 PCT/US2005/034083
samples, and searched against a large protein sequence database to identify
the protein. The
control acts as an internal reference to normalize the level of protein
abundance for comparative
analysis. The increase or decrease in the abundance ratio provides information
on up- or down-
regulation.
Protein Identification
Data acquisition and analysis
After in-gel digestion with trypsin, samples were analyzed on a Waters hybrid
quadrapole
time-of-flight mass spectrometer (Q-Tof-2) connected to a Waters CapLC. The Q-
Tof-2 was
equipped with a regular Z-spray or nanospray source and connected to an
Integrafrit or Nanoease
C18 75pm ID x 15cm x 3.5 m fused silica capillary column. The instrument was
controlled by,
and data were acquired on, a Compaq workstation with Windows NT and MassLynx
4.0
software. The Q-Tof-2 was calibrated using Glul Fibrinopeptide B by direct
infusion or
injection from the attached CapLC. Data-directed analysis was used. An MS/MSMS
survey
method was used to acquire MS/MSMS spectra. Masses of 400 to 1500 Da were
scanned for
MS survey, and masses of 50 to 1900 Da were scanned for MS/MS. Primary data
analysis was
performed on a PC with Windows 2000 and ProteinLynx Global Server v2.1 (PLGS)
as well as
the PEAKS de novo sequencing algorithm and our proprietary OpenSea software
vl.1 (Searle et
al., Analytical Chemistry 76:2220-2230 (2004)).
PLGS v2.1
Automated analysis of tandem mass spectra (MS/MS) was performed using PLGS
v2.1
software (Waters). Processing parameters used either medium or slow
deisotoping without any
background subtraction. After processing, the deisotoped MS/MS spectra were
searched against
the non-redundant International Protein Index (IPI) human database (20) using
a workflow with
database search and automod. In the workflow, fixed modifications were
carbamidomethyl C
and variable modifications were oxidation M and phosphorylation STY. The
automod query was
run after the database search using a non-specific primary digest reagent to
search for all possible
modifications and substitutions.
OpenSea v1.1
The OpenSea mass-based alignment algorithm vl.1 identifies proteins from MS/MS
data
of peptides by aligning de novo sequences derived from the data by PEAKS to
protein sequences
in databases. OpenSea converts all amino acid characters into a= series of
masses, and these
masses are compared using a dynamic programming approach. I
All Q-TOF MS/MS spectra were de novo sequenced using Peaks Batch Version 2.2
(Ma
et al., An effective algorithm for the peptide de novo=sequencing from MS/MS
spectrumLin 14th
28
SUBSTITUTE SHEET (RULE 26)
CA 02591926 2007-03-16
WO 2006/034427 PCT/US2005/034083
Symposium of Combinatorial Pattern Matching, 2003; Nelson et al., Analytical
Chemistry
67:1153-8 (1995)) (Bioinformatics Solutions Inc., Waterloo, ON, Canada) using
a mass accuracy
of 0.1 AMU. Peaks reports full amino acid sequences without unknown mass
regions, but
assigns each amino acid in the sequence a confidence score. Sequence regions
where amino
acids had confidence scores below 50% were replaced by the combined mass of
those amino
acids. If the entire sequence had an average confidence below 50%, only amino
acids that had
confidence below the average confidence were combined. All sequences were
analyzed with
OpenSea using monoisotopic masses for calculating hypothetical parent and
fragment masses
and were matched with a mass accuracy of 0.25 AMU. All samples were searched
against the
non-redundant International Protein Index (IPI) human database.
The parameters used to identify proteins were as follows: 1) any database
matches
including the string "keratin" in the protein description were excluded; 2)
each protein should
have greater than 95% probability of occurrence by both PLGS v2.1 and OpenSea
vl.l; and 3)
each protein should have two or more peptides.
Mass spectromeLry-based immunoaffinity assay for the detection of biomarkers
Protein biomarkers differentially expressed between maternal control and
Down's
syndrome serum identified using 2-DGE DIGE experiments are suitable for the
development of a
protein profile-based high-throughput screening system for the detection of
fetal Down's
syndrome. Individual protein biomarkers were captured from maternal serum by
immunoaffinity
purification and analyzed by matrix-assisted laser desorption/ionization time-
of-flight mass
spectrometry (MALDI-TOF MS).
29
SUBSTITUTE SHEET (RULE 26)
CA 02591926 2007-03-16
WO 2006/034427 PCT/US2005/034083
Sample preparation and biomarker immunoprecipitation
Serum samples were centrifuged for 15 min at 700xg to pellet blood cells.
Supernatants
are stored at -80 C. Each serum sample (up to 50 L for each individual
biomarker target) is
diluted with binding buffer and incubated with immunoaffinity beads (Pierce;
Rockford, IL)
derivatized with 50 g of coupled antibody. Down's syndrome target proteins
were eluted from
beads using a low pH, chaotropic buffer. Eluates are desalted and concentrated
using ZipTipTM
C4 pipette tips (Millipore; Billerica, MA) and spotted directly (along with
sinapinic acid matrix)
onto a hydrophobic/hydrophilic contrasting MALDI-TOF MS target (AnchorChipTM
MTP target
plate, Bruker Daltonics; Billerica, MA). AnchorChip targets encourage even
sample distribution
and crystallization, leading to higher sensitivity MALDI-MS spectra and less
dependence on
manual "sweet-spot" searching, making analysis more amenable to high-
throughput automation.
MALDI-TOF MS analXsis
MALDI-TOF MS analysis of eluted intact protein biomarkers were performed on an
Autoflex MALDI-TOF-MS mass spectrometer (Bruker Daltonics; Billerica, MA). The
resolution specifications of the Autoflex MALDI-TOF-MS (Resolution=1000 for
cytochrome c,
12361 Da, Rs = m/Ain (FWHM)) permit the detection of protein isoforms and
modifications.
For example, Nelson and coworkers were able to resolve isoforms of
apolipoprotein E differing
in mass by only 53 Da (ApoE2 and ApoE3 isoforms: 34,236.6 and 34, 183.6 Da,
respectively)
(228 A.T.B.n, Maternal serum screening. In AC'OG. 1996 Washington D.C.:
American College
of Obstreticians and Gynecologists). The MALDI-MS was operated in linear
delayed-extraction
mode with positive polarity for the detection of large polypeptides and
proteins (> m/z 5000).
Mass spectra are acquired using an attenuated adjustable 50-Hz nitrogen laser
(337 nm) with
100-200 shots per spectrum.
For adequate signal-to-noise considerations, several spectra were combined
dependent on
the intensity levels of the specific biomarker target of interest. Bruker
MALDI-TOF mass
spectrometer used has an mass accuracy in linear detection mode (used for the
detection of
higher mass polypeptides/proteins > m/z 5000) <100 ppm using internal
calibration (for
cytochrome c at m/z 12,361). External calibration is perfonned utilizing
calibration anchors
between each set of 4 sample well on Bruker MTP AnchorChipTM target plates.
Post-processing
analysis of acquired MALDI-MS biomarker ion signals from control and Down's
syndrome
samples was performed using ClinPro Tools software (Bruker Daltonics;
Billerica, MA).
Results
SUBSTITUTE SHEET (RULE 26)
CA 02591926 2007-03-16
WO 2006/034427 PCT/US2005/034083
A) Proteomic profiles usin-- SELDI-TOF mass sbectrometry to detect Down's
svndrome.
To identify the protein patterns representative of control and Down's
syndrome,
respectively, first low-molecular-weight proteins were enriched in serum by
removing the major
abundant proteins using Agilent immunoaffinity columns as described in the
methods. 1-2 g of
enriched protein sample was profiled on SELDI-TOF using four different surface
chemistry-
enhanced capture protocols (Ciphergen Protein Chip Arrays). Data analysis
using Biomarker
Wizard (Ciphergen, Inc.) revealed peaks that were distinctive of control and
Down's syndrome
serum (Figure 1). A subset of samples was further evaluated (Kersey et al.,
Proteomics 4:1985-
1988 (2004)) on a MALDI-TOF (Autoflex TOF-TOF, Bruker Daltonics) and the data
analyzed
using Clinprot software (Bruker Daltonics). This approach also revealed a
small number of
distinct peaks in Down's syndrome samples. These results demonstrated that
potential
differences in maternal serum from Down's syndrome in the low molecular weight
range can be
detected by SELDI/MALDI profiling. A sensitive and specific assay utilizing
these profiles
unique to Down's syndrome can be developed into a proprietary high-throughput
screening test.
B) Fluorescent 2-DGE.
Matched pairs (control and Down's syndrome) of maternal serum samples prepared
as
described in the methods section were labeled with fluorescent dyes (Cy5, Cy3
and Cy2) and
resolved on 2-D gels. ProteoGenix has developed proprietary high-thoughput
format to screen
large numbers of samples using 2-D gels and semi-quantification procedures (2-
D profiles) using
a fixed internal reference (pooled maternal serum) resolved on all of the gels
along with control
and Down's syndrome samples. As shown in Figure 1, second-trimester maternal
serum samples
revealed distinct differences between control and Down's syndrome cases and
significant
similarity of the profiles from first and second-trimester. Quantification of
intensity ratios
(Phoretics software, ImageQuant software, SAS analysis) demonstrated that the
significant areas
of interest 1-7 (as shown in Figure 2, high to low molecular weight) showed
sensitivities ranging
from about 40 to 80%. A combination of two or more areas was able to
discriminate all Down's
syndrome cases from controls in this matched-pair model.
To identify the potential proteins in these areas of interest, preparative 2-D
gels (1-2 mg
of purified protein) were used from three matched pairs of serum samples from
first and second
trimester. Spots from areas of interest (Figure 2, circled areas) were punched
and digested with
trypsin and analyzed by LC/MS/MS (Q-TOF2). Protein identification and data
analysis was
performed using proprietary proteomic software (OpenSea). Each area of
interest represented 2-
31
SUBSTITUTE SHEET (RULE 26)
CA 02591926 2007-03-16
WO 2006/034427 PCT/US2005/034083
3 proteins (Table 1). The proteins represented in the areas of interest were
the same for both first
and second-trimester serum samples. Proteins differentially expressed in
maternal serum not
represented in areas 1-7 are listed in Table 2.
Matched pairs (control and Down's syndrome) of amniotic fluid samples were
analyzed
as described above with fluorescent dyes (Cy5, Cy3 and Cy2) and resolved on 2-
D gels. The
differentially expressed proteins were identified using de novo sequencing and
listed in Table 3.
Relative quantitative differences noted in 2D fluorescent gels can be measured
using
Western blots. As an example antibodies to the predominant protein expressed
in area 1
(Complement factor H) were used to probe a maternal serum 2D western blot
resolved similarly
to the 2D fluorescent gels. As shown in Figure 4, Complement factor H was
expressed at a
higher level in Down's compared to control maternal serum. This demonstrates
that protein
biomarkers identified can be used in a standard quantification immunoassays to
detect fetal
Down's syndrome in maternal serum.
Figure 5 is a schematic representation of de novo protein sequence
identification of
candidate biomarkers of Down's syndrome. In particular, the figure shows
spectra representing
pepide sequences that belong to Complement factor H.
Figure 6 is a different schematic representatino of de novo protein sequence
identification
of candidate biomarkers of Down's syndrome. The figure shows the sequence
coverage map of
peptide sequences identified that belong to Complement factor H. Lighter
shading designated
the peptide identified within the polypeptide sequence, and the amino acid
residues marked with
darker shading are potential protein modifications at the indicated positions.
32
SUBSTITUTE SHEET (RULE 26)
CA 02591926 2007-03-16
WO 2006/034427 PCT/US2005/034083
Development of an Immuno-MALDI assay to measure biomarkers
The fluorescent 2-D gel analysis and protein identification as presented above
revealed a
significant number of potential biomarkers in maternal serum in both first and
second-trimester
samples. An Immuno-MALDI assay platform provides an unprecedented opportunity
for
multianalyte analysis. Another major advantage in this assay platform is the
ability to capture
isoforms that are specific for a disease. It would be very difficult to
develop an accurate ELISA
to measure such proteolytic fragments or protein modifications. This example
demonstrates the
feasibility of developing a high-throughput assay employing Irnmuno-MALDI
technology to
detect Down's syndrome.
An Immuno-MALDI assay has been developed to identify the differentially
expressed
proteins in areas 6 and 7. Protein identification from the 2-D gel spots for
this area demonstrated
the presence of Apolipoproteins Al, AII, and E. Immunoprecipitation of
apolipoproteins was
performed using 600 g of maternal serum samples from a matched pair of
control and Down's
syndrome samples. Eluents were profiled using Autoflex TOF-TOF (Bruker
Daltonics) as
described in the methods. As shown in Figure 3, all three forms of
apolipoprotein were detected,
and apolipoprotein AII showed significant quantitative differences between the
two samples.
Additionally, the apolipoprotein AII complex also revealed distinct isoforms
in Down's
syndrome maternal serum.
MALDI analysis of the above sample pairs indicated down-regulation of APOAI in
Down's syndrome serum compared to control serum. When performing IP analysis
on'the same
set of control and Down's syndrome serum using apolipoprotein A2 (APOA2)
antibody, the
MALDI profiles shown in Figure 3 indicated that the relative intensity of
APOA2 was again
higher in the control serum versus the Down's syndrome serum (APOA2 MW =
8707.9 Da).
Furthermore, different species were present in control versus the Down's
syndrome IPs. Thus,
our data demonstrate that MALDI-TOF MS allows the evaluation of both chapges
in relative
intensity as well as biomarker pattern changes.
This experiment demonstrates that optimization of other biomarkers identified
in the 2-
DGE analysis and the use of computational tools (ClinProt soflware) for
relative quantification
and optimization of statistical algorithms to develop diagnostic profiles will
provide a robust
high-throughput assay system. This system can be extended to distinguish other
aneuploidies in
the same setting through the addition of other potential targets.
Throughout the foregoing description the invention has been discussed with
reference to
certain embodiments, but it is not so limited. Indeed, various modifications
of the invention in
33
SUBSTITUTE SHEET (RULE 26)
CA 02591926 2007-03-16
WO 2006/034427 PCT/US2005/034083
addition to those shown and described herein will become apparent to those
skilled in the art
from the foregoing description and fall within the scope of the appended
claims.
Example II
Two-Dimensional Liquid Chromatog_raphy for the Separation and Identification
oõt'
Di fferentially Expressed Proteins in Down's syndrome
As a complementary strategy to 2D-DIGE analysis of proteins from maternal
Control and
Down's syndrome sera, a two-dimensional liquid chromatography (2D-LC) method
for
separating intact proteins can be employed. The 2D-LC method provides virtual
2D maps that
allow for the comparison of differential protein expression between control
and Down's
syndrome serum samples.
Sample Preparation and 2D-LC MethcadolM
For comparative analysis of protein expression in maternal control and Down's
syndrome
sera, sets of pooled maternal sera were prepared from first trimester and from
second trimester
patients. All sera were immunopurified (Agilent) and buffer-exchanged for CF
compatibility.
Between 5-7 mg of total serum protein was pooled for each sample. The same
amount of total
protein was used for 2D-LC analysis for each control/Down's syndrome sample
pair; first and
second-trimester sample pairs were analyzed independently.
2D-LC analysis was performed on a ProteomeLab PF2D system (Beckman-Coulter;
Fullerton, CA). Briefly, serum protein is loaded onto the first-dimension CF
anion exchange
column and eluted into 0.3 pH unit fractions according to protein isoelectric
point (pI/pH) using
a descending linear pH gradient. Each pH fraction is then separated in the
second dimension by
protein hydrophobicity using a nonporous C 18 RP-HPLC column (48 fractions
from each pH
fraction). A total of 800 fractions were collected from the RP-HPLC dimension
(from each
sample) to be digested enzymatically with trypsin for protein identification
by mass
spectrometry.
MS Analysis of Collected Differential Fractions
Figure 7 shows the protein expression maps generated by the 2D-LC analysis of
second
trimester maternal control versus maternal Down's syndrome serum. Figure 7A
depicts the 2D-
LC maps generated using ProteoVue software display the pI of the eluted
protein from CF on the
x-axis and the retention time, or hydrophobicity, of the eluted protein from
RP-HPLC on the y-
axis. Figure 7B depicts the 2D map of the control sample is depicted in red on
the left and the
2D map of the Down's syndrome sample is depicted in green on the right. The
center of the
34
SUBSTITUTE SHEET (RULE 26)
CA 02591926 2007-03-16
WO 2006/034427 PCT/US2005/034083
figure displays the difference map (displayed separately in Figure 7B) of the
two samples, where
bands seen in green are proteins up-regulated in the Down's syndrome sample
and bands seen in
red are proteins up-regulated in the control sample.
Bands in the difference map showing up-regulation in either Down's syndrome or
control
serum were digested with trypsin and prepared for protein identification
analysis using an ESI-
QTOF-MS/MS (QTOF2, Waters; Milford, MA). Using a differential intensity cutoff
of at least
10-20% of the higher intensity peak from either the control or Down's syndrome
sample, this
corresponds to about 95 bands in the first-trimester sample set and 80 bands
in the second-
trimester sample set. Differential expression intensities between control and
Down's syndrome
fractions ranged from 0.004 AU to 0.638 AU (limit of detection for MS analysis
of fraction
digests is conservatively -0.05 AU; the AU scale for the second dimension
separations reaches a
maximum of -1.3 AU).
2D-LC Identification of Differentially Expressed Proteins in Maternal Down's
Syndrome
Serum
Table 5 presents a list of identified proteins showing differential peptide
counts on
LC/MS/MS (Q-TOF2, Waters, Inc) analysis in Down's syndrome maternal serum.
(abbreviationsare T1, firstrimester; T2, second trimester maternal serum.)
Example III
Glycoprotein Profiles ofMaternal Serum Predictive ofDown's Syndrome
Glycosylation is one of the complex posttranslational modifications of
proteins in
eukaryotes. A systematic evaluation of the glycosylation process is a valuable
tool in mining
protein biomarkers, as a minor change such as a single glycosylation event can
alter the fate and
function of a physiologically important protein, which could be, in turn
related to a particular
disease or state of an organism. Changes in the glycosylation pattern or
glycan structure
occurring in response to cellular signals or stages of development could be
used to identify
diseases such as cancer. Lectin based affinity purification is the method of
choice for isolating
different classes of glycosylated proteins. Lectins are plant proteins, which
can specifically and
reversibly bind to glycan moieties in glycoproteins. The major classes and
types of glycoproteins
can be individually isolated from the test samples and can be used to generate
a differential
glycosylation profile to compare control versus disease.
Methods
Total glycoproteins, Sialic, Mannose and 0-glycosylated proteins from
gestational age
matched Control and DS maternal serum were purified using appropriate lectin
affinity columns
(Q Proteome, Quiagen).
SUBSTITUTE SHEET (RULE 26)
CA 02591926 2007-03-16
WO 2006/034427 PCT/US2005/034083
Total glycoproteins extraction was performed using a combination of lectins,
Mannose
binding lectins (ConA, LCH, GNA) + Sialic acid/N-acetyl-glucosamine binding
lectins (WGA,
SNA). M- linked glycoproteins were extracted utilizing mannose-binding lectins
(ConA, LCH,
GNA). S-linked glycoproteins were extracted utilizing Sialic acid/N-acetyl-
glucosamine binding
lectins (WGA, SNA, MAL). ) 0-linked glycoproteins were extracted utilizing
Galactose/N-
acetyl-galactosamine binding lectins (AIL, PNA).
Glycoproteins extracted from Control and Down's syndrome maternal serum were
analyzed using 2-Dimensional fluorescent gel electrophoresis and LC/MS/MS
approaches to
identify potential markers for pown's syndrome. 50ug each of the isolated
Control and Down's
syndrome glycoproteins were labeled with 400pm of Cy3 and Cy5 fluorescent dyes
respectively.
Isoelectric focusing,was performed on a pH 4-7 IPG strip on Ettan Dalt 2
IPGphor system (GE -
Amresham) using appropriate voltage settings for each IPG strip length. 10-20%
Tris-Glycine
gels were used for the second dimension PAGE. Differential fluorescent image
for each gel was
acquired using Typhoon Variable mode imager (GE-Amersham) using excitation
wavelengths
for Cy3 and Cy5. Differentially expressed proteins spots were visualized using
ImageQuant (GE-
Amersham) software, excised from the gel, and digested with trypsin for
protein identification on
a mass spectrometer (Q-ToF 2, Waters Inc).
Figures 8-11 represent unique differential expression profiles of
glycoproteins in
maternal serum in Down's syndrome.
36
SUBSTITUTE SHEET (RULE 26)
CA 02591926 2007-03-16
WO 2006/034427 PCT/US2005/034083
Areas showing differences, red or green were punched from the gels, digested
with
trypsin and protein identification was confirmed using LC/MS/MS.
Total glycoprotein mixtures extracted from 1 st and 2nd trimester control and
Down's
syndrome maternal serum samples were digested with trypsin and analyzed using
LC/MS/MS.
Glycoproteins representing differences (greater number of total peptides for
each protein) were
compiled and compared with the glycoproteins identified from differentially
expressed spots
from 2-dimensional gels and the list of glycoproteins identified in Down's
syndrome maternal
serum is presented in Table 6.
All references cited throughout the description, and the references cited
therein, are
hereby expressly incorporated by reference in their entirety.
37
SUBSTITUTE SHEET (RULE 26)
CA 02591926 2007-03-16
WO 2006/034427 PCT/US2005/034083
Table 1
Differential expression of proteins in Human Maternal Serum in areas 1-7as
determined by 2D-DIGE
SwissProt Max peptides
Accession in one Max
Area Number Protein ID Description sample coverage
1 IP08603 CFAH_HUMAN COMPLEMENT FACTOR H 36 41%
1 ~ P20~ 742 PZP_HUMAN PREGNANCYZONE PROTEIN 7 10%
1 002985 FHR3_HUMAN COMPLEMENT FACTOR H-RELATED PROTEIN 32 10%
2 P43652 AFAM_HUMAN AFAMIN 13 28%
2 Q14624 TI 4 HUMAN INTER-ALPHA-TRYPSIN INHIBITOR HEAVYCHAIN H4 7 13%
2 P01019 ANGT HUMAN ANGIOTENSINOGEN 6 17%
3 P01019 ANGT HUMAN ANGIOTENSINOGEN 12 35%
3 P02774 VTDB_HUMAN VITAMIN D-BINDING PROTEIN 12 50 l0
3 P01008 ANT3_HUMAN ANTITHROMBIN-I11 3 33% ~
4 P02765 A2HSHUIVIAN ALPHA-2-HS-GLYCOPROTEIN 9 38%
4 P01019 ANGT HUMAN ANGIOTENSINOGEN 7 21%
4 P04004 1 VTNC_HUMAN VITRONECTIN 3 8% 5 P02647 APA1HUMAN APOLIPOPROTEIN Arl
11 _ 58%
P10909 ' C LUSHU_MAN CLUSTERIN + 6 _26%
5- P01024~ -r C03_HUMAN _ COMPLEMENT C3 8%0 - i
6 P02647 APA1_HUMAN ~- APOLIPOPROTEIN AI 5 25%
6 P06727 APA4 HUMAN I APOLIPOPROTEIN AIV 4 14%
7-1P02649~ APE_HUMAN APOLIPOPROTEIN E -' 11 47%
_.... _. ._.. ~ _.. _.. . _. ~_ .
~ 7_ (075636 FCN_3__H_UM_AN FICOLIN 3 5 28%
7_ P0_ 1028 - _, C04~HUMA_N COMPLEMENT C4_ 3 2%
~ _- --- - - - - -- ~ - '~ ~ ~- -- ~ ~ -- ____..
38
SUBSTITUTE SHEET (RULE 26)
CA 02591926 2007-03-16
WO 2006/034427 PCT/US2005/034083
Table 2
iDifferentially expressed proteins in Human Control & Downs Serum
SwissProt IPI
Accessio Accessio
n Number n Number Protein ID Proteins identified
4P02763 A1AG_HUMAN Alpha 1 acid glycoprotein
P0~ 4217 ~ A1BG_HUMAN Alpha 1B Glycoprotein
P02760 AMBP_HUMAN AMBP protein
,P01024 C03HU_MAN Anaphylotoxin C3A
P026 74 ~~- APA1_HUMAN Apolipoprotein A-1
P02652 APA2_HUMAN Apolipoprotein A-II
,P02654 APC1_HUMAN Apolipoprotein C-1
P02655 APC2 HUMAN Apolipoprotein C-II
P02749 APOHHUMAN Beta-2 glycoprotein
P05109 S108_HUMAN Caigranulin A
P00450 CERU_HUMAN Ceruloplasmin
tP01028 C04_HUMAN Complement C4
P01024 C03_HUMAN Complement C-III ~
P08603 CFAH_HUMAN Complement Factor H (splice isofo
P02679 FIBG_HUMAN Fibrinogen-gamma chain
P00737-7-_HPT1_HUMAN Haptogiobin 1-
P00738 HPT_HUMAN Haptoglobin 2 F
P00739 HPTR_HUMAN Haptoglobin related protein
P02790 HEMO_HUMAN Hemopexin
P36955 PEDF_HUMAN Pigment Epithelium-Derived Factor
P05155 IC1_HUMAN Plasma Protease Cl Inhibitor
SZ07 HUMAN Platelet basic protein
P02775 ~ _ __
P02735 SAA_HUMAN Serum amyloid A protein
IP100257664 Similar to Ceruloplasmin
IPI00053956 Similar to Dead H ASP GLU AL
. ...J...........
P04004 VTNC_HUMAN Vitronectin_ i
P25311 - ZA2G_HUMAN__ Znc alpha 2 glycoprotein
39
SUBSTITUTE SHEET (RULE 26)
CA 02591926 2007-03-16
WO 2006/034427 PCT/US2005/034083
Table 3
Differentially expressed proteins in Human Control & Downs Amniotic Fluid
SwissProt
Accessio
n Number IPI Accession Number Protein ID Description
02765 - r~ A2HS_HUMAN Alpha 2 HS Glycoprotein
.P02760 AMBP_HUMAN AMBP protein
P02647 APA1_HUMAN Apolipoprotein A-1
1P01884 B2MG_HUMAN Beta-2-microglobulin
IP100178276 BPOZ splice variant
P02452 CA11_HUMAN Collagen alpha 1(I) chain
P02461 CA13_HUMAN Collagen alpha 1(III) chain
iP01034 ~ CYTC_HUMAN Cystatin C
IP100073904 D 10S 102
1IPI00010341 EMBP_HUMAN Eosinophil Granule Major Basi
P09466 PAEP_HUMAN Glycodelin (GD) (Pregnancy associated protein)
IP100334832 Hypothetical 177AA 20495
1P100182398 - ~ - ~ ~ Hypothetical protein FLJ40785
IP100246890 Hypothetical protein XP 299919
__. ----_._.__. = -_._
.. _. _.... _. _._.! IP_!0_ 01782 29 ~'.-.~... ......_ __ -- LAMRL5
551884 ~~ ~~ ~- ~ LUM HUMAN Lumican
-
,IP100-178198 NuclearfactorI-A
P02753 y _ RETB_HUMAN Plasma retinol binding protein ~~-
IP100306589 Ubiquitin B 229 AA 25762
SUBSTITUTE SHEET (RULE 26)
CA 02591926 2007-03-16
WO 2006/034427 PCT/US2005/034083
Table 4
SwissProt Accession Number Protein ID Description
P08603 CFAH HUMAN complement factor H
P20741 PZP HUMAN pregnancy zone protein
P43652 AFAM HUMAN afamin
P01019 ANGT HUMAN angiotensinogen
P02765 A2HS HUMAN alpha-2-hs-glycoprotein
P10909 CLUS HUMAN clusterin
P02647 APAl HUMAN apolipoprotein AI
P06727 APA4-HUMAN apolipoprotein AIV
P02649 APE HUMAN apolipoprotein E
P36933 PEDF_HUMAN pigment epithelium-derived
factor
P02735 SAA HUIVIAN serum amyloid A protein
P02760 AMBP HUMAN AMBP protein
P02753 RETB HUMAN plasma retinol binding protein
41
SUBSTITUTE SHEET (RULE 26)
CA 02591926 2007-03-16
WO 2006/034427 PCT/US2005/034083
Table 5
Protein Description Trimester
A1AG Alpha-l-acid glycoprotein 1 precursor T1
A1AH Alpha-1-acid glycoprotein 2 precursor T1
AIBG Alpha-1B-glycoprotein precursor T1,T2
A2GL Leucine-rich alpha-2-glycoprotein precursor T2
A2HS Alpha-2-HS-glycoprotein precursor T1,T2
A2MG Alpha-2-macroglobulin precursor T1
AFAM Afamin precursor T2
ANT3 Antithrombin-III precursor T1,T2
APA1 Apolipoprotein A-I precursor T1,T2
APA2 Apolipoprotein A-II precursor T2
APA4 Apolipoprotein A-IV precursor T1,T2
APCI Apolipoprotein C-I precursor T2
APC2 Apolipoprotein C-II Precursor T2
APC3 Apolipoprotein C-I11 precursor T1,T2
APOD Apolipoprotein D precursor T1
APOE Apolipoprotein E precursor T1
CERU Ceruloplasmin precursor T1,T2
CFAB Complement factor B precursor TI
CFAH Complement factor H precursor T1,T2
CFAI Complement factor I precursor TI
CLUS Clusterin precursor T1 T2
C03 Complement C3 precursor T1,T2
C04 Complement C4 precursor T2
C06 Complement component C6 precursor T1,T2
C07 Complement component C7 precursor T1,T2
F13B Coagulation factor XIII B chain precursor T1,T2
FA12 Coagulation factor XII precursor T2
HEMO Hemopexin precursor T1,T2
HRG Histidine-rich glycoprotein precursor T1,T2
ITH4 Inter-alpha-trypsin inhibitor heavy chain H4 precursor T1,T2
KNG Kininogen precursor T1,T2
PLMN Plasminogen precursor T1
PSGI Pregnancy-specific beta-1-glycoprotein I precursor T2
RETB Plasma retinol-binding protein precursor T2
SHBG Sex hormone-binding globulin precursor T2
TETN Tetranectin precursor T1,T2
THRB Prothrombin precursor T2
ITHY Transthyretin precursor T1,T2
VTDB Vitamin D-binding protein precursor T1,T2
ZA2G Zinc-alpha-2-glycoprotein precursor T1,T2
42
SUBSTITUTE SHEET (RULE 26)
CA 02591926 2007-03-16
WO 2006/034427 PCT/US2005/034083
Table 6
UniprotKB/
Swiss-
ProtlTrEMBL
IPI Accession Accession
rotein ID Number Number Description
RFE HUMAN IP100022463 P02787 SEROTRANSFERRIN PRECURSOR. P02787 [[698 AA; 77050
NIW]]
1AT HUMAN IP100305457 Q9P173 ALPHA-1-ANTITRYPSIN PRECURSOR. P01009 [[418 AA;
46737 MW]j
2MG_HUMAN IPI00032256 Q59F47 ALPHA-2-MACROGLOBULIN PRECURSOR. P01023 [[1474
AA; 163278 MW]]
COMPLEMENT C3 PRECURSOR (Contains: C3A ANAPHYLATOXIN]. P01024 [[1664 AA;
03_HUMAN 1P100164623 P01024 187235 MWE
ANGIOTENSINOGEN PRECURSOR [Contains: ANGIOTENSIN 1(ANG 1) ANGIOTENSIN Il
(ANG II) ANGIOTENSIN III (ANG 111) (DES-ASP[1]- ANGIOTENSIN 11)]. P01019 [[485
AA;
NGT HUMAN IP100032220 P01019 53154 MWE
ERU_HUMAN IPI00017601 P00450 CERULOPLASMIN PRECURSOR. P00450 ([1065 AA; 122205
MW]]
PT HUMAN IPI00019571 P00738 HAPTOGLOBIN PRECURSOR. P00738 [[416 AA; 46271 MWE
NT3_HUMAN IP100032179 P01008 ANTITHROMBIN-III PRECURSOR. P01008 [[464 AA;
52602 MWE
EMO_HUMAN IPI00022488 P02790 HEMOPEXIN PRECURSOR. P02790 [[462 AA; 51676 MWE
1AG_HUMAN IP100022429 P02763 ALPHA-I-ACID GLYCOPROTEIN I PRECURSOR. P02763
[[201 AA; 23512 MW]]
PAi_HUMAN IP100021841 P02647 APOLIPOPROTEIN A-I PRECURSOR. P02647 [[267 AA;
30778 MW]]
1100216722 IP100216722 P04217 ALPHA 1 B-GLYCOPROTEIN. [[495 AA; 54254 MWE
SPLICE ISOFORM LMW OF P01042 KININOGEN PRECURSOR (ALPHA-2-THIOL
NG_HUMAN IPI00215894 P01042-2 PROTEINASE INHIBITOR) [Contains: BRADYKININ].
P01042-2 [[427 AA; 47883 MW]J
INTER-ALPHA-TRYPSIN INHIBITOR HEAVY CHAIN H2 PRECURSOR. P19823 [[947 AA;
H2_HUMAN 1P100305461 P19823 106596 MWj]
2HS_HUMAN IPI00022431 P02765 ALPHA-2-HS-GLYCOPROTEIN PRECURSOR. P02765 [[367
AA; 39325 MW]]
4CT HUMAN IPI00032215 P01011-2 ALPHA-I-ANTICHYMOTRYPSIN, PRECURSOR. P01011
[[433 A'A; 48637 MW]]
SPLICE ISOFORM 2 OF Q14624 INTER-ALPHA-TRYPSIN INHIBITOR HEAVY CHAIN H4
PRECURSOR (ITI HEAVY CHAIN H4) (INTER-ALPHA-INHIBITOR HEAVY CHAIN 4) (INTER-
ALPHA-TRYPSIN INHIBITOR FAMILY HEAVY CHAIN-RELATED PROTEIN) (IHRP) (PLASMA
KALLIKREIN SENSITIVE GLYCOPROTEIN 120) (PK-120) (GP120) (PR01851) [Contains:
H4_HUMAN IPI00218192 Q14624-2 GP571. Q14624-2 [[914 AA; 101242 MW]]
SPLICE ISOFORM 1 OF P08603 COMPLEMENT FACTOR H PRECURSOR. P08603-1 [[1231
FAH_HUMAN 1P100029739 P08603-1 AA; 139125 MWE
1_HUMAN IP100291866 P05155 PLASMA PROTEASE Cl INHIBITOR PRECURSOR. P05155
[(500 AA; 55154 MW]]
100154742 IP100154742 Q8N355 HYPOTHETICAL PROTEIN. [[237 AA; 24897 MW]]
=P2_HUMAN IP100292950 P05546 HEPARIN COFACTOR II PRECURSOR. P05546 [[499 AA;
57071 MW]]
SPLICE ISOFORM 1 OF P00751 COMPLEMENT FACTOR B PRECURSOR. P00751-1 [[764
=AB HUMAN 1PI00019591 P00751-1 AA; 85533 MWJ]
>2G_HUMAN IPI00166729 P25311 ALPHA-2-GLYCOPROTEIN 1, ZINC. P25311 [[298 AA;
34259 MW]]
VITRONECTIN PRECURSOR (SERUM SPREADING FACTOR) (S-PROTEIN) (V75) [Contains:
VITRONECTIN V65 SUBUNIT VITRONECTIN V10 SUBUNIT SOMATOMEDIN B]. P04004
rNC_HUMAN IPI00298971 P04004 ff478 AA; 54306 MW]]
100061246 IP100061246 Q96E61 HYPOTHETICAL PROTEIN. [[236 AA; 24713 MW]]
INTER-ALPHA-TRYPSIN INHIBITOR HEAVY CHAIN H1 PRECURSOR. P19827 [[911 AA;
H1_HUMAN IP100292530 P19827 101389 MWj]
D9_HUMAN IP100022395 P02748 COMPLEMENT COMPONENT C9 PRECURSOR. P02748 [[559
AA; 63173 MW]]
SPLICE ISOFORM ALPHA-E OF P02671 FIBRINOGEN ALPHA/ALPHA-E CHAIN
BA HUMAN IPI00021885 P02671-1 PRECURSOR [Contains: FIBRINOPEPTIDE A]. P02671-1
[[866 AA; 94973 MW]J
FIBRINOGEN BETA CHAIN PRECURSOR [Contains: FIBRINOPEPTIDE B]. P02675 [[491 AA;
BB_HUMAN IP100298497 P02675 55928 MW]]
SPLICE ISOFORM GAMMA-B OF P02679 FIBRINOGEN GAMMA CHAIN PRECURSOR.
BG_HUMAN IP100021891 P02679-1 P02679-1 11453 AA; 51512 MW]]
43
SUBSTITUTE SHEET (RULE 26)
CA 02591926 2007-03-16
WO 2006/034427 PCT/US2005/034083
Table 6 (cont.)
RB_HUMAN IPI00019568 P00734 PROTHROMBIN PRECURSOR. P00734 [[622 AA; 70037 MW]]
JS_HUMAN IP100291262 P10909 CLUSTERIN PRECURSOR. P10909 j[476 AA; 55192 MW]]
3G_HUMAN IP100022895 P04217 ALPHA-113-GLYCOPROTEIN PRECURSOR. P04217 [[495 AA;
54209 MW]]
kH_HUMAN IP100020091 P19652 ALPHA-1-ACID GLYCOPROTEIN 2 PRECURSOR. P19652 9201
AA; 23603 MW]]
CD_HUMAN IP100006662 P05090 APOLIPOPROTEIN D PRECURSOR. P05090 [[189 AA; 21276
MW]]
3_HUMAN IPI00025426 P20742 PREGNANCY ZONE PROTEIN PRECURSOR. P20742 [[1482 AA;
163836 MW]j
G_HUMAN IPI00022371 P04196 HISTIDINE-RICH GLYCOPROTEIN PRECURSOR. P04196 [[525
AA; 59578 MW]]
)0166866 IPI00166866 Q8N5K4 HYPOTHETICAL PROTEIN. ff499 AA; 53376 MW]]
SPLICE ISOFORM 1 OF P04278 SEX HORMONE-BINDING GLOBULIN PRECURSOR. P04278-
BG_HUMAN IP100023019 P04278-1 1 [[402 AA; 43779 MW]]
PLASMINOGEN PRECURSOR (EC 3.4.21.7) [Contains: ANGIOSTATIN]. P00747 [[810 AA;
V1N_HUMAN 1PI00019580 P00747 90569 MW]]
C3_HUMAN IP100021857 P02656 APOLIPOPROTEIN C-111 PRECURSOR. P02656 [[99 AA;
10852 MW]]
3L HUMAN IP100022417 P02750 LEUCINE-RICH ALPHA-2-GLYCOPROTEIN PRECURSOR.
P02750 ff347 AA; 38178 MW]]
E_HUMAN IPI00021842 P02649 APOLIPOPROTEIN E PRECURSOR. P02649 [[317 AA; 36154
MW]]
TB_HUMAN IP100005439 Q9UGM5 FETUIN-B PRECURSOR. Q9UGM5 [[382 AA; 42094 MW]]
MYOSIN-REACTIVE IMMUNOGLOBULIN LIGHT CHAIN VARIABLE REGION. [[108 AA; 11834
)00078134 1PI00007884 Q9UL83 MWjj
5_HUMAN IPI00017696 P09871 COMPLEMENT CIS COMPONENT PRECURSOR. P09871 [[688
AA; 76684 MW]]
AMBP PROTEIN PRECURSOR [Contains: ALPHA-1-MICROGLOBULIN (PROTEIN HC)
(COMPLEX-FORMING GLYCOPROTEIN HETEROGENEOUS IN CHARGE) (ALPHA-1
MICROGLYCOPROTEIN) INTER-ALPHA-TRYPSIN INHIBITOR LIGHT CHAIN (ITI-LC)
iBP HUMAN IP100022426 P02760 (BIKUNIN) (HI-30)]. P02760 Q352 AA; 38999 MW]]
COMPLEMENT C4 PRECURSOR [Contains: C4A ANAPHYLATOXIN]. P01028 [[1744 AA;
14_HUMAN IP100032258 P01028 192771 MW]]
44
SUBSTITUTE SHEET (RULE 26)