Note: Descriptions are shown in the official language in which they were submitted.
CA 02592047 2007-06-13
WO 2006/076798 PCT/CA2006/000056
METHOD AND APPARATUS FOR PERFORMING A SENSOR
FUSION TO PROVIDE A POSITION OF A TARGET-OF-
INTEREST
TECHNICAL FIELD
This invention relates to the field of
identifying/tracking a -target-of-interest (TOI). More
precisely, this invention relates to the fusion of
disparate information from multiple position detection
sensors to yield a best estimate of the true position of
the target-of-interest (TOI), taking particular advantage
of 'sensor that lack contact with the target.
BACKGROUND OF THE INVENTION
Several methods have been implemented, familiar to one
versed in the art, for integrating the information from
multiple sensors to arrive at such a best estimate. For
example, Kalman filtering is one technique that is used to
iteratively derive the best estimate of a vehicle's
position from different navigation sensors, while
simultaneously determining the error components of each
sensor. Such techniques share one precept: information is
only incorporated in the solution from those sensors that
have a detection, or "Hit" from the target. One familiar
with the art of Signal Detection Theory ('SDT) will
recognize that a "Hit" is only one of four possible
outcome permutations between a sensor and a target:
"HIT": The sensor correctly detects the presence of a
target;
- 1 -
CA 02592047 2007-06-13
WO 2006/076798 PCT/CA2006/000056
"MISS": The sensor fails to detect a target that is
present;
"FALSE ALARM (FA)": The sensor falsely detects a target
where one does not exist;
"CORRECT REJECTION (CR)": The sensor correctly determines
that no target is present.
The signal detection theory provides statistical methods
for addressing sensitivity thresholds that govern the
balance between the "miss" and "false alarm" cases. By
definition, there is no definitive way to distinguish
between a"Hit" and a "false alarm" from a single sensor;
if there were, the event would never be categorized as a
"false alarm". Similarly, there is no way to discriminate
between a "Correct rej ection" =and a "miss", from a singl.e
sensor, otherwise, there would never be any "miss"
classifications.
There is a need for a method and apparatus that will
overcome the above-identified drawbacks.
SUNDIARY OF THE INVENTION
It is an object of the invention to provide a method and
apparatus for identifying the true position of a target of
interest using a plurality of position detection sensors.
It is another object of the invention to provide a method
and apparatus for tracking the true position of a target
of interest using a plurality of position detection
sensors.
According to a first aspect of the invention, there is
provided a method for generating a global detection
probability profile for a target using a plurality of
- 2 -
CA 02592047 2007-06-13
WO 2006/076798 PCT/CA2006/000056
sensors, the method comprising for at least one of the
sensors, receiving a detection status (HIT or CORRECT
REJECTION) from the sensor and retrieving a corresponding
detection probability profile, wherein the corresponding
detection probability profile comprises a time-variant
three-dimensional distribution defining the sensor's
possible detection envelope and the computed probability
of detection of the target of interest corresponding to
each region of the envelope and combining each of the
corresponding detection probability profile to generate
the global detection probability profile, the combining
comprising probabilistically adding first given
probability profile in the case where a first given
corresponding indication comprises a target detection, and
probabilistically subtracting a second given probability
profile in the case where a corresponding second given
indication comprises a target non-detection.
When a large number of sensors is used, a useful
approximation for the probability of a target-of-interest
detection at a specific point may be achieved by weighting
and numerically summing the detection probability profiles
at that point, although this simplification does not
preclude the rigorous application of probability theory
where warranted. The methods for combining probabilities
are well known to those skilled in the art, and will not
be repeated here, but the words "adding" and "subtracting"
are deemed to include the full probabilistic addition and
subtraction as well as the simple arithmetic summation and
difference operators. Graphically, the combination of the
detection probability profiles may be visualized by the
superimposition of the individual detection probability
profile patterns. A key feature of the detection
probability profile combination is that serviceable
- 3 -
CA 02592047 2007-06-13
WO 2006/076798 PCT/CA2006/000056
sensors that do not have a "Hit" are assumed to have a
"Correct rejection" and their detection probability
profile profiles are subtracted from the total detection
probability profile field.
According to another aspect of the invention, there is
provided a method for estimating a position of a target of
interest using a plurality of position detection sensors,
the method comprising for at least one of the sensors,
receiving a detection status from the sensor and obtaining
a detection probability profile corresponding to the
sensor, wherein the corresponding detection p'robability
profile comprises a time-variant . three-dimensional
distribution defining the sensor's possible detection
envelope and the computed probability of detection of the
target of interest corresponding to each region of the
envelope;, combining each of the corresponding detection
status and the detection probability profiles to generate
a global detection probability profile, the combining
comprising probabilistically adding a first given
probability profile in the case where a first given
corresponding indication comprises a target detection, and
probabilistically subtracting a second given probability
profile in the case where a corresponding second given
indication comprises a target non-detection and estimating
the position of the target corresponding to the highest
probability region(s) in the generated global detection
probability profile.
According to another aspect of the invention, there is
provided an apparatus for providing a global detection
probability profile for a target of interest using inputs
from a plurality of sensors, the apparatus comprising a
probability profile providing unit for providing a
- 4 -
CA 02592047 2007-06-13
WO 2006/076798 PCT/CA2006/000056
plurality of detection probability profile signals for the
target, wherein each of the corresponding detection
probability profile signals comprises a time-variant
three-dimensional distribution defining the sensor's
possible detection envelope and the computed probability
of detection of the target of interest corresponding to
each region of the envelope and a processing unit
combining sensor detection status information from each
sensor with the corresponding plurality of detection
probability profile signals and combining each of the
corresponding detection probability profile signals to
generate a global detection probability profile signal,
the combining comprising probabilistically adding a first
given probability profile signal in the case where a first
given corresponding indication comprises a target
detection, and probabilistically subtracting a second
given probability profile signal in the case where a
corresponding second given indication comprises a target
non-detection.
According to a further aspect of the invention, there is
provided an apparatus for providing an estimation of a
position of a target of interest using inputs from a
plurality of position detection sensors, the apparatus
comprising a probability profile providing unit for
providing a plurality of detection probability profile
signals corresponding to each sensor, wherein each of the
corresponding, detection probability profile signals
comprises a time-variant three-dimensional distribution
defining the sensor's possible detection envelope and the
computed probability of detection of the target of
interest corresponding to each region of the envelope, a
processing unit receiving sensor detection status
information and the provided plurality of detection
- 5 -
CA 02592047 2007-06-13
WO 2006/076798 PCT/CA2006/000056
probability profile signals and combining each of the
corresponding detection probability profile signals to
generate a global detection probability profile signal,
the combining comprising probabilistically adding a first
given probability profile signal in the case where a first
given corresponding indication comprises a target
detection, and probabilistically subtracting a second
given probability profile signal in the case where a
corresponding second given indication comprises a target
non-detection and a position estimating unit receiving the
global detection probability profile signal and estimating
the position of the target using at least said received
global detection probability profile to provide the
estimation of the position of the target of interest.
According to a further aspect of the invention, there is
provided a method for estimating a position of a target of
interest using a 'plurality of position detection' sensors
wherein a loss of contact with the target is detected for
a given sensor, the method comprising estimating for the
given sensor a corresponding time-variant detection
probability profile comprising a three-dimensional
distribution defining the given sensor's possible
detection envelope and the computed probability of
detection of the target of interest corresponding to each
region of the envelope, providing for other sensors a
corresponding detection probability profile comprising a
three-dimensional distribution defining the other sensor's
possible detection envelope and the computed probability
of detection of the target of interest corresponding to
each region of the envelope, combining each of the
corresponding detection probability profiles to generate a
global detection probability profile, the combining
comprising probabilistically adding a first given
- 6 -
CA 02592047 2007-06-13
WO 2006/076798 PCT/CA2006/000056
probability profile in the case where a first given
corresponding indication comprises a target detection, and
probabilistically subtracting a second given probability
profile in the case where a corresponding second given
indication comprises a target non-detection and estimating
the position of the target corresponding to the highest
probability region(s) using the generated global detection
probability profile.
In this specification, the term "adding" is intended to
mean "probabilistically adding" and "subtracting" is
intended to mean "probabilistically subtracting".
BRIEF DESCRIPTION OF THE DRAWINGS
Further features and advantages of the present invention
will become apparent from the following detailed
description, taken in combination with the appended
drawings, in which:
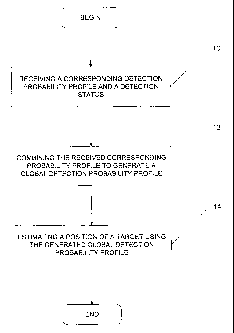
Figure 1 is a flowchart which shows one embodiment for
estimating a position of a target; according to a first
step a corresponding detection probability profile and a
detection status' are received; according to a second step
the received corresponding probability profiles are
combined to generate a global detection probability
profile and. according to a third step the position is
estimated using the generated global detection probability
profile;
Figure 2 is a flowchart which shows an embodiment for
estimating the position of the target using the generated
global detection probability profile;
Figure 3 illustrates an example of an evolution through
time of a detection probability profile comprising a
- 7 -
CA 02592047 2007-06-13
WO 2006/076798 PCT/CA2006/000056
circular normally-distributed pattern, centered around the
sensor's position; such a distribution may be
representative of a vertical dipole radio antenna;
Figure 4 shows an example of an evolution through time of
a normally-distributed detection probability profile
centered on a linear sensor pattern, such a distribution
may be representative of a satellite ground swath;
Figure 5 illustrates an example of an evolution through
time of a normally-distributed pattern centered on a
radial from an angular sensor, such distribution may be
provided by a directional microphone;
Figure 6 shows an example of an evolution through time of
a annular detection probability profile pattern which may
be representative of multi-modal HF radio transmissions,
or multi-modal acoustic transmissions through water;
Figure 7 illustrates the three possible detection
probability profile combinations of "Hits" and "Correct
rejections" from two sensors having circular detection
probability profiles;
Figure 8 is a block diagram showing an apparatus for
providing an estimated position signal; and
Figure 9 is a flowchart showing an embodiment for
estimating a position of the target in the case where a
loss of contact of a target is detected for a given
sensor.
=It will be noted that throughout the appended drawings,
like features are identified by like reference numerals.
- 8 -
CA 02592047 2007-06-13
WO 2006/076798 PCT/CA2006/000056
DETAILED DESCRIPTION OF THE PREFERRED EMBODIMENT
Now referring to Fig. 1, there is shown an embodiment for
estimating a position of 'a target of interest using a
plurality of sensors.
According to step 10, for each sensor, a corresponding
detection probability profile and a detection status are
received. In one embodiment, the corresponding detection
probability profile comprises a 3-dimensional distribution
defining the sensor's possible detection envelope and a
computed probability of detection of the target of
interest corresponding to each region of the envelope.
It will be appreciated that a three-dimensional Detection-
Probability Profile (DPP) is used for each sensor of the
plurality of sensors and time-based function that
determines the change of this profile with time, if
applicable.
For example, it is known to a skilled addressee that a
vertical dipole radio antenna exhibits a roughly circular
detection probability profile, with an inverse-square law
governing the drop-off in detection probability with
increasing distance from the antenna. More complex
antennas exhibit Cardioid or other detection probability
profiles, familiar to those versed in the art.
The detection probability profile in the dipole case is
time-invariant, as the detection probability is not
inherently affected by time. Conversely, a simple radar
system has a time-dependent.detection probability profile
uncertainty generated by any uncompensated target motion
between radar sweeps. The time function in this case would
be a saw-tooth, with a small but steadily increasing error
which returns to its minimum bounded value with each
- 9 -
CA 02592047 2007-06-13
WO 2006/076798 PCT/CA2006/000056
successive hit. An extreme example of the time function
would be a satellite detection of a moving target-of-
interest. The satellite provides a very precise estimate
of the position of a target-of-interest during its over-
flight, but the relatively long revisit time results in a
sizeable error accumulating between passes, to the extent
that the target may actually be lost. All electronic,
optical, acoustic, and similar sensors possess such
detection, characteristics, with the time function
accounting for any staleness of the sensor's information.
The detection probability profiles shown in Figures 3 to 7
are for illustrative purposes and are not intended to be
an exhaustive list of all possible profiles.
The figures indicate two-dimensional detection probability
profiles with the shading indicating the probability at
each point in the detection probability profile. They
comprise "before" and "after" snapshots for each profile,
with the latter indicating the dilation of the probability
distribution (i.e. increasing positional uncertainty) with
the passage of time since the last sensor "hit" or
"correct rejection". For clarification, Figures 3 - 6
include a sample probability distribution across the
cross-section of the detection probability profile. The
detection probability profiles can extend to three
dimensions, and every point in the detection probability
profile would still have an associated probability,
although this cannot be easily portrayed graphically.
Referring now to Figure 3, there is illustrated a common
and representative detection probability profile
comprising a circular normally-distributed pattern 30,
centered around the position of the sensor at an instant
TO. Figure 3 further shows a circular normally-distributed
- 10 -
CA 02592047 2007-06-13
WO 2006/076798 PCT/CA2006/000056
pattern 32, centered around the position of the sensor at
an instant T1. Such a distribution may be representative
of a vertical dipole radio antenna.
Referring now to Figure 4, there is shown a normally-
distributed detection probability profile 40 at an instant
TO centered on a linear sensor pattern. Figure 4 further
shows a normally-distributed detection probability profile
42 at instant T1. Such a distribution may be
representative of a satellite ground swath for example.
Similarly, Figure 5 illustrates a normally-distributed
detection probability profile 50 at an instant TO centered
on a radial from an angular sensor. Figure 5 further shows
a normally-distributed detection probability profile 52 at
an instant T1. Such a distribution may be representative
of a directional microphone.
Finally, Figure 6 shows a annular detection probability
profile pattern 60 at an instant TO centered on a radial
from an angular sensor. Figure 6 further shows a annular
detection probability profile pattern.62 at an instant T1.
Such distribution would be representative of multi-modal
HF radio transmissions, or multi-modal acoustic
transmissions through water.
In one embodiment, the corresponding detection probability
profile is received from a plurality of sensors tracking a
target. Still in one embodiment, the detection status is
obtained from each of the plurality of sensors tracking
the target.
Now returning to Figure 1 and according to step 12, the
received corresponding probability profiles are combined
to generate a global detection probability profile.
- 11 -
CA 02592047 2007-06-13
WO 2006/076798 PCT/CA2006/000056
It will be appreciated that each individual time-corrected
detection probability profile from each serviceable sensor
is combined whether it has contact with the target-of-
interest or not, to generate a composite detection
probability profile from all of the available sensors. It
will be appreciated that each individual detection
probability profile is adjusted for the appropriate
characteristics of the individual sensor, and the time
since the sensor last had a detection ("Hit"). It will be
further appreciated that the detection probability profile
of a serviceable sensor without a "Hit" is assumed to be a
"Correct rejection", and the sensor's detection
probability profile is subtracted, rather than added,
before being incorporated into the final solution.
It will be appreciated that a simple analogy of this
situation would be the visual determination of the number
on the hidden face of a die, once it has been cast.
Assuming that the hidden number is a two and that the die
is unbiased, the detection probability profile of each
possible outcome is 1/6 with no time dependence. If each
of the five visible faces were to be examined by the eye
sensor, and the detection probability profile of each of
these "not two" outcomes combined, this would lead to a
100% probability of correctly determining the invisible
"two" outcome, even though the eye sensor never directly
detected the "two" target-of-interest. In other words, the
five "Correct rejections" led directly to a "Hit", even
though no sensor actually experienced a"Hit" on the "two"
target-of-interest. This simplistic analogy may be
extended to much more complex detection probability
profiles with time histories. In fact, as the number of
sensors becomes large, the final (or global) detection_
probability profile can be approximated by simple addition
- 12 -
CA 02592047 2007-06-13
WO 2006/076798 PCT/CA2006/000056
or subtraction of the overlapping weighted detection
probability profile values at each point. A more complex
example of this method would be the determination of the
location of a High Frequency (HF) radio transmitter using
numerous non-directibnal receivers with simple ''Hit"
detectors. One versed in the art will be well aware that
HF transmissions exhibit complex annular detection
probability profiles that are strongly dependent on
atmospheric and ionospheric conditions and the time of
day. Nevertheless, these time dependent transmission
characteristics are routinely characterized and forecast,
with considerable accuracy. Accordingly, the best estimate
of the target-of-interest transmitter's location can be
obtained by overlaying the detection probability profiles
of the "Hit" receivers and subtracting the weighted
detection probability profiles of the "no-contact"
receivers (which are assumed to be "Correct Rejections"),
to yield a detection probability profile, or probability
map, of the best estimate of the target-of-interest's
location.
V1hen a large number of sensors is used, a useful
approximation for the probability of a target-of-interest
detection at a specific point may be achieved by ~eighting
and numerically summing the detection probability profiles
at that point, although this simplification does not
preclude the rigorous application of probability theory
where warranted. iThe methods for combining probabilities
are well known to those skilled in the art, and will not
be repeated here. Graphically, the combination of the
detection probability profiles can be visualized by the
superimposition of the individual detection probability
profile patterns. The key feature of the detection
probability profile combination is that serviceable
- 13 -
CA 02592047 2007-06-13
WO 2006/076798 PCT/CA2006/000056
sensors that do not have a "Hit" are assumed to have a
"Correct rejection" and their detection probability
profile profiles are subtracted from thetotal detection
probability profile field.
For instance, Figure 7 illustrates the three possible
detection probability profile combinations of "Hits" and
"Correct Rejections" from two sensors with circular
detection probability profiles. These are: "Hit"/"Hit";
"Hit"/"Correct rejection"; "Correct rejection"/ "Correct
rejection". The mid-grey background shading in the
rectangles in Figure 7 reflects the "Neutral" probability
state of the system, where no sensor coverage exists. The
shaded sensor circles illustrate either a "Hit" (lighter
than neutral shading) or a "Correct Rejection" (darker
than neutral shading). The overlap area in the Venn
diagrams indicates the combination. of the detection
probability profiles (DPP).
It will be noted that the combined detection probability
profiles can reinforce or negate the information from the
individual sensors, as shown below:
Figure Sensor 1 Sensor 2
7 DPP DPP Consolidated DPP
Example
= Strong CR in area of
a. Correct Correct overlap
rejection rejection = Mild CR elsewhere in
circles
= Neutral outside circles
= Approximately neutral
b. Correct Hit in area of overlap
rejection = Hit in right partial
circle
= CR on left partial
circle.
= Neutral outside circles
= Strong hit in overlap
- 14 -
CA 02592047 2007-06-13
WO 2006/076798 PCT/CA2006/000056
c. Hit Hit region
= Hit elsewhere in
circles
= Neutral outside circles
The same methodology may be applied for any number of
sensors, and the resulting detection probability profile
would be computed numerically from the individual time-
variant detection probability profiles of each sensor.
The resulting detection probability profile would reflect
the system's best estimate of the target-of-interests
position.
Referring back to Fig. 1 and according to step 14, a
position of the target is estimated using the generated
global detection probability profile.
Now referring to Fig. 2, there is shown an embodiment for
estimating the position of the target. using the generated
global detection probability profile.
According to step.20, a plurality of zones, each having a
given corresponding probability assigned is displayed.
According. to one embodiment, the plurality of zones is
displayed on a user interface.
According to step 22, the position is estimated using the
plurality of displayed zones.
In one embodiment, the position is estimated manually by
an operator by observing the graphic display. In another
embodiment, the position is estimated automatically using
further algorithms using additional parameters such as for
instance a possible speed of the target of interest, a
past position, etc. . which may help refine the search by
eliminating non-viable probability areas. For example,
the system may provide a global probability profile with
two equally weighted "best estimates" of the Target Of
- 15 -
CA 02592047 2007-06-13
WO 2006/076798 PCT/CA2006/000056
Interest position, but one may differ sufficiently from
the last position estimate so as to render it
"unreasonable," and hence cause it to be rejected by the
processor. The skilled addressee will appreciate that the
additional parameters, such as maximum attainable
velocity, will usually be dependent on the given target of
interest.
In fact, a gain control mechanism is preferably used for
estimating the position of the target.
The manual and automatic gain controls are used to
optimize the appearance of the global detection
probability profile from the combined sensors. The global
detection probability profile is the pattern that results
when the time-variant detection probability profiles from
each sensor are numerically combined. The result is a
graphical representation of detection probability profile
levels, similar to a terrain contour map. The operator is
primarily interested in the highest detection probability
profile values corresponding to the peak probabilities of
the location of the target-of-interest. This is analogous
to searching for the mountain peaks on! the contour map.
Unfortunately, such peaks might correspond, in some cases,
to a single pixel on a.display, which would effectively
render the highest probability region invisible to the
operator. Conversely, for a global detection probability
profile equivalent to gently rolling terrain, the operator
would be faced with wide zones of "peak" detection
probability profile, which would have little use for
locating the target-of-interest. Both of these problems
are addressed by the gain controls.
The gain control serves three functions. Firstly, it
groups the continuously-variable detection probability
- 16 -
CA 02592047 2007-06-13
WO 2006/076798 PCT/CA2006/000056
profile values into discreet contour bands, equivalent to
contour lines on a topographical map. Secondly, the gain
control determines the scaling for each resulting band.
Thirdly, the gain control automatically controls (AGC) or
manually (MGC), how many of the resulting bands are shown
on the display. Continuing with the topographical analogy
above, the automatic mode of the gain control would
display only the highest probability band, giving the best
indication of the position of the target-of-interest.
The manual gain control allows manual control of the
display of different probability levels, ranging from only
the highest band being displayed to all bands displayed.
It will be appreciated that the mechanization and
functioning of gain controls is well known to the ones
skilled in the art.
It will be further appreciated that the method described
below uses time-variant multi-sensor data to approximate
the correct "Hit"/"Correct rejection" distribution while
minimizing the "Misses" and "False Alarms".
It will be further appreciated that sensor signal
characteristics are used to determine the location of a
target-of-interest using both "Hit" and "Correct
rejection" information. Simply stated, the algorithm
incorporates the heretofore unused "where the target
isn't" information to help determine "where the target
is." This is done by applying weighted probabilities from
each sensor, accounting for both "Hit" and "Correct
rejection" information, to determine the highest-
probability locus for the actual target position. It will
be further appreciated that no distinction is made between
"Hit" and "False Alarm" data, or "Miss" and "Correct
Rejection" data, from a single sensor. They are simply
- 17 -
CA 02592047 2007-06-13
WO 2006/076798 PCT/CA2006/000056
categorized as "Hit" or "Correct Rejections" respectively,
as long as the sensor is known to be serviceable. When
sensors with overlapping coverage are trained on a target-
of-interest, the "Hit" and "Correct rejection" data are
refined and the "Miss" and "False alarm" percentages are
reduced.
Now referring to Fig. 8, there is shown an embodiment of
an apparatus 79 for providing an estimated position
signal.
The apparatus 79 comprises a detection probability profile
providing unit 80, a processing unit 82 and a position
estimation unit 84.
The detection probability profile providing unit 80
provides a plurality of detection probability profiles
signals to the processing unit 82. In one embodiment, the
detection probability profile providing unit 80 comprises
at least one interface suitable for receiving data from a
plurality of sensors. The skilled addressee will therefore
appreciate that the detection probability profile
providing unit 80 is dependent on the plurality of sensors
used as well as the type of output available for the
sensors.
The processing unit 82 receives the plurality of detection
probability profiles signals, and combines the plurality
of detection probability profiles signals to provide a
global detection probability profile signal. More
precisely, the global detection probability profile signal
is provided to the position estimation signal 14.
It will be appreciated that the combination is performed
according to step 12 disclosed,in Fig. 1.
- 18 -
CA 02592047 2007-06-13
WO 2006/076798 PCT/CA2006/000056
The skilled addressee will understand that the type
processing unit depends on various parameters comprising
but not limited to, the number of sensor units to use, the
output bandwidth of each sensor used, etc.
Accordingly, the processing unit 12 may be one of a
dedicate~d ASIC, an FPGA, a motherboard comprising a
processor manufactured by IntelTM or the like.
The position estimation unit 84 receives the global
detection probability profile signal and estimates a
position for the target of interest corresponding to the
highest probability region(s) in the generated global
probability profile and provides a corresponding estimated
position signal.
It will be appreciated that in one embodiment, the
position estimation unit comprises a processing unit, a
display unit and a user interface, not shown in the
figures, in the case where an operator is used to assist
the detecting of the estimated position signal.
Now referring to Fig. 9, there is shown an alternative
embodiment for estimating a position of the target in the
case where a loss of contact of a target is detected for a
given sensor.
According to step 90, a loss of contact is detected for a
given sensor. An indication of the loss of contact is
provided by the detection probability profile providing
unit 80 shown in Fig. 8 for a corresponding sensor in one
embodiment. The skilled addressee will appreciated that
the loss of contact may be the results of various events
comprising but not limited to a failure of the sensor, the
- 19 -
CA 02592047 2007-06-13
WO 2006/076798 PCT/CA2006/000056
target of interest leaving a detection zone covered by the
sensor, etc.
According to step 92, ' a corresponding detection
probability profile is estimated for the given sensor.
The detection probability profile is estimated using a
target-sensor velocity compensation.
More precisely, such compensation is automatically
performed for each sensor in the following manner: all
sensors respond to a "Hit" by displaying the appropriate
detection probability profile, which represents the total
uncertainty of the target-of-interest's position at the
time of the "Hit". Once the sensor loses contact, the
detection probability profile is expanded outwards at a
rate corresponding to the geometric combination of the
estimated target and sensor speeds, to account for the
increasing positional uncertainty since the last "Hit".
For example: in the simplest case, a fixed-position highly
accurate sensor would exhibit a detection probability
profile approximating a point in space when experiencing a
"Hit". Once the signal is lost, the detection probability
profile expands in a circular pattern to reflect the
possible range of motion of the target. The resulting
detection probability profile still represents valuable
information about the target's location, particularly in
the periods soon after the signal is first lost.
Eventually, the detection probability profile distribution
is sufficiently diluted that the detection probability
profile effectively blends into the background noise, so
the sensor reverts to the normal additive mode for
detection probability profile combination (i.e., its
detection probability profile is either added or
- 20 -
CA 02592047 2007-06-13
WO 2006/076798 PCT/CA2006/000056
subtracted from the total field, depending on whether it
is in contact with the target-of-interest or not).
It will be appreciated by the skilled addressee that each
individual sensor may have its own time-dilution
properties, depending on the characteristic of the sensor
and the maximum velocity of the target. In other words,
the detection probability profile expands so that the
target should lie within an area bounded by the original
detection probability profile which reflects sensor's
current accuracy bounds, expanded by the target's
estimated displacement since the last "Hit".
According to step 94, a corresponding probability profile
is received for other sensors.
According to step 96, the received corresponding
probability profile is combined to generate a global
detection probability profile.
According to step 98, a position of a target is estimated
using the generated global detection probability profile.
It will be appreciated that a characteristic of the method
disclosed above is the use of weighted non-detection
information and multiple-independent-detection information
as a means to refine the position solution.
The skilled addressee will appreciate that such method may
be used to find the position/tracking the position of a
target of interest which may be anyone of a moving vessel
such as a submarine, an aircraft, a tank, an
Intercontinental ballistic missile (ICBM) or the like.
While illustrated in the block diagrams as groups of
discrete components communicating with each o- ther via
- 21 -
CA 02592047 2007-06-13
WO 2006/076798 PCT/CA2006/000056
distinct data signal connections, it will be understood by
those skilled in the art that the preferred embodiments
are provided by a combination of hardware and software
components, with some components being implemented by a
given function or operation of a hardware or software
system, and many of the data paths illustrated being
implemented by data communication within a computer
application or operating system. The structure illustrated
is thus provided for efficiency of teaching the present
preferred embodiment.
It should be noted that the present invention can be
carried out as a method, can be embodied in a system, a
computer readable medium or an electrical or electro-
magnetic signal.
The embodiments o'f the invention described above are
intended to be exemplary only. The scope of the invention
is therefore intended to be limited solely by the scope of
the appended claims.
- 22 -