Note: Descriptions are shown in the official language in which they were submitted.
CA 02594237 2007-06-29
WO 2006/069444
PCT/CA2005/001968
14568-38
METHOD FOR IMPROVING FLUORESCENCE IMAGE
CONTRAST
CROSS-REFERENCE TO RELATED APPLICATIONS
This application claims priority from United States provisional
application no. 11/024,826 filed december 30, 2004 and entitled" METHOD
FOR IMPROVING FLUORESCENCE IMAGE CONTRAST".
TECHNICAL FIELD
The present invention relates to a method for reducing and/or
eliminating unwanted fluorescence signals in optical images based on
fluorescence lifetime of fluorophores.
BACKGROUND OF THE INVENTION
The monitoring of pharmacokinetics, genetic, cellular, molecular or
other types of events in vivo is of great interest to monitor drug or gene
therapy efficacy as well as disease status or progression in small
laboratory mammals and in the human body. In this respect, fluorescence
imaging, both in vitro and in vivo, has been used extensively to generate
anatomical and functional information from within cells and organisms.
Fluorescence imaging of internal parts of animals (including
humans) for anatomical or functional purposes often involves the injection
of an extrinsic fluorophore, typically chemically coupled with another
molecule, that distributes within the animal and accumulates preferentially
in cells and organs of interest. Images are then acquired by detecting the
fluorescence and mapping the signal relative to the anatomy of the animal.
However, the excitation and emission spectra of such extrinsic
fluorophores often overlap with those of intrinsic fluorophores such that the
fluorescence signal is a combination of the signals from each fluorophore.
Furthermore, such studies are often conducted using more than one
CA 02594237 2007-06-29
WO 2006/069444
PCT/CA2005/001968
14568-38
- 2 --
extrinsic fluorophores which may have overlapping spectra. As a result,
fluorescence images often contain undesirable signals that obscure the
signal from the fluorophore of interest.
Methods commonly used to attenuate or eliminate unwanted
fluorescence signals are based on spectral differences of the fluorescence
emission, fluorescence lifetime differences (e.g. FLIM), or frequency
domain hardware techniques. All of them have limitations. Methods based
on spectral difference are limited to fluorophores having emission spectra
that do not significantly overlap thereby allowing acquisition of fluorescence
at a non-overlapping wavelength which is specific for a particular
fluorophore. Methods based on fluorescence lifetime help distinguish
signals from different fluorophores but do not retain the information related
to fluorophore intensity and consequently information related to
concentration of the fluorophore is lost. Frequency domain hardware
techniques require multiple image acquisition at a plurality of phase delays
to suppress unwanted fluorescence and are therefore time consuming.
Accordingly, it would be desirable to be provided with a fluorescence
imaging method overcoming the above-mentioned deficiencies.
SUMMARY OF THE INVENTION
The present invention provides an improved method for enhancing
contrast and specificity of fluorescence images of an object, such as a
biological tissue, by selectively eliminating or reducing unwanted
,
fluorescence from fluorophores other than the fluorophore of interest. The
method is based on the generation of intensity images weighted as a
function of measured lifetime in which the intensity information is
conserved and hence information related to the concentration of the
fluorophore of interest.
Thus in one embodiment there is provided a method for optical
imaging of an object containing two or more fluorophore species in which a
CA 02594237 2007-06-29
WO 2006/069444
PCT/CA2005/001968
14568-38
- 3 -
fluorescence signal is acquired, using time domain or frequency domain,
for one or more region of interest (ROI) of the object using an excitation
and an emission wavelength compatible with detection of at least one of
the two or more fluorophore species. A fluorescence intensity and a
fluorescence lifetime are calculated from the fluorescence signals for each
of the pixels and the fluorescence intensity is multiplied by a weighting
factor. The weighting factor is a function of the calculated fluorescence
lifetime and one or more predetermined fluorescence lifetime of the
fluorophore species and is used to generate a weighted fluorescence
intensity for each pixel of the ROI from which a weighted fluorescence
intensity image can be obtained.
In a further embodiment, the method also provides for an adjustment
of the fluorescence intensity to account for the relative contribution of each
fluorophore. Thus when the fluorescence signal comprises contribution
from two or more fluorophore species a contribution fraction is derived for
at least one of the fluorophore species and the weighted fluorescence
intensity is multiplied by the contribution fraction. The contribution
fraction
can be determined, for example, by fitting a temporal point spread function
(TPSF) of the fluorescence signal with a sum of exponential decays.
In yet a further embodiment, the method provides for a primary
weighting step which can substantially reduce background fluorescence
signal from intrinsic fluorophore species. Thus the fluorescence intensity
signal can be multiplied by a primary weighting factor prior to the step of
multiplying the fluorescence intensity by a weighting factor, the primary
weighting factor being a function of the calculated fluorescence lifetime and
two predetermined fluorescence lifetimes of two or more fluorophore
species that are being imaged.
CA 02594237 2007-06-29
WO 2006/069444
PCT/CA2005/001968
14568-38
- 4 -
BRIEF DESCRIPTION OF THE DRAWINGS
Further features and advantages of the present invention will
become apparent from the following detailed description, taken in
combination with the appended drawings, in which:
FIG. 1A is a schematic representation of the generation of an
intensity image from fluorescence signal from a region of interest (ROI)of
an object;
FIG. 1B is a schematic representation of the generation of a lifetime
image from fluorescence signal from a region of interest (ROI)of an object;
FIG. 2 is a flow chart of an embodiment of the invention in which a
weighted intensity image is obtained from a raw intensity image;
FIG. 3 is a flow chart of an embodiment of the invention in which a
contribution fraction adjusted weighted intensity image is obtained from a
raw intensity image;
FIG. 4 is a flow chart of an embodiment of the invention in which a
primary weighting is applied to the raw intensity image;
FIG. 5 (a-i) is a raw fluorescence intensity (integration over time of
the TPSF in each pixel) image of a [55%:45%] mixture of two fluorophore
species namely Cy 5.5 and Atto 680;
FIG. 5 (a-ii) is an effective lifetime image generated by fitting the
fluorescence TPSF from the dual-dye mixture in each pixel with a mono-
exponential decay model.
FIG. 5 (a-iii) exhibits a processed intensity image (/,,e,, ) obtained by
performing a preliminary weighting on the raw intensity image FIG. 1 (a-i);
CA 02594237 2007-06-29
WO 2006/069444
PCT/CA2005/001968
14568-38
- 5 -
FIG. 5 (b-i) exhibits a fluorescence lifetime image of Cy5.5
calculated by dual exponential-decay fitting of the fluorescence TPSF of
the dual-dye mixture in each pixel;
FIG. 5 (b-ii) exhibits an intensity fraction image of Cy 5.5 calculated
by dual exponential-decay fitting of the fluorescence TPSF of the dual-dye
mixture in each pixel;
FIG. 5 (b-iii) exhibits a weighted fluorescence intensity image (AO
of Cy 5.5 obtained by the method of the invention; At each pixel, the
fluorescence intensity is related to the concentration of Cy5.5 at that
location;
FIG. 5 (c-i) exhibits a fluorescence lifetime image of Atto680
calculated by dual exponential-decay fitting of the fluorescence TPSF of
the dual-dye mixture in each pixel;
FIG. 5 (c-ii) exhibits an intensity fraction image of Atto680 calculated
by dual exponential-decay fitting of the fluorescence TPSF of the dual-dye
mixture in each pixel;
FIG. 5 (c-iii) exhibits a weighted fluorescence intensity image (I2)
of Atto680 obtained by the method of the invention; At each pixel, the
fluorescence intensity is related to the concentration of Atto680 at that
location;
FIG. 6(i) is a raw fluorescence intensity (integration over time of the
TPSF in each pixel) image of Cy 5.5 and Atto680; On the left is Atto680;
On the right is Cy5.5; One can not distinguish the fluorescence by
fluorescence intensity only;
FIG. 6(ii) is a fluorescence lifetime image of the fluorophores
Atto680 and Cy5.5; One can distinguish the two fluorophores by their
fluorescence lifetime; This is the mechanism behind the fluorescence
CA 02594237 2007-06-29
WO 2006/069444
PCT/CA2005/001968
14568-38
- 6 -
lifetime image; However, fluorescence intensity (and thus concentration)
information is lost in this image;
FIG. 6(iii) is a fluorescence intensity image of Cy5.5 extracted from
FIG. 6(i) using the method of the invention; and
FIG. 6(iv) is a fluorescence intensity image of Atto 680 extracted
from FIG. 6(i) using the method of the invention.
It will be noted that throughout the appended drawings, like features
are identified by like reference numerals.
DETAILED DESCRIPTION OF THE PREFERRED EMBODIMENT
The present invention provides an improved method for enhancing
fluorescence images of an object, such as a biological tissue, by selectively
eliminating or reducing unwanted fluorescence from fluorophores other
than the fluorophore of interest. The method is based on the measurement
of the fluorescence intensity and lifetime of fluorophores. The resulting
image preserves information related to the fluorescence intensity (and thus
the concentration) of the fluorophore of interest. It will be appreciated that
the method may be applied to different techniques such as optical imaging,
time-resolved fluorescence microscopy and the like.
In the present disclosure by fluorophore species it is meant
fluorophores having different fluorescence lifetime. Thus fluorophore
species may refer to different fluorescent molecules but it may also refer to
the same fluorescent molecule in different environments with each
environment conferring the fluorophore a different fluorescence lifetime.
For example, conditions such as pH, viscosity, temperature and the like are
known to affect the lifetime of fluorophores. The environment may also
refer to the molecular environment of the fluorophore. For example a
fluorophore that is free typically exhibits a different lifetime than the same
fluorophore bound to another molecule. The term fluorophore may refer to
CA 02594237 2013-08-14
WO 2006/069444
PCT/CA2005/001968
- 7 -
small molecules or to macromolecules such as proteins that may comprise
molecular electronic configurations capable of emitting fluorescent light
when excited.
In one embodiment of the present invention the lifetime of a
fluorophore species and intensity of the fluorescence are obtained using
time domain (TD) imaging device. A time resolved fluorescence image can
be obtained by exciting a fluorophore of interest with a pulsed light source
at
a fluorescence excitation wavelength and by collecting the fluorescence
signal at a fluorescence emission wavelength using a time-resolved photo
detector. The pulsed light source can be any type of pulsed laser (e.g. diode
laser, solid state laser, gas laser etc.) or other pulsed light sources (e.g.
pulsed lamp). The time-resolved photo detector can be, for example, a
photo multiplier tube (PMT)/avalanche photodiodes (APD)/PIN coupled with
time correlated single photon counting (TCSPC), a streak camera, or a
gated intensified charged coupled device (ICCD).
The fluorescence image can be generated by direct imaging of the
fluorescent object using a camera or by raster scanning the fluorescent
object using a point detector and reconstructing the image using information
from each detection point (pixel). An example of the latter modality is
employed by the eXplore Optixtm imager described in international patent
application WO 2004/044562 Al.
While the embodiments of the invention will be described using time
domain as an exemplary modality of data acquisition, it will be appreciated
that the method of the invention may also be applied using frequency
domain data acquisition. In frequency domain, one can obtain fluorescence
intensity and lifetime by measuring the change of modulation depth and the
phase shift of fluorescence signal relative to the excitation light signal.
Such
measurements are well known in the art (Hawrysz and Sevick-Muraca,
REPLACEMENT SHEET
4253753.1
CA 02594237 2013-08-14
WO 2006/069444
PCT/CA2005/001968
- 8 -
Neoplasia vol.2 (5), 2000 p.388-417).
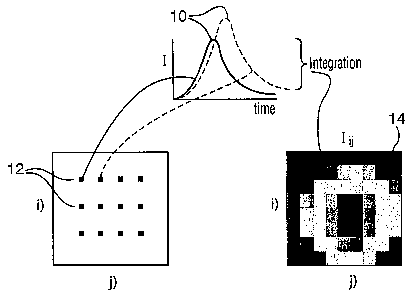
As shown in figure 1A, each signal acquisition corresponds to a
temporal point spread function (TPSF, denoted as I(t)) 10 of the
fluorescence signal emitted by the object at a specific detection point 12. By
time integrating, either completely or partially, the TPSF at each pixel k(t),
one can get a CW fluorescence intensity image 14, denoted by Pt/if which
can provide information on the concentration. Furthermore, by
mathematically fitting hit), one can obtain the fluorescence lifetime which
can be used to generate a lifetime image 18, denoted by ; (figure 1B). If the
fluorescence signal is from more than one fluorophore species, a multi-
exponential decay model can be used to fit the /y(t) and to derive lifetimes
for
each fluorophore species and contribution fractions of the species.
In most practical cases a TPSF measured at a given point is usually
composed of several exponential decays due to the various endogenous
and exogenous fluorophore species present in the system. The measured
TPSF may then be written as
I, (t) a: exp(-4 / Eq.(1)
where index k represents the kth component (fluorophore species)
considered in the n-component analysis, alµi, represents the amplitude of the
kth component at t=0. The meaning of the parameter *04 is different for a
mixture of fluorophores than for one fluorophore displaying a complex
decay. For the latter case, it is generally safe to assume that a* values
represent the fraction of the molecules in each conformation at t=0, which
corresponds to the ground state equilibrium.
REPLACEMENT SHEET
4253753.1
CA 02594237 2007-06-29
WO 2006/069444
PCT/CA2005/001968
14568-38
- 9 -
The meaning of ak is more complex for a mixture of fluorophores. In
this case, the relative ak values depend on many factors, i.e. quantum
yield, concentration, extinction coefficient, excitation and emission spectra,
filter characteristics, system optical components, etc. In general, the
fluorescence signal of single fluorophore with monoexponential intensity
decay can be written as
Fk(t)= Cc = sk .Mk Qk (A). Kk n =
(A) S(A) = /1,(A,t) 0 IRF (t)C) D(2õt) 0 exp(-t/rk)
Eq. (2)
In the expression, Ck is molar concentration, Ek(A) is molar
extinction coefficient, Mk is fluorophore dimension, Qk (A) is quantum
yield, Kk (A) is a factor related to the fluorophore excitation and emission
spectrum as well as the excitation laser wavelength and the system
fluorescence filters, S(A) is a factor related to the instrument, e.g.
spectral
response, I (A.,t) is the excitation laser, IRF (t) is the system impulse
response function, and D(X,t) is the time delay and amplitude attenuation
caused by light diffusion if the fluorophore is in turbid medium, 0 denotes
convolution. Here we assume that the light diffusion and system response
are independent of fluorophore, that is true for most applications. The
fluorescence signal of a mixture of several fluorophores is
F (t) =IFk(t) Eq. (3)
By comparing equation 3 to equation 1, one can obtain the meaning
of a'
a k cc ck Ek (A). mk Qk (A) Kk (A) Eq.( 4)
Irrespective of whether the multiexponential decay originates with a
single fluorophore or multiple fluorophores, the values of a jk and rik can be
CA 02594237 2007-06-29
WO 2006/069444
PCT/CA2005/001968
14568-38
- 10 -
used to determine the fraction ( fuk'cw ) contribution of each decay time to
the steady-state (CVV) intensity
õõ akrk
f k,Cky = ____________________________________________________________ Eq.
(5)
aktk
IiJu
The fraction contribution (f) which is proportional to concentration
can be calculated by normalizing a vic
ak
k _____________________________
= ak Eq.
(6)
Generally, curve fitting methods are required to resolve the
measured fluorescent signal into its component constituents. In time
domain, by convolving the system Impulse Response Function IRF(t) with
the modeled fluorescent decays of the components, a calculated signal
Fe(t) is compared to the measured fluorescent signal Fõ,(t). With the use
of numerical curve fitting methods, estimates of the lifetimes and/or relative
fractional contribution of each of the n components can be obtained. For
example, in least squares analysis, a and rik are obtained by minimizing
the goodness-of-fit parameter
2 1 1
v 0,12 [Fm (t/ c (ti
?CR = - F Eq. (7)
Where the sum extends over the number (L) of channels or data
points, and al is the standard deviation of each data point, v is the
number of degrees of freedom.
In frequency domain, the measurable are phase shift Ow and
modulation depth ma, at frequency w. The calculated values are
CA 02594237 2007-06-29
WO 2006/069444
PCT/CA2005/001968
14568-38
- 11 -4),. = arctan(N. Eq. (8)
in. = VN.2 402 Eq. (9)
In the expressions, Ac and D. are the sine and cosine transform of
the fluorescent signal predicted by model. For a simple sum of several
exponential decays like equation 1 N. and D. have simple forms
N. = a h co(rk )2 /akrk
0. 4. cow )2) Eq. (10)
= (l (rk __ )2) a T Eq.
(11)
In least squares data analysis, the parameters (auk and .r.k ) are
varied to yield the best fit between the data and the calculated values, as
indicated by a minimum value for the goodness-of-fit parameter
2 2
x2 =1\1 rw ¨001 + 1 NI rino) Ma) 1 Eq. (12)
R 1 / 4, / 1/44 sin .1
where v is the number of degrees of freedom, and (50 and (5m are the
uncertainties in the phase and modulation values, respectively.
Referring to figure 2 and assuming that the fluorophore species of
interest (i.e. from which the image is to be reconstructed) has a
fluorescence lifetime v, the intensity image 14 can be multiplied at 20 by a
weighting factor which is a function of the fluorescence lifetime C. and the
measured (effective) fluorescence lifetime T. j used to generate a weighted
fluorescence intensity image at 22 which is representative of the
distribution and the concentration of the fluorophore species of interest.
CA 02594237 2007-06-29
WO 2006/069444
PCT/CA2005/001968
14568-38
- 12 -
In one embodiment, the weighting factor is determined by an
Indicator (or Red) function defined by a range of user determined lifetimes
that encompasses the measured lifetime z at a particular pixel. Pixels
exhibiting lifetimes outside the predetermined range can be weighted
accordingly or simply eliminated.
In a preferred embodiment the error At derived from the fitting of
the TPSF to calculate the effective lifetime can be used to determine the
range. Thus one can generate a logical image map L by the following
criteria:
L =
Eq. (13)
u
0 otherwise
By element-wise multiplying this matrix to the raw intensity image
one could get a weighted intensity image /,õ , in which unwanted
fluorescence and/or noise are suppressed. It will be noted that this
treatment of the fluorescence signal retains the intensity information of the
fluorescence signal.
In the case where two (or more) fluorophore species are contributing
to the TPSF, one can obtain the fluorescence lifetimes -cif and 'q (more
generally tnii, and the contribution fractions and f
j2 (more generally
fon ) where A' + 2 = 1 of the two fluorophores by fitting the TPSF when
using a dual exponential decay model.
Referring now to figure 3, by element-wise multiplying matrix A; to
at 30, one can get a new intensity image In w at 32, which is
proportional to the intensity of fluorophore species n. If only 2 fluorophore
CA 02594237 2007-06-29
WO 2006/069444
PCT/CA2005/001968
14568-38
- 13 -
species are present image /2w can be obtained by the method
summarized in figure 3 or by simply subtracting Pw from In,. It will be
appreciated that the contribution fractions can be multiplied to the raw
intensity image I before performing the weighting step.
Referring now to figure 4, it may be advantageous to "clean" the
intensity image, prior to weighting, by performing a preliminary weighting at
40 based on the lifetimes of at least two fluorophore species. For example,
in an object comprising two fluorophore species with fluorescence lifetimes
r and r2) and where r1 <r21 then the measured fluorescence lifetime r
satisfies rl <r <-r. if a single exponential decay model is used. Further
assuming the fitting error is M, then one can generate a logical image
map by the following criteria
L. = 1 if - Ar <71(/< r2 + At
Eq. (14)
0 otherwise
By element-wise multiplying this matrix to the intensity image I,
one can generate a new intensity image /new at 42 which is background
suppressed. The background may comprise, for example, fluorescence
from intrinsic molecules. /new can then be used in the process described in
figures 2 and 3 to obtain In,, I, etc.
It will be appreciated that the method described above can be
extended to multi-fluorophore species using a multi-exponential decay
model for fluorescence lifetime fitting instead of dual exponential decay
model.
It will also be appreciated that the ranges of lifetime on which the
weighting is based can be defined by the user according to the desired
CA 02594237 2007-06-29
WO 2006/069444
PCT/CA2005/001968
14568-38
- 14 -
fluorescence information. In a preferred embodiment, the ranges are
defined by the expected (-re) lifetime of the fluorophore species.
For applications such as diagnosis and pharmacological studies, it is
often desirable to have an image that provides information on the
concentration and depth of the fluorophore species. However, to simply
assume that the fluorescence intensity signal is proportional to the
flurophore concentration can be misleading since the depth, lifetime,
fluorescence spectrum of the flurophore and characteristics of the
instrument, as well as light diffusion of tissue will also impact the
fluorescence intensity signal. Thus to generate an image that reflects the
concentration of the fluorophore species all these factors and the
propagation loss of the fluorescence due to tissue absorption and
scattering should be taken in consideration. An example of concentration
determination is provided below.
EXAMPLES
Example 1
Equal volumes of 50 nM Cy5.5 and 150 nM Atto680 were mixed
together. Fluorescence signal was obtained using eXplore Optixtm with a
pulsed diode laser wavelength at 666 nm as the excitation light source.
When the quantum yield, extinction coefficient, and fluorescence spectrum
and filter window information are taken into account, the fluorescence
signal ratio of Cy5.5 and Atto680 from the mixture is about 0.55:0.45.
Figure 5 illustrates the method described above. Panel(a-i) is a raw
fluorescence intensity image of the Cy 5.5 and Atto 680 mixture. A lifetime
image (panel (a-ii)) was generated using an effective lifetime (fitting the
TPSF with a single exponential). Panel (a-iii) exhibits a processed intensity
image (/) obtained by performing a preliminary weighting on the raw
intensity image. Because only Cy5.5 and Atto 680 are present there is no
difference between the raw image and processed image (no background
CA 02594237 2007-06-29
WO 2006/069444
PCT/CA2005/001968
14568-38
- 15 -
fluorescence). Panels(b-i) and (c-i) exhibit lifetime images based on the
lifetime of one fluorophore species only after dual exponential fitting of the
TPSF. Panels (b-ii) and (c-ii) exhibit a contribution factor image of the
fluorophore species. Both lifetime and fraction are obtained at the same
time by direct fitting of the TPSF in each pixel using a dual exponential
decay model. Panels (b-iii) and (c-iii) exhibit a weighted fluorescence
intensity image (Põ , /2) obtained by the method described above. In the
present example the fluorescence ' intensity is proportional to the
concentration of Cy5.5 or Atto680 since both fluorophore are at the same
depth (phantom surface) and other factors are taken into account.
Example 2
One hundred nM Cy5.5 and 200 nM Atto680 solution were arranged
in two separate locations. Fluorescence signal was obtained using eXplore
Optix with a pulsed diode laser wavelength at 666 nm as the excitation light
source.
In the particular case where the location of fluorophore species
within the object are not overlapping, there is no need for multi-exponential
fitting of the TPSF and one can proceed directly with the weighting step of
the method. Figure 6 provides such an example in which the two
fluorophores species do not overlap. Panel (i) of figure 6 is a measured raw
fluorescence intensity image with two fluorophore species, Atto 680 on the
left and Cy5.5 on the right. From the intensity image alone, without knowing
a priori where the fluorophores are located, one would not be able to
identify the fluorophores species. Panel (ii) is the corresponding
fluorescence lifetime image obtained by fitting the TPSF of each pixel with
a single exponential decay model. While the lifetime image enables the
determination of the species of the fluorophore if the lifetimes are known a
priori, it does not convey any intensity information. However, when the
method of the present invention is used the intensity information is
CA 02594237 2007-06-29
WO 2006/069444
PCT/CA2005/001968
14568-38
- 16 -
preserved. Thus in the example provided below the weighting function was
based on a range of lifetimes determined to be between 0.9 and 1.05 ns for
Cy 5.5 and 1.7 and 1.83 ns for Atto 680. Using the criteria:
= {01 if 0.9 < T., <1.05
otherwise
for Cy 5.5 one obtains the image displayed in panel (iii) and
L 1 if 1.7<r, <1.83
, =
{0 otherwise
for Atto 680 one obtains the image displayed in panel (iv). Both images
retain the intensity information for the fluorophore of interest. Since they
are both at the same depth (phantom surface) and have the same
dimension, the intensity is related to their concentration through lifetime
quantum yield, extinction coefficient, fluorescent spectrum, filter window,
and other known instrument parameters.
Example 3
The fluorophore species may be the same fluorophore molecule in
different environment. Thus, for example, the object may comprise one
fluorophore having a lifetime TI when it is bound to a protein and a lifetime
T2 when it is free. In this case it is possible to model the TPSF by the
following dual exponential:
fexp(-thi) (1-0 exp(-th2) (15)
where, t is the time, ti and T2 are the respective lifetimes of the bound and
free states and f is the fraction of fluorophores in the bound state:
fibound]/([bound]+[free]). The parameters in this model can then be
obtained from measured data through multi-variate curve fitting. The dual
CA 02594237 2007-06-29
WO 2006/069444
PCT/CA2005/001968
14568-38
- 17 ¨
exponential for free/bound fluorophore species can be used to obtain
weighted intensity images as described above.
Example 4
Under certain assumptions such as assuming that the optical
properties of the medium are the same at the excitation and emission
wavelength, the fluorescence intensity as a function of time can be
expressed by the Born approximation:
t \
r (rõ + rpa )2 \ --
¾
(t) QC __ s +rd v(4Dvt) _y __ p.vt e r
2e 4 Dvt * ¨ * (1RF) (16) ) 1 ' .7r
dipoles 4.7rDrsprpd T
/
/
Where:
rsp is the distance from source s (point on the object at which light is
injected) to fluorophore depth position p;
rd is the distance from fluorophore depth position p to detector d;
tta is the optical absorption coefficient;
1
D is the optical diffusion coefficient, D . ¨ where ; ils' is the
3.u.;
reduced optical scatter coefficient;
v is the speed of light in the medium;
Q is the quantum efficiency;
C is the concentration of the fluorophore;
r is the lifetime of the fluorophore;
the symbol * refers to the operation of convolution and
CA 02594237 2007-06-29
WO 2006/069444
PCT/CA2005/001968
14568-38
- 18 -
IRF is the impulse response function of the instrument used to
measure fluorescence.
By setting the first derivative of equation 6 as a function of time
equal to zero, the time position of the maximum of the TPSF (t.) can be
found. Under certain approximations (absorption is small at time shorter
than tmax, the scatter coefficient is known or can be approximated) and by
assuming that rsp is approximately equal to rpd, it is found that the
following
equation can be derived from equation 16:
dArrt
t max (17)
where d is the depth of the fluorophore object.
For a given depth, the intensity / of the emission signal detected at
the surface can be related to fluorophore concentration by the optical
properties of the medium (absorption and scattering coefficients) and the
depth of the fluorophore.
I OC Ce D (18)
Using time-domain information as described above, the depth d can
be determined. Isolating C in equation 8 and knowing signal intensity and
depth of the fluorophore, one can thus recover the concentration of
fluorophore (i.e. the amount of fluorescent molecules per unit volume)
within an accuracy that depends exponentially on the recovered depth
accuracy. Thus, in another aspect of the invention, estimates of the relative
concentration of the fluorophore, Conc.rdative, can be obtained by
determining its depth, d, and normalizing the surface intensity
measurement, /, as follows (Equation 9):
CA 02594237 2013-08-14
WO 2006/069444
PCT/CA2005/001968
- 19 -
T, To
C ne 'Re Iative = Id 2e2d V (19)
under certain assumptions, equation 19 can be derived from equation 16.
If the fluorophore objects are not at the surface of the tissue, the
method described above can be used to obtain their concentration map from
the weighted intensity image.
The embodiment(s) of the invention described above is (are)
intended to be exemplary only.
REPLACEMENT SHEET
4253753.1