Note: Descriptions are shown in the official language in which they were submitted.
CA 02596381 2007-07-30
MASS SPECTROMETRY ANALYSIS METHOD AND SYSTEM
The Invention relates to a method for analyzing a sample
containing a plurality of substances by means of mass spec-
troscopy on the sample which has been at least partially
separated in an upstream chromatograph, to a corresponding
mass spectrometry analysis system, and its use for analyz-
ing a sample containing a plurality of substances, in par-
ticular plant extracts.
Mass spectroscopy or mass spectrometry (MS) is a widely
used method for identifying substances and/or molecules in
both organic chemistry and inorganic chemistry. In mass
spectrometry, the ions are separated and recorded on the
basis of their mass/charge (m/z) ratio. The separated ions
can be recorded either on a photographic plate, or electri-
cally as an ion current. The first case is referred to as
mass spectroscopy, and the second case (which is more im-
portant for analytical chemistry) as mass spectrometry. The
equipment used is referred to in a corresponding manner as
a mass spectrograph or a mass spectrometer. In principle, a
mass spectrometer comprises three parts: a device for pro-
ducing ions ("ion source"), a separating apparatus ("ana-
lyzer") and, finally, the receiver (Faraday cage, secon-
dary-electron multiplier) for recording the ions. In addi-
tion to the electronics required, the accessories include a
data processing installation as well as pumps for the vac-
uum that is required. For clarity reasons, both mass spec-
trometry and mass spectroscopy are referred to in the fol-
lowing text by the generic expression "mass spectrometry".
CA 02596381 2007-07-30
- 2 -
=
Mass spectrometry is normally carried out in conjunction
with further analysis methods, such as gas chromatography
(GC) and liquid chromatography (LC), in order to simplify
the analysis of mass spectra by previous separation of the
sample. This results in powerful analysis equipment which,
in simple terms, simplifies the analysis by delaying the
arrival of the individual components in the mass spectrome-
ter. The numbers of molecules or molecule species and ions
which are present at the same time in the mass spectrometer
and result, for example, from ionization, rearrangement,
fragmentation reactions etc. are thus reduced, thus allow-
ing or simplifying the separation of the mass spectra and
ion intensity maxima in the time profile (peaks), and their
assignment with specific analytes (substances).
The results are normally based on the chromatographic in-
tensity maxima of the detector signal for individual ions
or for a plurality of ions (peaks) being integrated by us-
ing a predetermined method. The retention time (time from
the injection of the sample to the corresponding signal
maximum) and additional information such as the character-
istic mass spectrum of the substance, which is recorded by
the detector during the retention time, are used as crite-
ria for identifying the correct signals in the chromatogram
or mass spectra, and for assignment to the correct chemical
compounds which are reflected therein.
However, mass-spectrometric analysis of the chromatographic
results can fail if two or more components are eluted so
close to one another that their retention times scarcely
differ from one another and they therefore occur virtually
or at the same time in the mass spectrometer. Furthermore,
analysis of the results becomes difficult (if not impossi-
ble) as soon as the number of substances in the sample
CA 02596381 2007-07-30
. - 3 -
,
rises and, at the same time, the mass spectra of analytes
which have not been completely separated chromatographi-
cally differ only to a minor extent, or not at all. A
situation such as this normally arises during the analysis
of sewerage, special waste, organic and biological tissue
such as plant extract, where the sample often contains more
than 1,000 substances.
In addition, the recorded spectra are frequently "contami-
nated". By way of example, the contamination originates
from the capillary column used in the chromatograph (bleed-
ing of the column material), contamination in the ion
source and incorrect handling, that is to say decomposition
of the sample.
Programs and methods for searching libraries with reference
spectra and comparing them with the data obtained are only
of limited assistance in the situations described above.
One method that is used is the extraction of "pure" spectra
of the components contained in the mixture. One algorithm
which is normally used for this purpose comprises extrac-
tion of the spectrum in which the ion signals assigned to
that spectrum reach a maximum at the same time, that is to
say a spectrum is generated which includes only those
mass/intensity pairs whose mass/charge ratios have maxima
at or directly adjacent to the selected measurement in the
chromatogram. This algorithm is called, after its discover-
ers, the Biller-Biemann algorithm (J. Biller, K. Biemann,
Anal Letters 1974, 7, 515). Although this algorithm is sim-
ple to implement, its results provide little assistance be-
cause their resolution is inadequate.
A more powerful method is based on analyzing the shape of
the peaks, with the assumption being made that all the
CA 02596381 2007-07-30
= - 4 -
,
,
peaks which are assigned to the same components have the
same signal form (R. G. Dromey et al. Anal. Chem. 1976, 48,
1365).
One alternative method is to add peak-form analysis to the
Biller-Biemann algorithm and nevertheless to retain its
simplicity, in order to allow commercial use (B. N. Colby,
J. Am. Soc. Mass Spectrom. 1992, 3, 3558 - 3562).
These efforts relating to deconvolution of spectra have re-
sulted in methods and commercially available products, such
as AMDIS (Automated Mass Spectral Deconvolution & Identifi-
cation System, U. S. Department of Commerce, National In-
stitute of Standards and Technology (NIST)). This method
for automatically finding and distinguishing between as
many different components included in the measurement as
possible (substances) is described in S. E. Stein, J. Am.
Soc. Mass. Spektrom. 1999, 10, 770-781
(and
http://chemdata.nist.gov/mass-spc/amdis/method.pdf).
US-Patent 6,147,344 discloses a method for automatically
analyzing mass-spectrometric data for mixtures of chemical
compounds comprising a series of checks in order to elimi-
nate or reduce false peak assignments resulting from back-
ground noise, system resolution, system contamination, mul-
tiply charged ions and isotope exchange. For this purpose,
a mass spectrum is first of all recorded for a control sub-
stance, by means of which mass spectra of subsequent sam-
ples have statistical background noise and contamination
signals removed from them by subtraction. In addition,
peaks with a false width or retention time are excluded
from further processing and analysis by means of reference
spectra comparison, taking account of isotope distribu-
tions.
CA 02596381 2007-07-30
- 5
US-Patent 5,175,430 teaches a method and an apparatus for
carrying out time compression chromatography with array de-
tection in mass spectrometry, in which a mathematical
method is used to recover the information which has been
lost by compression so that high sensitivity is achieved
despite the analysis time being speeded up and the sub-
stance identification being improved.
US-Patent 5,453,613 discloses a mass spectrometry analysis
system for automatic identification, deconvolution and
identification of mass spectra. Mass spectra data recorded
using conventional methods is first of all reorganized from
the chronological sequence on the basis of the ion mass,
and is then once again chronologically reorganized within
each ion mass grouping. Local peaks or maxima are identi-
fied, sorted and split by means of integration for each
measured ion mass, so as to produce a set of deconvoluted
spectra in which each element in the set represents an
identifiable substance. The substances are then identified
by means of reference spectra comparison, using conven-
tional statistical comparison methods.
Admittedly, in some cases, these methods allow deconvolu-
tion of spectra and subsequent identification of substances
contained in the sample on the basis of reference spectra
libraries, but they allow this only for known substances
with correspondingly known mass spectra for which searches
are deliberately carried out. Furthermore, the methods are
subject to false assignments so that substances may be
falsely identified, particularly in the case of samples
with a large number of components.
None of the known methods are able to identify all of the
components in a sample on the basis of the data obtained by
chromatography and mass spectrometry, to completely decon-
CA 02596381 2013-09-19
- 6 -
volute spectra without errors, and at the same time o also
be carried out automatically.
One object of the present invention is therefore to provide
a method which is able to use chromatographic and mass-
spectrometric data for a sample to reliably identify as far
as possible all of the components contained in it (or at
least a larger part of them). In addition, the method
should be carried out as automatically as possible and
should allow reliable handling of peaks of unknown sub-
stances, that is to say it should also be possible to re-
cord signals for unknown substances and to ensure consis-
tent assignment over a large number of samples.
The invention therefore proposes a method for analyzing a
sample containing a plurality of substances, comprising the
following steps:
acquiring mass spectra (mass spectra data) of the sample
received from an upstream chromatograph by means of a
measurement device,
assigning chromatographic peaks and their associated mass
spectra to a respective one of the substances, wherein the
assignment is performed alternatively or cumulatively in at
least one of a first evaluation device and a second
evaluation device, with the first evaluation device
comprising at least one comparing device for comparing the
deconvoluted mass spectra with stored reference spectra, and
with the second evaluation device comprising at least one
comparing device for comparing the mass spectra of the
=
. CA 02596381 2013-09-19
- 6a -
chromatographic peaks of the ions with stored reference
spectra;
wherein the step of assigning comprises, in the first
evaluation device, deconvoluting the mass spectra obtained
by the measurement device and assigning the chromatographic
peaks and their associated deconvoluted mass spectra to a
respective one of the substances on the basis of a match
with a reference spectrum of that substance; and
wherein the step of assigning comprises, in the second
evaluation device, determining the intensity of the peaks,
obtained by the measurement device, of the ions in the mass
spectra, with ions which are specific for the substance and
with their retention time range being preset, and assigning
the chromatographic peaks of the ions and their associated
mass spectra to the reference values, predetermined for a
substance, of that substance on the basis of a match between
selective ions and their retention time ranges of the peaks;
checking the performed assignments of at least one of the
first and second evaluation devices in a validation device
at least on the basis of peak-oriented rules;
wherein the step of checking in the validation device
using at least one of the first and the second evaluation
devices comprises checking
whether the retention index of a peak assigned to a
substance by the evaluation device is within defined limit
values; and
whether a respective peak which has been found by at
least one of the first and the second evaluation device and
may have been assigned to a substance has not been
CA 02596381 2013-09-19
- 6b -
normalized with respect to a standard peak which is not
present or a standard peak which has not been successfully
checked by rules that have previously been applied and
activated;
and only the respective peaks checked successfully by
activated rules in the evaluated and deconvoluted mass
spectra signals are released for further evaluation,
further checking in parallel whether a sample which has
been fractionated before the analysis comprises peaks in
fractions which have been marked as missing or as false
measurements, and excluding such peaks from the further
analysis, and
issuing a warning message if no peaks relating to an
existing fraction are accordingly found.
Furthermore, the invention proposes a mass spectrometry
analysis system for analyzing a sample containing a
plurality of substances, according to the above-mentioned
method, comprising:
a measurement device for acquiring mass spectra from the
sample obtained from an upstream chromatograph,
at least one of: a first evaluation device for deconvoluting
the mass spectra obtained by the measurement device, with at
least one comparing device for comparing the deconvoluted mass
spectra with stored reference spectra; and a second evaluation
device for determining the intensity of the peaks, obtained
by the measurement device, of the ions in the mass spectra,
if appropriate with ions which are specific for that
substance and their retention time range being preset, with
CA 02596381 2013-09-19
- 6c -
the second evaluation device having at least one comparing
device for comparing the mass spectra of the chromatographic
peaks of the ions with stored reference spectra;
wherein
an assignment of chromatographic peaks and their associated
deconvoluted mass spectra to a respective one of the substances
in the first evaluation device is performed on the basis of the
match with a reference spectrum for the substance, and
an assignment of chromatographic peaks of the ions and
their associated mass spectra to a respective one of the
substances in the second evaluation device is performed on
the basis of the match between selective ions and their
retention time ranges of the peaks with the reference values
predetermined for a substance;
and further comprising
a validation device for checking the performed
assignments of at least one of the first and the second
evaluation devices at least on the basis of peak-oriented
rules;
wherein in the validation device, using at least one of
the first and the second evaluation devices, it is checked
whether the retention index of a peak assigned to a
substance by the evaluation device is within defined limit
values; and
whether a respective peak which has been found by at
least one of the first and the second evaluation device and
may have been assigned to a substance has not been
normalized with respect to a standard peak which is not
present or a standard peak which has not been successfully
CA 02596381 2014-10-15
- 6d -
checked by rules that have previously been applied and
activated;
and only the respective peaks checked successfully by
activated rules in the evaluated and deconvoluted mass
spectra signals are released for further evaluation,
with a further check in parallel whether a sample which
has been fractionated before the analysis comprises peaks in
fractions which have been marked as missing or as false
measurements, and excluding such peaks from the further
analysis, and
issuance of a warning message if no peaks relating to an
existing fraction are accordingly found.
The invention further proposes a computer device for
carrying out the above-mentioned method.
The invention further proposes a laboratory information
management system (LIMS) comprising at least one of the
above-mentioned mass spectrometry analysis system, and the
above-mentioned computer device.
The invention further proposes a use of the above-mentioned
method, of the above-mentioned mass spectrometry analysis
system, of the above-mentioned computer device, or of the
above-mentioned laboratory information management system for
analyzing a sample which contains a plurality of substances.
The invention further proposes a computer-readable storage
medium having recorded thereon statements and instructions
for execution by a computer device in order to carry out the
CA 02596381 2014-10-15
- 6e -
steps of the above-mentioned method when the statement and
instructions are run on said computer device which is
suitable for this purpose, or in a laboratory system which
is suitable for this purpose.
The use of the evaluation devices for subsequently checking
the assignment of the chromatographic peaks and mass spec-
tra makes it possible to reliably identify all of the known
components (or at least a large proportion of them) con-
tained in a sample. In addition, the method can be carried
out automatically and allows reliable handling of peaks of
unknown substances. Signals from unknown substances may be re-
CA 02596381 2007-07-30
- 7
corded specifically, ensuring consistent assignment over a
large number of samples.
The method according to the invention makes it possible for
peaks which have not been deliberately searched for (that
is to say peaks without a reference spectrum and the posi-
tion in the chromatogram (retention time, retention index),
in particular peaks of unknown substances) to be marked as
such and to be passed on for special treatment, thus con-
siderably simplifying and speeding up the finding of new
substances, particularly when large amounts of data are in-
volved.
A fundamental distinction is drawn between so-called "chro-
matographic peaks" and "mass peaks". A chromatographic peak
represents a maximum on a distribution/curve over time in
the case of chromatographic separation and, ideally, has a
Gaussian form. In this case, it is irrelevant whether the
peak originates from the profile of the signal over time of
a single ion that has been predetermined as being selec-
tive, or from a plurality of added ion signals, or from the
addition of all the ion signals. (The latter is the so-
called TIC peak (TIC: Total Ion Current)).
Mass peaks can be distinguished from these chromatographic
peaks as mass signals in a mass spectrum which relate to
maxima of the signal intensity over the mass axis within a
mass spectrum. The mass spectra are recorded in precisely
the same way as chromatograms as an intensity distribution
over time, with the ion mass selected for detection being
varied over time. However, this time is short in comparison
to the duration of chromatography. A complete mass spectrum
in general represents only a single time data point in a
conventional chromatogram. The maxima within a mass spec-
trum such as this last, for example, for about 0.3 s and
CA 02596381 2007-07-30
,
- 8 -
,
are already normally integrated in the measurement device,
for data reduction. Because of the poor mass resolution in
the quadrupole detectors that are often used, the mass
spectra obtained are stored in the so-called centroid mode,
that is to say only one line is presented per intensity
maximum in the mass spectrum, including intensity and mass
as information, that is to say no longer including any dis-
tribution over time. However, the information relating to
the time profile (retention time) is not lost, but is
stored for the respective mass peak. For the sake of sim-
plicity, the following text uses the expression "mass peak"
whenever this relates to a peak in a mass spectrum. In all
other cases, the expression "peak" is used to mean a chro-
matographic peak over the time axis.
By way of example when using mass spectrometers with low
mass resolution, that is to say with unit mass resolution,
there is normally only one mass peak per Dalton. For the
sake of simplicity, only the (integer) unit masses are then
still shown in the mass spectra. If a change is once again
made back to the chromatogram and a selected selective ion
mass (for example 217) is shown chromatographically over
time, then this mass can be used selectively for chroma-
tographic integration. However, it is stored, that all of
the ions whose centroid (that is to say mass-spectrometric
maximum) falls in a range for example from 217 - 0.3 to 217
+ 0.7 are also included in the chromatographic integration
over time.
All methods which are suitable for combination with mass
spectrometry can be used as chromatographic methods, for
example gas chromatography (GC), liquid chromatography (LC)
or high performance (high pressure) liquid chromatography
(HPLC).
CA 02596381 2007-07-30
- 9 -
Mass spectra can be recorded using all known methods and
equipment. Quadrupole mass spectrometers, flight-time mass
spectrometers, Fourier transform mass spectrometers and
sector field devices should be mentioned by way of example.
For further embodiments, reference should be made to the
Rompp Lexikon Chemie [Chemical Dictionary] - CD Version
2.0, Stuttgart/New York: Georg Thieme Verlag 1999.
In the present application, the expression deconvolution
means the extraction of individual ions (mass/charge ra-
tios) from a series of mass spectra, making use of the fact
that all of the intensities of the mass/charge ratios of a
spectrum of one component change at the same time and uni-
formly during elution of this component or substance. In
other words, the ratios of the intensities of the signals
(peaks) to one another remain the same. Two types of decon-
volution are possible: on the one hand deconvolution in
which the mass spectrometric data is analyzed in order to
determine retention times, amounts and identities of the
eluting substances without prior knowledge of the sample
composition (referred to as forward search), and on the
other hand deconvolution in which the amount and retention
times of specific target substances are determined by ana-
lyzing the shapes of the characteristic mass spectra (re-
ferred to as backward search) (see US-Patent 5,175,430 col-
umn 6, line 16 to column 7, line 28).
The expression intensity measurement means the extraction
and integration (determination of the area of a signal) or
determination of the signal level of a peak. Methods for
this purpose are known to those skilled in the art. For ex-
ample, the integration can be carried out by means of Fast
Fourier transformation.
CA 02596381 2007-07-30
- 10 -
The data obtained from the mass spectra is normally associ-
ated by means of a comparison with reference spectra of
(known) substances contained in the sample. Appropriate li-
braries and commercial programs are available for this pur-
pose, and in some cases are also integrated in the evalua-
tion devices.
By way of example, AMDIS can be used as the first evalua-
tion device and Chemstation can be used as the second
evaluation device as evaluation devices which can in each
case be used on their own or in conjunction with the vali-
dation device.
These two evaluation devices differ from one another in
that the second evaluation device (by way of example Chem-
station) uses time windows for peak finding, with the peaks
that are found being integrated at a predefined ion mass,
while in contrast the first evaluation device (for example
Amdis) first of all breaks a data record down into individ-
ual components and then compares them with predetermined
spectra in a library in order to identify the target sub-
stances, using the retention index (RI) instead of the re-
tention time (RT). Chemstation (GC/MS-Chemstation, Agilent
Technology, Prod. No. G1701 CA), which has been mentioned
by way of example, represents typical integration software
for three-dimensional measurement data (time, mass, inten-
sity), with the intensity of an ion being determined by in-
tegration over time or by means of its maximum height above
the base line (with integration parameters such as time
windows, threshold values, qualifying masses, etc. being
predetermined). In the case of the AMDIS system, which has
been mentioned as an example of the first evaluation de-
vice, the deconvolution settings and, optionally, reference
spectra, RI calibration and RI values for substance identi-
CA 02596381 2013-09-19
- 11 -
fication must be preset (see the Manual at
http://chemdata.nist.gov/rrass-spc/antdis/AMDIS.pdl)
These tWo commercially available evaluation devices (or
programs) check only the peaks of target substances, that
is to say only those target peaks which have already been
entered as parameters are specifically searched for. This
relates to details relating to the retention times (RI),
retention indices (RI) or typical ions in the chromatogram
or mass spectrum, which the methods are to search for ac-
tively. However, the various methods for searching for tar-
get peaks or target substances lead to different state-
ments, and to different quality of the statements.
Thus, according to a preferred embodiment of the invention, two different
evaluation devices are used, specifically a first evaluation device
for deconvolution of the mass spectra obtained by the meas-
urement device, and a second evaluation device for deter-
mining the intensity of the peaks, obtained by :he measure-
ment device, of the ions in the mass spectra. The (peak)
assignments produced by these two evaluation devices are
checked, and the respective assignments produced by the two
evaluation devices are compared in a validation device pro-
vided for this purpose. This principle according to the in-
vention improves the accuracy of the overall evaluation and
assignment, by the use of different characteristics of the
evaluation devices. In addition, false assignments are
avoided, or at least reduced. The method can also be car-
ried out automatically. Furthermore, the identification
performance and the identification of substances contained
CA 02596381 2013-09-19
- ha -
in the sample are greatly improved.
This is particularly important when analyzing samples of
biological materials, for example from plants, animals, mi-
croorganisms etc., in which many hundreds to a thousand
CA 02596381 2007-07-30
- 12 -
compounds may be present. By way of example, this is neces-
sary when searching for metabolites or new substances. The
method is particularly suitable for automation, thus allow-
ing high-efficiency analysis of a multiplicity of samples
every day (High-Through-Put analysis, HTP). It will be vir-
tually impossible - or even impossible - to cope with this
amount of data manually. In addition to the plant extract
areas mentioned exclusively in the description in the fol-
lowing text, and the search for substances in plants and
marine sponges, the invention may, of course, also be used
in all possible and feasible biological materials, in par-
ticular including tissue, bodily fluids, cell cultures,
etc.
However, it is also possible and may be necessary within
the scope of the invention to extend the described commer-
cial evaluation devices AMDIS and/or (in particular) Chem-
station by means of proprietary upgrades. These improve-
ments relate in particular to determining match qualities
(M2, see below). The evaluation devices (in particular
Chemstation) can also be upgraded by determining a signal-
to-noise ratio (S/N) and/or a blind value for the peaks.
In order to determine the signal-to-noise ratio, the noise
for the ion signal of the peak is determined before and af-
ter the respective peak, using methods known to those
skilled in the art such as peak-to-peak noise or root-mean-
square noise (RMS), and by then calculating the respective
signal-to-noise ratio before and after the peak, together
with the peak signal intensity. This value which is ob-
tained for a peak must exceed a predetermined limit if the
peak is assigned to a substance and is intended to be re-
liably quantitatively evaluated. However, it is sufficient
for the S/N ratio to exceed the limit value before or after
the respective peak.
CA 02596381 2007-07-30
- 13 -
The signal intensity of a peak (peak height or peak area,
or else the peak height or peak area normalized with re-
spect to an internal standard) must furthermore also exceed
a limit value for reliable quantitative evaluation, with
this limit value being determined on a substance-specific
and analysis-method-specific basis from the mean measured
value of blank samples (blank value) and its standard de-
viation over a relatively long previous period.
These determinations are of interest because the S/N ratio
and the signal intensity limit value to be exceeded are a
gauge or bench mark of the quality of the measurement. For
example, for the limit of detection, the reporting limit
and the limit of quantitation of a peak, in particular of a
peak (b) assigned to a substance by the second evaluation
device (B), the values should be above a defined signal-to-
noise ratio and a signal intensity limit value. This is the
only way that it is possible to ensure that a signal or a
peak has been correctly assigned to a substance and that
the peak can be reliably quantitatively evaluated during
subsequent analysis of the data.
A limit value for the S/N ratio and a limit value resulting
from the blind value measurements (the latter on a sub-
stance-specific and analysis-method-specific basis) are
therefore defined in each case for the limit of detection,
the reporting limit and the limit of quantitation and must
exceed the peak to be investigated. Otherwise, it is in-
validated.
The defined signal-to-noise ratios and the signal intensity
limit values of the peak therefore preferably increase in
the following sequence: limit of detection, reporting
limit, limit of quantitation. The limit of detection and
CA 02596381 2014-10-15
- 14 -
reporting limit are therefore also passed through in a
positive sense automatically, for example in a positive
test of the limit of quantitation.
By way of example, commercially available GC/MS, LC/MS or
HPLC/MS appliances are suitable for use as apparatuses for
carrying out the method according to the invention. These
normally have a processor (computer or data processing in-
stallation) which is able to carry out the method according
to the invention when implemented in the form of a program
(software). However, an embodiment in the form of program-
mable hard-wired logic modules would also be possible.
The invention also covers a computer program with program
code which is suitable for carrying out a method according
to the invention when the computer program is run on a
suitable computation device.
One or more computer device is suitable for carrying out the
method according to the invitation and for use as the first
and/or second evaluation devices.
Furthermore, the method according to the invention can be
used to produce a graphics display of all the results (for
example peak attributes, such as areas, relative and
normalized and corrected areas, retention time, retention
index etc.) in a manner that allows them to be restricted
selectively on the basis of sample criteria (quality, sample
type, test equipment, time period, etc.) and peak criteria
(validity, evaluation type, etc.), thus simplifying and
improving the optimization and analysis of the results.
CA 02596381 2007-07-30
- 15
A combination with quality analysis is also possible and
worthwhile since this allows a high degree of automation to
be achieved, thus allowing a high sample throughput with
high result quality. Furthermore, this ensures that unknown
substances, that is to say possible impurities or newly oc-
curring signals of interest, which cannot be searched for
deliberately without knowledge, are indicated by means of
the method according to the invention and are therefore not
"suppressed". Substances such as these which are indicated
as newly occurring may be collected deliberately and auto-
matically and are then used, together with their informa-
tion such as mass spectrum, retention time, retention index
and intensity, as a reference if the same substances occur
once again later.
Furthermore, the validation device, to the extent that it
appears to be useful, can also be used to calculate normal-
ized or corrected values, for example for normalization of
the peaks with respect to the intensity of a standard
and/or with respect to the sample size (initial weight)
and/or subtraction of blank value percentages of specific
peaks with a measurement series.
The invention is also suitable for quality checking (assur-
ance) by means of flexible rules (that is to say rules
which can be combined freely), and an automatic limit-value
check can also easily be incorporated, to be precise on a
selectively different basis (that is to say different limit
values) for specific analytes (that is to say samples and
substances). Limit values may be checked, for example, on
the basis of intensities, retention times, retention indi-
ces for individual peaks and, if appropriate, can be in-
validated, or values for more than one sample, for example
the recovery rate or the relative standard deviation of de-
termined substance concentrations (for example from the
CA 02596381 2013-09-19
- 16 -
peak intensities of the peaks for one analyte in all of the
measurement samples or in the quality control samples in
the sequence), can be calculated and checked against fixed
limit values. If appropriate, this can be used to invali-
date entire samples, fractions or groups of samples or
fractions which do not satisfy the quality criteria defined
in advance.
The method according to the invention is accordingly also
suitable for analysis purposes when looking for substances
in plants, marine sponges etc.
The method according to a preferred embodiment of the invention defines
peak-oriented and sample-oriented rules for checking the data (peaks)
originating from the first and the second evaluation de-
vice. The use of individual rules is dependent on :he re-
spective substance (or peak) so that different rule combi-
nations are worthwhile for different problems with differ-
ent substances. There is no need to activate all of the
rules, that is to say to use them for each sample or sub-
stance. In addition, the validation device does not need to
apply all of the rules for each of the peaks assigned by
:he two evaluation devices. Specific rules are in each case
applied only for the peaks assigned by one of the two
evaluation devices, while others are applied for the peaks
assigned by the respective other evaluation device, with
yet others being applied for the peaks assigned by both
evaluation devices.
This should be understood as meaning that only the respec-
, .
CA 02596381 2013-09-19
- 16a -
tively stated rules should be used, if only peaks of the
first evaluation device or only peaks of the second evalua-
tion device are dealt with in an isolated form in the vali-
dation device, that is to say no comparison is cdrried out_
between the respective peaks, either. The rules other than
CA 02596381 2007-07-30
- 17
those stated would then in each case have no effect, even
if they were activated.
It should also be mentioned that the rules can be modified,
added to or extended in a simple manner at any time by vir-
tue of the modular structure.
The invention will be described and explained in more de-
tail in the following text using one exemplary embodiment
and with reference to the attached drawings. The described
and illustrated exemplary embodiment and the illustrated
and explained sequence of rules according to the invention,
and their content, should be regarded as an exemplary ex-
planation of the invention, without any restriction to the
subject matter of the invention as described in the patent
claims.
Figure 1 shows a flowchart of a method according to the in-
vention, and of rules contained therein.
Figures 2 to 7 show the application of Rules P8 and P20 of
Figure 1 to the mass spectra data from a plurality of sam-
ples.
Figures 8 to 10 show the application of Rules Pl, Si and S2
of Figure 1 to the mass spectra data from a plurality of
samples.
Figures 11 and 12 show the application of Rule P21 of Fig-
ure 1 to the mass spectra data from a plurality of samples.
Figures 13 to 15 show the application of a linear modeling
based on Rule P9a of Figure 1 to the mass spectra data from
a plurality of samples.
CA 02596381 2007-07-30
- 18
Figure 16 shows a schematic procedure for the analysis and
evaluation principle according to the invention.
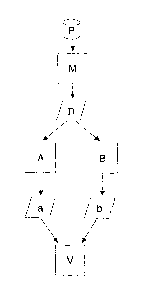
Figure 16 shows how a sample P is processed and analyzed,
and how the resultant mass spectrum is evaluated, according
to the present invention.
A sample P is passed in a manner known per se to a measure-
ment device M which outputs mass spectra data D comprising
a plurality of peaks. According to the invention, this mass
spectra data D is supplied to two evaluation devices, spe-
cifically a first evaluation device A and a second evalua-
tion device B.
The first evaluation device A deconvolutes the input mass
spectra data D using a method as is known, by way of exam-
ple, from the AMDIS system which has already been mentioned
and described in the introduction. The second evaluation
device B determines the intensity of the peaks contained in
the mass spectra data D, using a method such as the Chem-
station system which has already been mentioned and de-
scribed in the introduction.
The assignment of the respective peaks a and b to sub-
stances which may be contained in the analyzed sample is
produced as the output from the evaluation devices A and B.
The peaks identified in this way are input to a validation
device V for further evaluation and checking according to
the invention.
Figure 1 shows a sequence of various rules, which can be
used as the basis for the check in the validation device V.
The rules illustrated in Figure 1 are listed in Table 1,
for clarity reasons. In this case, a distinction can be
drawn between so-called sample rules, whose numbering
CA 02596381 2007-07-30
S. - 19
starts with the letter S, and so-called peak rules, whose
numbering starts with the letter P.
The sequence of rules illustrated in Figure 1 is not essen-
tial. The rules according to the invention may also be used
in a different sequence. In particular, there is no need to
activate all of the preceding rules in order to carry out a
subsequent rule in the flowchart. The rules are therefore
not dependent on one another.
There is no need for all of the rules to be activated, that
is to say to be used for each sample or substance. In addi-
tion, the rules need not all be carried out for each of the
peaks assigned by the two evaluation devices A and B. Cer-
tain rules are applied only for respective peaks assigned
by one of the two evaluation devices, while others are ap-
plied for peaks assigned by the respective other evaluation
device, with yet others being applied for peaks assigned by
both evaluation devices.
Effective (that is to say eligible) rules for checking the
peaks a from the first evaluation device A by means of the
validation device are, in the present example, the Rules
P4, P7b, P13a, P15, P16a, P16b, Pl8a, Pl8b, Pl9b and P22.
Effective (that is to say eligible) rules for checking the
peaks b from the second evaluation device B by means of the
validation device in the present example are, analogously,
the Rules Pl, P21, P8, P9a, P9b, Plla, Pllb and P23. The
further peak rules are applied only when using both evalua-
tion devices A, B(P19a, P7a), or are used independently of
one another by both evaluation methods for the two evalua-
tion devices A and B(P13b, P20).
The Rules P13a (only for the first evaluation device A),
P13b (for both evaluation devices A, B) and P21 (only for
CA 02596381 2007-07-30
- 20
the second evaluation device B) should sensibly be placed
at the start of the process, but need not necessarily be
applied to or activated for the following rules.
First of all, the Rule P1 should be checked for the second
evaluation device B. The Rules P8, P9a/b, Plla/b can then
be applied/combined (also jointly) as required. Considering
just the sequence for the test procedure, the Rule Plla/b
should be placed at the end, since this rule compares ana-
lytes with one another, and not just a single analyte with
a defined standard. For this reason, it is worthwhile ap-
plying the Rules (P8,9a/b) for checking the RI (if they are
activated) in advance, in order that the reference peak for
Rule Plla/b (if it is activated) will have been checked as
extensively as possible in advance.
An analogous situation applies to the first evaluation de-
vice A and the Rule P4. The Rules P15, P16a/b and P18a/b
(P18a/b at the end, if activated) can then each be applied
optionally or else in combination.
The comparisons by means of the Rules P7a with respect to
the retention time (worthwhile mainly for time standards)
and P19a with respect to the retention index between the
evaluation devices A and B are, of course, worthwhile only
when both methods of the evaluation devices A and B are
also used. However, the b Rule (7b and 19b) may in each
case also be applied in an isolated form by the first
evaluation device (A) so that peaks are invalidated inde-
pendently by the second evaluation device (B) until only
the one with the greatest intensity remains. It is worth-
while for the method comparisons P7a and P19a to be carried
out after the actual individual checks P1/4 and
P8/9/11/15/16/18, respectively, in the procedure. However,
CA 02596381 2007-07-30
- 21 -
since these individual checks need not be activated, they
are not an essential precondition for the comparisons.
A similar situation applies to the remaining Rules P22
(only for the first evaluation device A) and P23 (only for
the second evaluation device B) as well as P20 and Si. It
is worthwhile positioning them at the end of the sequence
since they pass on the invalidation of peaks resulting from
previous rules to further peaks or samples. In this case as
well, activation of the previous rules is not an essential
precondition.
First of all, the validation device uses Rule P1 or P4 to
check whether the retention times of the respective peaks a
and b assigned to substances by the respective first and
second evaluation devices A and B are within defined lim-
its. These limit values and the subsequent limit values
may, for example, be predetermined by the user and may be
stored in appropriate databases and, in the same way as all
the parameters for peak checking rules (P1 to P23), are
specific for the respective substance.
These two Rules P1 and P4 ensure that substances for which
the time after which they will elute from the column of the
chromatograph (in particular time standards) is known are
released for further processing only if their retention
times do not differ too much from the known times.
In parallel with this, the validation device uses Rule P13a
to check whether the match qualities M1 of the peaks a as-
signed to a substance by the first evaluation device A are
above defined limit values. The match quality takes account
of the similarity of the spectrum found for a substance
with a defined reference spectrum from a library, as well
as the similarity of the retention index, defined in the
CA 02596381 2007-07-30
- 22
same way in the library, to the experimentally found reten-
tion index. It is in the range from 0 to 100%, and is pro-
duced by the first evaluation device A. A minimum match be-
tween a spectrum that has been found and a reference spec-
trum can be ensured on the basis of this rule.
The following section relates to peaks a from the first
evaluation device A and/or peaks b from the second evalua-
tion device B, with the nature of the assignment of peaks
to a substance differing, depending on the evaluation de-
vice A, B. These peaks which are assigned by the different
evaluation devices using different methods are checked by
means of Rule 13b for their match quality (M2) with a ref-
erence mass spectrum stored for that respective substance.
Thus, the validation device - likewise in parallel - uses
Rule P13b to check whether the peaks a assigned to a sub-
stance on the basis of the match probability or match qual-
ity (M1) by the first evaluation device A and/or the second
evaluation device B, as well as the peaks b assigned on the
basis of the integration parameters, have a match quality
(M2) above defined limit values. In this case, the match
probability or match quality (M2) of the spectrum for a
peak is checked statistically with the stored reference
spectrum for the substance assigned to that peak by the
first or the second evaluation device A or B, to be precise
using a different, independent comparison method than that
for Rule P13a (M1). The assignment is released for further
processing only if the required accuracy (limit value) is
exceeded or reached.
After one of the above steps, the validation device checks
the peaks a, b assigned to the same substance, in particu-
lar a time standard, by the two evaluation devices A, B, by
application of Rule P7a to determine whether their discrep-
CA 02596381 2007-07-30
- 23 -
ancies from one another in the retention time (RT) are
within defined limit values. This rule ensures that the re-
spective peaks a and b assigned to one and the same sub-
stance by the first and the second evaluation device A and
B have retention times which do not differ excessively from
one another, that is to say that, irrespective of the
method, the peaks are located at a specific retention time
or within specific limits around this retention time. This
procedure is based on the finding that there can be only
one correct retention time, since the retention times are
independent of the subsequent evaluation method used for
computation. Only minimal differences (resulting from the
different calculation of the peak maximum) are permissible.
For one substance, the retention times depend, so to speak,
"only" on the chromatographic conditions.
However, .as already mentioned above, the Rule P7a is not
dependent on the previous rules, and can also be applied
without activating these or carrying these out. A corre-
sponding situation likewise applies to the following rules.
In the situation where the first evaluation device A has
assigned a plurality of peaks a to the same substance, in
particular a time standard, within defined limit values of
the retention time, which peaks a have not yet been invali-
dated by the activated rules already applied before this
rule (for example, comply with P7a, that is to say they are
very closely adjacent and may represent possible false de-
convolutions), the validation device furthermore uses Rule
P7b to ensure that only that peak a with the largest area
is processed further. This ensures that only the correct
peak (or at least always the same peak with a high prob-
ability) can remain, in particular as one of the time stan-
dards for which further normalization and processing are
used, and in any case only one peak can remain for one sub-
CA 02596381 2007-07-30
- 24 -
stance from the method used by the first evaluation device
A, which peak is used, for example, as one of the time
standards. Checking on the basis of their mass spectrum and
their retention time is particularly important for time
standards, since there is no calculated retention index for
them, but only an associated retention index, whose check-
ing would be pointless, although time standards are an im-
portant basis for checking the assignment for the other
peaks, and must therefore be identified and checked relia-
bly.
Furthermore, in order to ensure correct normalization and
further processing by the validation device, Rule Si is
used to check whether the peaks found for a sample of time
standards have been found by the second evaluation device B
and have not yet been invalidated by the activated rules
already applied before this rule. In other words, this en-
sures that every time standard that is required according
to the method and has been specified in advance has also
been recorded, and is valid in accordance with the rules
which have already been applied.
In parallel with the checks (P13a, Pl3b, P1/4 and P7a/b and
Si) described above, the validation device uses Rule P21 to
ensure that the peaks b assigned to a substance by the sec-
ond evaluation device B have no negative areas. Peaks with
negative areas are either measurement errors or integration
errors, and, since these must not occur, they must be ex-
cluded from further processing.
After checking the match quality (M1) by applying Rule Pl3a
and/or (M2) by applying Rule Pl3b, it is possible for the
validation device to next use Rule P15 to check whether the
retention index (RI) of a peak a assigned to a substance by
the first evaluation device A is within defined limit val-
CA 02596381 2007-07-30
- 25
ues. This ensures that only data is processed further for
which there is certainty that the discrepancy between the
target substance, which is being searched for by the first
evaluation device A, and the substance found is not exces-
sive. This procedure avoids false assignment.
After using Rule P13a to check the match quality (Ml),
and/or using Rule Pl3b to check (M2) and, for example, in
parallel with the check of the retention index, the valida-
tion device uses Rule P16a/b (LIN MOD) to check whether the
retention index of the standard for linear modeling (LM-RI)
and the retention index (RI) of a peak a which is assigned
to a substance by the first evaluation device A lie, within
defined discrepancies, adjacent to or on a straight line
when plotted against one another (note: the retention index
of the standard for linear modeling is referred to for sim-
plicity in the following text as the linear model retention
index).
According to the invention, it has been found that the re-
tention indices of the peaks for one substance in the sta-
tistical evaluation may obey the linear regression rule,
that is to say their values can be modeled as a linear
function on the basis of a standard. A linear equation is
therefore defined as the basis for these rules for a sub-
stance to be tested for and for a standard defined experi-
mentally in advance for this purpose, for plotting the RI
of that substance against the RI of the standard for linear
modeling (regression line with slope and intercept), with
maximum permissible discrepancies being defined, and being
stored in the database. Only if the values during checking
(when the rules are applied) do not differ excessively from
the linear equation, that is to say they are within the
maximum predetermined discrepancies (limit values), do they
CA 02596381 2007-07-30
- 26 -
actually belong to the substance being searched for, and
can be released for further processing and analysis.
In this case, the standard may be a particular standard for
linear modeling, or any given (suitable) substance con-
tained in the sample. Linear modeling can be carried out as
a peak test both for every standard assigned to the sample
and for the other previously successfully checked (that is
to say validated) peaks of target substances if a linear-
modeling standard has been defined for them. As a standard
for linear modeling, it is worthwhile defining in advance a
peak which is found with a very high confidence level
since, otherwise, the test for the substance to be tested
will also have a negative result if the standard is not
found. Furthermore, the chromatographic characteristics of
the peak selected as the standard for linear modeling
should be suitable for checking the respective peak, that
is to say the more similar the chromatographical responses
of the target substance being searched for and of the se-
lected standard are (in general this means the more chemi-
cally similar they are), the more accurate is the linear
modeling. In theory, it is possible to use a separate stan-
dard for each substance being searched for. A peak which is
used as a linear-modeling standard in this case should not
itself be checked by use of these rules, otherwise it will
be necessary to adhere to a predefined sequence for appli-
cation of these rules to test for the substances.
If a linear-modeling standard is predetermined as a parame-
ter for a target substance, this is used to check the peaks
a, b, otherwise the Rules P16a and P16b are skipped. If the
linear-modeling standard itself is not found in the chroma-
togram, or the check has given a negative result on the ba-
sis of one of the previous rules, the linear modeling is
concluded with a negative test result (this means that P16a
CA 02596381 2007-07-30
- 27
is then noted as having failed, and Pl6b can no longer be
checked at all). If the linear-modeling standard is found
in the chromatogram and a check based on all the previous
rules has been positive, then this linear-modeling standard
is used to actually test the peak, with the linear model-
ing. The result of this test is then stored as a result re-
lating to Rule P16b. The differentiation between the two
Rules Pl6a and P16b is thus used in this case for documen-
tation of which step in the test has failed. This also ap-
plies in an analogous manner to Rules P9a/b, Plla/b and
P18a/b. In the case of Rules P7a/b, P13a/b and Pl9a/b, a
and b each represent step elements for the respective
rules, but the distinction between the step elements is lo-
cated somewhere else, depending on the other contents of
these rules.
Otherwise, the retention index YRI of the target peak and
the retention index XRI of the standard for linear modeling
are compared with one another in the form of a linear equa-
tion, that is to say they are plotted against one another,
in which case
YRI < a*Xm + p + Delta top
and
YRI > a*Xm + p + Delta bottom
must be satisfied. The parameters a, p and the maximum dis-
crepancy delta in the upward and downward directions (which
can be predetermined to have different magnitudes,
Delta bottom is negative) are predetermined for this pur-
pose_ as target-peak-specific parameters. If the discrepancy
of YRI exceeds the respective delta, then the peak being
examined is blocked for further analysis.
CA 02596381 2007-07-30
- 28
After checking the match quality of the match probability
or quality (M2) using Rule P13b, the validation device uses
Rule P8 to ensure that the retention index (RI) of a peak b
assigned to a substance by the second evaluation device B
is within defined limit values. This ensures that only data
is further processed for which it is certain that the dis-
crepancy between the target substance which the second
evaluation device (B) is searching for and the substance
found is not excessive. This procedure avoids false assign-
ment. For peaks b from the second evaluation device B, the
RI is calculated by the validation device V using the
stated method, since type B evaluation devices generally
have no RI values available.
Analogously to Rule P16a/b and in parallel with it, the
validation device uses Rule P9a/b (LIN MOD) to check
whether the linear model retention index (LM-RI) and the
retention index (RI) of a peak b which has been assigned to
a substance by the second evaluation device B lie, within
defined discrepancies, adjacent to or on a straight line
when plotted against one another. For the details of this,
reference should be made to the above statements relating
to Rule P16a/b.
The validation device then checks the respective peaks a
and b assigned to substances by the two evaluation devices
A, B on the basis of Rule Plla/b and Rule Pl8a/b, respec-
tively, to determine whether they have a defined neighbour-
ing peak alongside them within defined limit values of the
retention time, which has not yet been invalidated by the
activated rules already applied before this rule. The chro-
matographic peaks of some substances have special features
in that specific peaks always have a very specific
neighbouring peak in specific investigated sample materials
(matrices) before or after them. If a neighbouring peak
CA 02596381 2007-07-30
= - 29
such as this has been defined since it is known for the
substance being searched for that it occurs close to the
corresponding peak, and this does not appear within certain
limits, then this supposedly does not relate to the sub-
stance being searched for, and corresponding assignment of
the peak would be false. These rules therefore allow high
accuracy for substances whose peaks in the chromatogram
have peak-neighbouring peak relationships such as these.
The validation device then uses Rule P19a to check the re-
spective peaks a and b assigned to the same substance by
the two evaluation devices A, B, to determine whether their
discrepancies from one another in the retention index (RI)
lie within defined limit values. This is because the peaks
of a substance are located at a specific retention time or
within certain limits around this retention time, irrespec-
tive of the method (there can be only one correct absolute
retention time, since the retention times are independent
of the subsequent evaluation method). Only minimal differ-
ences, resulting from the different calculation of the peak
maximum, are permissible. The retention times for a sub-
stance depend "only" on the chromatographic conditions.
Rule P19a is analogous to Rule P7a, with the difference
that the retention index is used in this case instead of
the retention time, indicating the position of the peak in
a gas chromatogram, and to this extent having a similar
function to an RT value (precisely speaking, analogous to
the retention time). The retention index is characteristic
of each substance and is highly dependent not only on the
stationary phase used but also on the measurement tempera-
ture and the temperature program. It is determined by in-
terpolation between the retention indices of the two com-
pounds which are adjacent to the substance in the chroma-
togram and are added for this purpose, in general alkanes.
CA 02596381 2007-07-30
- 30
These compounds are generally added to the sample before
the measurement (time standards), for example in the form
of a homologous series of alkanes (possibly those alkanes
with an odd number of carbon atoms in the chain). The re-
tention indices for these reference compounds are fixed by
definition (for 100 * number of C atoms in the alkane); for
example: RI (ethane) = 200, RI (heptadecane) = 1,700. The
advantage of using the retention index is that it is nor-
mally more accurate than the retention time. It is also
possible to use other homologous series instead of a ho-
mologous series of alkanes with an odd number of carbon at-
oms, for example saturated fatty acids with an odd number
of carbon atoms or their methyl esters or amides, provided
that they do not themselves occur as target substances of
analytical interest in the sample.
At this point, it should be stressed that the present in-
vention can be used not only as described in gas chromatog-
raphy but also in liquid chromatography. In liquid chroma-
tography, it may be worthwhile determining a fundamentally
analogous retention index and using this to improve the
data quality, in particular the correct assignment of sub-
stances to peaks, by application of the appropriate peak
rules. In this case, the retention index is influenced by a
multiplicity of chromatographic parameters, for example in-
cluding the eluent composition. In this case, any desired
substances in the sample, preferably substances added to
the sample, may be used as time standards, provided that
they do not occur in the sample itself or do not represent
target substances of interest in the sample. The time stan-
dards are then assigned to suitable fixed RI values, which
are used to interpolate the RIs of the analytes.
The validation device then uses Rule P19b to ensure that,
if the first evaluation device A has assigned the same sub-
CA 02596381 2007-07-30
- 31
stance to a plurality of peaks a which have not yet been
invalidated by the activated rules already applied before
this rule (for example complying with Rule P19a ) are very
closely adjacent and may represent false deconvolutions),
only the peak (a) with the largest area is processed fur-
ther. Despite the previous checking of the retention indi-
ces, it is possible for the first evaluation device A to
find more than one peak within the above limit values, for
example with this peak complying with Rule P19a. Rule P19b
ensures that, in a situation such as this, only the peak
with the largest area, that is to say that peak which has
the highest probability of being the peak that is being
searched for, may be used as the basis for further analy-
sis. (This is based on the finding or assumption that, in
fact, the smaller peaks represent false deconvolutions, and
the largest has therefore a higher probability to be the
correct peak. If the largest possible peak is always taken
in all of the samples, then a peak which is comparable over
all of the samples will always be reproducibly used for one
specific substance.)
Furthermore, the validation device uses Rule P20 to check
that a respective peak a or b which may have been assigned
to a substance and has been found by the first or the sec-
ond evaluation device A or B has not been normalized with
respect to an internal standard peak (SP) which is not pre-
sent or has not been successfully checked, that is to say
that the quantitative result (intensity of a peak) for a
substance has been normalized with respect to the quantita-
tive result of an internal standard that is normally used
for quantitative determination, but is false. It is possi-
ble for a standard (see above) which is present in the sam-
ple and its peak which the aim is to search for not to be
found, or for a peak such as this not to have been released
for further processing on the basis of the above rules,
CA 02596381 2007-07-30
- 32
that is to say for it to have been invalidated. The other
peaks must not be normalized with respect to a peak such as
this, so that these peaks are likewise invalidated in the
absence of the standard peak or if it is invalid.
Then, that is to say after Rules P20 and P21, the valida-
tion device uses Rule P22 to ensure that apart from any
peak a assigned to a substance by the first evaluation de-
vice A, there is no validated unknown (that is to say not
assigned to any substance) neighbouring peak within defined
limit values (in particular within the RI or RT, preferably
RI) whose mass spectrum also has a match quality (M2) above
a defined limit value with the reference mass spectrum of
the substance assigned to the peak a. For this rule, the
defined limit values are very small, that is to say the
check is carried out in the immediate vicinity of the peak
a. The validation device uses these rules to investigate
peaks which are not assigned to target substances, that is
to say which are unknown. Unknown peaks such as these which
occur in the immediate vicinity of a previously success-
fully checked peak for the same substance and also have a
similar mass spectrum are eliminated, since the unknown
peak already exists as a peak for the target substance.
This avoids redundancy. In this case, it is desirable for
unknown peaks which have a good match quality (= limit
value, which is stored by the user) of the mass spectra
with the adjacent identified peak not to be dealt with and
therefore to be invalidated - "only" all others are poten-
tially new and therefore very interesting substances which
do not have a good match quality with known target sub-
stances.
In parallel with Rule P22, the validation device checks in
Rule P23 that, apart from a peak b assigned to a substance
by the second evaluation device B, there is no unknown peak
CA 02596381 2007-07-30
4 - 33 -
(that is to say a peak not assigned to any substance but
based only on non-specific integration of the total ion
current (=TIC)) within defined limit values (in particular
within the RI or RT, preferably RI), whose mass spectrum
also has a match quality (M2) above a defined limit value
with the reference mass spectrum of the substance assigned
to the peak b. A person skilled in the art understands the
expression TIC to be the total ion current, that is to say
the sum of the intensities of all the ions plotted against
time. For this rule, the defined limit values are likewise
small, that is to say a check is carried out in the immedi-
ate vicinity of the peak (b). The second evaluation device
B uses this rule to investigate peaks which are not as-
signed to target substances, that is to say which are un-
known. Unknown peaks such as these which occur in the imme-
diate vicinity of a peak which has already successfully
been checked for the same substance and also have a similar
mass spectrum are eliminated, since the unknown peak al-
ready exists as a peak of the target substance. This avoids
redundancy when the match quality of the mass spectra of
the unknown peak and peak b exceeds a stored limit value.
This is therefore a rule analogous to Rule P22.
In parallel with Rules 22 and 23, the validation device
uses Rules P24, P25 and P26, when using the second evalua-
tion device B, to check whether a peak b which has been as-
signed to a substance by the second evaluation device B is
in each case above a defined signal-to-noise ratio and a
substance-dependent and analysis-method-dependent signal
limit value for the limit of detection, the reporting limit
and the limit of quantitation, respectively, for the peak
b. These limits must be successfully reached by a peak
since, otherwise, it is of only inadequate quality in order
to be reliably assigned to one substance and to be reliably
quantitatively evaluated during the final analysis of the
CA 02596381 2007-07-30
- 34
data. This allows the measurement results for a sample to
be checked for disturbing impurities, measurement errors
and technical difficulties relating to the measurement.
The defined limits for the signal-to-noise ratios and the
blind values in these rules rise in the following sequence:
limit of detection, reporting limit, limit of quantitation.
The rules relating to the limit of detection P24 and the
reporting limit P25 are therefore applied successfully if
the Rules P26 relating to the limit of quantitation have
been successfully completed. If Rule P26 has been applied
with a negative result, then the peak for a substance can-
not reliably be quantitatively evaluated. If Rules P25 or
even P24 have also been applied with a negative result, the
peak can then be quantitatively evaluated only with low re-
liability (P25) or the assignment to a substance may even
be unreliable (P24), and the other rules possibly need then
not be evaluated.
The validation device releases the respectively success-
fully checked peaks of the deconvoluted mass spectra sig-
nals a and of integrated ions b for further analysis only
if all of the activated rules have been checked success-
fully.
The proposed method therefore reduces, possibly automati-
cally, the number of peaks to be analyzed in a chromatogram
or mass spectrum, since invalid peaks, which have been
blocked from or not released for further processing by the
method according to the invention, are identified as such.
This simplifies, speeds up and improves the analysis of
complex mixtures.
The method and system according to the invention can also
be included in a laboratory information management system
CA 02596381 2007-07-30
- 35
(LIMS), so that it is possible to check the sample tracking
data, such as fresh weight, measurement methods and se-
quence relationship. By way of example, this means that, in
parallel with the rules that have been explained, it is
possible to check whether a sample which has been fraction-
ated before the analysis has peaks in fractions which have
been marked as missing or as false measurements, for exam-
ple those which have been found to be false and marked
fractions during previous quality control of the measure-
ment data. This must not be the case, of course, and peaks
such as these must therefore be excluded from the further
analysis (Rule S2).
On the other hand, fractions which have been identified as
being present must have at least one peak in their spectra
(Rule CP1). If no peaks relating to an existing fraction
are accordingly found, then, if appropriate, a warning mes-
sage can inform the user of possible problems.
Furthermore samples which have no fresh weight (for example
errors in determining the fresh weight) can not produce
valid peaks (Rule S3). If a situation such as this occurs,
all of the peaks for that sample must be blocked from fur-
ther processing.
This process of embedding the check of the spectroscopic
data in a laboratory information system allows comprehen-
sive checking and sample tracking despite a large number of
samples, as is the situation nowadays for highthroughput
analysis.
Figures 2 to 7 show the application of Rules P8 and P20 by
the validation device to peaks b which the second evalua-
tion device B has assigned to an internal standard or a
substance X.
CA 02596381 2007-07-30
- 36 -
Figure 2 shows the plot for the retention index of the
peaks for a substance in different samples against the
identification number of the samples, with the substance
being an internal standard (ISTD), and with the second
evaluation device B having assigned the peaks to that stan-
dard. As can be seen, the retention index for the peak from
the internal standard in one sample (31232110.D) differs to
a major extent from those for the others, that is to say it
is not in the (predetermined) expected range. This peak is
therefore not suitable for use as an internal standard in
the corresponding sample, since an error has obviously oc-
curred in the measurement. Errors such as these can be cor-
rected by the validation device by using the activated Rule
P8 to invalidate the corresponding peak. As mentioned
above, Rule P8 results in invalidation of peaks for a sub-
stance which do not occur in the expected retention index
range.
Figure 3 shows the result of the validation device applying
Rule P8 to the samples shown in Figure 2. The peak with a
major discrepancy in the internal standard in the sample in
question has been invalidated, that is to say it is no
longer considered in the further processing. In order to
identify this, the data point or peak (circled in Figure 2)
has been removed from the graph (Figure 3). In order to im-
prove the representation, the scale of the graph has been
changed from that in Figure 2.
Figure 4 shows a corresponding view of the retention indi-
ces which have been assigned to a substance X by the second
evaluation device B in a plurality of samples, with these
being the same samples as those in Figures 2 and 3, but
with the difference that the investigation has been carried
out for the substance X rather than the internal standard.
CA 02596381 2007-07-30
- 37 -
,
This clearly shows that there are two groups of retention
indices. One group of indices is located around 710, while
the second group is arranged, with a somewhat broader scat-
ter, around the value 703. It is therefore probable that
this does not relate to a single substance X, but to two
different substances. By way of example, such an occurrence
of two groups of retention indices for the peaks assigned
to one substance in different samples can occur if peaks
are falsely assigned to the substance by the second evalua-
tion device B because the concentration of the substance in
the sample is too low. In this situation, it is therefore
also worthwhile for the validation device to apply Rule P8
in order to exclude one of the groups of retention indices
from further processing. In the present case, those peaks
whose retention index is outside the range from 709.9 to
710.9 are invalidated. Figure 5 shows the graph (on an
adapted scale) after application of Rule P8 and after re-
moval of invalidated peaks. These peaks in the second group
are now excluded from further processing (analysis and
evaluation) for the substance X.
Instead of the retention indices, Figure 6 shows the rela-
tive normalized area (intensity normalized with respect to
the internal standard) for the peaks assigned to the sub-
stance X, in the various samples. As can be seen, despite
the application of Rule P8 by the validation device, there
are still major discrepancies in terms of the relative area
of the peak, in one sample. It is therefore probable that
this value is erroneous. The sample is the same as the sam-
ple already marked in Figure 2, for which the internal
standard has been invalidated. In this case, the validation
device can then exclude falsely assigned peaks from further
processing by application of Rule P20. (According to Rule
P20, when the first and/or the second evaluation device A
CA 02596381 2007-07-30
- 38 -
or B, respectively, is used, a check is carried out to de-
termine whether a respective peak a or b assigned to a sub-
stance by the first or the second evaluation device A, B
has not been normalized with respect to a standard peak
(SP) which is not present or a standard peak (SP) which has
not been successfully checked by previously applied and ac-
tivated rules). As can be seen from Figure 7, this means
that the corresponding peak is invalidated in the sample in
question. The peak for the sample in question has therefore
been removed from the graph, and the scale for the graph
has been adapted once again.
Figures 8 to 10 show the application of Rules Si, S2 and P1
and P20 by the validation device to peaks which have been
assigned to a substance Y by the second evaluation device
B.
Figure 8 shows the retention indices for the peaks of dif-
ferent samples assigned to the substance Y by the second
evaluation device B. There are a plurality of groups of re-
tention indices for the peaks for the substance Y. This can
occur, for example, because different equipment (GCMS) has
been used for carrying out the chromatography and for re-
cording the mass spectra. A further reason may result from
the phases of the columns used. Although the same phases
are used in order to keep discrepancies in the results
small, it is nevertheless possible for discrepant results
(RI) to be obtained on different columns for one and the
same substance. This is a result, for example, of the dif-
ferent life and wear, contamination, phase material de-
struction (bleeding), temperature and/or pressure fluctua-
tions etc. Those skilled in the art will be familiar with
effects such as these, and their effects.
CA 02596381 2007-07-30
- 39 -
,
Once the validation device has applied Rule S2 in the LIMS,
samples which have been marked as erroneous or false are
invalidated, that is to say those samples for which an er-
ror has occurred during sample preparation or measurement
and has been noted and recorded in the LIMS (i.e. those
which may produce no peaks but have nevertheless been in-
cluded in the measurement and have been passed to the vali-
dation device) are invalidated. As illustrated in Figure 9,
a plurality of samples (circled in Figure 8) have been in-
validated in response to this. In the case of the high
throughput methods used nowadays in biological research, in
which several thousand samples must be processed and ana-
lyzed every day, it is possible for errors such as these to
actually occur and, if they are not detected, these errors
will subsequently frequently lead to consequential errors,
which are difficult to detect and rectify, during analysis.
The possibility for automatic invalidation of such false
samples at an early stage is therefore a major advantage
for HTP analysis.
If the validation device V applies Rule Si to the groups of
peaks illustrated in Figure 8, that is to say samples for
which at least one time standard has not been found or
which has not previously been successfully checked for by
means of Rule Pl, are invalidated, then this results in the
plot shown in Figure 10. In addition to one complete group
of peaks or samples (circled in Figure 8), further individ-
ual peaks (or samples) have also been invalidated which
would at least partially have already been invalidated in
parallel (independently) by Rule S2. Samples in which the
(obligatory) time standards have not been found offer only
poor capabilities for normalization and definition of the
retention indices, etc., so that it is quite worthwhile to
mark these as being erroneous or false, and thus to invali-
CA 02596381 2007-07-30
- 40 -
date them. If required, it may be possible to measure them
once again after checking.
Figures 11 and 12 show the application of Rule P21 by the
validation device to peaks which have been assigned to a
substance Z by the second evaluation device B.
Figure 11 shows a plot of the absolute area of the peaks
assigned to the substance Z for different samples. In the
illustrated example, the area of two peaks (circled) is
close to zero, or may be negative. By definition, a nega-
tive area cannot occur, and signals and peaks such as these
must therefore be excluded from further evaluation. The
validation device can use Rule P21 to check this, and to
invalidate peaks with negative areas. As can be seen in
Figure 12, both of the peaks in question from Figure 11 had
a negative area, and were therefore invalidated by the
validation device despite the assignment produced by the
second evaluation device B.
Figures 13 and 14 show the use of linear modeling to check
a substance W. The plot shows the retention index of the
peaks assigned to the substance W against the retention in-
dex of the peaks for the linear-modeling standard. As ex-
plained above, the validation device uses Rule P9a/b (or
Rule Pl6a/b) to check whether the linear model retention
index (LM-RI) and the retention index (RI) of a respective
peak b or a assigned to a substance by one of the two
evaluation devices B or A lie, within defined limits, on or
adjacent to a straight line, that is to say lie within a
corridor around a straight line.
The plot results approximately in a straight line, with, in
the illustrated situation, only minor discrepancies from
linear modeling throughout the entire retention index range
CA 02596381 2007-07-30
- 41
for the substance in comparison to the scatter occuring, as
can be seen from Figure 14, in which the linear regression
line and the limit values (Delta top/bottom) are shown. In
comparison to this, the scatter for the "normal" plot (see
Figure 15: RI against measurements) is so great that it is
impossible to reliably assign the peaks to the substance W.
The data point or peak (circled or a star) marked in Fig-
ures 13 to 15 could not be removed from the evaluation if
conventional methods or conventional procedures were used
(Figure 15). The data point in question is, as can be seen,
located in between the other valid points and therefore
cannot be directly selected for invalidation.
Linear modeling is highly suitable in particular for deter-
mining the identity of the assigned peaks for peaks located
closely adjacent to one another of substances such as those
which occur, for example, in the case of isomers with an RI
difference of less than 3, even though this would not be
feasible on the basis of the absolute retention indices.