Note: Descriptions are shown in the official language in which they were submitted.
CA 02628121 2008-04-17
BACKGROUND -
With the proliferation of cheap, standards-based wireless devices, the
popularity of wireless
networks has experienced an explosion in growth in the recent years. These
devices provide
untethered access to the Internet and this convenience has helped with the
spread of the
technology and helped create a critical mass of consumers.
The mobility of these devices spurs a new demand for ubiquitous wireless
availability and for
location based services. Ubiquitous wireless availability requires the
deployment of networks
where the radio environment is less than perfectly controlled, for example
public hot spots,
campus and urban deployments. Location services depend on locating the device
wherever it may
be. These services include emergency services, parents that wish to keep track
of their children,
personnel and asset tracking services and localized advertizing, to name a
few.
The most common deployed topology for end-user wireless communication consists
of Wireless
Client Stations (e.g. WiFi, WIMAX or cell phone user devices) which seek
connectivity to global
networks (e.g. the Internet or the telephony network) through a collection of
fixed base stations
1
CA 02628121 2008-04-17
(e.g. access points or cell towers). Thus a wireless device can access all the
resources of global
networks including access to other wireless devices connected to the global
network.
Place Lab has demonstrated the usefulness of using the very emitters used at
the fixed base
stations as beacons for locating the Wireless Client Stations. Based on the
signal strength of
beacons received by the wireless client station, Place Lab has demonstrated
position accuracies on
the order of 30m in urban areas with high densities of WiFi access points. In
close quarters such as
within an office environment accuracies of a few meters are possible. Since
the Wireless Client
Stations need awareness of the surrounding base stations signals to function,
they already have
the essential components to enable their geographical positioning. In addition
to cost savings over
using additional positioning hardware, these techniques work where GPS does
not, for example
indoors or in urban canyons.
Two basic approaches have been developed for computing position using scan
data, that is, the
measure of detected beacons and their signal strengths. Skyhook computes a
location for the
wireless client using a database of pre-calculated base station positions.
Alizadeh-Shabdiz , et al.
(US patent 7305,245 "Location-based services that choose location algorithms
based on number of
detected access points within range of user device") of Skyhook explains how a
variety of methods
can be used to estimate the location of a wireless station based on the known
position of access
points it sees in a scan. Ekahau, on the other hand, uses fingerprinting
techniques where the
pattern of base stations seen in a scan is matched to scan patterns at known
locations recorded in
a database. Myllymaki et aI. (US patent 7228136 "Location estimation in
wireless
telecommunication networks") of Ekahau explains how the position of a Wireless
Client Station can
be determined by matching its fingerprint to those collected at known
geographical positions.
Others such as Dressier et al. of Polaris Wireless (US Patent 7,167,714
"Location determination
using RF fingerprints") show how these methods can be extended with
probabilistic approaches.
In all cases, however, the location calculation requires a-priori surveys to
populate a database of
base station positions or to train a fingerprint matching system. These
surveys require specialized
equipment with accurate GPS or other form of independent positioning (for
example te Ekahau
surveyor allows the user to plot position manually on a map). The accuracy of
the survey also
2
CA 02628121 2008-04-17
depends on using calibrated or at least normalized radio sensors so that the
signal strengths
reported to the database are consistent.
Morgan et al. (US Patent Application 20060106850 "Location Beacon Database")
goes at great
length in teaching the survey methods to build an unbiased, reliable and
accurate data base of
access point locations. Minkyong et al. ("Risks of using AP locations
discovered through war
driving", Dartmouth College, http://www.cs.dartmouth.edu/-
minkyong/papers/minkyong-
pervasive06-v20060503.pdf) clearly points to the issues of uncontrolled
surveying as a basis for
location calculation using a variety of methods. This explains why Skyhook has
spent considerable
sums surveying urban centers of North America and elsewhere.
In wireless networks, surveys are also required for planning network
deployments, monitoring the
network's performance, diagnosing problem areas and engineering changes
through the networks
life cycle. Thus there is some overlap between the need of surveys for
engineering purposes and
as support for location based services.
Typically surveys are executed from motorized vehicles (in some cases bicycles
and rarely by foot)
and are therefore limited by access and time to public streets and paths.
Unfortunately these are
precisely the areas where Wireless Client Stations are unlikely to be used;
more likely locations
being, the offices, coffee shops, hotel rooms and homes where people work and
play. Inherently,
therefore, a-priori surveys for base station location and fingerprint training
are biased to where
mobile devices are unlikely to be used.
An additional problem is that even fixed base stations are not permanent. Some
will be disabled,
reconfigured or moved while new ones will be added. From our own measurements
we have
determined that the churn in WiFi access points in some urban environments is
on the order of
one year. Therefore, a-priori surveys can rapidly lose their value.
In summary existing techniques for wireless network engineering and wireless
client station
location rely on expensive dedicated a-priori surveys. These surveys require
specialized
equipment, the value of the surveys fades in time and the survey usually
cannot cover the actual
locations of network usage. In the following pages we will disclose methods
and systems which
3
CA 02628121 2008-04-17
eliminate the need for a-priori surveys, allowing the collection of necessary
data from ordinary
Wireless Client Stations in the course of their normal use. Advantages
include: fast and
inexpensive deployment; continuous update of network engineering and
positioning data; better
customer service; and improved of location services.
Location based services are also available for wired telecommunications like
the Internet. These
might be based on trace route analysis which identifies the address of each
router and times each
hop as a packet traverses the network form source to destination. Using the
fact that some well
known routers serve specific geographical regions, that some IP addresses are
allocated regionally
and that the speed of light constrains the transmission speed on each hop, it
is possible to get a
general indication of the source location for an IP address. This is used by
Google for example for
providing targeted advertizing or even tweak searches to provide results that
may be more
relevant to users based on their location, for example a specific state or a
urban center. Such
wired network location services typically cannot provide the precise
positioning information
available from wireless network location services.
SUMMARY OF INVENTION
The invention encompasses multiple components:
= Methods and systems for collecting survey data from Wireless Network
Stations without
GPS or other explicit location data;
= Methods and systems for normalizing survey data from uncalibrated sensors;
= Methods and systems for combining wireless network based position to improve
IP based
locations services; and
= Methods and systems for monitoring and managing wireless connectivity
services to
autonomous Client Stations.
All of these components are closely linked as will be explained in the context
of our preferred
embodiments.
4
CA 02628121 2008-04-17
Traditional wireless surveys use dedicated survey equipments including
positioning device(s) and
accurate radio receiver(s) that can measure the absolute signal strength from
Wireless Base
Stations. These may be assembled from off-the-shelf components, for example a
laptop computer,
a GPS receiver, a commercial Wireless Interface that may have been calibrated,
and software such
as Kismet or Netstumbler to collect and collate information. However, the
common end-user
Wireless Client Station is not so equipped.
Wireless Client Stations are rarely equipped with GPS o have their positions
otherwise known,
however, it can be expected that the fixed location of at least a few Base
Stations can be known
exactly and a-priori. Some service provider grade Base Stations include GPS
receivers so their
location can be obtained directly. In other cases one would know the position
from the Based
Stations because of their intended purpose (e.g. coffee shop hotspots) or
network engineering
specifications.
We will teach a methodology and system that allows surveying from and location
of Wireless
Stations not equipped with GPS. Instead we show how the relative proximity
among Base Stations
or Client Stations can be determined from scan data collected by these
stations; how to build a
Wireless Network Topology from scan data; how to build a Wireless Network Map
from the
topology an given a few reference Stations with known position; and how to
determine use the
Wireless Network Map to determine the position of Wireless Stations.
Our survey data consists of so called scan data which is implicitly be
collected by Wireless Client
Stations. Scan data identifies at a minimum surrounding Wireless Base Stations
available for
connection and typically a Radio Signal Strength Indication (RSSI) for each
one, to enable the Client
Station to select among available Base Stations the one with the best signal
to connect to. For this
purpose, RSSI only needs to be a relative measure of signal strength (i.e. be
a monotonically
increasing function of radio signal strength). Competitive commercial pressure
dictates that for
common end-user Wireless Interfaces, no special design or manufacturing effort
is placed on
making them more than just so.
Building a Wireless Network Topology does not absolutely require that the
scans inciude an RSSI,
but RSSI is nevertheless useful and can improve the accuracy of Wireless
Network Maps, locations
CA 02628121 2008-04-17
services and other analysis. It will further be evident to those familiar in
the art that a measure of
Absolute Radio Signal Strength can be even more advantageous.
To this effect we will further teach how to derive Absolute Radio Signal
Strength from RSSI in any
scan data. Basically this methodology and system uses absolute radio signal
measurements from
Base Stations to ground truth and calibrate the RSSI observed by Client
Stations. This takes
advantage of provider grade Base Stations, which are more, powerful,
sophisticated and expensive
than consumer grade products, and typically provide reliable absolute radio
signal measurements.
Many embodiments of the previous methods and systems will required the
exchange of packets
over the Internet. We teach a further set of methods and systems whereby
Internet addresses are
correlated to the location data determined from a wireless network to improve
the accuracy and
detail IP based location based services.
The previously discussed components of the invention will typically require
the installation of
additional functionality on end-user Wireless Client Station devices. This
additional functionality
would operate silently and invisibly to the end user apart from enabling
Location Based Services.
Respectful of privacy none of these components transact personal information
or requires anyone
to disclose their location.
This leads us to a fourth component of the invention that builds on this
silent functionality to
facilitate the management and delivery of Wireless Connectivity Services. We
the address the
problem of offering public connectivity service in difficult and variable
environments, without what
is commonly known as Customer Premise Equipment (CPE). In telecommunication
the CPE is a
known entity through which the Service Provider can monitor, diagnose and
configure the service
delivered directly to the end customer. In the case of Wireless Network
Providers and specifically
for WiFi services there is often no CPE as the Client Station may be a laptop
or other computing
device entirely controlled by the end-user. In these circumstances there is no
way for the Service
Provider to exactly monitor, diagnose and manage service problems experienced
by his
subscribers. We teach methods and systems to provide virtual CPE capability on
end-user
platforms, consisting of a program that performs the function of a CPE.
6
CA 02628121 2008-04-17
SUMMARY OF FIGURES
Figure 1 Definition of Wireless Network Nodes.
Figure 2 Illustration of Normalized Scan Signature and Base Station Signature
assembly.
Figure 3 Graph of proximity among Scan Vectors, among Base Stations, between
Scan Vectors
and Base Stations, and combined Network Proximity Topology graph for the
Network
Nodes illustrated in Figure 1.
Figure 4 Second order proximity defined as graph path length.
Figure 5 Location determination by path length weighed centroid method.
Figure 6 Local application of the weighed centroid method forming simultaneous
equations.
Figure 7 Force balance on a node.
Figure 8 Illustrative example of how RSSI reported by different Wireless
Client Interfaces relate
to received radio signal strength.
Figure 9 Illustrative example of two Reference Base Stations, a multiplicity
of Other Base
Stations and of one Wireless Client Station moving about these Base Stations.
Figure 10 System RSSI calibration with associated CS and RBS.
Figure 11 System RSSI calibration with active probing from the CS.
Figure 12 Logic for correlating an correcting SS for the RSSI calibration.
Figure 13 System for enhanced wired network location combined with wireless
network survey
system.
Figure 14 System for enhanced wired network location separate from a wireless
network survey
system.
7
CA 02628121 2008-04-17
DETAILED DESCRIPTION OF THE INVENTION
A SURVEYING WITHOUT THE BENEFIT OF GPS
A.1 DETERMINING RELATIVE NODE PROXIMITY
A first aspect of the invention consists of determining the relative proximity
of Wireless Network
Nodes. This aspect alone may find many applications, for example: location
based games where
proximity and not absolute position plays an important role; an emergency
locator using a virtual
range finder giving the user a indication, faster beeping for example, as he
approaches a target
node; smart advertisement systems that could sense the proximity of user
devices and address to
them specific locale based information. A key feature is that none of the
devices collaborating to
provide this function need to know or disclose a location in order to develop
a useful topological
map of the network.
There are three sub-components within the proximity determination:
1) Collecting scan information from Wireless Network Nodes;
2) Determining the relative proximity of nodes that are within radio reach of
each other;
3) Inferring the second order proximity of nodes that are not within radio
reach of each other,
but that can be connected through a series of other nodes that do see each
other.
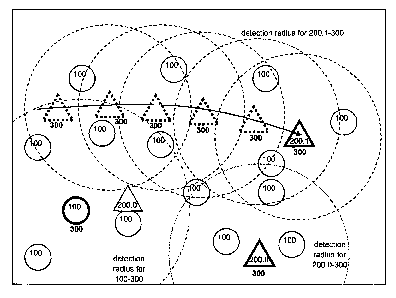
Figure 1 illustrates the various types of Wireless Network Nodes. Two basic
types of nodes are
Base Stations (100) or Client Stations (200). Base Stations (100) are assumed
fixed but should they
be mobile this fact can be detected by a method of the invention, and
appropriate steps taken to
correct the situation. Client Stations (200) can be mobile (200.1) or not
(200.0). A Scanning Nodes
(bold in Figure 1), can be either a Base Station (100) or a Client Station
(200) and is distinguished by
its capability to collect information about neighbouring Base Stations (100)
by scanning local radio
airwaves from time to time. For each detected Base Station (100) a unique
identifier (typically a
MAC address) and optionally other information such as an indication of radio
signal strength is
recorded; this defines a Scan Vector. Scan Vector, or more exactly Scan Vector
collection locations
8
CA 02628121 2008-04-17
(300) are shown in Figure 1. Since Scan Vector can be collected by mobile
stations, each one can
be uniquely identified by the identifier of the Scanning Node (typically a MAC
address) and a time
of scan collection.
By force, the Base Stations detected in a Scan Vector are known to be
proximate to the collection
point (300), and those that have stronger indication of radio signal strength
are likely to be closer
than others. A corollary is that any two Scan Vector that are similar, that is
they comprise the
same detected Base Stations (100), are known to have been collected in
proximity to each other.
Also, Base Stations (100) detected within the same Scan Vector are known to be
proximate to each
other.
Thus from time to time each Scanning Node collects from the local airwaves a
Scan Vector:
SUN = [ SSINb. SSINh === J;
where SSIn,;, SSIn;i and so on are a signal Strength Indication for Base
Stations BS;, BS and so on,
as seen in Scan Vector SVN.
Without limitations, the Signal Strength Indicator, SSI, may an actual Radio
Signal Strength
measured in dBm or as an energy flux, or it might be a relative un-calibrated
monotonic function of
Radio Signal Strength, or a ranking (denoting the node with the lowest signal,
the second lowest
signal, and so on to the highest), or in its simplest from it is simply 0 or
1, zero indicating that a
station is not detected and 1 indicating that it is. It will be appreciated
that the Scan Vector does
not list the stations it does not detect, and in the later case storing SSI
explicitly is not necessary: if
a station ID is listed, it's SSI is 1, and if not it is 0.
For the purpose of fingerprinting, that is matching the Scan Vectors that may
have been collected
from different Scanning Nodes at different times, it is advantageous to derive
a Normalized SSI,
NSSI, such that within the Scan Vector all values range from 0 to 1(or some
other fixed maximum).
This renders all Scan Vectors comparabie to some degree. Several methods of
scaling and
normalization may be used for example simple linear scaling, fitting a Poisson
distribution or just
applying a rank. As illustrated in Figure 2, a Scan with SSis of [-84, -45, -
63, -75] as might be
obtained from a 802.11 Wireless Interface could be normalized to [0.25, 1.0,
0.46, 0.34] with:
9
CA 02628121 2008-04-17
NSSI 1Ji 1 (SSIN,~ - maxJ(SSIN))
N'` + ax(jSSI-miS1N))
where the indices N, i denotes the ith Base Station detected within N`h Scan
Vector
I is the number of detected Base Stations in the Nth Scan Vector; and
max(SS1N) and min(SSIN) are the maximum and minimum SSI in the Nth Scan
Vector.
In this example, scaling by 1/(I+1) ensures that the smallest SSI does not
have a value of 0, which is
implicitly reserved for undetected nodes.
Thus each Scan Vector can be transformed into a Normalized Scan Signature:
NSSN = [ NSStn,,~ , NSSIn ;, ... J;
where NSStnr,;, NSSIn,f and so on, are the Normalized Signal Strength
Indicators for Base Station
node BS;, BS=and so on, as seen in scan vector SVN.
Two Scan Vectors with a very similar scan signature, NSSN and NSSM, are likely
to have been
collected close to each other. Also, the location where the Scan Vector, SVN,
was collected will be
close to where Base Stations node BS; , BSj and so on, are located, and likely
closer to those that
have a larger NSSI. If the location of at least some of the Base Station nodes
BS;, BSj and so on,
are known, then the position where the Scan Vector was observed can be
estimated by various
means. For example, the following expresses the weighed centroid method of
position estimation
in 2D:
f~ Ei NSSIN.I XBSi
s~," = Ei NSSIN,i
= Ei NSSIN,i I'BS,
~SV" Ei NSSINj
where XSV" and YSV" are the estimated X and Y coordinates of the Scan Vector
SVN, and
XBS, and YBS, are the known X and Y coordinates of Base Station BSi.
CA 02628121 2008-04-17
The accuracy of such position estimates depends partly on the spatial density
of Base Stations and
is typically 3m indoors and 15 m outdoors. Here and later the person familiar
in the art will
appreciate that other forms of weighing and methods of position estimates may
be used, and that
the formulation is trivially extended to 3 dimensions.
As illustrated in Figure 2, we can also derive Base Station Signatures from a
collection of NSS!
BSS, = f NSSIn,1, , NSSIm 1, ... J;
where NSSI,,, NSSIml and so on, are the Normalized Strength Indication for
Base Station BSI. as
seen in scan vector SVn, SVm and so on.
Two Base Stations BS1 and BSj with similar signatures will be close to each
other and are expected
to be locatable with comparable accuracy as Scan Vectors. Also, the Base
Station X will be close to
where the various Scan Vectors, SVn, SVm and so on, were collected, and likely
closer to those that
have a larger signal, NSSI. If the location of at least some of the Scan
Vector, SVn, SVõ, and so on,
are known, then the position of the Base Station can be estimated by various
means. For example,
the following expresses the weighed centroid method of position estimation in
2D:
Ei NSSIN,i Xes;
Xsv" Ei NSSINi
Yi NSSIN,i ~'es,
Ysv" _ 2:NSSI
i N,i
where 9sv" and Ysv" are the estimated X and Y coordinates of the Scan Vector
SVN, and
XBS, and YBsi are the known X and Y coordinates of Base Station BSi.
Note that the indices N, M and so on, identify Scan Vectors and not Scanning
Nodes since a-priori
the Scanning Nodes can be mobile so any two Scan Vectors (300) collects by the
same node could
be completely unrelated.
Various methods are admitted by the invention for quantifying the similarity
among Scan
Signatures NSS or BSS. Some use probabilistic and maximum likelyhood methods,
however, our
11
CA 02628121 2008-04-17
preferred embodiment defines a metric based on a normalized squared distance
between two
Scan Vectors can be determined by their signatures NSSN, NSSm as:
SSD = Zz(NSSIN NSSIM,i
42
Ei NSSIN,i NSSIM,i
where NSSIN; and NSS&,;are from the signatures NSSNand NSSMfor station BS;,
and
the signal NSSIx; from each Base Station BS;, is taken as a dimension in an
abstract space.
It is readily verified that as long as NSSI are all positive, SSD2NM = 0
implies an exact match of
NSSN and NSSM , while SSD2Nm = 1 results when none of the same bases stations
are present in
NSSNand NSSM An SSD2NMapproaching 1 is indicative of a separation distance on
the order of
a cell diameter (coverage area of a Base Station). Figure 3A illustrates how
the SSD2,,j can
define a graph relationship among Scan Vectors from the network of Figure 1.
Similarly the squared distance between Base Station can be determines by their
Signatures as:
E'(NSSIn NSSInI
BSD -
~,i NSSln1 NSSInj
where NSSI,,,i and NSSljare the NSSI from the signatures BSS~and BSSI , and
the signal NSSI,,,= from each Scan Vector NSS,, , is taken as a dimension in
an abstract
space.
BSD211 = 0 indicates a perfect match between the Base Station BSSI and BSSI,
perhaps because
they are collocated, while BSD21j = 1 means they are out of range of each
other with no single
scan containing both Base Stations BSSi and BSS1 and is indicative of a
separation distance on
the order of a cell diameter. Figure 3B illustrates how the BSD2,1 can define
a graph
relationship among Base Stations from the network of Figure 1.
The set of SSD2nrnr and BSD21f relate pairs of Scan Vectors amongst themselves
and pairs Base
Stations amongst themselves. Furthermore, one can link Scan Vectors to Base
Stations by
attributing to each a proximity metric given by:
12
CA 02628121 2008-04-17
SVD = I NSSI 2
, N,1 )
where NSSIn;I is the Normalized Signal Strength Indicator for Scan Vector,
SVN, observing Base
Station BS,.
The factor of 0.5 account for the fact that a near 0 NSSInri (marginal
detection) is indicative of a
distance equal to the cell radius, rather than the cell diameter. As for SSD2
and BSD2, a value of 0
for SVD2 is indicative of close proximity. Figure 3C illustrates how the
SVD2]j can define a graph
relationship between Scan Vectors and Base Stations from the network of Figure
1.
SSD ,, BSD , and SVD2n;1 are comparable proximity metrics for Scan Vectors
amongst
themselves, for Base Stations amongst themselves and for Scan Vectors with
Base Stations. These
proximity metrics can be assigned as the attribute of edges defining graphs
linking Scan Vectors to
themselves, for Base Stations to themselves and Scan Vectors to Base Stations.
Thus, with no a
priori knowledge of any Wireless Node position we have used a collection of
Scan Vectors to build
three graph topologies. As illustrated in Figure 3 D, these three graphs can
further be combined
into one to form one Wireless Proximity Topology graph. In this graph edges
with values of one
(1) are indicative of a separation roughly representative of a cell diameter
while an edge value near
zero (0) is indicative of collocation. In the Wireless Proximity Topology
graph the value of an edge
between nodes Kand L, is simply referred to as SD2xL, irrespective of the node
type.
It will be appreciated by persons familiar with the art that any one, or any
combinations of these
graphs can be used to represent a Wireless Proximity Topology graph, and that
other similar
graphs can be derived from Scan Vectors.
In applications where relative proximity rather than absolute position is
sufficient, the Wireless
Proximity Topology can be used directly to obtain an indication eparation
distance between any
two nodes. As illustrated in Figure 4 the path length, ZK,LSD rough the graph
is obtained by
adding the proximity attribute of each edge as they are traversed. The
shortest path between two
nodes is indicative of the distance between these two nodes and is
representative of how many
cells diameters separate the two end points.
13
CA 02628121 2008-04-17
If a path does not exist between two nodes then either they are each part of
two non contiguous
wireless service areas, or there are too few Scan Vectors accumulated yet to
characterize their
proximity. In a green field deployment it will initially be impossible to
determine proximity as no
connectivity graph yet exists a-priori, however, if all or a large number of
Client Station Nodes were
to be made Scanning Nodes with the addition of the appropriate program, the
graph would
progressively be build up as Scan Vectors were accumulated. In general
Wireless Networks are
designed to service many more Client Stations than there are Base Stations,
and one could expect
complete graph coverage within days.
The description of the invention assumes all Base Stations have similar ranges
or cell sizes,
however, this might not be the case, as for example one might be using FM
radio stations for long
range and WiFi for shorter range positioning. These can be accommodated by
attributing further
weights to the graph edges that reflect the relative range of the Base
Stations used. Similarly, if
the Scanning Nodes are calibrated to measure absolute radio signal strength,
the above procedure
can be adapted to use these rather than a Normalized Signal Strength
Indicator.
A.2 DETERMINING THE POSITION OF NODES
A second aspect of the invention consists of using the Wireless Proximity
Topology to infer the
absolute location of nodes from the known location of a few nodes. Several
techniques can be
applied for this purpose, including but not limited to:
= Weighed centroid technique, where the weights are determined by the length
of the
shorted path to each of the known locations;
= Weighed centroid technique, applied to each node and its neighbours, thus
forming a set of
simultaneous linear equations; and
= Formal optimization with cost function minimization.
The first is the simplest and may be sufficient in some applications or it
might provide an
appropriate starting point for the other solutions. As illustrated in Figure
5, it is a direct application
of the weighed centroid method, using the inverse path length to nodes with
known positions as
weights:
14
CA 02628121 2008-04-17
El t ~K,l S
9K Et K,l SD
~-3 El IK,l SD2
rK El K,l SD
where XK and YK are the estimated X and Y coordinates for a graph node K,-
Xt and Yt are the known X and Y coordinates of known graph nodes t, and
ZK,t SD2notes the cumulative length of the shortest graph path between nodes
Kand L
This path might be along SSD2, BSD2 and SVD2 edges or any combination of
these.
The usual techniques can be used to gua ainst division by zero in this
formula. The number of
nodes I or the maximum range ZK,l SD~be used in the calculation may be speci '
o limit
computations in this and other techniques. Also, various other functions of
x, SDL~i ht be
E
t g
used for weighing.
Another method applies the centroid method locally determining the location of
each node as a
function of its neighbours as illustrated in Figure 6 and expressed as
follows:
Et JCK, S
~'K=E t IISD
El YK,t SD
YK ZK,t D
where (X, ?)K are the estimated X and Y coordinates for a graph node K,
(X, Y)K,l are known (X, Y)K,t or estimated (X, Y)K,l coordinates for graph
node I directly
linked to Kby an edge, and
SD , denotes the edge length, whether SSD2, BSD2 or SVD2, linking node I
directly to
node K.
CA 02628121 2008-04-17
Since the equation for estimating (X, ?)K includes other estimated coordinates
(JC, Y)K,1 , the
problem consists of a set of simultaneous equations that is linear in (X, Y).
A variety of well known
solution methodologies exist to solve this problem.
On limitation of any technique based on the centroid method, is that the
estimated position will
always be within the largest polygon containing the known position nodes. This
is despite the fact
that information from the Wireless Proximity Topology may suggest otherwise.
This is alleviated in a third technique where the graph edges are modeled as a
mesh of
tension/compression element, the force along these elements being determined
by the proximity
metric, SD2, of the edge and the estimated distance between its two end
points. As an example,
the force along an edge linking nodes i and j nay be given by:
Fi j= x Dij - SD
where Kis a constant;
Djj =
i(Xi - Xj)+(Y - Y) the distance between nodes i and j; and
SD 's the proximity metric for the edge between nodes i and j.
A negative force is indicative of compression and a positive force of tension.
The constant, K,
defines an equivalence between distance and the proximity metric, SD2. the
2ace of other
constraints an edge would naturally relax (F=0) to a length of DtJ = SWith the
particular formulation we have used for SD2 earlier, setting K to the inverse
of the expected cell
diameter or to an empirically determining value is advantageous. Other
formulation for F and SD2
are admitted within the scope of the invention, the most important factors is
that smaller SD2 and
larger distance lead to greater tension and that the two cancel at some
equivalent value.
It is also advantageous to include additional compressive member between a
node K and
surrounding nodes that are not linked to it but are within a certain distance,
as:
F~~ =~=KD~ ~ - ~ for D= ~ < , =and
~~ ~~
16
CA 02628121 2008-04-17
FI.1 = 0 for DL-,I = > .
This introduces a repulsive force among nodes that are not linked by an edge
forcing them to
spread out as would be expected because nodes that are not connected by an
edge are also not
close to each other. The total of all the forces acting on a node K are
illustrated in Figure 7, and its
equilibrium position for node K is:
JCYt 9K,1FK,tIDK,I + Gm XK,mFK,m/DK,m
K =
2:1 FK,I/ DK,I + 2:m FK,m/ DK,m
_El YK,I FK,I / DK,I + Em YK,m FK,m ! DK,m
~K Gl FK1I/ DK,I + Em FK,m/ DK,m
where the summation El is over nodes linked to K by an edge,
the summation Y,,, is over nodes not linked to K but within a distance of 1/K.
(X, Y)K,l are known (X, Y)K,l or estimated (X, Y)K,l coordinates for graph
nodes
surrounding K,
DK,I denotes the distance between node Idirectly to node K.
Since the above equations for estimating (9, f')K includes other estimated
coordinates (X, ?)K,t
the problem consists of a set of simultaneous equations. In this instance,
however, the equations
are not linear in (X, Y).
Solution to the above force balance problem can be obtained by a variety of
finite differences or
finite element techniques which seek local minimization of force imbalances or
global minimization
of potential energy stored as tension and compression in the mesh.
The invention admits any technique by which a Network Proximity Topology is
combined with the
knowledge of the position of some nodes, to determine a plausible position for
all the other nodes.
In addition to the above, such techniques include various probabilistic,
optimization and simulation
methods. It is also possible to add other constraints to the problem, for
example, ruling out Base
17
CA 02628121 2008-04-17
Station positions over water bodies or in the middle of thoroughfares, or
applying probabilistic
constraints on the location of Scan Vectors based on displacement models.
In 2 dimensions at least 3 non-collinear nodes of known position must be
specified to
unambiguously solve the problem. In 3 dimensions 4 non-coplanar nodes are
needed. In practice
the specification of many more position representing a small fraction of all
nodes, say 10%, evenly
distributed over the network domain will provide the best solution. The
results can easily be
plotted in geographical coordinates or local coordinates such as on building
plans to provide a
Wireless Network Map.
A.3 DETERMINING A SIGNAL ATTENUATION MAP
In another aspect of the invention this map is further analyzed to infer
regions of signal
attenuation. This can be achieved by examining the ratio between the actual
length of edges in
the Network Map and their corresponding proximity metric in the Network
Topology. A small
length to proximity metric ratio is indicative of greater signal attenuation.
In the case where the
solution of a force balance equation is used in obtaining the Network Map, the
force values along
edges can be considered directly, compression being an indication of
attenuation.
In its simplest form a map of relative attenuation can be obtained by plotting
the above ratio or
force at the center point of each edge and suitably interpolating techniques
to produce a
continuous attenuation field over the domain of the Wireless Network Map.
Should the proximity metric be quantifiably related to absolute radio signal
strength, this signal can
be compared to what ideal radio propagation would predict for the distance
separating the nodes
at either end of the edge. The radio propagation model might be for simple
isotropic propagation,
might include ground effect and might also include antenna patterns.
Differences between
modeled and observed signal strength will provide an estimate of attenuation
in db along the
edge.
This attenuation along each edge of the graph represents an integral of the
attenuation over that
distance. This attenuation might be contributed uniformly over the edge length
or by discrete
obstacles separated by low attenuation. As illustrated in Figure 3 the
complete Network Topology
18
CA 02628121 2008-04-17
Graph is far from planar, that is multiple edges intersect each other. In
principle therefore it is
possible to determine attenuation on a shorter special scale than the edge
lengths. The problem
of finding a attenuation density distribution is an inverse problem not
dissimilar from determining
2D or 3D medical images from scanning devices such as ultrasound, CAT scan.
Many factors can contribute to attenuation including time varying
environmental factors
(precipitation and vegetation), moving interferer such a vehicles, and antenna
orientation of
portable devices; however, with sufficient sampling these can be filtered out
to obtain a map of
fixed interfering bodies such as topography and building. Constraints might be
placed on the
attenuation solution for example ruling out attenuation over open bodies of
water.
An Attenuation Map can in turn be used to help derive the Wireless Network Map
in the previous
aspect of the invention. Recall that in one embodiment the range of wireless
nodes is
parameterized as 1/x. In regions of attenuation this range and thus 1/x should
decrease.
Therefore the Attenuation Map can be used to define a spatially variable value
of ic and to
calculate a more reliable Wireless Network Map. Combining these processes maps
can be
generated that optimize both the distribution of network nodes and of
attenuation.
A.4 IDENTIFYING ANOMALOUS NODES
Yet another aspect of the invention is the examination of the Wireless Network
Topology or
Wireless Network Map to identify inconsistent nodes, for example Base Stations
that were
assumed fixed, which may be mobile, or have been moved. These will be
recognized by graph
edges whose range are beyond reason, for example WiFi Base Stations that
appear to be detected
at distances of more than 1 kilometer (i.e. edges in extreme tension), or
nodes in the graph that
appear to be linked to so many other nodes that it would imply an implausible
density of wireless
nodes. Such suspect nodes can readily be identified and removed from the graph
and a new
mapping solution derived. In the case where a Base Station has moved but
otherwise is not
mobile, it may be split into two virtual Base Stations with position depending
on the time frame
considered.
19
CA 02628121 2008-04-17
B SURVEYING WITHOUT CALIBRATED SENSORS
B.1 OVERVIEW
In the following we will teach a methodology to normalize data collected from
commercial un-
calibrated receivers such as the Wireless Interfaces embedded or installable
on common end-user
Wireless Client Station. This allows the direct comparison and analysis of
data collected from
multiple end-user platforms each of which may use a different and a-priori
unknown scale of Radio
Signal Strength Indication.
In the case of WiFi (wireless networks based on the 802.11 series of
protocols) Radio Signal
Strength Indication (RSSI) is often represented as negative number between -
100 and 0 in which
case it is also often assumed to have units of dBm or the standard unit of
radio signal intensity.
However this assumption is erroneous and comparison of RSSI reported by
different Wireless
Interfaces as a function of radio signal strength will show large
discrepancies, as illustrated in
Figure 8. The largest differences will occur between different brands and
models of Wireless
Interfaces typically using different chipsets, but these devices are generally
not calibrated at the
time of manufacture so even items of the same make and model will differ.
A component of our invention consists of methods, mechanisms and systems for
automatically
deriving the functional mapping
Absolute Radio Signal Strength = FX (RSSIX) ;
where: F. is the functional mapping for Wireless Interface X, and
RSSIXis the RSSI value reported by Wireless Interface X.
This mapping then allows reliable and reproducible measurement of radio signal
strength in a
Wireless Network, using common Wireless Interfaces on end-user Wireless Client
Stations.
This component of our invention requires that some Wireless Base Stations
detectable by the
Wireless Client Stations, be able to accurately measure received signal
strength and that this
measure be accessible for the purpose of the invention. These Wireless Base
Stations will be
referred to as Reference Base Stations (RBS); other Wireless Base Stations
will be referred to as
CA 02628121 2008-04-17
Other Base Stations (OBS). Wireless Clients Stations may be equivalently
referred to as Clients
Stations. In the WiFi (802.11 protocol) context, Base Stations would be known
as Access Points or
APs.
Figure 9 illustrates two Reference Base Stations (110), several Other Base
Stations (100) and one
Client Station (200).
Reference Base Stations are likely to be service provider devices, that is,
Wireless Base Stations
destined for the commercial offering of connectivity services, such as Hot
Spots or Wireless LAN
(WLAN). These devices require a level of robustness and manageability far
beyond end-user APs
for residential or SOHO use. Service-provider-grade Wireless Base Stations are
more expensive
and normally capable of accurately measuring the radio signal strength of
devices around them
(Wireless Base Stations and Wireless Client Stations) in order to improve
communication
diagnostics and manageability. Service provider Wireless Base Stations are
also typically accessible
through SNMP or other mechanism so that information they gather can be
accessed externally.
This method of the invention in its simplest form consists of:
1. Contemporaneously
a. measuring the absolute signal strength, SS110-200 , with which a Reference
Base
Station(110) detects a Client Station (200), and
b. recording the RSSI200-110 with which the Client Station (200) detects the
Reference Base
Station(110).
2. Building a correspondence table between the absolute signal strength (SS110-
200) and
RSStZO0-ii0from one or more instances of the above measurement.
3. Using the above correspondence table to recast any measurement of RSSI by
the Client
Station (200) into an absolute signal strength measurement for any Wireless
Base Station
(100 or 110).
Extensions of the method include correcting the signal strength (SS110-200) by
the difference in
radiative power between the Reference Base Station(110) and the Client Station
(200) so that
correspondence is established between RSSI and a Corrected Signal Strength
(CSS110-200)=
21
CA 02628121 2008-04-17
Further extensions of the method include in step 3 using the correspondence
table to estimate a
continuous functional relationship between Signal Strength (SS110-200 or
CSS110-200 ) and RSSlzoo-11o
through fitting, regression and/or interpolation techniques, which themselves
might include
without being limited to:
1. choosing a method or parameters of the functional relationship depending on
number of
Signal Strength and RSSI pairs in the table;
2. assigning a weight to each pair of (SS110-200 or CSS110-200 ) and RSSlZ0o-
zoo based on some
factor such as the time difference between the Signal Strength and RSSI
measurements;
3. determining the expected reliability and accuracy of the functional
relationship;
4. estimating the Signal Strength for a given RSSI from the functional
relationship; and
5. estimating the accuracy of the Signal Strength estimate for a given RSSI .
Further extensions of the method include:
1. comparing the correspondence table or functional relationship between
Signal Strength
(SS110-200 or CSS110-200 ) and RSSi2oo-iio for different Client Stations (200)
;
2. determining their similarity based on some property of the Client Stations,
for example the
make and model of their Wireless Interface; and
3. deriving a correspondence table or functional relationship between Signal
Strength
(SS110-200 or CSS110-200) and RSS1200-110 for a class of Client Station (200)
sharing that same
property.
A further extension of the method includes removing redundant, unreliable,
outlier or outdated
pairs of Signal Strength (SS110-200 or CSSllo-2oo ) and RSSI200-110 for a
Client Station (200).
Yet a further extension of the method consists of using a correspondence table
or functional
relationship between Signal Strength (SS110-200 or CSS110-200) and RSSlzoo-11o
for a class of Client
Station (200), either derived as above or obtained by other means, to recast
any measurement of
RSSI by a Client Station (200) into an absolute Signal Strength measurement
for any Wireless Base
Station (100 or 110) based on the membership to that class.
B.2 ASSOCIATED CLIENT STATION
22
CA 02628121 2008-04-17
We shall now describe the details of a system where the invention is put to
practice for networks
built upon the 802.11 (WiFi) standard. In this embodiment the Client Station
is required to be
Associated with a Wireless Base Station. This is a likely scenario for an
operator of an extended
Wireless Network such as on a campus, an urban area, or an office building,
wishing to better
monitor their network coverage area. Such an operator can require that Client
Stations associating
to his network include the program(s) needed to implement the invention.
According to Figure 10, Wireless Base Stations that are part of the operator's
Wireless Network are
referred to as Reference Base Stations or RBSs (110) and Wireless Client
Stations simply as Client
Stations or CS (200). There may also be Other Base Stations (100) within the
network coverage
area. Access to the operator's Wireless Network requires that that a CS (200)
be associated to a
RBS (110). Association is a negotiated relationship between the CS (200) and
the RBS (110) and in
the case of 802.11 systems is usually automatic. While associated the CS (200)
and the RBS (110)
continuously monitor RSSI and Signal Strength respectively to ensure a good
connection and
prepare to associate with an alternate Base Station (100 or 110) should the
signal drop below
acceptable levels. Signal Strength, or SS, measurements by RBSs (110) are made
in a logarithmic
scale of dBm.
A first program (225) logs the RSSI recorded by the CS (200) for its
associated RBS (110). This log
(226) might consist of recorded RSSI at some fixed time interval, or of
records of the time and
magnitude of changes in RSSI, or of a combination of the two, or based on any
other criteria.
A second program (205) logs the SS measured by the RBA (110) for the possibly
multiple CS (200)
associated to it. This log (206) consists of recorded SS at some fixed time
interval, or of records of
the time and magnitude of changes in RSSI, or of a combination of the two, or
based on any other
criteria.
A third program (245) collates the logs (206 and 226) to compute a joint
probability distribution
function, JPDF (246), of SS and RSSI for each CS (200). This JPDF counts the
number of times, or the
proportion of time, that a given pair of SS and RSSI occur together. With SS
and RSSI represented
as integers between -100 and 0 this discrete JPDF can in principle require up
to 10,000 elements,
but in practice less than 1,000 occur. It is also possible to group SS and
RSSI in bins of 2, 3 or 5, for
23
CA 02628121 2008-04-17
example, reducing storage by a factor of 4, 9 or 25 with little loss of
accuracy. Therefore, it is quite
feasible to store the discrete JPDF (246) for each CS (200) and this is more
scalable than preserving
all of the raw logs (206 and 226).
The previous step assumes that the transmission power of the Reference Base
Station(110) is the
same as that of the Client Station (200). Not illustrated is an optional
function to accommodate
differences in transmit power. This requires knowledge of the transmit power
of Reference Base
Station(110) and of the Client Station (200). These can be obtained from the
radio settings of the
RBS (110) and CS (200), or by referring to the manufacturer specification for
these devices, or by a
combination of the two, or by any other mean. The enhanced version of the
third program
computes a Corrected Signal Strength, or CSS, as follows:
CSS = SS + TXP110 - TXP200
where TXP110 is the transmit power of the Reference Base Station 110, and
TXP200 is the transmit power of the Client Station 200.
Hence, the discrete JPDF is computed for the CSS-RSSI pairs.
It will be evident to those familiar in the art that other corrections can be
made to the Signal
Strength, for example, in the case of a telecommunications system using
separate antenna for
transmitting and receiving, the above may be further enhanced to:
CSS = SS + TXP110 - TXP200 + TXAG110 - RXAG110 - TXAG200 + RXAG200
where TXAG and RXAG are the transmit and receive antenna gains for the
Reference Base Station
(110) and the Client Station (200).
Yet a fourth program (255) accepts as input a Client Station Identification
(likely its MAC address)
and a RSSI and uses the JPDF (246) to return a corresponding SS estimate.
Common methods of
using the JPDF (246) for this purpose include, but are not limited to,
regressing a line or curve
through the various SS-RSSI pairs weighed by their probability, or picking
directly from the JPDF
either the average, the most likely or the median SS given the RSSI.
Statistical methods for
evaluation the accuracy of the resulting SS estimate are commonplace, and such
accuracy estimate
can also be outputted.
24
CA 02628121 2008-04-17
It will be evident to those familiar in the art that the programs (205) and
(225) do not necessarily
run on the RBS (110) and CS (200), as they can be executed remotely on the
same or on different
computer platforms and access the data they require from the RBA (110) and CS
(200) through a
variety of means such as, but not limited to, SNMP or WMI (Windows Management
Instrumentation). Similarly the third and fourth programs (245, and 255) could
be run on the same
or on different computer platforms than the first two (201 and 221). Also, the
functions of all the
programs discussed above may be combined among themselves or with other
programs to form a
single computational unit fulfilling several functions. It will also be
evident that various
synchronization and optimization options are possible between and within these
programs, for
example in the case of program (255) regression coefficients might by pre-
computed rather than
calculated on-the-fly.
An operation might use the invention to obtain an exact measure of the Signal
Strength with which
CS (200) detects Other Base Stations (100) which may be rogue devices, that is
Base Stations that
do not belong to an operator. A common scanning or survey program could
determine the RSSI
with which CS (200) sees these Other Base Stations (100), and then translate
these into a
normalized Signal Strength as per the invention. Combining several of such
observations from
multiple Client Stations would allow more precise location of these rogue
devices.
B.3 ACTIVE SCANNING
We shall now describe another system whereby the invention can be put to
practice for networks
built upon the 802.11 (WiFi) standard. This one does not require association
between the Clients
Station and any Base Station. It uses active scanning (probing) and would be a
more likely
implementation in the context of a survey. Persons familiar with the art will
appreciate that the
invention is applicable to other wireless communication network with or
without active scanning.
According to Figure 11, in this implementation, Base Stations are divided
among Reference Base
Stations (110) or RBSs and Other Base Stations (100) or OBSs , and Wireless
Client Stations are
simply Client Stations or CS (200). All network nodes whether RBS, OBS or CS
are uniquely
identified by a MAC address an all messages exchanged between these nodes
carry a Source
Address, SA, and a Destination Address, DA, the latter possibly including a
wildcard or being a
CA 02628121 2008-04-17
broadcast address. Furthermore, all Base Stations (100 and 110) have one or
more Service Set
IDentifier (SSID) that identify the logical network they belong too. Signal
Strength, SS,
measurements by RBSs are made in a logarithmic scale of dBm.
The CS (200) include a program (221) that at some interval will cause it for
perform an active scan,
that is, it will send a Probe request (250) addressed to each SSID it knows to
comprise RBSs (110).
The Probe message has the SA of the CS (200) MAC, the broadcast DA. Hence the
program (221)
listen for Probe Responses (260), and for each of these compiles a Probe
Report (222) consisting of
the RSSI, the source MAC address of the corresponding RBS (110) and possibly
other parameters
from each of the received Probes (260), together with a time stamp, the MAC
address of the CS
(200) and potentially other information characterizing the CS (200).
The RBSs (110) receive the Probe Request (250) and if they recognize their
SSID must reply with a
Probe Response (260) according to the 802.11 protocol. The Probe Response
(260) has the SA of
the responding RBS (110) and the DA of the CS (220) that had originated the
Probe. Reference
Base Stations (110) include a second program (201) causing it to compile Probe
Report (202) for
each Probe Response (260) it sends, and consisting of the Signal Strength, the
source MAC and
possibly other parameters from each of the qualifying Probes Request (250) or
the CS (200) that
has originated the Probe Request (250), together with a time stamp, the MAC
address of the RBS
(110) and potentially other information characterizing the RBS (110).
In general the time difference between a Probe Request (250) and a Response
(260) is less than
lOms and can be neglected.
Not illustrated is the aspect that the program (221) of a CS (200) may address
Probe Requests (250)
to several SSIDs, and that zero, one or more RBSs (110) might respond to each
Probe Request
(250).
Figure 12 illustrates the function of a third program (241) collating the
Probe Reports (202 and
222). Within these reports, the program (241) searches for entries with the
same or proximate
time stamps and where:
~ the SA of an RBS Probe report (202) matches the CS_MAC in a CS Probe Report
(222); AND
26
CA 02628121 2008-04-17
= the SA of the CS Probe Report (222) matches the AP_MAC for that same AP
Probe Report
(222).
From the matched records, the program (241) constructs an SS-RSSI
correspondence record (242)
for that particular Client Station using the measured Signal Strength from AP
Probe Report and the
RSSI from the Client Station Probe Report.
The previous step assumes that the transmission power of the Reference Base
Station (110) is the
same as that of the Client Station (200). Figure 12 also illustrates an
optional function (243) to
accommodate differences in transmit power. This requires knowledge of the
transmit power of
Reference Base Station (110) and of the Client Station (200). These can be
contained in the
optional Other Data fields of the Probe Request Record, and Probe Records.
This is formation may
be obtained by programs 201 and 221 by accessing the radio settings of the RBS
(110) and CS
(200), or by referring to the manufacturer specification for these devices, or
by a combination of
the two, or by any other means. The optional function of program 241 hence
computes a
Corrected Signal Strength, CSS, as follows:
CSS = SS + TXPZ00 - TXPZZo
where TXP200 is the transmit power of the Reference Base Station200, and
TXP220 is the transmit power of the Client Station 220.
It will be evident to those familiar in the art that other corrections can be
made to the Signal
Strength, for example, in the case of a telecommunications system using
separate antenna for
transmitting and receiving, the above may be further enhanced to:
CSS = SS + TXP200 - TXP220 + TXAG200 - RXAG200 - TXAG220 + RXAGZZO
where TXAG and RXAG are the transmit and receive antenna gains for the
Reference Base
Station(200) and the Client Station (200).
Yet a fourth program, not illustrated, accepts as input a Client Station MAC
address (CS_MAC) and
an RSSI, and using the information from the SS-RSSI Correspondence Records
(242) for that Client
Station determine the Signal Strength, SS, equivalent to the RSSI.
27
CA 02628121 2008-04-17
It will be evident to those familiar in the art that the third program (241)
or fourth program might
be run on the Reference Base Station (110), on the Client Stations (200), or
on yet a third
computing device, and that the Probe Reports will need to be transferred from
one device to
another as required. Also, the functions of all the programs discussed above
may be combined
among themselves or with other programs to form a single computational unit
fulfilling several
functions. For example these programs can be commingled with functions that
actively or
passively scan for the RSSI of Other Base Stations (100), and thus provide
survey data to be
transformed to absolute Signal Strength data using the invention. It will be
further evident that
the illustrated content of the Probe Reports (202 and 222) are logical rather
than literal
representations, for example these may be implemented with relational tables
arranged in
different ways. As a further example Probe Reports for the same Client Station
(200) bearing the
same scan time stamp may be grouped together to avoid duplication of Time,
CS_MAC and
other_data fields. It will also be evident that the SS-RSSI Correspondence
records (242) might be
processed at their time of creation, at the time where translation is required
or at any other time
into some form that allows functional mapping between RSSI and SS.
A possible use of the invention in would be in a WiFi survey, where the Client
Station (200) is
mobile and scans the airwaves for the presence of all Base Stations (100 and
110). These scans
would record the RSSI with which each Base Stations (100 or 110) is detected
at various time.
Using the invention these RSSIs could be translated to Signal Strengths for a
much more reliable
mapping of coverage and location of WiFi devices. Furthermore surveys from
multiple CS (200)
would be consistent amongst each other and could be meaningfully combined.
C ENHANCED WIRED NETWORK LOCATION BASED SERVICES
C.1 OVERVIEW
We now describe a component of the invention that can serve to extend the
precision of IP or
other wired network location based services to the precision of a Wireless
Network location based
service as has been described previously or that is obtained by other means.
28
CA 02628121 2008-04-17
This component of the invention is particularly relevant to locating devices
within a residential or
SOHO private network, where a single public IP address is allocated to a
gateway router that
performs NAT or other distribution function so that all devices within the
private network can
access the Internet using the single public IP address.
Residential and SOHO private networks are physically small, typically less
than 30m. Wireless
Network Base Station (Access Points in 802.11 parlance) destined to
residential or SOHO
application are typically collocated or integrated with the gateway router,
and have a useful
wireless range of about 30m also. This is to say that locating a Wireless
Client Node connected to
such a Base Station or the Base Station itself is tantamount to locating any
device connected to the
same private network and using the same public IP address, within 30m. These
devices might
include IP-TV sets, VOIP phone sets, gaming consoles, computers and a variety
of other devices.
Location of home network equipment is vital to such services as e911 and
various other Location
Based Services for example targeted advertizing or location based gaming.
Although Internet
connectivity providers, for example cable or phone operators, keep or can
generate lists of street
addresses and IP addresses of the gateway and other equipment they provide to
subscribers.
Although Internet Connectivity Provider have access to the correspondence
between IP address
and street address of where they provide services, commercial and regulatory
constraints make
this information is either not accessible of very expensive to acquire.
As an alternative, users can input their location (e.g. street address, postal
code...) in a web-page,
and the web page can record IP address and MAC address of the routing
equipment where the
request originated. This is prone to a variety of errors, including
misdirection, and requires the
active participation of the end consumer. For example, in the event that an IP
address or MAC
address is re-assigned, the consumer must be involved to re-enter the
information. Some
consumers are suspicious and intentionally enter incorrect postal information.
The intent of this component of the invention is to legitimately acquire
position information for
these end-user devices, but without the a-priori consent of network service
providers, without
embedding location sensing technology in these devices, and without requiring
any overt action on
the part of consumers, and without requiring that end consumers compute or
disclose their
29
CA 02628121 2008-04-17
locations. A key aspect of this system is the devices collaborating to provide
this function need to
know or disclose a location in order to develop a useful map of the network.
C.2 METHOD FOR ENHANCED WIRED NETWORK LOCATION BASED SERVICES
The method of this aspect of the invention consists of:
a. Correlating the IP address used by a wireless network node with the
location estimated for
that device on the basis of proximity or detection of other wireless nodes;
b. Grouping all location estimates corresponding to the same IP address to
determine the
range of location associated to that address;
c. Providing a function whereby given an IP address, either a single estimated
likely location, a
mean for example, or a range of likely location is provided, in accordance to
the previous
grouping.
The method is further extended by automatically detecting when an IP address
might be
reallocated, and therefore old location data becomes irrelevant, when a new
location within a
group is drastically different from previous values. Several techniques can be
used for this
determination, including using a fixed threshold distance, for example if a
new location is more
than 100m away from previous ones, and using statistical methods, for example
if a new value is
more than 4 standard deviations away from the average of previous ones.
Furthermore, in the case where it can be determined that several Base Station
nodes are
associated with the same IP address, it is likely that this IP address is a
proxy for an extended
private subnet, for example a campus network rather than residential or SOHO
network. In such
cases the IP location will be known to be less precise.
It will be evident to any familiar in the art that the above methodology can
by directly extended to
considering IP subnets and their geographical coverage. It will also be
evident that the
methodology can be adapted to provide relative proximity information rather
than location
information.
C.3 SYSTEM FOR ENHANCED WIRED NETWORK LOCATION BASED SERVICE
CA 02628121 2008-04-17
An easily implemented system for this component of the invention is combined
with the surveying
methods disclosed previously. An illustrative example is provided in Figure 13
showing several
Base Stations (100) and Client Stations (200). The positions of a Particular
Client Station (135) and
a Particular Base Stations (135) are available or determinable by the methods
and systems
previously disclosed, or by some other means. In addition the Particular
Client Station (135)
contributes Scan Data (150) that may be part of the source of position data.
The particular Base
Station (130) is connected to an Internet Gateway/Router (140). User devices
Dl to D4 are also
connected to the same Gateway Router (140) so that when these devices
communicate over the
internet they all use the same IP address as does the Particular Client
Station (135).
The Particular Client Station (135) communicates a Scan Data (150) to an IP
Location Server (145)
over the Internet. The IP Location Server (145) may among other things also be
running the
various programs necessary to implement the Wireless Network Topology, Mapping
and Location
functions disclosed earlier. When the Location Server (145) received the data
packet containing
Scan Data (150) it can examine it's Internet Protocol header and determine the
source IP address.
This will be the IP address assigned to the Gateway/Router (140) and used by
devices Dl to D4 as
well as Particular Client Station (135). The Scan Data (150) contains among
other things the MAC
address identifying the Particular Client Station (135). The IP Location
Server (145) obtains a
location for the Particular Client Station (135) using this MAC address as
identifier by some means
which could be the systems disclosed earlier to build Wireless Network Maps
from the scan data
provided by various wireless network nodes (200, 100, 130, 135). Hence, the IP
Location Server
(145) can correlate this location with the IP address of the Gateway Router
(140). Multiple location
estimates for Scan Data (150) originating from the Particular Client Station
(135) can be used to
compute an average position, or other statistical parameters of position,
corresponding to the IP
address assigned to the Gateway/Router (140).
A better system can be implemented in the case where the Scan Data (150)
includes identification
of the MAC address of the Base Station it is associated with. This extra
information was not
mentioned previously (not essential for Wireless Node Positioning) but is
routinely available from
the regular scanning processing of Client Stations. From this information, the
IP Location Server
(145) can deduce that the Scan Data (150) was actually transmitted through a
Particular Base
31
CA 02628121 2008-04-17
Station with a specific MAC address. Using this MAC address as an identifier
the Location Server
can obtain a location that is likely more relevant to the Gateway/Router (140)
and its assigned IP
address. Hence, the Location Server can use the location of the Particular
Base Station (130)
instead of the Particular Client Station (135) for physically locating an IP.
The IP Location Server (145) can accomplish further tasks such as checking
that only the Particular
Base Station MAC address is associated with the Gateway/Router IP address,
confirming the
likelihood of a small localized network. Should the same Particular Base
Station MAC suddenly be
associated to a new IP address, then it is likely sign that the Gateway/Router
was assigned a new IP
address lease. In such a case, location data for the old IP address can be
transferred to the new
one.
Not illustrated is the mechanism by which and external entity might query the
IP Location Server
(145) with an IP address to have returned a location. Also the case where
multiple Client Stations
are associated to the Particular Base Station (135) is not illustrated but is
a trivial extension to the
invention.
System embodying the same functionality can be implemented differently from
above. A key point
being that any of the system described earlier for surveying Wireless Networks
without GPS or
calibrated sensors, require the exchange of information among network
entities. If any such
exchange occurs over the Internet or similar wired network these exchanges
will carry wired
network addressing data and the location data collected from the Wireless
Network can be used to
enhance positioning onto the Wired Network.
Figure 14 illustrate yet another system, where the enhanced wired network
location service is
implemented separately from the Wireless Network surveying activity. The only
information that
needs to be provided to the Locations Server (145) to enable enhance wired
network location, is a
packet (155) containing the MAC address of the Particular Base Station (130).
Figure 14 also shows
a separate Wireless Location Server (160) which given the MAC address for the
Particular Base
Station (130) returns the position (X, Y) of the Particular Base Station
(130). Hence, the IP Location
Server (145) correlates this position to the source IP address (or other wired
network address) of
the packet (155). In this scenario, the Particular Client Station (135) does
not need to send any
32
CA 02628121 2008-04-17
information about itself and thus can remains completely anonymous.
Furthermore, packet (155)
could be originated by the Particular Base Station itself and never involve
the Particular Client
Station (135).
Although illustrated as two independent elements, the IP Location Server (145)
and the Wireless
Location Server (160) may actually be components running on the same computer.
D VIRTUAL CPE
D.1 OVERVIEW
We now describe a component of the invention that serves to improve
manageability of wireless
networks by extending the intelligence of a wireless network to each user
devices connected to it.
Traditionally, managed wired networks are delivered to customers through a
physical port located
at the client premise and connected to a device managed by the network
operator; this managed
device is either located at the customer premise and often called "Customer
Premise Equipment",
or is located in a remote facility and extended to the customer premise by a
cable extension. This
enables network administrator to fully manage and re-configure each network
port in use by their
customers. By nature of wireless networks, these devices cannot be used to
manage wireless
medium since most customers will be connecting to wireless network using
portable devices (such
as laptops or PDAs) providing embedded wireless equipment that is not
manageable by network
operators.
This aspect of the invention is particularly relevant for managed wireless
networks comprising
many Base Stations (APs) but may also apply to single Base Stations,
especially is it is surrounded
by one or a plurality of other wireless Base Stations.
With the proliferation of wireless networks and equipment readily available on
most user devices,
connecting to a wireless network has become a ubiquitous task. Under these
circumstances, it is
expected that most locations, where users may desire to connect to a wireless
network, will likely
have a plurality of Wireless Network Nodes available for users to connect.
This is happening
because Wireless Internet Service Providers may compete among themselves to
get users
33
CA 02628121 2008-04-17
connecting to their own network, but also because corporations or homeowners
may have their
own Wireless Network Nodes deployed as well.
With this aspect of the invention, which is referred to as "Virtual Customer
Premise Equipment" or
"Virtual CPE", users and network operators will be able to better manage their
networks and
improve end user network performance. It is a natural extension and is
optimally used together
with the previously disclosed components of the invention.
In order to better understand the application scope of this invention, we will
consider as an
example a typical small town (Figure 15) which comprises a downtown area (100)
surrounded by
residential areas (200) and further surrounded by rural areas (300). Downtown
area comprises of
a high density of large wireless networks managed by Internet Wireless
Services Providers
operators (101), and a high density of managed corporate wireless networks
(102), all overlapping
or not. Residential Areas comprise a medium to low density of large wireless
networks managed
by Internet Wireless Services Providers operators (201), and a high density of
unmanaged SOHO
wireless networks (202), all overlapping or not. Rural Areas comprise a very
low density (or none)
of large wireless networks managed by Internet Wireless Services Providers
operators (301), and a
low density of unmanaged SOHO wireless networks (302), mostly non-overlapping.
In this context, users of wireless networks may require connection to one or a
plurality of
networks, managed or not. Typical operating systems available on wireless
devices provide basic
connectivity support enabling users to properly configure a wireless
connection, secure or not, to
wireless networks. To some extent, operating systems also provide basic
mechanisms to allow the
hardware platform to automatically change its connection point based on
specific local conditions
typically limited to link rate or signal level. What is lacking and is the
scope of the Virtual CPE
aspect of our invention is the function of a managed customer premise
equipment similar to those
used in wired networks, with sufficient intelligence to control the client
device to dynamically
adapt its connection point, based on advanced information consolidated with
neighboring client
devices similar information when available, as described below.
D2. BASIC COMPONENTS OF THE VIRTUAL CPE
34
CA 02628121 2008-04-17
The first component is the Virtual CPE itself, which comprises of a program
(firmware or software)
on an end user device which has the capability of:
= Monitoring status and performance counters for various parameters relevant
to
communication over a particular network interface;
= Issuing or receiving test traffic for the purpose of characterizing the
communication
performance and diagnosing communication problems over the particular network
interface;
= Controlling some aspects of the configuration of the particular network
interface to
optimize communication performance, enforce communication service level, or
improve
network performance; and
= From time to time, communicating or receiving communication from a remote
control
server.
A second component is a program (the Central Application) running on one or
distributed on a
plurality of server or any computational platforms, connected amongst
themselves or not, remote
from the end user devices, said Central Application having the capability of:
= From time to time, communicating or receiving communication from the
aforementioned
program on end user devices;
= Analyzing status, performance counters and test traffic reports form the end
user devices;
= From time to time, communicating with other devices running Central
Applications to
further analyze status, performance counters and test traffic reports form the
end user
devices; and
= Reporting on the status of communication for end user devices.
The Central Application may also be distributed on Wireless Network Nodes
themselves and
therefore not require to run on a server. For example, many of today's
Wireless Base Stations are
computational platforms that can execute advanced tasks and therefore are
perfectly capable of
performing basic tasks required by the Central Application as described above,
and also perform
advanced functions as described below.
CA 02628121 2008-04-17
This basic architecture enables the Client Application to provide network-
centric information to the
network operator that would not otherwise be available.
D3. ADVANCED FUNCTIONS OF THE VIRTUAL CPE INVENTION
Both components of the Virtual CPE aspect of this invention will be using the
gathered information
to perform advanced tasks requiring intelligent information acquired or
analyzed by other
elements running a Virtual CPE or Central Application components of this
invention.
The Virtual CPE component, residing on user devices, will be able to perform
enhanced functions
including but not limited to:
= make decisions about the configuration of the particular network interface;
= activate or deactivate itself depending on which network the particular
network interface is
connected to;
= obtain new control parameters or updates for its own logic, from some remote
server; and
= control operating parameters of a particular network interface, including
but not limited to
link rate, RTS/CTS, Fragmentation Threshold , or connection to available
Wireless Network
Nodes, enabling the end user device to always be connected to the most
efficient Wireless
Network Node available at this location and at this time.
It will be evident to those skilled in the art that through usage of a Virtual
CPE, many other
parameters of end user device can be controlled and further optimized.
The Central Application component will be able to perform enhanced functions
including but not
limited to:
= make decisions about the configuration of a particular network interface of
a particular end
user device and communicating this decision to the Virtual CPE program on the
end user
device; and
= modify the control parameters or updating the logic of the Virtual CPE
program running on
end user devices.
36
CA 02628121 2008-04-17
It will be evident to those skilled in the art that through usage of a Virtual
CPE, many other
parameters of end user device can be controlled and further optimized.
37