Note: Descriptions are shown in the official language in which they were submitted.
DEMANDE OU BREVET VOLUMINEUX
LA PRESENTE PARTIE DE CETTE DEMANDE OU CE BREVET COMPREND
PLUS D'UN TOME.
CECI EST LE TOME 1 DE 3
CONTENANT LES PAGES 1 A 38
NOTE : Pour les tomes additionels, veuillez contacter le Bureau canadien des
brevets
JUMBO APPLICATIONS/PATENTS
THIS SECTION OF THE APPLICATION/PATENT CONTAINS MORE THAN ONE
VOLUME
THIS IS VOLUME 1 OF 3
CONTAINING PAGES 1 TO 38
NOTE: For additional volumes, please contact the Canadian Patent Office
NOM DU FICHIER / FILE NAME:
NOTE POUR LE TOME / VOLUME NOTE:
CA 02634072 2008-06-16
WO 2007/071053 PCT/CA2006/002103
MARKERS FOR MEMORY T CELLS AND USES THEREOF
CROSS REFERENCE TO RELATED APPLICATIONS
[0001] This application claims the benefit, under 35 U.S.C. 119(e), of U.S.
provisional
application Serial No. 60/752,042 filed on December 21, 2005, which is
incorporated herein by
reference in its entirety.
FIELD OF THE INVENTION
[0002] The present invention relates to immune memory. More specifically, the
present
invention is concerned with reagents and methods for monitoring and modulating
the immune
response and memory T cells.
BACKGROUND OF THE INVENTION
[0003] The generation and maintenance of memory T cells is central to the
development
of protective immunity, as characterized by a rapid and vigorous response
following the
encounter with a given pathogen or antigen (Kaech, S.M et al., Nat Rev Immunol
2:251-262;
Sallusto, F et al., Annu Rev Immunol 22:745-763). Despite the complexity of
the memory T cell
populations, recent studies in both mice and humans indicate that the memory T
cell pool is
composed of two main compartments, central memory T cells (TcM) and effector
memory T cells
(TEM), which are characterized by distinct homing capacities and effector
functions (Sallusto, F.
et al., Nature 401:708-712; Fritsch, R.D. et al., J Immunol 175:6489-6497).
Through their
expression of CCR7 and CD62L, TcM preferentially home to T-cell areas of
secondary lymphoid
organs and display little immediate effector functions; however, they readily
proliferate and
differentiate to effector cells in response to antigenic stimulation. TEM,
which have lost the
constitutive expression of CCR7, express tissue homing receptors associated
with inflammation
and display more readily-effector functions.
[0004] The current model proposes that upon re-infection, TEM rapidly
constrain
pathogen invasion in inflamed peripheral tissues, whereas TcM are rapidly
activated by dendritic
cells (DCs) in secondary lymphoid organs and generate successive waves of
effectors able to
completely eliminate the pathogen (Sallusto, F et al., Annu Rev Immunol 22:745-
763).
[0005] Experiments performed in murine models suggest that TcM have a better
capacity
to reconstitute the memory T-cell pool and to mediate protective immunity than
TEM, due to their
greater capacity to proliferate and persist in vivo (Wu, C.Y. et al., Nat
Immunol 3:852-858, Zaph,
C. et al., Nat Med 10:1104-1110). Studies in primate models show that
induction of central
memory CD4+ T cells following SIV challenge correlates with prolonged survival
(Letvin, N.L. et
al., Science 312:1530-1533), thereby highlighting the importance of gaining a
better
CA 02634072 2008-06-16
WO 2007/071053 PCT/CA2006/002103
2
understanding of the mechanisms underlying TcM induction and persistence for
successful
vaccine development. The long-term maintenance of memory T cells relies on the
survival of
individual cells and their level of homeostatic cell division to compensate
for their gradual
attrition through apoptosis (Sallusto, F et al., Annu Rev Immunol 22:745-763;
Sad, S., and L.
Krishnan, Crit Rev Immunol 23:129-147). Using in vivo labeling with deuterated
glucose to
measure the turnover of distinct subsets of CD4+ T cells in healthy humans,
Macallan et al. have
shown that TEM have a more rapid turnover than TcM, suggesting that TEM are
being replaced at
a faster rate than TcM (Macallan, D.C. et al., J Exp Med 200:255-260).
[0006] Studies in mouse models have suggested that signaling through TCR and y-
chain cytokine receptors might play a role for long-term survival of memory T
cells (Seddon, B.
et al., Nat Immunol 4:680-686; Kondrack, R.M. et al., J Exp Med 198:1797-1806;
Patke, D.S.,
and D.L. Farber. J Immunol 174:5433-5443; Kassiotis, G. et al., J Exp Med
197:1007-1016). For
example, memory CD4 cells persisted for extended periods upon adoptive
transfer into intact or
lymphopenic recipients but not in IL-7-/- mice (Kondrack, R.M. et al., J Exp
Med 198:1797-1806).
Moreover, Kassiotis et al. have demonstrated that the homeostatic expansion
capacity of both
CD4+ naive and memory cells is dependent upon the expression levels of TCR and
CD5, a
negative regulator of TCR signaling (Kassiotis, G. et al., J Exp Med 197:1007-
1016).
[0007] Given the importance of memory T cells, and particularly central memory
T cells,
in the protection from various diseases such as infectious diseases, there is
a need to develop
new reagents and methods that influences their induction/maintenance and that
permits their
identification/detection.
[0008] The present description refers to a number of documents, the content of
which is
herein incorporated by reference in their entirety.
SUMMARY OF THE INVENTION
[0009] The invention relates to methods, products, uses and kits for
monitoring and
modulating the immune response and memory T cells.
[0010] The present invention provides a method of identifiying an agent
capable of (a)
inducing the level of memory T cells, (b) promoting the survival of memory T
cells, or (c) both (a)
and (b), comprising determining Foxo3a phosphorylation in the presence versus
the absence of
a test agent, wherein a higher level of phosphorylated Foxo3a in the presence
of the agent is
indicative that the agent is capable of (a) inducing the level of memory T
cells, (b) promoting the
survival of memory T cells, or (c) both (a) and (b).
[0011] In an embodiment, the above-mentioned phosphorylation is at a Foxo3a
residue
corresponding to Thr32, Ser253, Ser315, or any combination thereof.
CA 02634072 2008-06-16
WO 2007/071053 PCT/CA2006/002103
3
[0012] In an embodiment, the above-mentioned memory T cell is a central memory
T
cell (TcM).
[0013] In an other aspect, the present invention provides a method of
identifiying an
agent capable of (a) inducing the level of memory T cells, (b) promoting the
survival of memory
T cells, or (c) both (a) and (b), comprising determining the expression of one
or more nucleic
acids or polypeptides comprising a sequence selected from SEQ ID NOs: 10-201
in a biological
sample from an animal prior to versus after contacting the sample with a test
agent, wherein a
modulation of expression after contact with the agent relative to prior to
contact with the agent is
indicative that the agent is capable of (a) inducing the level of memory T
cells, (b) promoting the
survival of memory T cells, or (c) both (a) and (b).
[0014] In an embodiment, the above-mentioned memory T cells are central memory
T
cells, the above-mentioned modulation is an increase and the above-mentioned
one or more
nucleic acids or polypeptides comprises a sequence selected from SEQ ID NOs:
10-125 and
198-199.
[0015] In another embodiment, the above-mentioned memory T cells are effector
memory T cells, the above-mentioned modulation is an increase and the above-
mentioned one
or more nucleic acids or polypeptides comprises a sequence selected from SEQ
ID NOs: 126-
197 and 200-201.
[0016] In an embodiment, the level of expression of at least 2 nucleic acids
or
polypeptides is determined. In an embodiment, the level of expression of at
least 5 nucleic acids
or polypeptides is determined. In an embodiment, the level of expression of at
least 10 nucleic
acids or polypeptides is determined. In an embodiment, the level of expression
of at least 25
nucleic acids or polypeptides is determined. In an embodiment, the level of
expression of at
least 50 nucleic acids or polypeptides is determined.
[0017] In an embodiment, the above-mentioned one or more nucleic acids or
polypeptides comprises a sequence selected from SEQ ID NOs: 12-25, 38-39, 50-
53, 62-63,
82-83, 92-95, 100-107, 110-113, 126-129, 140-151, 154-169 and 174-187.
[0018] In an embodiment, the above-mentioned one or more nucleic acids or
polypeptides comprises a sequence selected from SEQ ID NOs: 12-25, 38-39, 50-
53, 62-63,
82-83, 92-95, 100-107 and 110-113.
[0019] In an embodiment, the above-mentioned one or more nucleic acids or
polypeptides comprises a sequence selected from SEQ ID NOs: 126-129, 140-151,
154-169
and 174-187.
[0020] In an embodiment, the above-mentioned method further comprises
determining
the expression of one or more genes or polypeptides encoded thereby set forth
in Figure 2B.
CA 02634072 2008-06-16
WO 2007/071053 PCT/CA2006/002103
4
[0021] In an other aspect, the present invention provides a method of
identifying an
agent capable of inducing protective immunity in an animal, comprising:
(i) providing a first expression profile of one or more nucleic acids or
encoding polypeptides selected from BIRC5, CALM1, CAMK2G,
CaMKIINalpha, DC-UbP, FAIM2, FOXL2, GATA2, GATA3, IL-7R, IRF1,
KIT, MAPK6, MAPKAPK3, , RAB11B, STMN1, TNFRSF7 (CD27), CLK1
and PRKARI B in a biological sample from an animal prior to contacting
the sample with a test agent;
(ii) providing a second expression profile of one or more nucleic acids
encoding a polypeptide selected from BIRC5, CALM1, CAMK2G,
CaMKIINalpha, DC-UbP, FAIM2, FOXL2, GATA2, GATA3, IL-7R, IRF1,
KIT, MAPK6, MAPKAPK3, RAB11B, STMN1, TNFRSF7 (CD27), CLK1
and PRKARI B in a biological sample from an animal after contacting the
sample with the test agent;
(iii) providing a reference expression profile associated with the expression
of
one or more nucleic acids encoding a polypeptide selected from BIRC5,
CALM1, CAMK2G, CaMKIINalpha, DC-UbP, FAIM2, FOXL2, GATA2,
GATA3, IL-7R, IRF1, KIT, MAPK6, MAPKAPK3, RAB11B, STMN1,
TNFRSF7 (CD27), CLK1 and PRKARI B in a biological sample from an
animal exhibiting protective immunity;
wherein increased similarity of the second expression profile to the reference
expression profile,
relative to the first expression profile to the reference expression profile,
is indicative that the
agent is capable of inducing protective immunity.
[0022] In an other aspect, the present invention provides a method of
identifying an
agent capable of inducing protective immunity in an animal, comprising
determining the
expression of one or more nucleic acids or polypeptides selected from BIRC5,
CALM1,
CAMK2G, CaMKIINalpha, DC-UbP, FAIM2, FOXL2, GATA2, GATA3, IL-7R, IRF1, KIT,
MAPK6,
MAPKAPK3, RAB11B, STMN1, TNFRSF7 (CD27), CLK1 and PRKARI B in a biological
sample
from an animal prior to versus after contacting the sample with a test agent,
wherein a
modulation of expression after contact with the agent relative to prior to
contact with the agent is
indicative that the agent is capable of inducing protective immunity.
[0023] In an embodiment, the above-mentioned modulation is an increase and the
above-mentioned one or more nucleic acids or polypeptides is selected from
BIRC5, CALM1,
CAMK2G, CaMKIINalpha, DC-UbP, FAIM2, FOXL2, GATA2, GATA3, IL-7R, IRF1, KIT,
MAPK6,
MAPKAPK3, RAB1 1 B, STMN1 and TNFRSF7 (CD27).
[0024] In an other embodiment, the above-mentioned modulation is a decrease
and the
CA 02634072 2008-06-16
WO 2007/071053 PCT/CA2006/002103
above-mentioned one or more nucleic acids or encoding polypeptides is selected
from CLK1
and PRKARI B.
[0025] In an embodiment, the above-mentioned agent is a vaccine.
[0026] In an embodiment, the above-mentioned subject exhibiting protective
immunity is
a subject vaccinated with a vaccine known to confer immune protection. In a
further
embodiment, the above-mentioned vaccine is Yellow Fever vaccine.
[0027] In an embodiment, the above-mentioned method comprises providing the
expression profile of at least 2 nucleic acids or polypeptides.
[0028] In an embodiment, the above-mentioned method comprises providing the
expression profile of at least 5 nucleic acids or polypeptides.
[0029] In an embodiment, the above-mentioned method comprises providing the
expression profile of at least 10 nucleic acids or polypeptides.
[0030] In an embodiment, the above-mentioned biological sample is a tissue or
body
fluid. In a further embodiment, the above-mentioned biological sample is blood
or comprises a
blood cell. In a further embodiment, the above-mentioned blood cell is a
Peripheral Blood
Mononuclear Cell (PBMC). In a further embodiment, the above-mentioned
Peripheral Blood
Mononuclear Cell (PBMC) is an immune cell. In a further embodiment, the above-
mentioned
immune cell is a CD4+ or CD8+ memory T cell. In a further embodiment the above-
mentioned
memory T cell is a central memory T cell (TcM).
[0031] In an embodiment, the above-mentioned level of expression or expression
profile is determined at the nucleic acid level using a technique selected
from the group
consisting of Northern blot analysis, reverse transcription PCR, real time
quantitative PCR,
microarray analysis and RNase protection.
[0032] In an other embodiment, the above-mentioned level of expression or
expression
profile is determined at the polypeptide level. In an other embodiment, the
above-mentioned
level of expression or expression profile of the polypeptide is determined
using a reagent which
specifically binds with the polypeptide. In a further embodiment, the above-
mentioned reagent is
an antibody or an antigen binding fragment thereof.
[0033] In an other embodiment, the above-mentioned level of expression or
expression
profile is determined using a method selected from the group consisting of
Western blot,
immunoblot, enzyme-linked immunosorbant assay (ELISA), radioimmunoassay (RIA),
immunoprecipitation, surface plasmon resonance, chemiluminescence, fluorescent
polarization,
phosphorescence, immunohistochemical analysis, matrix-assisted laser
desorption/ionization
time-of-flight (MALDI-TOF) mass spectrometry, microcytometry, microarray,
microscopy,
fluorescence activated cell sorting (FACS), flow cytometry and antibody
microarray.
CA 02634072 2008-06-16
WO 2007/071053 PCT/CA2006/002103
6
[0034] In an other aspect, the present invention provides a method of inducing
the
survival of a memory T cell, said method comprising contacting said cell with
an agent capable
of phosphorylating Foxo3a.
[0035] In an other aspect, the present invention provides a method of
increasing
immune function in a subject, said method comprising inducing the
phosphorylation of Foxo3a
in an immune cell of said subject.
[0036] In an embodiment, the above-mentioned immune function is memory T cell
function. In a further embodiment, the above-mentioned memory T cell function
is memory T cell
survival or persistence.
[0037] In an other aspect, the present invention provides a method of
determining
whether an HIV-positive subject possesses natural resistance to the
development of AIDS, said
method comprising:
(i) providing a first expression profile of one or more nucleic acids encoding
a polypeptide selected from XIAP, GADD45, DUSP1, PTEN, SOCS1 and
SOCS2 in a biological sample from said subject,
(ii) providing a reference expression profile of said one or more nucleic
acids
in a biological sample from a reference subject known to be an HIV-positive
long
term non-progressor,
wherein a similarity of the first expression profile to the reference
expression profile is indicative
that the HIV-infected subject possesses natural resistance to the development
of AIDS
[0038] In an other aspect, the present invention provides a collection of two
or more
isolated nucleic acid sequences which are substantially identical to two or
more isolated
respective nucleic acid sequences encoding two or more respective polypeptides
selected from
SEQ ID NOs: 10-201, their complements or portions thereof.
[0039] In an embodiment, the above-mentioned collection comprises at least 5
isolated
nucleic acid sequences encoding at least 5 polypeptides, their complements or
portions thereof.
[0040] In an embodiment, the above-mentioned collection comprises at least 10
isolated
nucleic acid sequences encoding at least 10 polypeptides, their complements or
portions
thereof.
[0041] In an embodiment, the above-mentioned collection comprises at least 25
isolated
nucleic acid sequences encoding at least 25 polypeptides, their complements or
portions
thereof.
[0042] In an embodiment, the above-mentioned collection comprises at least 50
isolated
nucleic acid sequences encoding at least 50 polypeptides, their complements or
portions
thereof.
CA 02634072 2008-06-16
WO 2007/071053 PCT/CA2006/002103
7
[0043] In an embodiment, the above-mentioned collection comprises isolated
nucleic
acid sequences encoding all polypeptides defined above, their complements or
portions thereof.
[0044] In an embodiment, the above-mentioned isolated nucleic acid sequences
are
immobilized on a substrate.
[0045] In an embodiment, the above-mentioned isolated nucleic acid sequences
are
conjugated to a detectable marker.
[0046] In an embodiment, the above-mentioned isolated nucleic acid sequences
are
hybridizable array elements in a microarray.
[0047] In an other aspect, the present invention provides an array comprising
a
substrate and a collection of bound nucleic acids, each of said nucleic acids
being bound to said
substrate at a discrete location, wherein said collection of bound nucleic
acids is the collection
defined above.
[0048] In an other aspect, the present invention provides a composition for
the
prevention or treatment of an immune disease in a subject, said composition
comprising:
(i) an agent capable of (a) phosphorylating Foxo3a in an immune cell,
(b) increasing the expression of one or more nucleic acids or
encoding polypeptides comprising a sequence selected from SEQ
ID NOs: 12-25, 38-39, 50-53, 62-63, 82-83, 92-95, 100-107 and
110-113, (c) both (a) and (b), in said subject; and
(ii) a pharmaceutically acceptable carrier.
[0049] In an other aspect, the present invention provides a use of the above-
mentioned
composition for the prevention or treatment of an immune disease.
[0050] In an other aspect, the present invention provides a use of the above-
mentioned
composition for the preparation of a medicament for the prevention or
treatment of an immune
disease.
[0051] In an other aspect, the present invention provides a use of an agent
capable of
(a) phosphorylating Foxo3a, (b) increasing the expression of one or more
nucleic acids or
encoding polypeptides selected from comprising a sequence selected from SEQ ID
NOs: 12-25,
38-39, 50-53, 62-63, 82-83, 92-95, 100-107 and 110-113, (c) both (a) and (b)
for the prevention
or treatment of an immune disease.
[0052] In an other aspect, the present invention provides a use of an agent
capable of
(a) phosphorylating Foxo3a, (b) increasing the expression of one or more
nucleic acids or
encoding polypeptides comprising a sequence selected from SEQ ID NOs: 12-25,
38-39, 50-53,
62-63, 82-83, 92-95, 100-107 and 110-113, (c) both (a) and (b) for the
preparation of a
CA 02634072 2008-06-16
WO 2007/071053 PCT/CA2006/002103
8
medicament for the prevention or treatment of an immune disease.
[0053] In an other aspect, the present invention provides a package comprising
the
above-mentioned composition together with instructions for its use for the
prevention or
treatment of an immune disease.
[0054] In an other aspect, the present invention provides a package
comprising:
(i) an agent capable of (a) phosphorylating Foxo3a, (b) increasing the
expression of one or more nucleic acids or encoding polypeptides
comprising a sequence selected from SEQ ID NOs: 12-25, 38-39, 50-53,
62-63, 82-83, 92-95, 100-107 and 110-113, (c) both (a) and (b) in a
subject; and
(ii) instructions for its use for the treatment or prevention of an immune
disease in said subject
[0055] In an embodiment, the above-mentioned immune disease is immune
deficiency.
In a further embodiment, the above-mentioned immune deficiency is a deficiency
in a memory T
cell. In a further embodiment, the above-mentioned memory T cell is a central
memory T cells
(TcM). In a further embodiment, the above-mentioned central memory T cells
(TcM) is a CD4+
central memory T cell.
[0056] In an embodiment, the herein-mentioned nucleic acid, polypeptide or
gene is
associated with apoptosis and/or cell survival including any pathway related
thereto. Examples
of such genes are set forth in Figure 3.
[0057] Other objects, advantages and features of the present invention will
become
more apparent upon reading of the following non-restrictive description of
specific embodiments
thereof, given by way of example only with reference to the accompanying
drawings.
BRIEF DESCRIPTION OF THE DRAWINGS
[0058] Figure 1: Functional and phenotypical characterization of CD4+ TcM and
TEM.
(A) CD45RA, CD27 and CCR7 labeling profile and gating strategy for naive, TcM
and TEM.
Percentages obtained for each population are indicated. Purity of sorted cells
was always above
95%. (B) Perforin and Granzyme-B (Gr-B) expression in ex-vivo TcM and TEM
subsets. Perforin
and Gr-B expression were assayed by intracellular staining. The percentages of
TcM and TEM
expressing Perforin and Gr-B are indicated in each quadrant. (C) Rab27a
protein levels in ex-
vivo sorted TcM and TEM subsets. Similar results were obtained in three
independent
experiments. (D) Susceptibility of TcM and TEM towards Fas-induced apoptosis.
TcM and TEM
were sorted by flow cytometry and treated with anti-Fas antibodies (CH11: 1.25
g/ml) or
etoposide (100 g/ml) for 24 hours. The percentage of apoptotic cells was
assessed by flow
cytometry using Annexin-V labeling. The results are depicted as a percentage
of apoptotic cells
CA 02634072 2008-06-16
WO 2007/071053 PCT/CA2006/002103
9
f SD of three independent experiments. (E) Proliferation and persistence of
purified TcM and
TEM. Sorted TcM and TEM were co-cultured with autologous mature dendritic
cells in the presence
of superantigen (staphylococcal enterotoxin A, SEA) for 15 days. After 1 to 15
days, the
proportion of proliferating cells was assessed by staining of anti-TCRV(322,
as V(322 is known to
be a highly SEA-reactive V(3 (Lavoie PM et al., 2005. Int. Immunol., 17(7):931-
41). Results are
represented as the % of V(322 positive cells.
[0059] Figure 2. Gene expression profiling of CD4+ TcM and TEM. CD4+ T cell
subsets
(central and effector memory) were purified from blood samples collected from
healthy
individuais by flow cytometry-based cell sorting using monoclonal antibodies
directed against
CD4, CD45RA, CCR7 and CD27. Messenger RNA (mRNA) was isolated from sorted CD4+
TcM
and TEM, converted into cDNA and gene expression was analyzed by cDNA
microarray. A. List
of most significant genes differentially expressed between TcM and TEM. B.
List of other genes
whose expression differs between TcM and TEM. Genes expressed at higher level
in TEM as
compared to TcM are highlighted in grey. Each gene on the arrays was performed
in duplicate to
avoid false-positive signals. Fold change values were obtained from the
average value of 13
independent hybridizations. The p-values were determined by ANOVA, based on F-
test. Avg
FDE = Average fold difference in expression in TcM vs. TEM (positive numbers
represent genes
having a higher expression in TcM whereas negative numbers represent genes
having a higher
expression in TEM.
[0060] Figure 3. Differential expression of apoptosis-related genes in CD4+
TcM
and TEM. Significant genes were selected using ANOVA t-test (p<0.05 or fold
change >1.3) and
associated with an "apoptosis" GO annotation. Each gene on the arrays was
spotted in
duplicate to avoid false-positive signals and to ensure the reproducibility of
the data obtained.
The fold-change values were obtained from the average value of thirteen
independent
hybridizations (AVG FC). The genes upregulated in TEM are highlighted in grey.
The p-values
were determined by ANOVA, based on F-test. Fold change values were calculated
from the
average value of thirteen independent hybridizations by subtracting the mean
expression of the
log2 ratio obtained in TcM from the log2 ratio obtained in TEM. That value was
then converted
into fold change.
[0061] Figure 4. Quantification of gene expression in CD4+ TcM and TEM by RT-
PCR.
CD4 T cell subsets (central and effector memory) were purified as described
above. Messenger
RNA (mRNA) was isolated from sorted CD4+ TcM and TEM, converted into cDNA, and
the
expression of selected genes (listed in the first column) was analyzed by
quantitative RT-PCR
using primers specific for each gene. The primers were synthesized by Applied
Biosystems
based on the following context sequences:
CDKN1 B(p27kip): AACCGACGATTCTTCTACTCAAAAC (SEQ ID NO: 1);
CA 02634072 2008-06-16
WO 2007/071053 PCT/CA2006/002103
CD27: GCACTGTAACTCTGGTCTTCTCGTT (SEQ ID NO: 2);
GADD45a: TGCGTGCTGGTGACGAATCCACATT (SEQ ID NO: 3);
DUSP6: CCATTTCTTTCATAGATGAAGCCCG (SEQ ID NO: 4);
PIM2: TCCCCCTTGTCAGACTCAGTCACAT (SEQ ID NO: 5);
pRb2/p130: ATTTTGACAAGTCCAAAGCACTTAG (SEQ ID NO: 6);
FasL: GAAGCAAATAGGCCACCCCAGTCCA (SEQ ID NO: 7);
Bim: TCAGTGCAATGGCTTCCATGAGGCA (SEQ ID NO: 8);
LKLF: CTGCAGGAGCGCTGGCCGCGCGCCG (SEQ ID NO: 9)
The numbers indicate the fold up-regulation of transcript level in TcM vs. TEM
(second column) or
TEM vs. TcM (third column), following normalization to GAPDH and Actin levels.
These results
represent the average value of two independent experiments performed on sample
from two
different blood donors.
[0062] Figure 5. STAT5a signaling pathway is functionally upregulated in TcM.
(A)
PIM-1 and PIM-2 proteins levels in ex-vivo sorted TcM and TEM subsets. Similar
results were
obtained in three independent experiments. (B, C and D) PBMCs from healthy
donors were
treated with IL-2 (100 U/ml) or IL-7 (10 ng/ml) for 15 min at 37 C. Cells were
then labeled with
Abs to CD4, CD27, CCR7, CD45RA and pSTAT5a. (B) Representative example of
pSTAT5a
expression levels. TcM-gated cells are represented in light grey and TEM-gated
cells are
represented in black. (C) Mean Fluorescence Intensity (MFI) of pSTAT5a level
of expression
measured in response to IL-2 or IL-7, in TcM and TEM (n=4). Mean pSTAT5a
signal values are
represented by black bars. P-values (determined by a two-tailed T-test) are
shown (D)
Expression level of CD127, CD25 and CD132 in ex-vivo TcM and TEM. PBMCs were
labeled with
Abs to CD4, CD27, CCR7 and CD45RA to identify T cells subsets in conjunction
with anti-
CD127 or anti-CD25 specific Abs. The results represent the proportions of
CD127 and CD25
positive cells on TcM- and TEM-gated T cells (% of positive cells SD of five
independent
experiments).
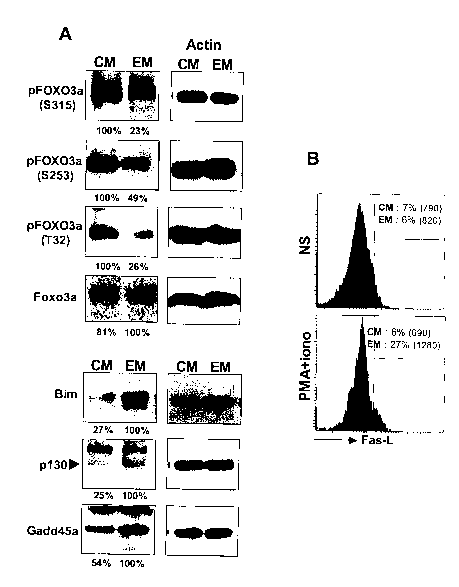
[0063] Figure 6. Regulation of the FOXO3a pathway in memory CD4+ T cell
subsets. (A) FOXO3a, pFOXO3a (S315, S253 or T32), Bim, p130 and Gadd45a
protein levels
in ex-vivo sorted TcM and TEM. (B) Expression of FasL on activated TcM and
TEM. PBMC were
activated with phorbol myristate acetate (PMA) (10 ng/ml) and lonomycin (500
ng/ml) for 24
hours. Intracellular staining was performed using CD4, CD27, CD45RA, CCR7 and
FasL
antibodies. The percentages of FasL positive cells for each subset are
indicated. MFI values are
indicated in brackets.
[0064] Figure 7. AKT and IKK mediate FOXO3a phosphorylation and survival in
CD4 T cell. (A) Regulation of FOXO3a phosphorylation. Purified CD4+ T Cells
were pre-treated
for 1 hour with kinase inhibitors (AKT-VI, AKT inhibitor: 10 M; STO-609,
CamKK inhibitor: 5
CA 02634072 2008-06-16
WO 2007/071053 PCT/CA2006/002103
11
g/ml; Wedelolactone, IKK inhibitor: 100 M and U0126, MEK1/2 inhibitor: 50
M). pFoxo3a
(S253) was assessed. The results are representative of two independent
experiments. (B) CD4+
T cell susceptibility to apoptosis induced upon treatment with specific kinase
inhibitors. CD4+ T
cells were cultured in the presence of kinase inhibitors for 24 hrs (U0126:
100 M; STO-609: 10
g/ml; Wedelolactone and AKT-IV as indicated). After 24h, the proportion of
Annexin-V+,
propidium iodide (PI)+ cells was quantified by flow cytometry. The results are
depicted as a
percentage of apoptotic cells within the total population and are
representative of two
independent experiments. (C) Bim expression levels in response to AKT and IKK
inhibitors.
CD4+ T cells were treated with AKT-IV (1.6 M) or wedelolactone (100 M) for
24h. Cells were
analyzed by Western Blot (WB) using Bim specific antibodies. (D and E)
Regulation of AKT and
IKK phosphorylation in CD4+ memory subsets. (D) pIKKa(3 (S176/180) protein
levels in ex-vivo
sorted TcM and TEM. Prolonged exposure did not reveal any pIKK signal in TEM.
Similar results
were obtained in three independent experiments. (E) PBMCs, from healthy
donors, were treated
with H202 (5 mM) or Ig-cross-linked CD28 (2 g/ml) for 15 min at 37 C and
labeled with CD4,
CD27, CD45RA and pAKT (S473) specific antibodies. The levels of pAKT were
assessed by
flow cytometry in TcM- and TEM-gated subsets. The results are represented as
the mean fold
increase SD, calculated as (MFI of stimulated cells/MFI of un-stimulated
cells) of five
independent experiments. Values of p (determined by two-tailed T-test) are
shown.
[0065] Figure 8. Susceptibility of TcM and TEM to apoptosis induced by kinase
inhibitors. Sorted TcM and TEM were cultured with or without AKT and IKK
inhibitors as
indicated. After 24h, the percentage of apoptotic cells was quantified by
Annexin-V-FITC
labeling. Upper panel depict Results from a representative individual.
Histogram plots show the
percent of Annexin-V positive cells in TcM and TEM cells following a 24h
exposure to AKT or IKK-
inhibitors. The dashed lines correspond to untreated cells while the plain
lines correspond to
cells treated with kinase-inhibitors. Lower panel is a bar graph
representation of the fold
increase of apoptosis in TcM and TEM in response to IKK or AKT inhibitor. The
fold increase of
apoptosis is calculated as % of apoptotic cells in treated cells divided by
the % of apoptotic cells
in untreated cells. Similar results were obtained in two independent
experiments.
[0066] Figure 9. FOXO3a phosphorylation is induced by TCR and cytokine
engagement. (A) CD4+ T cells were cultured in the presence of anti-CD3 (2
g/ml), anti-CD28
(2 g/ml), anti-CD3+CD28, IL-2 (100 U/ml), IL-7 (10 ng/ml), IFN-y (50 g/ml)
or PMA (50 ng/ml)
for 15 min and analyzed by Western Blot for pFOXO3a (S315 and S253) expression
levels. The
results are representative of two independent experiments. (B) CD4+ T cells
were cultured in the
presence of anti-CD3/anti-CD28, IL-2 (100 U/ml), IL-7 (10 ng/ml) for 30 min
and analyzed by
Western Blot for pFOXO3a (T32) expression levels. Similar results were
obtained in two
independent experiments.
CA 02634072 2008-06-16
WO 2007/071053 PCT/CA2006/002103
12
[0067] Figure 10. Comparison of the expression of selected genes in TcM and
TEM
isolated from aviremic HAART-treated HIV-infected individuals vs. long-term
non-
progressors (LTNPs) Cells were sorted from PBMC obtained from LTNP and
aviremic
HAART-treated patients into TcM and TEM using CD27, CCR7 and CD45RA surface
markers.
Sorted cells were subjected to RNA isolation, amplification and gene array
analysis. This figure
shows differences in TcM and TEM from LTNP versus TcM and TEM from aviremic
chronically
infected HIV patients.
[0068] Figure 11. Comparison of the expression of genes in blood samples
isolated from Yellow Fever-vaccinated individuals. Blood samples were
coilected at different
time points (before vaccination (day 0), day 3 and 7 post-vaccination) from 8
subjects
vaccinated against Yellow Fever (Yellow Fever 17D vaccine).
DESCRIPTION OF ILLUSTRATIVE EMBODIMENTS
[0069] In the studies described herein, the gene expression profile of
subpopulations of
memory CD4 T cells was analyzed. It was found that several genes are
differentially expressed
in central memory T cells (TcM) vs. effector memory T ceils (TEM), notably
genes associated with
cell survival/apoptosis. TcM tend to express higher levels of specific genes
associated with cell
survival and inhibition of apoptosis, whereas TEM generally express higher
levels of genes
associated with induction of apoptosis.
[0070] Accordingly, the present invention relates to monitoring/detecting as
well as
modulating memory T cells based on such correlation of gene expression.
[0071] The invention provides a screening method for identifying
agents/compounds
that can be used for (a) induce the level of memory T cells, (b) promote the
survival of memory
T cells, or (c) both (a) and (b) based on their ability to phosphorylate
Foxo3a. In an
embodiment, the method comprises determining Foxo3a phosphorylation in the
presence
versus the absence of the agent. A higher level of phosphorylated Foxo3a in
the presence of
the agent is indicative that the agent is capable of (a) inducing the level of
memory T cells, (b)
promoting the survival of memory T cells, or (c) both (a) and (b). In an
embodiment, the
phosphorylation of Foxo3a is at a Foxo3a residue corresponding to Thr32,
Ser253, Ser315, or
any combination thereof. The extent of Foxo3a phosphorylation can be
determined, for
example, using antibodies specific for one or more phosphorylated forms of
Foxo3a (see
Example 6).
[0072] In another embodiment, the method comprises determining the expression
of
one or more nucleic acids encoding a polypeptide selected from HLA-G, MAL,
NGFRAP1,
HRMT1L2, ATXN3, TNFRSF7 (CD27), ING1, E2F4, RELA, TOSO, INDO, SFRP4, PABPC1,
CA 02634072 2008-06-16
WO 2007/071053 PCT/CA2006/002103
13
ARL7, PIM2, TAP1, CD37, LPPR4, IMPDH2, LOC112476, TGFBR2, CCNL1, GRK5, Stat5a,
RALA, CSTB, SNFILK, CAV1, MYO1E, B2M, NFIC, SYT6, RRM1, OAS1, IMPDH2, DMGDH,
PNRC2, LIMS1, PARVG, FYN, LILRA2, FTL, SOCS1, PF4, ERG, IFIT1, NCOR2, IL16,
TCIRG1, PITPNB, PABPC4, MAN2A1, SPN, TNFRSF8, RFX2, RGS13, LTA4H, S100A8,
TCF3, TIAM1, CART, PPP2R2C, PIAS4, PRKCQ, NME2, SLC2A3, ATF4, iL2RG, COL3A1,
PPM1D, SEC23A, LIMK2, BAT3, RGS10, STAT6, RASL12, C1QG, GPR18, NOTCH3,
C1orf38,
BTF3, CCL19, PES1, C1QA, ZNF593, TNF-a, POLD2, DTYMK, E2FI, STAU, IFNGR2,
NRG1,
TNFSF7, JARID1A, BLR1, PLCL2, MK167, IDUA, FEZ1, MAPKAPK5, DLC1, MAP4K2, VAV3,
BATF, BIRC6, CEP2, DDAH2, PLK4, GTF2F2, FADS1, FHIT, SPOCK, TLK1, DDX5, NGFR,
FYB, USP10, TCF7, RAMP1, AGPAT5, EDA, PPP3CC, HNRPK, TPR, CHUK, ANXA1,
SMARCA4, CLK1, CCL3, CALM3, ALOX5, LCN2, NUP88 and LKLF in a biological sample
from
an animal prior to versus after administration of a test agent/compound to the
subject, or in a
biological sample from an animal or prior to versus after contacting the
sample with a test agent.
A higher level of expression following the administration is indicative that
the agent is capable of
capable of (a) inducing the level of memory T cells, (b) promoting the
survival of memory T
cells, or (c) both (a) and (b).
[0073] In an embodiment, the above-mentioned memory T cells are central memory
T
cells (TcM). In a further embodiment, the above-mentioned central memory T
cells are CD4+
central memory T cells.
[0074] The agents/compounds identified by these screening methods can be used
for
the prevention or treatment of immune disorders, and more particularly immune
deficiencies
associated with low levels of memory T cells.
[0075] In another aspect, the present invention provides a method of
determining
whether an agent (e.g., a vaccine or an immunotherapeutic agent) is capable of
inducing
protective immunity in an animal, comprising:
(i) providing a first expression profile of one or more nucleic acids encoding
a
polypeptide selected from BIRC5, CALM1, CAMK2G, CaMKIINalpha, DC-UbP, FAIM2,
FOXL2,
GATA2, GATA3, IL-7R, IRF1, KIT, MAPK6, MAPKAPK3, , RAB11B, STMN1, TNFRSF7
(CD27), CLK1 and PRKARI B in a biological sample from said animal prior to
administration of
the agent to the subject, or in a biological sample from an animal prior to
contacting the sample
with the agent,
(ii) providing a second expression profile of one or more nucleic acids
encoding a
polypeptide selected from BIRC5, CALM1, CAMK2G, CaMKIINaIpha, DC-UbP, FAIM2,
FOXL2,
GATA2, GATA3, IL-7R, IRF1, KIT, MAPK6, MAPKAPK3, , RAB11B, STMN1, TNFRSF7
(CD27), CLK1 and PRKARI B in a biological sample from said animal following
administration of
the agent to the subject, or in a biological sampie from an animal after
contacting the sample
CA 02634072 2008-06-16
WO 2007/071053 PCT/CA2006/002103
14
with the agent,
(iii) providing a reference expression profile associated with the expression
of
one or more nucleic acids encoding a polypeptide selected from BIRC5, CALM1,
CAMK2G,
CaMK1lNalpha, DC-UbP, FAIM2, FOXL2, GATA2, GATA3, IL-7R, IRF1, KIT, MAPK6,
MAPKAPK3, , RAB11B, STMN1, TNFRSF7 (CD27), CLK1 and PRKARI B in a biological
sample from an animal exhibiting protective immunity; wherein increased
similarity of the
second expression profile to the reference expression profile, relative to the
first expression
profile to the reference expression profile, is indicative that the agent is
capable of inducing
protective immunity.
[0076] The screening methods mentioned herein may be employed either with a
single
test compound/agent or a plurality or library (e.g. a combinatorial library)
of test compounds. In
the latter case, synergistic effects provided by combinations of compounds may
also be
identified and characterized. The above-mentioned compounds may be used for
inducing the
level of memory T cells and/or promoting the survival of memory T cells, or
may be used as lead
compounds for the development and testing of additional compounds having
improved
specificity, efficacy and/or pharmacological (e.g. pharmacokinetic)
properties. In an
embodiment the compound may be a prodrug which is altered into its active form
at the
appropriate site of action, e.g. in lymphoid organs. In certain embodiments,
one or a plurality of
the steps of the screening/testing methods of the invention may be automated.
[0077] Expression levels may in general be detected by either detecting mRNA
from the
cells and/or detecting expression products, such as polypeptides and proteins.
Expression of
the transcripts and/or proteins encoded by the nucleic acids described herein
may be measured
by any of a variety of known methods in the art. In general, the nucleic acid
sequence of a
nucleic acid molecule (e.g., DNA or RNA) in a patient sample can be detected
by any suitable
method or technique of measuring or detecting gene sequence or expression.
Such methods
include, but are not limited to, polymerase chain reaction (PCR), reverse
transcriptase-PCR
(RT-PCR), in situ PCR, quantitative PCR (q-PCR), in situ hybridization,
Southern blot, Northern
blot, sequence analysis, microarray analysis, detection of a reporter gene, or
other DNA/RNA
hybridization platforms. For RNA expression, preferred methods include, but
are not limited to:
extraction of cellular mRNA and Northern blotting using labeled probes that
hybridize to
transcripts encoding all or part of one or more of the genes of this
invention; amplification of
mRNA expressed from one or more of the genes of this invention using gene-
specific primers,
polymerase chain reaction (PCR), quantitative PCR (q-PCR), and reverse
transcriptase-
polymerase chain reaction (RT-PCR), followed by quantitative detection of the
product by any of
a variety of means; extraction of total RNA from the cells, which is then
labeled and used to
probe cDNAs or oligonucleotides encoding all or part of the genes of this
invention, arrayed on
CA 02634072 2008-06-16
WO 2007/071053 PCT/CA2006/002103
any of a variety of surfaces; in situ hybridization; and detection of a
reporter gene. The term
"quantifying" or "quantitating" when used in the context of quantifying
transcription levels of a
gene can refer to absolute or to relative quantification. Absolute
quantification may be
accomplished by inclusion of known concentration(s) of one or more target
nucleic acids and
referencing the hybridization intensity of unknowns with the known target
nucleic acids (e.g.,
through generation of a standard curve). Alternatively, relative
quantification can be
accomplished by comparison of hybridization signals between two or more genes,
or between
two or more treatments to quantify the changes in hybridization intensity and,
by implication,
transcription level.
[0078] Methods to measure protein expression levels of selected genes of this
invention, include, but are not limited to: Western blot, immunoblot, enzyme-
linked
immunosorbant assay (ELISA), radioimmunoassay (RIA), immunoprecipitation,
surface plasmon
resonance, chemiluminescence, fluorescent polarization, phosphorescence,
immunohistochemical analysis, matrix-assisted laser desorption/ionization time-
of-flight (MALDI-
TOF) mass spectrometry, microcytometry, microarray, microscopy, fluorescence
activated cell
sorting (FACS), flow cytometry, and assays based on a property of the protein
including but not
limited to DNA binding, ligand binding, or interaction with other protein
partners.
[0079] Methods for normalizing the level of expression of a gene are well
known in the
art. For example, the expression level of a gene of the present invention can
be normalized on
the basis of the relative ratio of the mRNA level of this gene to the mRNA
level of a
housekeeping gene or the relative ratio of the protein level of the protein
encoded by this gene
to the protein level of the housekeeping protein, so that variations in the
sample extraction
efficiency among cells or tissues are reduced in the evaluation of the gene
expression level. A
"housekeeping gene" is a gene the expression of which is substantially the
same from sample
to sample or from tissue to tissue, or one that is relatively refractory to
change in response to
external stimuli. A housekeeping gene can be any RNA molecule other than that
encoded by
the gene of interest that will allow normalization of sample RNA or any other
marker that can be
used to normalize for the amount of total RNA added to each reaction. For
example, the
GAPDH gene, the G6PD gene, the actin gene, ribosomal RNA, 36B4 RNA, PGK1,
RPLPO, or
the like, may be used as a housekeeping gene.
[0080] Methods for normalizing/calibrating the level of expression of a gene
are well
known in the art. For example, the expression of a gene can be calibrated
using reference
samples, which are commercially available. Examples of reference samples
include, but are not
limited to: Stratagene QPCR Human Reference Total RNA, ClontechT"~ Universal
Reference
Total RNA, and XpressRefT"' Universal Reference Total RNA. Other methods are
also
described in Steinhoff and Vingron, Brief Bioinform. 2006 7(2):166-77; Fujita
A. et al., BMC
CA 02634072 2008-06-16
WO 2007/071053 PCT/CA2006/002103
16
Bioinformatics. 2006. 7:469; and Tallat AM et al., Nucleic Acids Res. (2002).
30(20):e104, which
are hereby incorporated by reference in their entireties.
[0081] Further, the normalization and calibration of gene expression may be
performed
in a straightforward manner for predictive models that involve pairs of
predictive genes in
competitive relationships, i.e. ratio of gene 1 over gene 2 in a predictive
gene pair, obviating the
need for additional reference genes. Instead of reporting the level of a
predictive gene with
respect to a separate housekeeping gene and/or reference sample, the level of
predictive gene
1 with respect to predictive gene 2 directly provides for a relative
expression measurement ratio
with high information content.
[0082] Gene expression profiling or monitoring is a useful way to distinguish
between
cells that express different phenotypes. For example, cells that are derived
from different
organs/tissues, have different ages or different physiological states. In an
embodiment, gene
expression profiling can distinguish between different types or subsets of
memory T cells. In an
embodiment, gene expression profiling can distinguish between different types
of immune
responses, for example a protective versus a non-protective immune response.
[0083] Expression profile: One measurement of cellular constituents that is
particularly
useful in the present invention is the expression profile. As used herein, an
"expression profile"
comprises measurement of the relative abundance of one or more cellular
constituents. Such
measurements may include RNA or protein abundances or activity levels. An
expression profile
involves providing a pool of target nucleic acid molecules or polypeptides,
hybridizing the pool to
an array of probes immobilized on predetermined regions of a surface, and
quantifying the
hybridized nucleic acid molecules or proteins. The expression profile can be a
measurement, for
example, of the transcriptional state or the translational state of the cell.
See U.S. Patent Nos.
6,040,138, 6,013,449 and 5,800,992, which are hereby incorporated by reference
in their
entirety.
[0084] Similarity, with respect to gene expression profiles, means that the
genes whose
expression is measured exhibit the same trend in expression, and is not
limited to absolute
equivalence in expression levels. For example, two different samples in which
a given gene
shows a higher expression than an internal control would be considered to have
"similar"
expression profiles. In an embodiment, at least one gene exhibits the same
trend in expression.
In an embodiment, at least two genes exhibit the same trend in expression. In
an embodiment,
at least three genes exhibit the same trend in expression. In an embodiment,
at least four genes
exhibit the same trend in expression. In an embodiment, at least five genes
exhibit the same
trend in expression. In an embodiment, at least ten genes exhibit the same
trend in expression.
In an embodiment, at least twenty genes exhibit the same trend in expression.
In an
embodiment, at least fifty genes exhibit the same trend in expression.
CA 02634072 2008-06-16
WO 2007/071053 PCT/CA2006/002103
17
[0085] Nucleic acid arrays are particularly useful for detecting the
expression of the
genes of the present invention. The production and application of high-density
arrays in gene
expression monitoring have been disclosed previously in, for example, PCT
Publication No. WO
97/10365; PCT Publication No. WO 92/10588; U.S. Pat. No. 6,040,138; U.S. Pat.
No.
5,445,934; or PCT Publication No. WO 95/35505, all of which are incorporated
herein by
reference in their entireties. Also for examples of arrays, see Hacia et al.,
Nature Genetics
14:441; Lockhart et al., Nat. Biotechnol. 14:1675-1680; and De Risi et al.,
Nature Genetics
14:457, each of which is incorporated by reference in its entirety. In
general, in an array, an
oligonucleotide, a cDNA, or genomic DNA, that is a portion of a known gene,
occupies a known
location on a substrate. A nucleic acid target sample is hybridized with an
array of such
oligonucleotides and then the amount of target nucleic acids hybridized to
each probe in the
array is quantified. One preferred quantifying method is to use confocal
microscope and
fluorescent labels. The Affymetrix GeneChipTM Array system (Affymetrix, Santa
Clara, Calif.)
and the AtiasTM Human cDNA Expression Array system are particularly suitable
for quantifying
the hybridization; however, it will be apparent to those of skill in the art
that any similar systems
or other effectively equivalent detection methods can also be used. In a
particularly preferred
embodiment, one can use the knowledge of the genes described herein to design
novel arrays
of polynucleotides, cDNAs or genomic DNAs for screening methods described
herein. Such
novel pluralities of polynucleotides are contemplated to be a part of the
present invention and
are described in detail below.
[0086] Suitable nucleic acid samples for screening on an array contain
transcripts of
interest or nucleic acids derived from the transcripts of interest (e. g.,
transcripts derived from
the genes highly expressed in TcM of the present invention). As used herein, a
nucleic acid
derived from a transcript refers to a nucleic acid for whose synthesis the
mRNA transcript or a
subsequence thereof has ultimately served as a template. Thus, a cDNA reverse
transcribed
from a transcript, an RNA transcribed from that cDNA, a DNA amplified from the
cDNA, an RNA
transcribed from the amplified DNA, etc., are all derived from the transcript
and detection of
such derived products is indicative of the presence and/or abundance of the
original transcript in
a sample. Thus, suitable samples include, but are not limited to, transcripts
of the gene or
genes, cDNA reverse transcribed from the transcript, cRNA transcribed from the
cDNA, DNA
amplified from the genes, RNA transcribed from amplified DNA, and the like.
Preferably, such a
sample is a total RNA preparation of a biological sample (e.g., peripheral
blood mononuclear
cells or PBMCs, immune cells, immune cell subpopulations such as memory T
cells). More
preferably in some embodiments, such a nucleic acid sample is the total mRNA
isolated from
such a biological sample.
[0087] Methods of isolating total mRNA are well known to those of skill in the
art. In one
embodiment, the total nucleic acid is isolated from a given sample using, for
example, an acid
CA 02634072 2008-06-16
WO 2007/071053 PCT/CA2006/002103
18
guanidinium-phenol-chloroform extraction method and polyA and mRNA is isolated
by oligo dT
column chromatography or by using (dT)n magnetic beads (see, e.g., Sambrook et
al.,
Molecular Cloning: A Laboratory Manual (2nd ed.), Vols. 1-3, Cold Spring
Harbor Laboratory,
(1989), or Current Protocols in Molecular Biology, F. Ausubel et al., ad.
Greene Publishing and
Wiley-Interscience, New York (1987)). Also, kits for the isolation of total
RNA or mRNA are
commercially available (e. g., Qiagen RNeasy Mini Kit, New England BioLabs
polyA SpinTM
mRNA isolation kit).
[0088] In general, typical biological samples include, but are not limited to,
sputum,
serum, lymphatic fluid, blood, blood cells (e.g., peripheral blood mononuclear
cells), tissue or
fine needle biopsy samples, urine, peritoneal fluid, colostrums, breast milk,
fetal fluid, tears, and
pleural fluid, or cells therefrom. In embodiments, the determination of
expression levels is
performed using peripheral blood mononuclear cells, such as immune cells, such
as CD4+ and
CD8+ T cells. In embodiments, the determination of expression levels is
performed using CD4
or CD8 T cell subsets, such as central memory or effector memory T cells.
[0089] In further embodiments, the invention relates to the use of nucleic
acid(s) (e.g., a
probe(s)) which is substantially homologous/identical or substantially
complementary (e.g., for
hybridization under moderately stringent or stringent conditions) to a nucleic
acid sequence
encoding one or more genes selected from the group consisting of HLA-G, MAL,
NGFRAP1,
HRMT1 L2, ATXN3, TNFRSF7 (CD27), ING1, E2F4, RELA, TOSO, INDO, SFRP4, PABPC1,
ARL7, PIM2, TAP1, CD37, LPPR4, IMPDH2, LOC112476, TGFBR2, CCNL1, GRK5, Stat5a,
RALA, CSTB, SNF1 LK, CAV1, MYO1 E, B2M, NFIC, SYT6, RRM1, OAS1, IMPDH2, DMGDH,
PNRC2, LIMS1, PARVG, FYN, LILRA2, FTL, SOCS1, PF4, ERG, IFIT1, NCOR2, IL16,
TCIRG1, PITPNB, PABPC4, MAN2A1, SPN, TNFRSF8, RFX2, RGS13, LTA4H, S100A8,
TCF3, TIAM1, CART, PPP2R2C, PIAS4, PRKCQ, NME2, SLC2A3, ATF4, IL2RG, COL3A1,
PPM1D, SEC23A, LIMK2, BAT3, RGS10, STAT6, RASL12, C1QG, GPR18, NOTCH3,
Clorf38,
BTF3, CCL19, PES1, C1QA, ZNF593, TNF-a, POLD2, DTYMK, E2F1, STAU, IFNGR2,
NRG1,
TNFSF7, JARID1A, BLR1, PLCL2, MK167, IDUA, FEZ1, MAPKAPK5, DLC1, MAP4K2, VAV3,
BATF, BIRC6, CEP2, DDAH2, PLK4, GTF2F2, FADS1, FHIT, SPOCK, TLK1, DDX5, NGFR,
FYB, USP10, TCF7, RAMP1, AGPAT5, EDA, PPP3CC, HNRPK, TPR, CHUK, ANXA1,
SMARCA4, CLK1, CCL3, CALM3, ALOX5, LCN2, NUP88, LKLF, AKT2, BIRC5, CALM1,
CAMK2G, CaMKIINalpha, CLK1, GREG, DC-UbP, FAIM2, FOXL2, GATA2, GATA3, IL-7R,
IRF1, KIT, KMO, CNTROB/LIP8, MAPK6, MAPKAPK3, PRKARI B, RAB11 B, STMN1, STX1
132,
STXBP5, GAS-7, XIAP, GADD45, DUSP1, PTEN, and SOCS2, a complement thereof, or
a
portion thereof.
[0090] "Homology" and "homologous" refers to sequence similarity between two
peptides or two nucleic acid molecules. Homology can be determined by
comparing each
CA 02634072 2008-06-16
WO 2007/071053 PCT/CA2006/002103
19
position in the aligned sequences. A degree of homology between nucleic acid
or between
amino acid sequences is a function of the number of identical or matching
nucleotides or amino
acids at positions shared by the sequences. As the term is used herein, a
nucleic acid
sequence is "homologous" to another sequence if the two sequences are
substantially identical
and the functional activity of the sequences is conserved (as used herein, the
term 'homologous'
does not infer evolutionary relatedness). Two nucleic acid sequences are
considered
"substantially identical" if, when optimally aligned (with gaps permitted),
they share at least
about 50% sequence similarity or identity, or if the sequences share defined
functional motifs. In
alternative embodiments, sequence similarity in optimally aligned
substantially identical
sequences may be at least 60%, 70%, 75%, 80%, 85%, 90% or 95%. As used herein,
a given
percentage of homology between sequences denotes the degree of sequence
identity in
optimally aligned sequences. An "unrelated" or "non-homologous" sequence
shares less than
40% identity, though preferably less than about 25 % identity, with any of the
nucleic acids
encoding the above-mentioned genes.
[0091] "Substantially complementary" nucleic acids are nucleic acids in which
the
complement of one molecule is substantially identical to the other molecule.
Two nucleic acid or
protein sequences are considered substantially identical if, when optimally
aligned, they share
at least about 70% sequence identity. In alternative embodiments, sequence
identity may for
example be at least 75%, at least 80%, at least 85%, at least 90%, or at least
95%. Optimal
alignment of sequences for comparisons of identity may be conducted using a
variety of
algorithms, such as the local homology algorithm of Smith and Waterman, 1981,
Adv. Appl.
Math 2: 482, the homology alignment algorithm of Needleman and Wunsch, 1970,
J. Mol. Biol.
48:443, the search for similarity method of Pearson and Lipman, 1988, Proc.
Natl. Acad. Sci.
USA 85: 2444, and the computerised implementations of these algorithms (such
as GAP,
BESTFIT, FASTA and TFASTA in the Wisconsin Genetics Software Package, Genetics
Computer Group, Madison, WI, U.S.A.). Sequence identity may also be determined
using the
BLAST algorithm, described in Altschul et al., 1990, J. Mol. Biol. 215:403-10
(using the
published default settings). Software for performing BLAST analysis may be
available through
the National Center for Biotechnology Information (through the internet at
www.ncbi.nlm.nih.aov). The BLAST algorithm involves first identifying high
scoring sequence
pairs (HSPs) by identifying short words of length W in the query sequence that
either match or
satisfy some positive-valued threshold score T when aligned with a word of the
same length in a
database sequence. T is referred to as the neighbourhood word score threshold.
Initial
neighbourhood word hits act as seeds for initiating searches to find longer
HSPs. The word hits
are extended in both directions along each sequence for as far as the
cumulative alignment
score can be increased. Extension of the word hits in each direction is halted
when the following
parameters are met: the cumulative alignment score falls off by the quantity X
from its maximum
CA 02634072 2008-06-16
WO 2007/071053 PCT/CA2006/002103
achieved value; the cumulative score goes to zero or below, due to the
accumulation of one or
more negative-scoring residue alignments; or the end of either sequence is
reached. The
BLAST algorithm parameters W, T and X determine the sensitivity and speed of
the alignment.
The BLAST program may use as defaults a word length (W) of 11, the BLOSUM62
scoring
matrix (Henikoff and Henikoff, 1992, Proc. Natl. Acad. Sci. USA 89: 10915-
10919) alignments
(B) of 50, expectation (E) of 10 (or 1 or 0.1 or 0.01 or 0.001 or 0.0001),
M=5, N=4, and a
comparison of both strands. One measure of the statistical similarity between
two sequences
using the BLAST algorithm is the smallest sum probability (P(N)), which
provides an indication
of the probability by which a match between two nucleotide or amino acid
sequences would
occur by chance. In alternative embodiments of the invention, nucleotide or
amino acid
sequences are considered substantially identical if the smallest sum
probability in a comparison
of the test sequences is less than about 1, preferably less than about 0.1,
more preferably less
than about 0.01, and most preferably less than about 0.001.
[0092] An alternative indication that two nucleic acid sequences are
substantially
complementary is that the two sequences hybridize to each other under
moderately stringent, or
preferably stringent, conditions. Hybridisation to filter-bound sequences
under moderately
stringent conditions may, for example, be performed in 0.5 M NaHPO4, 7% sodium
dodecyl
sulfate (SDS), 1 mM EDTA at 65 C, and washing in 0.2 x SSC/0.1 % SDS at 42 C
(see Ausubel,
et al. (eds), 1989, Current Protocols in Molecular Biology, Vol. 1, Green
Publishing Associates,
Inc., and John Wiley & Sons, Inc., New York, at p. 2.10.3). Alternatively,
hybridization to filter-
bound sequences under stringent conditions may, for example, be performed in
0.5 M NaHPO4,
7% SDS, 1 mM EDTA at 65 C, and washing in 0.1 x SSC/0.1 % SDS at 68 C (see
Ausubel, et
a/. (eds), 1989, supra). Hybridization conditions may be modified in
accordance with known
methods depending on the sequence of interest (see Tijssen, 1993, Laboratory
Techniques in
Biochemistry and Molecular Biology -- Hybridization with Nucleic Acid Probes,
Part I, Chapter 2
"Overview of principles of hybridization and the strategy of nucleic acid
probe assays", Elsevier,
New York). Generally, stringent conditions are selected to be about 5 C lower
than the thermal
melting point for the specific sequence at a defined ionic strength and pH.
[0093] In an embodiment, it is desirable to amplify the nucleic acid sample
prior to
hybridization. One of skill in the art will appreciate that whatever
amplification method is used, if
a quantitative result is desired, a method is used that maintains or controls
for the relative
frequencies of the amplified nucleic acids to achieve quantitative
amplification. Methods of
"quantitative" amplification are well known to those of skill in the art. For
example, quantitative
PCR involves simultaneously co-amplifying a known quantity of a control
sequence using the
same primers. This provides an internal standard that may be used to calibrate
the PCR
reaction. The high-density array may then include probes specific to the
internal standard for
quantification of the amplified nucleic acid. Other suitable amplification
methods include, but are
CA 02634072 2008-06-16
WO 2007/071053 PCT/CA2006/002103
21
not limited to polymerase chain reaction (PCR) Innis, et al., PCR Protocols. A
guide to Methods
and Application. Academic Press, Inc. San Diego, (1990)), ligase chain
reaction (LCR) (see Wu
and Wallace, Genomics, 4: 560, Landegren, et al., Science, 241: 1077 and
Barringer, et al.,
Gene, 89: 117), transcription amplification (Kwoh, et al., Proc. Natl. Acad.
Sci. USA, 86: 1173),
and self-sustained sequence replication (Guatelli, et al, Proc. Nat. Acad.
Sci. USA, 87: 1874).
[0094] Another embodiment of the present invention relates to one or more
polynucleotide probes for the detection of the expression of genes that are
associated with
memory T cell survival.
[0095] A "probe" is meant to include a nucleic acid oligomer that hybridizes
specifically
to a target sequence in a nucleic acid or its complement, under conditions
that promote
hybridization, thereby allowing detection of the target sequence or its
amplified nucleic acid.
Detection may either be direct (i.e, resulting from a probe hybridizing
directly to the target or
amplified sequence) or indirect (i.e., resulting from a probe hybridizing to
an intermediate
molecular structure that links the probe to the target or amplified sequence).
A probe's "target"
generally refers to a sequence within an amplified nucleic acid sequence
(i.e., a subset of the
amplified sequence) that hybridizes specifically to at least a portion of the
probe sequence by
standard hydrogen bonding or "base pairing." Sequences that are "sufficiently
complementary"
allow stable hybridization of a probe sequence to a target sequence, even if
the two sequences
are not completely complementary. A probe may be labeled or unlabeled.
[0096] The polynucleotide probe(s) of the invention comprise, consist(s) of,
or consist(s)
essentially of, one or more polynucleotide probes that are complementary to
RNA transcripts, or
nucleotides derived therefrom, of at least one nucleic acid sequence that has
been identified
herein as being differentially expressed in TcM, and is therefore
distinguished from previously
known nucleic acid arrays and primer sets. The plurality of polynucleotides
within the above-
limitation includes at least one or more polynucleotide probes (e.g., at least
1, 2, 3, 4, 5, 6, and
so on, in whole integer increments, up to the maximum number of possible
probes) that are
complementary to RNA transcripts, or nucleotides derived therefrom, of at
least one gene, and
preferably, at least 2 or more genes identified by the present inventors. Such
genes are
selected from any of the genes listed in the tables provided herein and can
include any number
of genes, in whole integers (e.g., 1, 2, 3, 4, . . . ). Multiple probes can
also be used to detect the
same gene or to detect different splice variants of the same gene. In an
aspect, each of the
polynucleotides is at least 5 nucleotides in length. In an aspect, the
polynucleotide probe(s)
consist(s) of at least one polynucleotide probes, wherein each polynucleotide
probe is at least 5
nucleotides in length, and wherein each polynucleotide probe is complementary
to an RNA
transcript, or nucleotide derived therefrom, of a gene selected from the group
consisting HLA-G,
MAL, NGFRAP1, HRMT1L2, ATXN3, TNFRSF7 (CD27), ING1, E2F4, RELA, TOSO, INDO,
CA 02634072 2008-06-16
WO 2007/071053 PCT/CA2006/002103
22
SFRP4, PABPC1, ARL7, PIM2, TAP1, CD37, LPPR4, IMPDH2, LOC112476, TGFBR2,
CCNL1,
GRK5, Stat5a, RALA, CSTB, SNF1 LK, CAV1, MYO1 E, B2M, NFIC, SYT6, RRM1, OAS1,
IMPDH2, DMGDH, PNRC2, LIMS1, PARVG, FYN, LILRA2, FTL, SOCS1, PF4, ERG, IFIT1,
NCOR2, IL16, TCIRG1, PITPNB, PABPC4, MAN2A1, SPN, TNFRSF8, RFX2, RGS13, LTA4H,
S100A8, TCF3, TIAM1, CART, PPP2R2C, PIAS4, PRKCQ, NME2, SLC2A3, ATF4, IL2RG,
COL3A1, PPM1D, SEC23A, LIMK2, BAT3, RGS10, STAT6, RASL12, C1 QG, GPR18,
NOTCH3, Clorf38, BTF3, CCL19, PES1, C1 QA, ZNF593, TNF-a, POLD2, DTYMK, E2F1,
STAU, IFNGR2, NRG1, TNFSF7, JARID1A, BLR1, PLCL2, MK167, IDUA, FEZ1, MAPKAPK5,
DLC1, MAP4K2, VAV3, BATF, BIRC6, CEP2, DDAH2, PLK4, GTF2F2, FADS1, FHIT,
SPOCK,
TLK1, DDX5, NGFR, FYB, USP10, TCF7, RAMP1, AGPAT5, EDA, PPP3CC, HNRPK, TPR,
CHUK, ANXA1, SMARCA4, CLK1, CCL3, CALM3, ALOX5, LCN2, NUP88, LKLF, AKT2,
BIRC5, CALM1, CAMK2G, CaMKIINalpha, CLK1, GREG, DC-UbP, FAIM2, FOXL2, GATA2,
GATA3, IL-7R, IRF1, KIT, KMO, CNTROB/LIP8, MAPK6, MAPKAPK3, PRKARI B, RAB11 B,
STMN1, STX1B2, STXBP5, GAS-7, XIAP, GADD45, DUSP1, PTEN, and SOCS2. In another
aspect, the polynucleotide probe(s) comprise(s) polynucleotides that are
complementary to an
RNA transcript, or a nucleotide derived therefrom, of at least two genes
mentioned above. In
another aspect, the polynucleotide probe(s) comprises polynucleotide probes
that are
complementary to an RNA transcript, or a nucleotide derived therefrom, of at
least five genes, at
least 10 genes, at least 25 genes, at least 50 genes, or up to all of the
genes mentioned above.
[0097] In accordance with the present invention, an isolated polynucleotide,
or an
isolated nucleic acid molecule, is a nucleic acid molecule that has been
removed from its natural
milieu (i.e., that has been subject to human manipulation), its natural milieu
being the genome
or chromosome in which the nucleic acid molecule is found in nature. As such,
"isolated" does
not necessarily reflect the extent to which the nucleic acid molecule has been
purified, but
indicates that the molecule does not include an entire genome or an entire
chromosome in
which the nucleic acid molecule is found in nature. The polynucleotides useful
in the
polynucleotide probes of the present invention are typically a portion of a
gene (sense or non-
sense strand) of the present invention that is suitable for use as a
hybridization probe or PCR
primer for the identification of a full-length gene (or portion thereof) in a
given sample (e.g., a
peripheral blood cell sample). An isolated nucleic acid molecule can include a
gene or a portion
of a gene (e.g., the regulatory region or promoter), for example, to produce a
reporter construct
according to the present invention. An isolated nucleic acid molecule that
includes a gene is not
a fragment of a chromosome that includes such gene, but rather includes the
coding region and
regulatory regions associated with the gene, but no additional genes naturally
found on the
same chromosome. An isolated nucleic acid molecule can also include a
specified nucleic acid
sequence flanked by (i.e., at the 5' and/or the 3' end of the sequence)
additional nucleic acids
that do not normally flank the specified nucleic acid sequence in nature
(i.e., heterologous
CA 02634072 2008-06-16
WO 2007/071053 PCT/CA2006/002103
23
sequences). Isolated nucleic acid molecule can include DNA, RNA (e.g., mRNA),
or derivatives
of either DNA or RNA (e.g., cDNA). Although the phrase "nucleic acid molecule"
primarily refers
to the physical nucleic acid molecule and the phrase "nucleic acid sequence"
primarily refers to
the sequence of nucleotides on the nucleic acid molecule, the two phrases can
be used
interchangeably, especially with respect to a nucleic acid molecule, or a
nucleic acid sequence,
being capable of encoding a protein. Preferably, an isolated nucleic acid
molecule of the present
invention is produced using recombinant DNA technology (e.g., polymerase chain
reaction
(PCR) amplification, cloning) or chemical synthesis.
[0098] The minimum size of a nucleic acid molecule or polynucleotide of the
present
invention is a size sufficient to form a probe or oligonucleotide primer that
is capable of forming
a stable hybrid with the complementary sequence of a nucleic acid molecule
encoding the
natural protein (e.g., under moderately stringent, or stringent conditions) (e
g. incubation at
65 C in DIG Easy Hyb solution (Roche), 50 pg of yeast tRNA and 50 pg of calf
thymus DNA) or
to otherwise be used as a target in an assay or in any therapeutic method
discussed herein. If
the polynucleotide is an oligonucleotide probe or primer, the size of the
polynucleotide can be
dependent on nucleic acid composition and percent homology or identity between
the nucleic
acid molecule and a complementary sequence as well as upon hybridization
conditions per se
(e.g., temperature, salt concentration, and formamide concentration). The
minimum size of a
polynucleotide that is used as an oligonucleotide probe or primer is at least
about 5 nucleotides
in length, and preferably ranges from about 5 to about 50 or about 500
nucleotides or greater
(1000, 2000, etc.), including any length in between, in whole number
increments (i.e., 5, 6, 7, 8,
9, 10.... 33, 34, ... 256, 257, ... 500 ... 1000 ...), and more preferably
from about 10 to
about 40 nucleotides, and most preferably from about 15 to about 40
nucleotides in length.
There is no limit, other than a practical limit, on the maximal size of a
nucleic acid molecule of
the present invention, in that the nucleic acid molecule can include a portion
of a protein-
encoding sequence or a nucleic acid sequence encoding a full-length protein.
[0099] In an embodiment, the polynucleotide probes are conjugated to
detectable
markers. Detectable labels suitable for use in the present invention include
any composition
detectable by spectroscopic, photochemical, biochemical, immunochemical,
electrical, optical or
chemical means. Useful labels in the present invention include biotin for
staining with labeled
streptavidin or avidin conjugate, magnetic beads (e.g., Dynabeads.TM.),
fluorescent dyes (e.g.,
fluorescein, texas red, rhodamine, green fluorescent protein, and the like),
radiolabels (e.g., 3H,
125I 35S 14C, or 32P), enzymes (e.g., horse radish peroxidase, alkaline
phosphatase and others
commonly used in an ELISA), and colorimetric labels such as colloidal gold or
colored glass or
plastic (e.g., polystyrene, polypropylene, latex, etc.) beads. Preferably, the
polynucleotide
probes are immobilized on a substrate.
CA 02634072 2008-06-16
WO 2007/071053 PCT/CA2006/002103
24
[00100] In one embodiment, the polynucleotide probes are hybridizable array
elements in
a microarray or high density array. Nucleic acid arrays are well known in the
art and are
described for use in comparing expression levels of particular genes of
interest, for example, in
U.S. Pat. No. 6,177,248, which is incorporated herein by reference in its
entirety. Nucleic acid
arrays are suitable for quantifying small variations in expression levels of a
gene in the presence
of a large population of heterogeneous nucleic acids. Knowing the identity of
the genes set forth
by the present invention, nucleic acid arrays can be fabricated either by de
novo synthesis on a
substrate or by spotting or transporting nucleic acid sequences onto specific
locations of
substrate. Nucleic acids are purified and/or isolated from biological
materials, such as a
bacterial plasmid containing a cloned segment of sequence of interest. It is
noted that all of the
genes identified by the present invention have been previously sequenced, at
least in part, such
that oligonucleotides suitable for the identification of such nucleic acids
can be produced. The
database accession number for each of the genes identified by the present
inventors is provided
in the tables of the invention. Suitable nucleic acids are also produced by
amplification of
template, such as by polymerase chain reaction or in vitro transcription.
[00101] One of skill in the art will appreciate that an enormous number of
array designs
are suitable for the practice of this invention. An array will typically
include a number of probes
that specifically hybridize to the sequences of interest. In addition, in a
preferred embodiment,
the array will include one or more control probes. The high-density array chip
includes "test
probes". Test probes could be oligonucleotides having a minimum or maximum
length as
described above for other oligonucleotides. In another embodiment, test probes
are double or
single strand DNA sequences. DNA sequences are isolated or cloned from natural
sources or
amplified from natural sources using natural nucleic acids as templates, or
produced
synthetically. These probes have sequences complementary to particular
subsequences of the
genes whose expression they are designed to detect. Thus, the test probes are
capable of
specifically hybridizing to the target nucleic acid they are to detect.
[00102] Another embodiment of the present invention relates to reagents which
specifically binds with the polypeptide, such as chemical agents, or natural
products, or
antibodies, or antigen binding fragments thereof, for the detection of the
expression of genes
differentially expressed in TcM. The reagent consists of chemical agents, or
natural products, or
antibodies, or antigen binding fragments thereof, that selectively bind to
proteins encoded by
genes that are regulated in biological samples from transplant donors, and
that can be detected
as protein products using antibodies. In addition, the reagent comprises
chemical agents, or
natural products, or antibodies, or antigen binding fragments thereof, that
selectively bind to
proteins or portions thereof (peptides) encoded by one or more genes selected
from HLA-G,
MAL, NGFRAP1, HRMT1L2, ATXN3, TNFRSF7 (CD27), ING1, E2F4, RELA, TOSO, INDO,
SFRP4, PABPC1, ARL7, PIM2, TAP1, CD37, LPPR4, IMPDH2, LOC112476, TGFBR2,
CCNL1,
CA 02634072 2008-06-16
WO 2007/071053 PCT/CA2006/002103
GRK5, Stat5a, RALA, CSTB, SNF1 LK, CAV1, MYO1 E, B2M, NFIC, SYT6, RRM1, OAS1,
IMPDH2, DMGDH, PNRC2, LIMS1, PARVG, FYN, LILRA2, FTL, SOCS1, PF4, ERG, IFIT1,
NCOR2, IL16, TCIRG1, PITPNB, PABPC4, MAN2A1, SPN, TNFRSF8, RFX2, RGS13, LTA4H,
S100A8, TCF3, TIAM1, CART, PPP2R2C, PIAS4, PRKCQ, NME2, SLC2A3, ATF4, IL2RG,
COL3A1, PPM1 D, SEC23A, LIMK2, BAT3, RGS10, STAT6, RASL12, C1 QG, GPR18,
NOTCH3, C1orf38, BTF3, CCL19, PES1, C1QA, ZNF593, TNF-a, POLD2, DTYMK, E2F1,
STAU, IFNGR2, NRG1, TNFSF7, JARID1A, BLR1, PLCL2, MK167, IDUA, FEZ1, MAPKAPK5,
DLCI, MAP4K2, VAV3, BATF, BIRC6, CEP2, DDAH2, PLK4, GTF2F2, FADS1, FHIT,
SPOCK,
TLK1, DDX5, NGFR, FYB, USP10, TCF7, RAMP1, AGPAT5, EDA, PPP3CC, HNRPK, TPR,
CHUK, ANXA1, SMARCA4, CLK1, CCL3, CALM3, ALOX5, LCN2, NUP88, LKLF, AKT2,
BIRC5, CALM1, CAMK2G, CaMKIINalpha, CLK1, GREG, DC-UbP, FAIM2, FOXL2, GATA2,
GATA3, IL-7R, IRF1, KIT, KMO, CNTROB/LIP8, MAPK6, MAPKAPK3, PRKARI B, RAB11B,
STMN1, STX1B2, STXBP5, GAS-7, XIAP, GADD45, DUSP1, PTEN, and SOCS2. In an
aspect,
the reagent consists of one or more antibodies, antigen binding fragments
thereof, or antigen
binding peptides, each of which selectively binds to a protein encoded by one
or more of the
above-mentioned genes.
[00103] According to the present invention, the phrase "selectively binds to"
refers to the
ability of a chemical agent, a natural product, an antibody, antigen binding
fragment or binding
partner (antigen binding peptide) to preferentially bind to specified
proteins. More specifically,
the phrase "selectively binds" refers to the specific binding of one protein
to another molecule
(e.g., chemical agent, natural product, an antibody, fragment thereof, or
binding partner to an
antigen), wherein the level of binding, as measured by any standard assay
(e.g., an
immunoassay, fluorescence), is statistically significantly higher than the
background control for
the assay. For example, when performing an immunoassay, controls typically
include a reaction
well/tube that contain chemical agent, natural product, antibody or antigen
binding fragment
alone (i.e., in the absence of antigen), wherein an amount of reactivity
(e.g., non-specific binding
to the well) by the chemical agent, natural product, antibody or antigen
binding fragment thereof
in the absence of the antigen is considered to be background. Binding can be
measured using a
variety of methods standard in the art including enzyme immunoassays (e.g.,
fluorescence,
ELISA, immunoblot assays, etc.).
[00104] Isolated antibodies of the present invention can include serum
containing such
antibodies, or antibodies that have been purified to varying degrees. Whole
antibodies of the
present invention can be polyclonal or monoclonal. Alternatively, functional
equivalents of whole
antibodies, such as antigen binding fragments in which one or more antibody
domains are
truncated or absent (e.g., Fv, Fab, Fab', or F(ab)2 fragments), as well as
genetically-engineered
antibodies or antigen binding fragments thereof, including single chain
antibodies or antibodies
that can bind to more than one epitope (e.g., bi-specific antibodies), or
antibodies that can bind
CA 02634072 2008-06-16
WO 2007/071053 PCT/CA2006/002103
26
to one or more different antigens (e.g., bi- or multi-specific antibodies),
may also be employed in
the invention.
[00105] Generally, in the production of an antibody, a suitable experimental
animal, such
as, for example, but not limited to, a rabbit, a sheep, a hamster, a guinea
pig, a mouse, a rat, or
a chicken, is exposed to an antigen against which an antibody is desired.
Typically, an animal is
immunized with an effective amount of antigen that is injected into the
animal. An effective
amount of antigen refers to an amount needed to induce antibody production by
the animal. The
animal's immune system is then allowed to respond over a pre-determined period
of time. The
immunization process can be repeated until the immune system is found to be
producing
antibodies to the antigen. In order to obtain polyclonal antibodies specific
for the antigen, serum
is collected from the animal that contains the desired antibodies (or in the
case of a chicken,
antibody can be collected from the eggs). Such serum is useful as a reagent.
Polyclonal
antibodies can be further purified from the serum (or eggs) by, for example,
treating the serum
with ammonium sulfate.
[00106] For diagnostic applications, the reagent (i.e., the antibodies or
antigen binding
fragments thereof) is either in a free state or immobilized on a solid
support, such as a tube, a
bead, a microarray or any other conventional support used in the field.
Immobilization is
achieved using direct or indirect means. Direct means include passive
adsorption (non-covalent
binding) or covalent binding between the support and the reagent. By "indirect
means" is meant
that an anti-reagent compound that interacts with a reagent is first attached
to the solid support.
Indirect means may also employ a ligand-receptor system, for example, where a
molecule such
as a vitamin is grafted onto the reagent and the corresponding receptor
immobilized on the solid
phase. This is illustrated by the biotin-streptavidin system. Alternatively, a
peptide tail is added
chemically or by genetic engineering to the reagent and the grafted or fused
product
immobilized by passive adsorption or covalent linkage of the peptide tail.
[00107] Such diagnostic agents may be included in a kit which also comprises
instructions for use. The reagent is labeled with a detection means which
allows for the
detection of the reagent when it is bound to its target. The detection means
may be a
fluorescent agent such as fluorescein isocyanate or fluorescein
isothiocyanate, or an enzyme
such as horseradish peroxidase or luciferase or alkaline phosphatase, or a
radioactive element
such as 1251 or 51 Cr.
[00108] The invention also features kits for assessing the efficacy of a
vaccine or a
treatment at inducing/maintaining TcM and/or a protective immune response in a
subject. The
kits can include reagents for evaluating the expression or activity of nucleic
acids (e.g., mRNAs)
or proteins that play a role in the induction and/or maintenance of TcM. Kits
for evaluating
expression of nucleic acids can include, for example, probes or primers that
specifically bind a
CA 02634072 2008-06-16
WO 2007/071053 PCT/CA2006/002103
27
nucleic acid of interest (e.g., a nucleic acid, the expression of which
correlates with the
presence or absence of TcM in a sample). The kits for evaluating nucleic acid
expression can
provide substances useful as standard (e.g., a sample containing a known
quantity of a nucleic
acid to which test results can be compared, with which one can assess factors
that may alter
the readout of a diagnostic test, such as variations in an enzyme activity or
binding conditions).
Kits for assessing nucleic acid expression can further include other reagents
useful in assessing
levels of expression of a nucleic acid (e. g., buffers and other reagents for
performing PCR
reactions, or for detecting binding of a probe to a nucleic acid). In addition
to, or as an
alternative, kits can include reagents for detecting proteins (e.g.,
antibodies). The kits can
provide instructions for performing the assay used to evaluate gene expression
instructions for
determining risk based on the results of the assay. For example, the
instructions can indicate
that levels of expression of a gene of interest (e.g., relative to a standard
or a control), correlate
with the presence or absence of TcM. Kits can also provide instructions,
containers, and other
reagents for obtaining and processing samples for analysis.
[00109] The invention further provides methods for developing personalized
treatment
plans. Information gained by way of the methods described above can be used to
develop a
personalized treatment plan for a subject (for example, a vaccinated or an
immunodeficient
subject). The methods can be carried out by, for example, using any of the
methods of gene
analysis described above and, in consideration of the results obtained,
designing a treatment
plan or a clinical course of action for the subject. If the levels of gene
expression indicate that
the subject has low levels of TcM, the subject is a candidate for vaccination
and/or treatment
with an effective amount of immuno-stimulating agent. Depending on the level
of gene
expression or the gene expression profile, the recipient may require a
treatment regime that is
more or less aggressive than a standard regime, or it may be determined that
the recipient is
best suited for a standard regime. When so treated, one can treat or prevent
complications
associated with poor immune response. Conversely, a different result (i.e., a
different level of
expression of certain genes) may indicate that the subject has high levels of
TcM and/or shows
immune protection and is not likely to experience an undesirable clinical
outcome (e.g. being at
risk of infection). In that event, the patient may avoid vaccination and/or
treatment with immuno-
stimulating agents (or require a less aggressive regime) and their associated
side effects.
[00110] In embodiments, the herein-mentioned animal is a mammal, such as a
human.
With regard to for example screening assays, accepted laboratory animal model
systems may
be used, for example rodent systems (e.g., mouse, rat, ferret), rabbit, non-
human primates, as
well as others known in the art.
[00111] The present invention is illustrated in further details by the
following non-limiting
examples.
CA 02634072 2008-06-16
WO 2007/071053 PCT/CA2006/002103
28
EXAMPLES
[00112] EXAMPLE 1: MATERIAL AND METHODS
[00113] Reagents and Abs. Recombinant human IL-2 was obtained trough the AIDS
reagent depository at the NIH. IL-7 and IL-4 were purchased from R&D systems.
The kinase
inhibitors AKT-IV, STO-069, U0126 and Wedelolactone were obtained from
Calbiochem.
Etoposide was purchased from Sigma-Aldrich. CH11, Anti-Fas agonist antibodies,
were
obtained from Immunotech. All antibodies for flow cytometry were purchased
from BD
PharMingen, except for anti-CD45RA-ECD from Beckman Coulter and anti-CCR7-FITC
from
R&D systems. Anti-pFOXO3a S253, anti-pFOXO3a T32, anti-pan FOXO3a, anti-Bim,
anti-PIM-
1, anti-pGab2 T452, anti-pIKKa/(3 S176/180 and anti-pAKT S473-alexa 488 were
purchased
from Cell Signaling Technology Inc., anti-FasL (5G51) from Alexis Biochemical,
anti-P130
(clone KAB40) from Sigma, anti-Gadd45a from Chemicon, and anti-PIM-2 and anti-
pFOXO3a
S315 were a gift from BD-PharMingen. HRP-conjugated goat anti-mouse and goat
anti-rabbit
IgG antibodies were obtained from BioRad Laboratories. Anti-Rab-27a is a home-
made
antibody raised in rabbits against a GST-Rab27 fusion protein.
[00114] Isolation of CD4+ T cell sub-populations. PBMCs from healthy subjects
were
isolated by a Ficoll-HyPaque (Pharmacia) density gradient. All donors signed
informed consent
forms approved by the CHEST hospital review board and the CR-CHUM. We first
enriched for
CD4+ T cells using negative immunomagnetic bead selection (AutoMACST"",
Myltenii). Cells
were then labeled with anti-CD4-APC-cy7, anti-CD45RA-ECD, anti-CD27-FITC and
anti-CCR7-
PE-cy7 and sorted into Naive, TcM and TEM. Sorting was performed using a
BDAriaTM flow
cytometer (BD Biosciences). The purity of the TcM and TEM sub-populations
ranged from 96 to
99%. All procedures were done at 4 C to minimize any changes in cell phenotype
or gene
expression.
[00115] RNA isolation, amplification and microarray hybridization. Sample RNA
was
extracted using an RNA extraction kit (Qiagen), then amplified using the
MessageAmp RNA kit
(Ambion) following the manufacturer's instructions. The amplified RNA (aRNA)
was then verified
for quality and quantity using the Agilent Bioanalyser and measuring the OD.
For reverse
transcription, 10-20 pg of total RNA or 0.1-0.5 pg of mRNA was mixed on ice
with the following
(total volume 40 pL): 8.0 pL 5X First Strand reaction buffer (Superscript II,
Invitrogen), 1.5 pL
AncT primer (5'-T20VN, 100 pmol/pl), 3.0 pL dNTP-dCTP (6.67 mM each of dATP,
dGTP,
dTTP), 1.0 pL 2 mM dCTP, 1.0 pL 1 mM Cyanine 3 or Cyanine 5-dCTP (NEN), 4.0 pL
0.1 M
DTT, 1.0 - 5.0 ng Control RNA (artificial Arabadopsis transcripts) and
nuclease-free water (up
to a total volume of 40 pL). The mixture was incubated in the dark at 65 C for
5 minutes, then at
42 C for 5 minutes. 2 pL of reverse transcriptase (SuperScript II, Invitrogen)
was added and the
incubation was continued at 42 C for 2 hours. To stop the reaction, the
mixture was briefly
CA 02634072 2008-06-16
WO 2007/071053 PCT/CA2006/002103
29
centrifuge and place on ice. 4 pL of 50 mM EDTA (pH 8.0) and 2 pL of 10 N NaOH
were added,
followed by an incubation at 65 C for 20 minutes to hydrolyse the RNA. 4 pL of
5 M acetic acid
was then added. The labeled cDNA was then purified using CyScribeTM GFXTM
purification
columns (Amersham) according to the manufacturer's protocol. Following
purification, the
volume was reduced to 5 pL by evaporation using a SpeedVac system. For
hybridization, a
hybridization solution was prepared according to the following: for each 100
pL of DIG Easy Hyb
solution (Roche), 5 pL of yeast tRNA (invitrogen; 10 mg/ml) and 5 pL of calf
thymus DNA was
added. The hybridization solution was then incubated at 65 C for 2 minutes and
cool to room
temperature. The labeled cDNA sample was then incubated in 80 pL of
hybridization solution at
65 C for 2 minutes and cool to room temperature. The hybridization mixture was
then pipetted
directly onto a coverslip and the slide (UltraGAPST"" slides, Corning Inc.)
"array-side" was put
down on top of the coverslip. The human 19k cDNA array (Microarray Centre,
University Health
Network, Toronto, Canada), a single-spotted array containing 19,008
characterised and
unknown human ESTs, was used for the studies presented herein. The slides were
then put in
hybridization chambers and incubated for 12-16 hours at 37 C. For washing, the
coverslip were
quickly but gently dipping the array in 1X SSC, and the slides were placed
into a staining rack
and into a staining dish (Evergreen Scientific through Diamed cat# E/S258-4100-
000) with fresh
1X SSC. The slides were washed for 3 sets of 15 minutes each at 50 C in clean
slide staining
boxes containing pre-warmed (at 50 C) 1X SSC/0.1% SDS solution with gentle
occasional
agitation. After the washes were completed, the slides were rinsed twice in
room temperature
1X SSC (plunging 4-6 times) and then in 0.1X SSC. The slides were then spinned
dry at 600
rpm for 5 minutes in a slide box lined with Whatman paper (Whatman, UK) and
scanned.
Experimental design, sample description and preparations, hybridizations, data
analysis and
annotations meet MIAME compliance.
[00116] Microarray data preprocessing. Microarrays were scanned at 16 bits
using the
ScanArray Express ScannerTM (Packard Bioscience) at 10-pm resolution at 635
(R) and 532 (G)
nm wavelengths for cy-5 and cy-3 respectively to produce image (tiff) files
that were quantified
using Genepix ProTM 6.0 image analysis software (Molecular Devices
Corporation). Bad spots
were flagged manually according to their morphologies. The results were saved
as
QuantarrayTM files (QAF), where the intensity values ranged from 0 to 216-1
(65535) units. The
tiff and QAF files were compressed and archived for permanent storage and
further analysis.
The microarrays were then screened for quality, first by visual inspection of
the array with
flagging of poor quality spots, and second with automated scripts that scanned
the quantified
output files and measured overall density distribution on each channel and
number of flagged
spots. Box-plots, MA-plots, and density distribution plots were drawn and
inspected. Each
quantified output file was run though the following pre-processing steps using
the R language
and environment (http://www.r-project.org, Wit et al., 2004. Statistics for
Microarrays: Design,
CA 02634072 2008-06-16
WO 2007/071053 PCT/CA2006/002103
Analysis and Inference. John Wiley and Sons Ltd, England. 1-265 pp. -
Dalgaard, 2002.
Introductory Statistics, R. Springer. 1-288 pp.; Maindonald et al., 2003. Data
Analysis and
Graphics, R. Cambridge University Press, Cambridge. 1-362 pp.; Everitt et al.,
2006. A
Handbook of Statistical Analyses, R. Chapman & Hall/CRC, Boca Raton, FL. 1-304
pp.) and the
Limma package (Smyth, Bioinformatics and Computational Biology Solutions using
R and
Bioconductor, 397-420). For minimum intensity filtering, R and G values were
treated with a
surrogate replacement policy for estimating sub-threshold values. For
normalization within
arrays, the raw merged R and G channels were lowess-normalized (grouped by
print-tip) and
transformed to log2 ratios (Smyth, supra; and Fukunaga, Introduction to
statistical pattern
recognition, 1-592). The commensurability of average brightness between the
arrays of a pool
of arrays was then assured using zero-centering of log-distributions
normalization. When both
duplicate spots of a clone (gene) passed quality control, the average profile
of the replicate
clones was calculated and used as the representative profile for that gene. If
only one of the
clone duplicate spots passed quality control, only that profile was used in
the downstream
analysis. All data were then represented as Iog10 (Red/Green) expression
ratios for further
analysis.
[00117] Selection of top 100 Tcn*/TEM discriminating genes. From the set of
19k
microarray genes that passed QC criteria during preprocessing of microarray
data, we retained
only the genes for further analysis with TcM/TEM discriminating F-test p-
values<0.01. From this
set, a final subset of 100 genes was further manually selected according to
known functions and
pathways including apoptosis, cell cycle and signaling.
[00118] Principal Components Analysis (PCA). A data matrix comprising 13 TcM
and 13
TEM samples (rows), and 100 "top" TcM/TEM discriminating genes (see above) was
constructed.
Using singular value decomposition of the data matrix, a standard PCA of the
data's 100 x 100
covariance matrix was computed, each sample comprising 100 genes. PCA computed
and plot
generated by Ref GeneLinker PlatinumTM V4.6 (Improved Outcomes Software Inc,
Ontario,
Canada).
[00119] Two-way hierarchical clustering. Hierarchical clustering was carried
out over the
same set of 26 samples and 100 genes as used for PCA. We used Pearson
correlation as the
similarity measure between genes and samples for clustering. Analyses were
performed using
GeneLinker PlatinumTM V4.6 software.
[00120] Quantitative real-time PCR analysis. Changes in gene expression
observed by
array analyses were verified by low-density array performed on an Applied
Biosystems
detection system (Foster City, CA). Briefly, cDNA was synthesized from total
RNA (1 g per
sample, n=4) in a reverse transcriptase (RT) reaction in 20 l of lxfirst-
strand synthesis buffer
(Invitrogen). Amplification of cDNA (1/20) was performed using SYBR Green PCR
buffer
CA 02634072 2008-06-16
WO 2007/071053 PCT/CA2006/002103
31
(Perkin-Elmer, Wellesley, MA), containing 0.1 M of specific primers. Before
the samples were
analyzed, standard curves of purified, target-specific amplicons were created.
The mRNA
expression for each gene was determined by comparing it with its respective
standard curve.
This measurement was controlled for RNA quality, quantity, and RT efficiency
by normalizing it
to the expression level of the GAPDH gene. Statistical significance was
determined by use of
normalized fold changes and ANOVA. The p-values were calculated using a two-
tailed T-test,
and assuming that the true variances were unknown.
[00121] Induction and quantification of apoptosis. Sorted cells were cultured
in complete
RPMI and then treated as indicated in the figure legends. Apoptotic cells were
detected using
annexin-V labeling according to the manufacturer's protocol (Biosource). The
fluorescence
signals were measured by flow cytometry using a BD LSRI flow cytometer (BD-
Biosciences).
Approximately 50,000-gated events were collected for each sample.
[00122] Western Blotting analysis. TcM and TEM were sorted as described above.
Cells
were washed twice with PBS and re-suspended in lysis buffer containing 50 mM
NaF and 1 mM
sodium pyrophosphate. Proteins from total cell extracts (10 pg) were separated
on SDS-PAGE
and electrotransfered onto PVDF membranes (Roche, Indianapolis, IN). Membranes
were
incubated overnight at 4 C with specific antibodies as described in the figure
legends.
Detection of the immune complexes was performed using horseradish peroxidase
(HRP)-
conjugated goat anti-mouse (1:2500) or goat anti-rabbit IgG antibodies
(1:3000). HRP activity
was detected using an enhanced chemiluminescence detection procedure (ECL-plus
detection
system, Amersham Biosciences). Membranes were subsequently stripped and
restained with
an anti-actin Abs (1:10000). The expression level of actin was used to control
for equal loading.
Protein expression levels were expressed as a percentage of the highest
signals obtained.
[00123] Intracellular staining. The cells were labeled with anti-CD4-Amcyan,
anti-CD27-
PB, anti-CD45RA-APCcy7 for 20 min at 4 degrees. The cells were fixed in 2% PFA
for 15 min at
RT and then incubated with anti-GrB-Alexa700, anti-Perforin-FITC or Anti-FASL-
PE for 20 min
at RT in 0.5% saponin (in PBS). Analysis was performed on gated-TGM and -TEM.
Around
20,000-gated events were collected on a BD LSRII flow cytometer (BD-
Biosciences).
[00124] Proliferation assay. Sorted TcM or TEM were co-cultured with mature
autologous
dendritic cells (mDC) (ratio T/DC: 40/1) in the presence of SEA (50 ng/ml) as
previously
described (Younes et al., 2003. J. Exp. Med. 198(12):1909-22.). After 1 to 15
days of co-culture,
cells were labeled with anti-CD4 and anti-TCRV(322. For the analysis, cells
were gated on CD4+
T cells and approximately 150,000-gated events were collected on a LSRII
cytometer.
[00125] Flow cytometry analysis of STAT5a and AKT phosphorylation status.
PBMCs
were resuspended at 20 millions/ml in RPMI and incubated for 30 min in the
presence of CCR7-
FITC abs (20 l/million cells) at room temperature. The cells were then washed
and re-
CA 02634072 2008-06-16
WO 2007/071053 PCT/CA2006/002103
32
suspended at a cell concentration of 5 millions per ml in PBS and stimulated
for 15 min at 37 C
in the presence of IL-2 (100 U/ml) or IL-7 (10 ng/ml). Following stimulation,
the cells were fixed
for 10 min at 37 degrees using cytofix buffer (BD Biosciences), pelleted and
then permeabilized
in PERM-III buffer (BD Biosciences) for 30 min on ice. The cells were then
washed twice in
Staining buffer (BD Biosciences) and rehydrated for 30 min on ice in the
staining buffer. Cells
were then labeled with anti-CD4-APCcy7, anti-CD45RA-ECD, anti-CD27-PE and anti-
pSTAT5a
(Y694)-Alexa647 specific antibodies for 30 min at room temperature. For the
analysis, the cells
were gated on TcM and TEM. An average of 20,000-gated events was collected on
LSRII
cytometer. For CD28 cross-linking, the cells were re-suspended at 10
million/ml in the presence
of CD28 (2 g/ml) for 30 min on ice. The cells were then washed twice in PBS
and
subsequently stimulated by cross-linking with rabbit anti-mouse Igs (20 g/ml)
(Biosource) in 25
l pre-warmed medium for 15 min. The cells were then fixed and permeabilized as
described
above and labeled with CD4-APCcy7, CD45RA-ECD, CD27-PE, pAKT S473-Alexa 488.
Flow
cytometry analysis was performed on gated TcM and TEM. Around 20,000-gated
events were
collected on a BD LSRII cytometer.
[00126] EXAMPLE 2: FUNCTIONAL AND PHENOTYPIC CHARACTERIZATION OF
CD4+ TcM AND TEM.
[00127] Memory T cell subsets were sorted by flow cytometry from whole PBMC
isolated
from 13 healthy donors based on CD45RA, CD27 and CCR7 expression. Naive cells
are
characterized as CD45RA+, CD27+ and CCR7+; TcM cells (Central Memory) have the
following
phenotype: CD45RA-, CD27+ and CCR7+, and TTM celis ("Transitory" Memory) are
CD45RA-,
CD27+ and CCR7-; while TEM cells (Effector Memory) are defined by the lack of
expression of
these three markers (CD45RA-, CD27- and CCR7-) (Seder, R.A., and R. Ahmed.
2003. Nat
Immunol 4:835-842) (Fig. 1A). All TcM (>95%) expressed CD28, CD62L and CD95
(Fas). TEM
were also homogeneously CD28+ and CD95+, albeit only 30-40% expressed CD62L
(data not
shown). The ex-vivo sorted TEM subpopulation expressed the effector cytotoxic
molecules
Granzyme B and perforin, while these two molecules were undetectable in TcM
(Fig. 113). TEM
also showed higher (threefold) expression levels of Rab27a, a molecule
involved in
degranulation and cytotoxic effector function (15), than TcM (Fig. 1C). Taken
together, these
results show that TEM are functionally and phenotypically more differentiated
than TcM.
[00128] EXAMPLE 3: TcM CD4+ T CELLS ARE RESISTANT TO FAS-INDUCED
APOPTOSIS AND SHOW ENHANCED PROLIFERATION CAPACITY FOLLOWING
STIMULATION WITH MATURE DENDRITIC CELLS.
[00129] We next determined the sensitivity to apoptosis of TcM and TEM. TcM
and TEM
sorted cells were cultured in the presence or absence of anti-Fas antibodies
or etoposide for 24
hours (n=3). Annexin-V labeling showed a significant difference (p_0.007) in
the capacity of TcM
CA 02634072 2008-06-16
WO 2007/071053 PCT/CA2006/002103
33
to resist Fas-mediated apoptosis as compared to TEM (Fig. 1 D). Of note, TcM
cells are less prone
to undergo spontaneous apoptosis (i.e., without any apoptotic inducers)
(p<_0.02) than the TEM
subset (Fig. 1 D). Moreover, in response to etoposide, used as a non-specific
apoptotic inducer,
both TcM and TEM present similar sensitivity to apoptosis, thereby confirming
that the apoptotic
machinery is intact in both cell types. We also determined the capacity of
purified TcM and TEM to
proliferate and persist in a 15-day culture assay after stimulation with SEA-
pulsed mature
dendritic cells. Proliferation was determined by quantifying the expansion of
the SEA-responsive
TCRV(322+ T cells. TcM present a better expansion potential and can persist
longer than TEM, as
demonstrated by a tenfold increase in the absolute number of SEA-responsive
TCRV(322+ T
cells in a 15-day culture period (Fig. 1 E). Similar data were also generated
using CFSE whereby
TcM undergo several more rounds of proliferation when compared to TEM (data
not shown).
Collectively, these results demonstrate that CD4+ TcM and TEM subsets exhibit
different
capacities to proliferate, persist and undergo both spontaneous and Fas-
induced apoptosis.
These observations led us to investigate the cell survival pathways
responsible for that
resistance to cell death in TcM and to characterize the differences in these
pathways between
TcM and TEM.
[00130] EXAMPLE 4: GENE EXPRESSION PROFILING ANALYSIS OF TcM AND TEM
SHOWED DIFFERENCES IN THE EXPRESSION OF GENES ASSOCIATED WITH
SURVIVAL PATHWAYS.
[00131] Using single gene searches, we then identified the genes that
distinguished TcM
from TEM. Genes selected using ANOVA, where p<0.05 or fold difference in
expression > 1.3
were considered significant. We identified more than 270 significant genes
that distinguished
both subsets ( see Figures 2a and 2b). Within the selected genes, 6% were
related to
apoptosis, 9% to cell cycle/cell proliferation, and 7% to signaling. These
genes also
encompassed biological functions including homing/adhesion, gene expression
regulation,
immune response and transport. Apoptosis-related genes displaying a different
expression
profile when comparing TcM and TEM are listed in Figure 3. TcM expressed
higher levels of
TOSO, CD27, STAT5a, PIM-2, ReIA, and Birc6 (Bruce) mRNA, all belonging to
distinct anti-
apoptotic pathways (Hitoshi, Y., et al., 1998. Immunity 8:461-471; Yan, B. et
al., 2003. J Biol
Chem 278:45358-45367; Gravestein, L.A. et al., 1998. Eur J Immunol 28:2208-
2216;
Grossmann, M. et al., 2000. Embo J 19:6351-6360; Hao, Y. et al., 2004. Nat
Cell 8iol 6:849-
860), than their TEM counterparts. In contrast, TEM showed higher levels of
expression of genes
involved in the induction of apoptosis, including Caspase-8 and Caspase-3, as
well as several
proteins endowed with a pro-apoptotic function, such as Galactin-1 (LGALS1),
Galactin-3
(LGALS3) (Hahn, H.P. et al., 2004. Cell Death Differ 11:1277-1286), Clusterin
(Shannan, B. et
al., 2006. Cell Death Differ 13:12-19), YARS (Wakasugi, K., and P. Schimmel.
1999. Science
CA 02634072 2008-06-16
WO 2007/071053 PCT/CA2006/002103
34
284:147-151) and TGIF, a TGFP-targeted gene (Feng, X.H., and R. Derynck. 2005.
Annu Rev
Cell Dev Biol. 21:659-93). This expression profile suggested that TEM contain
an active pro-
apoptotic machinery. On the other hand, several genes that promote cell
survival were
selectively expressed at high levels in TcM, rendering them more resistant to
apoptosis. Of note,
we observed similar differences in the expression of several of the above-
cited genes when
comparing TcM and TEM in the CD8+ T cell compartment (data not shown).
[00132] In the next set of experiments, we validated and detailed the gene
array data by
performing real-time RT-PCR on the same donor samples (Figure 4). The results
showed a
significant increase in the FOXO3a transcriptional target pro-apoptotic genes,
including Bim
(Essafi, A. et al., 2005. Oncogene 24:2317-2329), FasL (Suhara, T. et al.,
2002. Mol Cell Biol
22:680-691), and genes involved in cell cycle regulation including GADD45a
(Tran, H. et al.,
2002. Science 296:530-534) as well as pRb2/p130, a member of the
Retinoblastoma family
(Kops, G.J. et al., 2002. Mol Cell Biol 22:2025-2036) in the TEM subset (n=5).
Furthermore, the
RT-PCR data confirmed the upregulation of CD27 and the anti-apoptotic PIM-2
kinase (Figure
4), as well as of TOSO and TGIF (data not shown). These results validated our
gene array data
and further suggested the involvement of STAT5a and FOXO3a signaling pathways
in
mediating the survival of TcM.
[00133] EXAMPLE 5: STAT5A SIGNALING PATHWAY IS FUNCTIONALLY
UPREGULATED IN TcM.
[00134] STAT5a is a downstream effector of yc cytokines (Nosaka, T. et al.,
1999. Embo
J 18:4754-4765). We observed differential expressions of PIM-1 and PIM-2, two
transcriptional
targets of STAT5a in the ex-vivo TcM subset. Indeed, TcM showed twofold higher
expression of
both PIM-1 and PIM-2 than TEM (n=3) (Fig. 5A). Because of the importance of
the STAT5a
pathway in the regulation of T-cell survival (Nosaka, T. et al., supra), we
evaluated the ability of
IL-2 and IL-7 to trigger the STAT5a signaling pathway in CD4+ T cell memory
subsets. The
phosphorylated form of STAT5a (Y694) (pSTAT5a) was quantified by flow
cytometry. Basal
pSTAT5a levels were similar in TcM and TEM (Fig. 5B). Both TcM and TEM
upregulated pSTAT5a
in response to a brief IL-7 treatment (Fig. 5B). However, the proportion of
cells that up-regulated
pSTAT5a was significantly higher (30% 6.5, p<0.002) in TcM as compared to
TEM (Fig. 5C).
Treatment with IL-2 also induced differential pSTAT5a levels (p<0.04) between
TcM and TEM.
Indeed, 90-100 % of TcM showed a phosphorylated STAT5a form, compared to 50-60
%
observed in TEM. Of note, TEM present a bimodal distribution of pSTAT5a in
response to IL-2,
indicating that TEM are heterogeneous in terms of response to IL-2.
[00135] The differences in pSTAT5a levels were not due to differences in the
levels of
expression of IL-2 or IL-7 receptors. Indeed, the proportion of cells
expressing CD127 (IL-7R(x),
CD25 (IL-2Ra) and CD132 (yc chain) on TcM were comparable to those on TEM
(Fig. 5D). Of
CA 02634072 2008-06-16
WO 2007/071053 PCT/CA2006/002103
note, CD122 (IL-2RP) was undetectable on ex-vivo TcM and TEM (data not shown).
Although IL-
2R is expressed on about 20% of TcM as assess by cytometry, 100% of these
cells are able to
phosphorylate STAT5 in response to IL-2. This suggests that TcM express
undetectable levels of
IL-2R that are sufficient to induce STAT5 signaling in response to IL-2. Taken
together, these
results indicate that the STAT5a pathway, as shown by the levels of pSTAT5 and
its
downstream effectors (PIM-1 and PIM-2), is differentially regulated between
TcM and TEM. The
observed differences suggest that TcM display an enhanced capacity to mobilize
the STAT5a
pathway for their survival as compared to TEM.
[00136] EXAMPLE 6: REGULATION OF THE FOXO3A PATHWAY IN MEMORY CD4+
T CELL SUBSETS.
[00137] FOXO3a (Genbank accession Number NM_001455, Anderson, M.J. et al.,
1998.
Genomics 47(2), 187-199) belongs to the forkhead family of transcription
factors which are
characterized by a distinct forkhead domain. FOXO3a transcriptional activity
is regulated
through direct phosphorylation. Once phosphorylated, FOXO3a is excluded from
the nucleus
and thus becomes transcriptionally inactive. FOXO3a controls the expression of
several genes
including FasL, Bim, Gadd45a, p27kip and p130 (Coffer, P.J., and B.M.
Burgering. 2004. Nat
Rev Immunol 4:889-899, Van Der Heide, L.P. et al., 2004. Biochem J 380:297-
309). Our gene
expression profiling analysis and RT-PCR data suggested the specific
involvement of the
FOXO3a pathway in TcM survival. Therefore, we analyzed the phosphorylation
status of
FOXO3a in TcM and TEM. We observed that the levels of phosphorylated forms of
FOXO3a
(pFOXO3a) (phosphorylated at position S315 and/or S253 and/or T32) were
reproducibly (n=5)
more than twofold higher in ex-vivo TcM as compared to TEM. It is worth noting
here that
expression levels of total FOXO3a remained similar in the two memory subsets
(Fig. 6A, upper
panel). We then determined whether the observed decrease in FOXO3a
phosphorylation levels
observed in TEM was associated with increased levels of FOXO3a transcriptional
target proteins.
Our results show that TEM expressed threefold higher levels of Bim and p130
proteins and a 1.7-
fold higher expression of GADD45a when compared to the TcM compartment (Fig.
6A, bottom
panel). FasL, whose mRNA transcript was clearly expressed at higher levels in
TEM than in TcM
(see Fig. 4), was undetectable in ex-vivo TcM and TEM when assayed by Western
blot and flow
cytometry (data not shown). However, upon T cell activation induced by PMA and
ionomycin,
FasL was selectively upregulated in TEM (in around 30% of the TEM subset),
while it remained
undetectable in TcM (Fig. 6B). Taken together, our data show that a high
expression of
pFOXO3a observed in TcM is associated with the low expression of pro-apoptotic
proteins Bim,
Gadd45a and p130, thereby favoring their resistance to apoptosis and
consequently their long-
term survival.
[00138] EXAMPLE 7: BLOCKING OF AKT AND IKK KINASES ACTIVITY PREVENTS
CA 02634072 2008-06-16
WO 2007/071053 PCT/CA2006/002103
36
FOXO3A PHOSPHORYLATION LEADING TO TcM CELL DEATH.
[00139] To identify the kinases involved in the phosphorylation of FOXO3a in
TcM, we
analyzed FOXO3a phosphorylation, in total CD4+ T cells (total CD4+ T cells
were used due to
the limiting amounts of TcM and TEM obtained after cell sorting) following
treatment with specific
kinase inhibitors. We used the pharmacological kinase inhibitors AKT-IV and
Wedelolactone,
which respectively inhibit AKT and IKK activities. We also tested two other
kinase inhibitors:
STO-609, specific for CamKK described as an upstream mediator of AKT
(Soderling, T.R. 1999.
Trends Biochem Sci 24:232-236); and the Mek1/2 inhibitor, U0126, used as an
irrelevant kinase
inhibitor. The results (Fig. 7A) clearly showed that treatment with the AKT
and IKK inhibitors led
to a specific and significant reduction in the levels of pFOXO3a (S253). The
expression levels of
pFOXO3a (S253) in CD4+ T cells was eightfold lower in the presence of the AKT-
inhibitor and
4.5-fold lower in the presence of the IKK-inhibitor, as compared to untreated
cells (Fig. 7A).
[00140] To confirm the importance of the phosphorylation of FOXO3a in memory T-
cell
survival, purified CD4+ T cells were treated with different kinase-inhibitors,
and apoptosis was
assessed by flow cytometry using Annexin-V labeling. Fig. 7B shows that the
proportion of
Annexin-V+ cells are increased in a dose-dependant fashion after exposing CD4+
T cells to AKT
or IKK inhibitors. Moreover, we observed a significant upregulation of the
levels of the pro-
apoptotic molecule Bim, known to be a FOXO3a target, in cells treated with AKT
or IKK
inhibitors (three and eightfold respectively) (Fig. 7C). Of note, the AKT and
IKK inhibitors did not
change the levels of FasL expression when assayed by Western blot or flow
cytometry (data not
shown). These results indicated that the dephosphorylation of FOXO3a in CD4+ T
cells was
associated with Bim upregulation and apoptosis. None of the other kinase-
inhibitors tested
induced apoptosis in CD4+ T cells (Fig. 7B) even when used at much higher
concentrations
(data not shown). Taken together, these results show that among the kinase-
inhibitors tested,
only those able of inducing FOXO3a dephosphorylation have the capacity to
induce CD4+ T cell
apoptosis. It is thus likely that activated AKT and IKK promote CD4+ T cell
survival, at least in
part, by phosphorylating FOXO3a, thereby repressing its transcriptional
activity and leading to
the downregulation of the transcription of the pro-apoptotic molecule Bim.
[00141] To assess the importance of AKT and IKK in the survival of memory T
cells, we
evaluated the expression of the phosphorylated forms of these proteins in TcM
and TEM subsets.
First, pIKKov(3 expression was assayed in ex-vivo sorted TcM and TEM. While
pIKKa~3 was
expressed in TcM, it was undetectable in TEM (Fig. 7D). Second, since the
phosphorylated form
of AKT (pAKT) was undetectable by Western blot in ex-vivo sorted cells, we
performed a
PhosFlow analysis on PBMCs treated with H202 (known to induce phosphorylation
of AKT). The
results showed that the induction of pAKT (S473) was higher in TcM than TEM in
response to
H202 (Fig. 7E). More importantly, in response to CD28 triggering, TcM cells
presented a modest
CA 02634072 2008-06-16
WO 2007/071053 PCT/CA2006/002103
37
(about 20%), though consistent and significant increase (p<0.007) in AKT
phosphorylation as
compared to the TEM (Fig. 7E). These results suggest that in resting TcM, the
constitutive
activation of IKK4 could maintain the level of FOXO3a phosphorylation.
Moreover, CD28
triggering leads to higher levels of pAKT in TcM and could also promote FOXO3a
phosphorylation. Taken together, these results suggest that the
phosphorylation levels of
FOXO3a in TcM can be maintained, both in their resting state and upon CD28
triggering, through
the activation of IKK and AKT, respectively, thereby promoting TcM survival.
[00142] The corollary of the above results is that the lack of FOXO3a
phosphorylation
could render TcM susceptible to signals inducing cell death. To determine the
implication of the
AKT- and IKK- signaling pathways in the survival of TcM, we sorted TcM and TEM
and exposed
them to AKT-or IKK inhibitors at their IC50 (AKT-IV: 1.6 M and wedelolactone:
100 M). After
24h of treatment, the proportion of apoptotic cells was quantified using
Annexin-V labeling (Fig.
8, top panel). The treatment of TcM with the IKK inhibitor resulted in an
eightfold increase in
Annexin-V+ cells, while only a twofold increase was observed in TEM, all
relative to untreated
cells (n=2) (Fig. 8, bottom panel). Similar results were also observed when
these subsets were
exposed to the AKT inhibitor (Fig. 8). Experiments aimed at blocking FasL
triggering, using Fas-
Fc chimera, in response to AKT and IKK inhibitor-induced apoptosis did not
prevent TcM cell
death (data not shown). These results indicate that abrogating the AKT and/or
IKK pathways
leads to apoptosis to a greater extent in TcM as compared to TEM confirming
that these pathways
are involved in the survival of TcM. Moreover, the ability of AKT and IKK
inhibitors to up-regulate
Bim levels of expression (see Fig. 7C) without affecting FasL expression
suggest that cell death
induced by these kinase inhibitors could be achieved in part thought FOXO3a
dephosphorylation and the subsequent increased expression of pro-apoptotic
molecules such
as Bim.
[00143] EXAMPLE 8: TCR AND IL-7 TRIGGERING PHOSPHORYLATE DISTINCT
SITES ON FOXO3A.
[00144] To identify the signals that trigger FOXO3a phosphorylation in CD4+ T
cells, we
quantified the levels of pFOXO3a (S253, S315 and T32) in response to CD3
and/or CD28
cross-linking, as well as IL-2, IL-7, IFN-y and PMA treatment. pFOXO3a (S253)
was easily
detectable in ex-vivo CD4+ T cells, and none of the tested stimuli induced
significant changes in
the expression level of this phosphorylated form of FOXO3a (Fig. 9A). In
contrast, FOXO3a
phosphorylation on S315 was significantly induced in response to CD3 + CD28
triggering. It is
worth noting that CD3 or CD28 triggering alone did not lead to detectable
FOXO3a
phosphorylation (S315), suggesting that both signals synergize to induce
FOXO3a
phosphorylation at S315 (Fig. 9A, top panel, lanes 2, 3 and 4). None of the
other tested
inducers (including yc cytokines) led to FOXO3a (S315) phosphorylation.
Interestingly, the
CA 02634072 2008-06-16
WO 2007/071053 PCT/CA2006/002103
38
levels of pFOXO3a at T32 were significantly increased (threefold) when CD4+ T
cells were
treated with IL-7. No induction of pFOXO3a (T32) was observed when cells were
triggered with
anti-CD3/CD28 or IL-2 (Fig. 9B). Taken together, these results indicate that
TCR and IL-7
triggering induce specific FOXO3a phosphorylation at distinct sites (S315 and
T32 respectively),
suggesting that FOXO3a phosphorylation involves multiple signals.
[00145] EXAMPLE 9: COMPARISON OF THE EXPRESSION OF SELECTED GENES
IN TcM ISOLATED FROM AVIREMIC HAART-TREATED HIV-INFECTED INDIVIDUALS VS.
LONG-TERM NON-PROGRESSORS (LTNPs).
[00146] PBMC obtained from LTNP and aviremic HAART-treated patients were
sorted
into TcM and TEM using CD27, CCR7 and CD45RA surface markers. Sorted cells
were subjected
to RNA isolation, amplification and gene array analysis. Long-term non-
progressors (LTNPs)
are subjects infected by HIV for more than 10 years and who naturally (i.e. in
the absence of
antiretroviral therapy) control HIV infection. Their CD4 T cell count remains
relatively stable and
they exhibit low HIV viral load (Pantaleo G. and Fauci A.S., 1995. Annu Rev
Immunol, 13:487-
512). Aviremic HAART-treated patients are HIV-infected patients who do not
naturally control
HIV infection in the absence of antiviral therapy, but who maintained low HIV
viral loads when
treated with HAART. Figure 10 shows differences in the gene expression profile
of TcM from
LTNPs versus aviremic HAART-treated HIV patients. TcM from LTNP subjects show
higher
expression of IAP3 but lower expression of GADD45a, DUSP1, PTEN, SOCS1 and
SOCS2 as
compared to TCM from aviremic HAART-treated subjects.
[00147] EXAMPLE 10: COMPARISON OF THE EXPRESSION OF GENES IN BLOOD
SAMPLES ISOLATED PRIOR TO AND AFTER YELLOW FEVER-VACCINATION.
[00148] Whole blood from Yellow Fever (YF)-vaccinated subjects was collected
14 days
post-immunization. Whole blood from HIV infected individuals was collected
during primary HIV
infection (the first 6 months after the first positive diagnosis). Whole blood
cells were lysed and
their RNA was reverse transcribed to cDNA and subjected to gene array analysis
using the
method described in Example 1. The Yellow Fever 17D vaccine is a live-
attenuated vaccine
which induces efficacious and long-term protection against Yellow Fever
infection in vaccinated
individuals (Barrett A.D., 2001. Ann. N. Y. Acad. Sci., 951: 262-71) and
therefore constitutes a
good model for the induction of a protective immune response in humans. Figure
11 depicts the
genes whose expression in blood cells is significantly modulated after YF
vaccination (3 and/or
7 days after vaccination).
[00149] Although the present invention has been described hereinabove by way
of
specific embodiments thereof, it can be modified, without departing from the
spirit and nature of
the subject invention as defined in the appended claims.
DEMANDE OU BREVET VOLUMINEUX
LA PRESENTE PARTIE DE CETTE DEMANDE OU CE BREVET COMPREND
PLUS D'UN TOME.
CECI EST LE TOME 1 DE 3
CONTENANT LES PAGES 1 A 38
NOTE : Pour les tomes additionels, veuillez contacter le Bureau canadien des
brevets
JUMBO APPLICATIONS/PATENTS
THIS SECTION OF THE APPLICATION/PATENT CONTAINS MORE THAN ONE
VOLUME
THIS IS VOLUME 1 OF 3
CONTAINING PAGES 1 TO 38
NOTE: For additional volumes, please contact the Canadian Patent Office
NOM DU FICHIER / FILE NAME:
NOTE POUR LE TOME / VOLUME NOTE: