Note: Descriptions are shown in the official language in which they were submitted.
CA 02637500 2008-07-16
WO 2007/084748 PCT/US2007/001617
A METHOD OF EYE EXAMINATION BY OPTICAL COHERENCE
TOMOGRAPHY
Jay Wei
Ben Jang
David Huang
Yonghua Zhao
RELATED APPLICATION
[001] The present application claims priority to Provisional Application No.
60/760,046, filed on January 19, 2006, by Jay Wei, Ben'Jang, and David Huang,
and to
Provisional Application No. 60/782,888, filed on March 17, 2006, by Jay Wei,
Ben Jang,
David Huang, and Yonghua Zhao, each of which are herein incorporated by
reference in their
entirety.
BACKGROUND
1. Field of the Invention
[002] The present invention is related to a method of performing an eye
examination utilizing optical coherence tomography (OCT).
2. Discussion of Related Art
[003] Retinal imaging by conventional optical image methodology, such as
fundus
camera imaging and indirect ophthalmoscopic imaging, has been routinely used
clinically to
evaluate retinal structure change. Routine retinal imaging provides valuable
information for
a clinician to diagnosis a number of eye diseases, including glaucorna. When
there is a need
to evaluate the optic nerve head tissue structure changes for glaucoma
patients, stereoscopic
retinal images are required to detect volumetric changes in the three
dimensional nerve head
structure. However, to date an experienced clinician can only provide a
qualitative
interpretation of eye structural changes from the retinal photograph.
1
CA 02637500 2008-07-16
WO 2007/084748 PCT/US2007/001617
[004] Several imaging methods have been explored to quantitatively measure the
three-dimensional structure of the nerve head. The Glaucoma Scope made by
Ophthalmic
Imaging Systems, Sacramento, CA, used a technique of computed raster
stereography. The
Glaucoma Scope projected a series of equidistant, parallel, straight line
beams of light onto
the nerve head at oblique angles. By measuring the amount of deflection of the
lines of light,
nerve head topography can be determined. From the topographic view of the
nerve head,
many clinically significant volumetric parameters can be derived, such as disk
area, cup area,
disk rim area, and retinal nerve fiber layer (RNFL) thickness on the disk
margin.
[005] The Heidelberg Retinal Tomography (HRT), produced by Heidelberg
Engineering, Germany, is based on a Laser Scanning Ophthalmoscope, SLO. By
moving the
focus plane of the scanning beam in the SLO, the topography of the nerve head
can be
measured. However, tissues like the choroid layer, which is underneath the
superficial retinal
surface layer, can not be seen with the SLO methods. As a result, the
topography of the
optical nerve layer is indirectly measured utilizing an artificial reference
plane. Even with
these advanced techniques, the ability to sufficiently map the optic nerve
layer is limited.
Further, the disk margin, which is also inside the retinal nerve fiber layer,
is difficult to be
accurately outlined by the SLO image. The accuracy of determining nerve head
changes is
limited.
[006] A glaucoma exam, GDx, produced by Laser Diagnosis Technology, San
Diego, CA is another method for mapping the RNFL. The GDx technique is based
on
polarimetry. The RNFL tissue is birefrigent and will cause polarization
rotation as the
probing beam of light passes through the RNFL. The thickness of the RNFL is
indirectly
measured by measuring the magnitude of the polarization rotation as the light
beam is
scanned across the retina. The RNFL thickness map is obtained by scaning the
laser beam on
the nerve head region. There are also disadvantages with GDX diagnosis. The
cornea tissue
2
CA 02637500 2008-07-16
WO 2007/084748 PCT/US2007/001617
is also birefrigent, which will add to the polarization rotation. The
magnitude of polarization
rotation by the cornea depends on the cornea thickness and light beam incident
angle. The
RNFL thickness accuracy significantly depends on the individual subjects to be
measured.
[007] ' Optical Coherence Tomography (OCT) is a new image modality that has
been used for non-invasive human eye retinal imaging. A cross sectional
retinal image taken
while the beam is scanned across the retina allows the clinician to
quantitatively evaluate the
retinal nerve layer and retinal thickness. By composing radial line scan
patterns, a 3-D nerve
head geometry can be derived. An OCT system produced by Carl Zeiss Meditec,
Dublin,
CA, for example, scans six radial lines passing across the nerve head.
Volumetric parameters
like disk area, cup area, and disk rim area are derived from these radial line
images.
Conventionally, the RNFL thickness is measured in a circular scan at a
diameter of 3.45mm
centered on the center of the disk. OCT is advantageous over previous methods
because
OCT provides a direct measurement of the tissue thickness and does not
significantly depend
on other ocular tissue conditions. However, the sampling density is low
compare to the other
imaging methods and there are artifacts of the measurements resulting from
slow scan speeds.
Also, the RNFL thickness by a circular scan around the disk is often not
reliable due to the
off centering of the scan caused by inaccurate visual alignment and eye
motion. The
complete mapping of the retina nerve head volumetric parameters and RNFL
around the
nerve head region is usually unobtainable due to eye motion during the scan.
[008] A complete mapping of the nerve head by OCT imaging has been possible
only if the eye is fixed without any motion and there is no obscuration of the
OCT scan beam
so that important nerve head tissue are all visible in the OCT image. However,
neither of
these assumptions are feasible in a human subject.
[009] Several attempts have been made to track the scan beam with the retina
in
order to eliminate the effects of eye motion. Dan Ferguson (Physical Science
Inc, Andover,
3
CA 02637500 2008-07-16
WO 2007/084748 PCT/US2007/001617
MA) utilized active feedback to track the scan beam on the retina based on a
reflectometry
principle. This method provides real-time tracking capability and has
potential to scan
completely over the nerve head. However, the extra confocal scanning laser
hardware that
needs to be added to the OCT scanner to perform this tracking method is
complicated and
expensive. Further, during a blink of the patient's eye, the tracking signal
is lost and may not
be recoverable from the previous scan sequence.
[010] Another method of compensating for eye motion has been proposed by Dara
Koozekanani (The Ohio State University, Columbus, OH). This method uses a
combination
of the reflected signal of the scan beam and a video image to register the
retinal position.
However, it is unclear as to use of this method for mapping the clinically
significant nerve
head parameters. Using raster line OCT scans to acquire three dimensional data
sets for
mapping of the retinal layer thickness has been described by Mujat et al in
Optical Express.
However, no description of how to map the nerve head boundary contour, which
is essential
as a reference for deriving all nerve head morphologic parameters, has been
provided.
[011] There is a need for direct measurement of all nerve head volumetric
parameters, with complete mapping of the RNFL around the nerve head. Further,
there is a
need for acquiring and displaying all clinically significant information
corresponding to the
nerve head morphology that are highly desired by clinicians for diagnosing
diseases such as
glaucoma.
SIIMMARY
[012] In accordance with embodiments of the present invention, OCT images
taken
over a scan pattern are corrected utilizing one or more images. As such, a
method of eye
examination according to some embodiments of the present invention includes
acquiring
OCT images corresponding to a scan pattern, wherein the scan pattern
substantially covers a
4
CA 02637500 2008-07-16
WO 2007/084748 PCT/US2007/001617
nerve head region; determining disk boundary points frorn the OCT images;
matching the
disk boundary points with the disk boundary determined from one or more
template images;
correcting the disk boundary points; and determining at least one nerve head
morphology
characterization.
[013] In some embodiments, the scan pattern includes a plurality of concentric
circles and a plurality of radial lines. In some embodiments, correcting the
disk boundary
points includes performing a blood vessel correction. In some embodiments,
correcting the
disk boundary points includes determining a disk center. In some embodiments,
determining
at least one nerve head morphology characterization includes determining
retinal nerve fiber
layer thickness in a circle centered on the disk center. In some embodiments,
the one or more
template images are video images taken simultaneously with the OCT images. In
some
embodiments, correcting the disk boundary points includes correcting for eye
movement. In
some embodiments, the one or more template images is a template OCT image
taken with a
raster scan pattern. In some embodiments, a nerve head boundary is determined
in the
template OCT image.
[0141 These and other embodiments of the invention are further discussed below
with reference to the following figures. It is to be understood that both the
foregoing general
description and the following detailed description are exemplary and
explanatory only and
are not restrictive of the invention, as claimed. Further, specific
explanations or theories
regarding the deposition or performance of certain layers during deposition
processes or in
the performance of devices incorporating those layers are presented for
explanation only and
are not to be considered limiting with respect to the scope of the present
disclosure or the
claims.
CA 02637500 2008-07-16
WO 2007/084748 PCT/US2007/001617
BRIEF DESCRIPTION OF THE DRAWINGS
[015] Figures 1A and 1B show images of the nerve head taken by the Heidelberg
Retinal Tomography (HRT) technique.
[016) Figures 2A and 2B show RNFL thickness plots of early and late stage
glaucoma, respectively, produced by the GDx technique.
[017] Figure 3 shows an image of the nerve head taken by an OCT technique.
[018] Figure 4 shows a scan image pattern utilized in embodiments of the
current
invention for mapping the thickness of retinal nerve fiber layer around the
disk and nerve
head morphology.
[019] Figure 5 shows an example graphic produced with an embodiment of the
current invention to display the nerve head morphology related to a glaucoma
diagnosis.
[020] Figure 6 shows an example of image distortion in an OCT scan caused by
light absorption of the blood vessel tissue surrounding the nerve fiber disk.
[021] Figure 7 shows an example of disk margin distortion caused by eye motion
during the acquisition of the image.
[022] Figure 8 shows a block diagram illustrating the steps of the automatic
image
processing method a.ccording to embodiments of the present invention.
[023] Figure 9 shows a scan pattern and graphic display according to
embodiments
of the current invention for mapping the nerve head boundary.
[024] Figure 10 illustrates a brightness compensation routine that can be
utilized in
some embodiments of the present invention.
[025] Figure 11 illustrates an embodiment of an OCT imager that can be
utilized to
perform an eye examination according to some embodiments of the present
invention.
[026) In the figures, elements having the same designation have the same or
similar
functions.
6
CA 02637500 2008-07-16
WO 2007/084748 PCT/US2007/001617
DETAILED DESCRIPTION
[027] Embodiments of the current invention can be utilized for evaluating the
eye
tissue structure for diagnosing eye diseases. Some embodiments utilize an
Optical Coherence
Tomography (OCT) image, a fundus image, and an algorithm associated with both
image
modalities to map out the eye tissue structure accurately. Some embodiments of
the
invention provide an image of the eye tissue structure substantially absent of
artifacts caused
by eye motion or image distortion caused by light absorption of the retinal
blood vessels.
The current disclosed eye examination methods can be utilized in the diagnoses
of eye
pathologies in the optic nerve head, for example Glaucoma.
[028] As discussed above, diagnosis of retinal eye pathologies depends on
accur=ate
and complete imaging of the nerve head area. Images of.the nerve head area are
shown in
Figures iA, 1B, 2A, 2B, and 3. Figures IA and IB were acquired with the HRT
technique,
Figures 2A and 2B were acquired with the GDx Technique, and Figure 3 was
acquired with
an OCT technique. Each one of these images illustrates difference aspects of
characterizing
the nerve head.
[029] Figures 1 A and 1 B shows an image 110 of the optic nerve head disk
characterized by disk contour 111, and cup 112. The disk and cup shapes shown
in Figures
IA and IB are derived from a scanning laser confocal image device by HRT
(Heidelberg
Retinal Tomography, Heidelberg Engineering, Germany). As discussed above, the
HRT
technique scans the focal plane of a Laser Scanning Opthalmoscope (SLO) across
the nerve
head.
[030] The disk contour 102 shown in Figure 1 B is drawn by an operator on the
confocal retinal image 101. The shape of cup 112 is derived from a reference
plane and the
disk contour at that plane. The rim area 113 shown in image 110 of Figure 1 A
is the area
between the disk contour 111 (drawn as contour 102 on retinal image 101) and
cup 112. The
7
CA 02637500 2008-07-16
WO 2007/084748 PCT/US2007/001617
ratio of rim area 113 and the area enclosed by disk contour 111, the disk
area, is a clinically
significant parameter for glaucoma diagnosis. However, the reference plane is
an important
parameter for defining the disk area and thereby determining the rim to disk
ratio calculation,
and it is arbitrarily defined as 50 m below the peripapillary retinal
surface. Height variation
of the retinal surface, which is often seen in ocular diseases, causes
reference plane changes
and therefore will change the calculated disk and cup parameters. Calculations
of disk and
cup parameters can therefore by unreliable utilizing this technique.
[0311 Another important parameter that is utilized in the diagnosis of optic
nerve
pathologies is the retinal nerve fiber layer (RNFL) thickness. The RNFL
thickness is
typically determined by the retinal height above the reference plane. A
display (not shown
with Figures IA and 1B) of the retinal height along the disk margin is usually
plotted as the
variation of the RNFL thickness plot. Therefore, the RNFL thickness plots
determined by the
HRT technique are not accurate.
[0321 Figures 2A and 2B show RNFL thickness maps 200 and 201 of the
progression of an early stage glaucoma patient derived from a Polarimetry
device GDx made
by Laser Diagnosis Technologies, San Diego, CA (riow been acquired by Carl
Zeiss Meditec,
Dublin, CA). The GDx technique measures the amount of polarization rotation in
the light
beam as the beam is scanned across the nerve head. The RNFL tissue is
birefringent and
therefore the amount of polarization rotation is a measure.of the RNFL
thickness.
[0331 RNFL thickness map 200 shown in Figure 2A shows early stage glaucoma
while RNFL thickness map 201 shown in Figure 2B shows glaucoma at a later
stage. The
birefrigent characteristic of the RNFL caused the polarization of the incident
beam to change
its direction of polarization dependent on the thickness of RNFL through which
it passes. By
measuring the rotation angle of the polarization of the reflected beam, the
relative RNFL
thickness can be calculated. The superior and inferior RNFL bundle 202 of the
early stage
8
CA 02637500 2008-07-16
WO 2007/084748 PCT/US2007/001617
glaucoma patient's RNFL 200 is still very visible. But at late stage, the
superior and inferior
RNFL bundle 203 has become very thin in the RNFL map 201. Below image 200 and
image
201, a variation of the RNFL thickness 205 is plotted along the perimeter of a
conventionally
chosen 3.45mm diameter circle 204 centered on the nerve cup. A region of
normal RNFL
thickness 206 is shown in order to estimate the statistical risk based on the
patient's measured
RNFL thickness. However, the stereometric parametric values, e.g. disk and cup
shapes, are
not obtainable from this image method. Therefore, the usual diagnostic
parameters obtained
by determining the disk and cup shapes are unobtainable.
[034) Figure 3 shows a graphic display 300 of a nerve head morphology analysis
obtained by using a StratusTm OCT made by Carl Zeiss Meditec, Dublin, CA. The
StratusTM
OCT takes six cross-section OCT scans 307 across the nerve head. An image of
one scan,
scan 301, is shown in display 300. Both sides of disk margin 302 are
identified. Disk margin
302 (also known as the edge of the retinal pigment epitheal (RPE)), as shown
in scan 301, is
identified by a change in density indicating the edge of the disk. Also
visible in cross section
301 is the nerve fiber entering the cup. The cup margin 303 is conventionally
defined by
intersecting a reference line that is 150 m above and parallel to the line
connecting the sides
of disk margin 302 with the nerve head inner most boundary, as illustrated in
scan 301.
[035] ' The disk contour 305 is then obtained by connecting the twelve disk
margin
points from each of the six cross-sectional scans 307. Similarly, the cup
contour 306 is
obtained by connecting the twelve cup margin points from each of the six cross-
sectional
scans 307.
[036] In the current example, one of the disk margin points, point 304, is
obviously
not connected to the disk contour. This is typically caused by a blood vessel
shadowing
effect, which will be further discussed below. Another disadvantage to this
technique is that
due to the low number of landmarks, the scans are very difficult be aligned to
disk center
9
CA 02637500 2008-07-16
WO 2007/084748 PCT/US2007/001617
308. This is can be demonstrated in image 300 because disk center 308 is not
coincident with
the center of scans 307.
[037] As is demonstrated from the analysis of data obtained from each of these
techniques, none of them provide a complete, reliable, or accurate analysis of
the nerve head.
Each of them fail to reliably determine one or more parameters.
[038] Methods of retinal scanning according to some embodiments of the present
invention can determine the parameters that characterize the nerve head while
overcoming
issues of eye movement and blood vessel placement. Figure 11 illustrates an
example of an
OCT imager 1100 that can be utilized in eye examinations according to some
embodiments
of the present invention. OCT imager 1100 includes light source 1101 supplying
light to
coupler 1003, which directs the light through the sampling arm to XY scan 1104
and through
the reference arm to optical delay 1105. XY scan 1104 scans the light across
eye 1109 and
collects the reflected light from eye 1109. Light reflected from eye 1109 is
captured in XY
scan 1004 and combined with light reflected from optical delay 1105 in coupler
1103 to
generate an interference signal. The interference signal is coupled into
detector 1102. OCT
imager 1100 can be a time domain OCT imager, in which case depth (or A-scans)
are
obtained by scanning optical delay 1105, or a Fourier domain imager, in which
case detector
1102 is a spectrometer that captures the interference signal as a function of
wavelength. In
either case, the OCT A-scans are captured by computer 1108. Collections of A-
scans taken
along an XY pattern are utilized to generate OCT images. An example of an OCT
imager is
described in U.S. Application Serial No. {Attorney Docket No. 09433.0005-00},
filed
concurrently with the present application, which is herein incorporated by
reference in its
entirety.
[039] In addition to the OCT imager 1100, an apparatus for eye examinations
according to the present invention includes a camera 1106, which can be a
fundus camera.
CA 02637500 2008-07-16
WO 2007/084748 PCT/US2007/001617
Light from camera 1106 is coupled into the sample arm of OCT imager 1100 by a
coupler
1107. Coupler 1107 prevents light from camera 1106 from entering coupler 1103
while
directing reflected light from eye 1109 that=originates from camera 1106 back
into camera
1106. Computer 1108 receives and analyzes both the images from camera 1106 and
the
images from OCT imager 1100. Utilizing the combination of images, accurate and
complete
OCT images of the nerve head can be obtained.
[040] Figure 4 shows an OCT scan pattern 400 that can be utilized in
embodiments
of the present invention for better imaging the nerve head morphology and the
retina nerve
fiber layer (RNFL). Scan pattern 400 includes multiple concentric circular
scans 401 and
multiple radial line scans 402 centered at the center of concentric circular
scans 401.
Concentric circular scans 401 cover most, if not all, human eye nerve head
(disk) size ranges
The RNFL thickness just outside of disk margin 403, at the conventional 3.45
m radius, has
the most desired clinical information regarding a glaucoma patient's
progressive loss of
RNFL thickness.
[0411 Due to a patient's eye movement, however, it is very difficult to align
scan
400 on the center of the patient's disk. However, scan pattern 400 need not be
precisely
positioned to the patient's disk. Scan pattern 400 is arranged such that the
length of radial
lines 402 overlap with the area covered by at least one of circular scans 401.
As soon as scan
pattern 400 is large enough to cover the region of interest, the acquired
image then can be
processed, as will be further discussed below, to determine the location of
the center of the
disk with the multiple radial line scans and select the data from the multiple
circular scans to
determine the RNFL thickness at the appropriate distance from and centered to
the disk.
[042] Figure 5 shows an OCT image 500 taken with scan 400 of Figure 4
according to some embodiments of the present invention. An average segment
RNFL
thickness in a circle with a diameter just outside of the disk margin, for
example the
11
CA 02637500 2008-07-16
WO 2007/084748 PCT/US2007/001617
conventional 3.45 mm, is shown in each segment 501 around the RNFL map 502.
Rim area
503 is surrounded by disk margin contour 504 and cup boundary 505. In this
single graphic
plot, all critical clinic information about the nerve fiber in the disk region
is simultaneously
displayed for easy clinic diagnosis.
[043] Previously, at least two independent systems are required to perform the
Nerve fiber map and disk/cup contour separately to acquire the information
shown in Figure
5. For example, an StratusTm OCT system (produced by Carl Zeiss Meditec,
Dublin, CA) and
a GDx system (produced by Laser Diagnosis Technology, San Diego, CA) or a HRT
system
(produced by Heidelberg Enginnering, Germany) and a GDX system.
10441 However, due to absorption of the incident beam by blood vessels. The
OCT
signal will be very weak behind a blood vessel. Thus it causes a shadowing on
the choroid
tissue. Since the tip of choroid layer, which is also referred to as the
retinal pigment epitheal
(RPE) tip, is used to outline the disk margin, the disk shape based on an OCT
image such as
that shown in Figure 5 is not reliable. Light absorption by blood vessels
(also referred to as
the blood vessel shadowing effect) is demonstrated in Figure 6.
[045] Figure 6 shows an cross-sectional OCT scan 600 across a nerve head. The
disk margin 602 is shadowed by a blood vessel located directly above it, which
is invisible in
the OCT image itself. From OCT scan 600 alone, the boundary of choroid 601 may
be
mistakenly identified as the disk margin. If this erroneous point is utilized
to determine the
disk contour, the disk contour will be distorted.
[046J Eye motion is another factor that cause mis-presentation of the disk
morphology. The effects of eye motion are illustrated in Figure 7. As
illustrated in Figure 7,
a disk contour 706 is constructed from the disk margins derived from at least
four radial OCT
line scans, identified as scans 701, 702, 703, and 704 in Figure 7. Due to the
eye motion of
the eye, scans 702 and 703 are shifted and their use results in a distorted
disk contour 705.
12
CA 02637500 2008-07-16
WO 2007/084748 PCT/US2007/001617
[047] To overcome these problems, an eye exam according to the present
invention, as is illustrated in the imager shown in Figure 10, uses a stream
of video disk
images, recorded during the acquisition period of the series of OCT scans, to
realign the scan
pattern of the disk morphology. Such a re-aligned scan image is shown in
Figure 5. A near
infrared wavelength illumination is used to illuminate the retina during the
OCT scan. The
light reflected from the disk is very bright and the blood vessels are
relatively invisible in
these wavelength range. Therefore, the disk contour is well defined in the
video image and
show no obscuration of the blood vessels. The disk shape from the video image
is then used
to correct the tip of the chroriod tissue (the RTE tip) by blood vessel
shadowing. The retinal
motion, detected from the stream of the video images, can be used to register
the OCT images
while scanning a pattern such as pattern 400 relative to each other in order
to build an
accurate composite OCT image.
[048] Figure 8 shows a block diagram illustrating the steps of the image
processing
method according to some embodiments of the present invention. The embodiment
of image
processing method according to the present invention includes the following
steps: (1) OCT
images acquisition step 801; (2) video image acquisition step 802; (3) retinal
pigment
epitheal (RPE) tips detection step 803; (4) RPE tips representation step 804;
(5) video image
scaling step 805; (6) disk boundary detection step 806; (7) disk boundary and
RPE tips
matching step 807; (8) disk center determination step 808; (9) blood vessels
correction step
809; (10) motion compensation step 810; (11) corrected F.PE tips
representation step 811;
and (12) nerve head morphology characterization step 812.
[049] The first step in the image processing method of the present invention
is the
acquisition of OCT images in OCT images acquisition step 801. In some
embodiments, the
OCT images are acquired utilizing scan pattern 400 as shown in Figure 4,
although other scan
patterns that are similarly rich in data can be utilized. The multiple radial
line-scanned
13
CA 02637500 2008-07-16
WO 2007/084748 PCT/US2007/001617
images are used to detect the locations of RPE tips, and subsequently to
characterize the
nerve head morphology. The multiple concentric circular-scanned images are
used to detect
the RNFL thickness outside the disk margin after disk boundary positions and
their center
being determined. Simultaneously with the acquisition of the OCT images, a
images are
obtained with a video camera (such as camera 1006 in Figure 10) in step 802.
The video
images, which may be fundus video images, will be used to guide the detection
of RPE tips in
OCT images.
[0501 Step 803 is the detection of RPE tips in the OCT images acquired in step
801. Based on edge detection of intensity changes along the vertical direction
of the OCT
images, RPE top edges are first extracted and then smoothed to form two RPE
top curves,
separated by the disk valley, shown as 603 in Figure 6, for each OCT image.
The starting
points of the two RPE top curves are located at the first line and the last
line of the OCT
images, respectively. The ending points of the two RPE top curves are detected
as the RPE
tips. The RPE tips thus detected are not accurate in general because of blood
vessel distortion
and/or eye motion.
[051] Each OCT image is acquired in a x-O plane and therefore the RPE tips are
detected and represented in the same x-O plane. To best match with the disk
contour in the
video image subsequently, the RPE tips are transformed into an x-y plane
representation in
step 804 to arrive at a representation similar to that shown in Figure 3. The
number of contour
points utilized in the x-y representation is double the number of radial line-
scanned images
acquired in step 801.
[052] In step 805 the video images acquired in step 802 are scaled such that
their x-
y pixel resolution are identical to those of the x-y RPE tip representation of
step 804. Step
805 matches the pixel resolutions of the OCT images and video images, which in
general are
different.
14
CA 02637500 2008-07-16
WO 2007/084748 PCT/US2007/001617
[053] In step 806, disk boundary detection from the video image is performed.
An
adaptive threshold algorithm can be used to segment the disk area from its
background and to
extract the boundary curve.
[054] In step 807, the RPE tips determined in step 804 are matched with the
disk
boundary curve determined in step 806. In other words, each lateral OCT scan
resulting in
identification of RPE tips iri step 804 is paired with points on the disk
boundary curve
determined in step 806.
[055] The disk center can be computed by the center of gravity, or the
geometric
center, of the disk boundary curve. However, the aiming center, where scan
pattem 400 is
centered, may not be coincided with the disk center. Assuming an aiming center
position (xa,
ya) at the video image and a given scanning angle 0, two distance measures
from the
corresponding boundary points to the aiming center can be determined. These
measures
would be matched well with the distance measures computed through OCT images,
if there
were no blood vessel distortion and/or eye motion. The blood vessel distortion
causes the
distance measure to become larger since the RPE tips would be incorrectly
detected at farther
positions from the image center, as illustrated in Figure 6. Nevertheless, the
distortion is
expected to be local in the sense that the distance enlargement may occur for
only one RPE
tip instead of both RPE tips in an OCT image. Besides, the distance
enlargement is not
smooth in general across consecutive images. In contrast, the incorrectly
detected positions
of RPE tips caused by eye motion would behave much differently. First, the
distortion is
expected to be global in the sense that the distance modification will always
occur for both
RPE tips in an OCT image. Because eye motion will cause both RPE tips to move
in the
same direction, meaning that if one RPE has distance enlargement, then the
other should have
distance shrinkage, as one is moving apart from the image center, and the
other is moving
closer to the image center. Secondly, the distance enlargement and shrinkage
is smooth
CA 02637500 2008-07-16
WO 2007/084748 PCT/US2007/001617
across consecutive images. A preferred matching scheme based on these
observations is used
to compute the positional offsets of RPE tips caused by blood vessel
distortion and/or eye
motion.
[056] The disk center is determined by the geometric center of the disk
boundary
curve in the video image in step 808, usually after the corrective steps 809
and 810 have been
performed. The determination of disk center is important in displaying
preferred clinic
information, as previously described with respect to Figure 5. The local RPE
tips positional
offsets caused by blood vessel distortion were determined in the
aforementioned matching
process, an.d RPE tips can be re-positioned to correct the local offsets at
step 809. The global
RPE tips positional offsets caused by eye motion were also determined by the
aforementioned matching process, and RPE tips can be re-positioned to
compensate the
global offsets in step 810. These steps effectively resolve three fundamental
issues whose
solution was previously absent in nerve head imaging systems: Namely, the
incapability to
accommodate disk center determination, blood vessel distortion, and eye motion
simultaneously.
[057] In step 811, the corrected RPE tips in the x-y plane according to the
positional offsets previously computed is determined. Based on the correct
positions of RPE
tips, the nerve head map and its morphological characterization, as previously
described with
respect to Figures 4 and 5, can be more accurately performed in step 812.
[058] Although many of the steps shown in Figure 8 are performed automatically
by a computer, some of the steps may be performed or assisted by an operator.
For example,
step 806 of disk boundary detection may use operator input. Additionally, RPE
Tip detection
may utilize operator input. In some embodiments, all of the steps are
performed by a
computer.
16
CA 02637500 2008-07-16
WO 2007/084748 PCT/US2007/001617
[059] The embodiment shown in Figure 8 illustrates utilizing video images in
order
to correct the RPE tips determined from the individual OCT images obtained in
step 801.
However, other images can also be utilized in embodiments of the present
invention. For
example, a separate OCT image can be taken with a very dense scan pattern, for
example a
raster scan pattem, prior to acquisition of OCT images in step 801 with the
scan pattern of
Figure 4. The dense OCT image can be utilized to create a template OCT image,
in which
the disk contours are identified. This template OCT image can replace the
video images
taken in step 802 and the RPE tips are matched to the boundary identified in
the template
OCT image in step 807. One advantage to this technique is that the template
OCT image can
be re-used on subsequent visits by that patient.
[060] Figure 9 shows a template OCT scan where the nerve head boundary has
been determined. In the image shown in Figure 9, a raster line scan pattern is
used to
generate a three dimensional data set of the nerve head region. For example, a
4 mm by 4
mm area can be scanned with 100 frames of OCT images and each OCT cross
sectional
image can be composed with 512 axial scans. The number of frames scanned in
the Y
direction can be increased to enhance the image resolution with the.trade-off
of longer scan
time and more eye motion artifact.
[061] The OCT scan data is then recomposed in a three dimensional manner (xi.
y;,
zi) An enfaced image of the nerve head 901, as shown in Figure 9, is the sum
of signals in
the Z-direction for each pixel in (x;, yi), or
Zsum = E Zi (2= k, j),
where k and j can be adjusted to achieve enface image to reveal the nerve head
boundary.
The adjustment can be done by an operator with manually adjustable slides 910
and 911, or
the adjustment can be determined with algorithm that the best contrast is
achieved on the
boundary.
17
CA 02637500 2008-07-16
WO 2007/084748 PCT/US2007/001617
10621 To enhance the nerve head boundary contrast, the anterior surface of the
retinal can be segmented out with image processing algorithms by various
methods. One
method according to some embodiments of the present invention is to examine
enface image
in the plane that is parallel to RPE layers. The sum of signal from layer k to
layer j can be
adjusted so that the rferve head boundary contour found in the enfaced image
has a close
correlation with the RPE tips found in the cross sectional image in the X-Z
plane.
(063] Because the nerve head is normally tilted to the temporal direction. The
OCT signal strength is normally weak in the nasal side of the retina. To
enhance the enface
image contrast and uniformity, it is advantageous to level out the imbalance
image brightness
first before finding the nerve head boundary. Various methods are known. for
balancing the
brightness. One such method that can be utilized in embodiments of the present
invention,
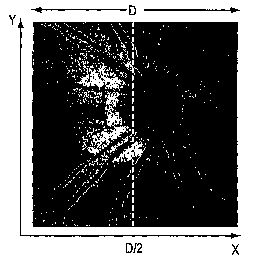
which is illustrated in Figure 10, is as follows: Compute F1 and F2 for the x
direction from
F1= average of f(x,y) for x < 2/D
F2 = average of f (x,y) for x> 2/D
where f is the brightness as a function of x and y and D is the extent of the
display. The
difference in brightness can then be calculated as
Af = F 1-F2.
A correction factor can then be determined as
K= Af/ (D/2).
The signal strength of the entire OCT image in the X-Y plane in the x
direction can then be
computed as
f(x, y) = f(x, y) - xK.
[064) . The nerve head boundary can be either segmented out by the above
algorithm automatically, or be drawn by operator with the assistance view 903.
The nerve
18
CA 02637500 2008-07-16
WO 2007/084748 PCT/US2007/001617
head boundary is shown as RPE tips in the cross sectional view in 903. The
tips in some scan
will be shadowed by the retinal blood vessel above it. The black region in
enface image 901
clearly indicates where the RPE tips are located. An operator can view each
cross sectional
image by sliding the lines 906 and 908 with slider 905 and 907. '
[065] After confirming the boundary locations for each cross sectional image,
the
two RPE tip locations will be recorded and displayed in enface image 901. The
operator can
then repeat this process for each cross sectional image until enough data
points are acquired
to completely identify the nerve head boundary on enface image 901. Because
there are
enough cross sectional images, the operator can skip the ones where it is
unclear where the
RPE tips are located and still be able to find the RPE tips in the neighboring
regions. The
nerve head boundary can then be determined with sufficient accuracy. The
operator can also
perform the same process with cross sectional images in Y-Z plane 902. The 3D
image 904
is the corresponding image of cross sectional image in 901, 902, and 903.
10661 The nerve head boundary normally does not change for glaucoma patients,
so the boundary contours can be saved as a baseline. This method is similar to
that utilizing
video baselines, described in Figure 8, however it is drawn from OCT images
alone with
operator input.
[067] For the next patient visit, an enface image with baseline contour can be
used
as the reference to find out the nerve head boundary on the new scans. The
retinal blood
vessel has very high contrast in the enface image and it normally does not
change location in
glaucoma patients. A cross correlation algorithm can be used to register the
new scan with
the baseline enface image. After the enface image is aligned with the baseline
enface image,
and the nerve head boundary baseline can be overlaid to the enface image from
the new scans
and the nerve head boundary in the new enface image can be drawn by the
algorithm. From
these baseline boundary contours, algorithms can be utilized to find RPE tips
within a limited
19
CA 02637500 2008-07-16
WO 2007/084748 PCT/US2007/001617
range close to the predetermined pixel in X-Y plane and process already
described in part of
Figure 8.
[068] The nerve head boundary baseline determined in Figure 9 can be utilized
to
replace the video images taken in step 802 and processed in steps 805 and 806.
Although
RPE tips from OCT images taken in step 801 of Figure 8 can not be corrected
for eye motion
utilizing this method, correction for blood vessels and disk center
determination can be
accomplished. Because of the speed in acquisition of OCT images with scan
pattern 400 of
Figure 4, eye motion may, in some cases, be neglected during the examination.
[069] Although an embodiment of an imaging method according to the present
invention has been described above, it will be understood that the invention
is not limited to
the embodiments disclosed, but is capable of numerous rearrangements and
modifications of
parts and elements without departing from the spirit of the invention. The
embodiments
described above are exemplary only and are not meant to be limiting in any
way. One skilled,
in the art may recognize numerous modifications that can be made in the
systems described.
These modifications are meant to be within the scope of this disclosure. As
such, the
invention is limited only by the following claims.
2Q