Note: Descriptions are shown in the official language in which they were submitted.
CA 02653398 2008-11-25
WO 2007/140316 PCT/US2007/069771
1
REVERSE PHASE PROTEIN ARRAY, PROTEIN ACTIVATION AND
EXPRESSION SIGNATURES, AND ASSOCIATED METHODS
STATEMENT OF GOVERNMENT INTEREST
This disclosure was developed at least in part using funding from the Leukemia
Society of America, Grant Number 6089, and National Institutes of Health P01
Grant
Number CA-55164. The U.S. government may have certain rights in the invention.
CROSS-REFERENCE TO RELATED APPLICATIONS
This application claims priority to U.S. Provisional Application Serial No.
60/803,347
filed on May 26, 2006 and to U.S. Provisional Application Serial No.
60/829,283 filed on
December 8, 2006, both of which are incorporated by reference herein.
BACKGROUND
Classification of biological samples from individuals is not an exact science.
In many
instances, accurate diagnosis and safe and effective treatment of a disorder
depend on being
able to discern biological distinctions among cell or tissue samples from a
particular area of
the body. The classification of a sample from an individual into particular
disease classes has
often proven to be difficult, incorrect, or equivocal. Some methods, such as
histochemical
analyses, immunophenotyping, and cytogenetic analyses, only one or two
characteristics of
the sample are analyzed to determine the sample's classification. Inaccurate
results can lead
to incorrect diagnoses and potentially ineffective or harmful treatment.
Understanding cancer physiology and pathogenesis has traditionally focused on
alterations at the DNA level that result in expression of genes that are
aberrant in location,
altered in level, or that harbor mutations. Regulation of protein levels and
function, which
may also significantly define the phenotype of a cancer cell, occurs at many
levels including
transcription, mRNA stability, translational regulation, and perhaps most
importantly by post-
translational modifications (e.g. phosphorylation, prenylation, ubiquiniation,
and the like).
High throughput technologies like comparative genomic hybridization (CGH) and
transcriptional profiling provide important data on DNA and RNA levels,
however functional
consequences of these changes cannot be assessed, and confirmatory experiments
need to be
carried out. Expression arrays, measuring mRNA levels, are routine and
informative for some
of these alterations, but are unable to ascertain the actual level of proteins
expression, and are
completely unable to detect post-translational modifications of proteins
(phosphorylation,
CA 02653398 2008-11-25
WO 2007/140316 PCT/US2007/069771
2
farnesylation, ubiquitination). The development of reliable proteomic
characterization is
crucial for the more global understanding of cancer cell physiology and
pathogenesis at the
protein level.
Proteomics can be defined as the large-scale study of proteins, including
their
structure, function, and activation. Particular challenges are: that the
proteome differs from
cell to cell; changes dynamically over time; and that polymorphisms, splice
variants, and
post-translational modifications greatly expand the ascertainable variables
for each protein.
Attempts at proteomic characterization of leukemic cells have mainly used
MALDI-TOF
(matrix assisted laser desorption/ionization-time of flight) analysis after
two-dimensional gel-
electrophoresis. The available evidence is sparse but supports the importance
of proteomic
analysis of leukemias, for example, for class distinction, target
identification, apoptosis
initiation, and stem cell analysis. However, proteins characterized by these
methodologies
need to be identified and characterized by other means, and more comprehensive
profiling is
often hindered by excessive material requirements and by the time required to
perform each
analysis. These techniques are inadequate for high throughput analysis of
primary patient
samples.
Understanding the effect and functional significance of new targeted anti-
cancer
agents, directed at functional sites on proteins (often kinases) also requires
novel technologies
that allow for a sensitive, accurate, and moderate to high-throughput
assessment of the target
of interest. Assessing off target effects on proteins in the same or
neighboring pathways will
become part of a comprehensive activity profile of a drug. Application of the
promise of
functional proteomic analysis to the study of individual cases of cancer
therefore requires a
novel, reliable, sensitive, time-, cost- and sample-sparing as well as high-
throughput
functional proteomic technology.
Reverse phase protein (micro)-array (RPPA) is a new, sensitive, high
throughput,
functional proteomic technology that offers many of the advantages needed. It
extends the
power of immunoblotting to provide a quantitative analysis of the differential
expression of
active (usually phosphorylated or cleaved) and parental proteins. Proteins and
their
corresponding phosphoproteins can be assessed reflecting the activation
state/functionality of
a given protein. Furthermore, cell cycle and apoptosis can be assessed by
measuring cyclins,
CA 02653398 2008-11-25
WO 2007/140316 PCT/US2007/069771
3
p21, p27, cyclin dependent kinases, phosphohistones, or PARP cleavage and
activated
caspases, respectively.
With RPPA all samples are spotted at the same time making this method ideally
suited for retrospective analysis of large numbers of specimens similar to the
idea of gene
microarrays. Compared to a conventional Western blotting, which uses protein
from 5x10⁵
cells, RPPA requires nanoliters of protein lysate (pico- to femtograms of
protein). Protein
equivalent to 200 cells is printed per slide, per single antibody. Thus
samples prepared from
only 5,000-20,000 cells are sufficient to analyze 100 different protein
targets and from the
material previously required for a single western blot, 2500 slides
(theoretically =2500
antibodies) can be printed. The printing precision and reliability of the RPPA
technology are
extremely high with low experimental variability. This is most likely due to
RPPA internal
factors and the greater precision of the RPPA technology as sample handling
and preparation
are similar to WBs. Inter-slide/array comparison was likewise very high. One
emerging
feature is that the greatest reliability and least variability are achieved
when samples are
assayed together on one array/slide. The very high correlation between
replicate printings of
the same sample on the same slide suggests that duplicate printing could be
omitted to permit
a greater number of individual samples to be printed on the same slide and to
reduce costs.
This also enables the analysis of a much larger number of proteins from each
sample and
makes this technique suitable for analysis of cell populations present in low
numbers, such as
stem cells or cancer cells that survive chemotherapy.
Total proteins and their corresponding phosphoproteins can be assessed
reflecting the
activation state/functionality of a given protein or activation state of an
entire pathway (e.g.
signal transduction pathway). This broader assessment of protein modification
and activation
of an entire network has the potential to recognize new meaningful protein and
pathway
interactions of known proteins and can lead to new discoveries.
SUMMARY
The present disclosure, according to certain embodiments, relates to protein
activation
and expression signatures and methods of obtaining and using protein
activation and
expression signatures for cancer classification, prognosis, and therapy
guidance.
According to one embodiment, the present disclosure provides protein
activation and
expression signatures formed by a process comprising: assaying a plurality of
samples with a
CA 02653398 2008-11-25
WO 2007/140316 PCT/US2007/069771
4
protein array; clustering the assayed samples based on patterns; and
generating a heat map.
The present invention also provides, methods for preparing a protein
expression and
activation signature comprising: obtaining protein sample from a patient;
obtaining one or
more of a protein expression level and a phosphorylation level corresponding
to a protein
being measured; clustering samples based on patterns of one or more of
expression levels or
phosphorlation levels; and generating a heat map using the clustering and the
proteins being
measured.
The present disclosure also provides microarrays comprising a plurality of
samples or
sets of samples, a positive control, and a negative control, wherein the
samples or sets of
samples are arrayed on the slide and each sample or set of samples is
associated with a
positive control or with a negative control or both. Methods for normalizing a
signal from a
microarray are also provided, which comprise generating a three-dimensional
topographical
map from a plurality of signals and correcting irregularities found in the
three-dimensional
topographical map, wherein the plurality of signals is from one or more of a
negative control
and a positive control.
The present disclosure also provides methods for analyzing a sample
comprising:
comparing a protein expression level or a phosphorylation level or both in a
cell sample from
a cancer patient to at least one reference protein expression and activation
signature, wherein
the difference or similarity between the protein expression level or a
phosphorylation level or
both of the patient and the at least one reference protein expression and
activation signature is
indicative of prognosis of the cancer in the patient.
Systems also are provided that comprise a first storage medium including data
that
represent a protein expression level or a phosphorylation level or both of one
or more
proteins in a cell sample of a patient; a second storage medium including data
that represent
at least one reference protein expression and activation signature; a program
capable of
comparing the protein expression level or a phosphorylation level or both to
the at least one
reference protein expression and activation signature; and a processor capable
of executing
the program.
Despite similar clinical features, there are many different types of primary
acute
myleogenous leukemia (AML). Complex pathways of proteins, that control how
leukemic
cells respond to signals from the body, regulate how rapidly cells multiply,
die or mature into
CA 02653398 2008-11-25
WO 2007/140316 PCT/US2007/069771
functional blood cells. Often, the amount or activity of these proteins is
abnormal in AML
cells, and this can affect the response to therapy. Previously, the level or
function of these
proteins could only be studied one at a time, but the methods of the present
disclosure now
allow the study of 100 different proteins using the same amount of material
previously
required to study one protein. The expression level or function of these
proteins may aid in
better prognosis of disease as well as more effective treatments.
Further with the methods of the present disclosure, better comparability of a
greater
number of samples can be achieved as more samples are handled under identical
conditions
on one array reducing experimental bias. The methods of the present disclosure
thus provide
the reproducibility, precision, sensitivity, and reliability of the system not
achieved with other
protein technologies to date.
By assessing the expression and activation of proteins, the methods of the
present
disclosure may aid in finding proteins that might serve as potential targets
for new drugs for
certain diseases and states of disease.
The features and advantages of the present invention will be readily apparent
to those
skilled in the art upon a reading of the description of the embodiments that
follows.
FIGURES
Some specific example embodiments of the disclosure may be understood by
referring, in part, to the following description and the accompanying
drawings.
Figure 1 shows total Stat3 (upper panel) and p-Stat3 (Tyr705) (lower left
panel)
protein expression from 5 different patients. (Top row) newly prepared "clear"
cell lysates
from peripheral blood (PB) and bone marrow (BM). (Second row) "blue" lysates
of the same
specimen. (Third row), leukemia cell lines. (Fourth row), MDA-468 + EGF,
Jurkat + FAS
ligand stimulation. Of note is the small to absent change of Stat3 in the
control cell lysates.
Sample arrangement in the p-Stat3 (Tyr705) slide is identical to the upper
panel. The right
lower panel shows the same control cell samples (same experiment) printed onto
a different
slide and probed for p-Akt473 clearly showing an increase in p-Akt473 level
with EGF
stimulation of MDA-468 cells (MDA) and decrease in Fas ligand treated Jurkat
cells.
Figure 2 shows dilution curves and log linear representation by MicroVigene.
Analysis of representative curves from MicroVigene for blue and clear PB
lysate samples
from the same patient. Each spot represents a dilution of the sample. An
optimized curve
CA 02653398 2008-11-25
WO 2007/140316 PCT/US2007/069771
6
(green line) with standard deviations (blue line above and below is
automatically plotted
through the data points. The software program "fits" a linear curve (red
straight line) onto the
dilution curve and calculates a function. The EC 30 or 50 of that curve gives
a log number
which is used for processing of the data.
Figure 3 shows sensitivity of RPPA. Protein lysates were prepared from the
leukemia
enriched fractions from two patients with simultaneously obtained blood and
marrow samples
at concentrations of 7 and 10 cells/nl. These lysates were printed onto RPPA
and assayed
with 6 antibodies. The relative signal of each is shown. For both patients the
signal strength
for each proteins was similar regardless of source. For both patients the
signal strength of the
7ce11/nL sample was consistently lower than that of the 10 ce1UnL sample
demonstrating that
the RPPA could detect quantities at a 3 cell difference.
Figure 4 shows protein lysates that were printed in replicate on the same RPPA
and
probed with 6 antibodies. The correlation between the replicates is shown.
Mean R2 =0.9926;
ERKI/2=0.9973, pMAPK (42/44)=0.9919, Stat3=0.9825, pStat3 (Thr 705)= 0.9979,
Akt=0.9920, pAkt (Ser473)=0.9941)
Figure 5 shows a comparison of expression intensities of phospho-specific
proteins
showed no significant difference at initial preparation and after two freeze-
thaw cycles,
demonstrated here for p-p38.
Figure 6 shows inter-array (same sample on different slides) and inter-
experiment
(same sample different preparations on same array) variability was low with
coefficients of
variation between 6-15% for 8 tested total and phospho-site specific ABs (same
ABs as in
Fig 2. and p38, p-p38 as shown in Fig. 3).
Figure 7 shows absolute protein quantification by RPPA. The upper panel shows
a
magnification of dilution curves from a protein/peptide reference RPPA slide.
Below the
RPPA slide section is the amount of protein determined from the log scale.
Each spot in the
graphics is plotted as the densitometric absorption number against the protein
concentration
of a dilution spot of a sample. Since the absolute protein concentration of
purified AKT and
p-AKT (S473) peptide are known, the unknown protein concentration of any
lysates can be
calculated according to the Akt standard curves.
Figure 8 shows examples of HSC Analysis by RPPA. Several pairs of lineage
positive
and negative AML and normal bone marrow (NBM) are depicted.
CA 02653398 2008-11-25
WO 2007/140316 PCT/US2007/069771
7
Figure 9 shows a schematic illustrating sample printing, according to one
embodiment
of the present disclosure.
Figure 10 shows a representative slide, from phospho AKT Threonine 308,
according
to one embodiment of the present disclosure.
Figure 11 illustrates a cluster diagram showing that protein expression was
not
correlated with clinical characteristics.
Figure 12 illustrates mean levels of protein expression by disease status,
according to
one embodiment of the present disclosure.
Figure 13 illustreates unsupervised clustering of samples, according to one
embodiment of the present disclosure.
Figure 14 illustrates bootstrap clutering of the sample data, according to one
embodiment of the present disclosure.
Figure 15 illustrates a heat map showing protein expression levels evaluated
across
FAB classification, according to one embodiment of the present disclosure.
Figure 16 illustrates clustering pr sample data with different protein
signatures being
associated with particular cytogenetic changes.
Figure 17 shows a heat map, according to one embodiment of the present
disclosure,
illustrating the average level of protein expression by evaluated in the
context of
cytogenetics.
Figure 18 shows a heat map, according to one embodiment of the present
disclosure,
illustrating the average signal of each protein within 7 protein signature
clusters. The
components of 10 protein clusters are shown in the heat map.
Figure 19 show the mean levels of example proteins by disease status, going
from
newly diagnosed to first relapse, primary refractory and second or greater
relapse. Blue lines
are blood and red are marrow.
The patent or application file contains at least one drawing executed in
color. Copies
of this patent or patent application publication with color drawing(s) will be
provided by the
Office upon request and payment of the necessary fee.
While the present disclosure is susceptible to various modifications and
alternative
forms, specific example embodiments have been shown in the figures and are
herein
described in more detail. It should be understood, however, that the
description of specific
CA 02653398 2008-11-25
WO 2007/140316 PCT/US2007/069771
8
example embodiments is not intended to limit the invention to the particular
forms disclosed,
but on the contrary, this disclosure is to cover all modifications and
equivalents as illustrated,
in part, by the appended claims.
DESCRIPTION
The present disclosure, according to certain embodiments, relates to protein
activation
and expression signatures and methods of obtaining and using protein
activation and
expression signatures for cancer classification, prognosis, and therapy
guidance.
In general, the present disclosure relates to methods for classifying a sample
according to the protein expression and activation signatures of the sample.
In one
embodiment, the present disclosure is directed to classifying a biological
sample with respect
to a phenotypic effect, e.g., presence or absence of disease or predicted
treatment outcome,
comprising the steps of determining a protein expression and activation
signature of a cell
sample, wherein the protein expression and activation signature is correlated
with a
phenotypic effect, thereby classifying the sample with respect to phenotypic
effect.
According to the methods of the disclosure, samples can be classified as
belonging to (i.e.,
derived from) an individual who has or is likely to develop the disease of
interest.
Alternatively, according to methods of the present disclosure, samples can be
classified as belonging to a particular class of treatment outcome. That is, a
sample can be
classified as belonging to a high risk class (e.g., a class with a prognosis
for a high likelihood
of recurrence of disease, or a class with a poor prognosis for survival after
treatment) or a low
risk class (e.g., a class with.a prognosis for a low likelihood of recurrence
or a class with a
good prognosis for survival after treatment). Duration of illness, severity of
symptoms, and
eradication of disease can also be used as the basis for differentiating or
classifying samples.
In one embodiment, the present disclosure provides a protein activation and
expression signature formed by a process comprising assaying a plurality of
samples with a
protein array; clustering the assayed samples based on patterns; and
generating a heat map.
The samples are derived from patients having differing disease status. For
example,
the samples may include samples from patients that are newly diagnosed,
primary refractory,
first relapse, and second or greater relapse, and complete remission.
The sample may derived from the cells of patients with diseases relating to
the level
of expression and activation of proteins. Such diseases include but not
limited to, cancer such
CA 02653398 2008-11-25
WO 2007/140316 PCT/US2007/069771
9
as a solid tumor, metastatic cancer, or non-metastatic cancer, Acute
Myelogenous Leukemia
(AML), Acute Lymphocytic Leukemia (ALL), Chronic Lymphocytic Leukemia (CLL),
Myelodysplasia (MDS), myeloma, and lymphoma. In other embodiments, the samples
may
be normal or malignant stem-cells, for example, human hematopoietic stem
cells, leukemic
cells, cells grown in an environment like the marrow, or cells surviving
exposure to
chemotherapy. The samples may be acquired from any source, including but not
limited to,
human cancer specimens, human leukemia specimens, stored AML lysates, and
prepared
cryopreserved cells. In one example, the samples may isolated by laser capture
microdissection.
In certain other embodiments, human hematopoietic stem cells on a large scale
may
be analyzed using the methods of the present disclosure on a proteomic basis,
and their
protein expression and activation signature compared to bulk disease cells
(e.g., leukemia
cells). Since resistance and recurrence are likely to emerge from the stem
cell population,
analysis of this low abundance population may provide insights into mechanisms
employed
by stem cells to resist therapy and may suggest therapeutic targets.
Furthermore, by assessing
the protein expression and activation signature of proteins, the methods of
the present
disclosure may aid in finding proteins that might serve as potential targets
for new drugs for
certain diseases and states of disease.
The samples may be assayed with a protein array using antibodies specific to a
protein. Examples of suitable proteins include, but are not limited to, signal
transduction
pathway (STP) proteins, apoptosis regulating proteins, cell cycle regulating
proteins,
cytokines, and chemokines. Specific examples of STP and apoptosis regulating
proteins are
listed in Table 1. Specific examples of cytokines and chemokines are listed in
Table 2.
CA 02653398 2008-11-25
WO 2007/140316 PCT/US2007/069771
TABLE 1.
Signal Transduction Apoptosis Other
AKT, pAKT308 pAKT473 BAD pBAD112 pBAD136 pBAD155 Actin
ERK2, pERk6 BAK B-Catenin
MEK, pMEK BAX CCND1
p70S, P70S6K BCL2 DJ1
PKCapPKCa BCLXL MTOR,
SRC pSRC527 MCLI pMTOR
pSTAT 1 SMAC MYC
STAT3, pSTAT3-705 pSTAT3727 Survivin NRPI
pSTAT5431 XIAP S6, pS6.p2211
pSTAT6 pS6RP.240-
PTEN, pPTEN .244
P38pP38 SSBP2
p53 SSBP3
GSK3, pGSK3 P27
p53
TABLE 2.
Cytokines Chemokines
Interleukins Eotaxin
= IL1B, IL1Ra IP-10
= IL2,3,4,5,6,7, 10, 12, 13, 15, 17 IL8
Growth Factors MIP 1 a
= G-CSF, GM-CSF MIPIb
Angiogneic factors Rantes
= PDGFbb MCP-1(MCAF)
= FGF SDF-1 (CXCL12/CXCR4)
= VEGF
TNFa
TGF(3
Interferon y
c-Kit
Other examples include mIR, Hox, and histone acetylation and methlyation
levels.
The samples may be assayed using a protein array, such as a RPPA. RPPA uses a
microdot blot like approach, printing protein samples onto a slide and probing
them with a
single antibody to generate a quantitative output. Total and phosphoproteins
can be measured.
The technique offers high sensitivity, throughput, and both inter and intra
slide
reproducibility. RPPA is particularly suited for use with STP proteins,
apoptosis regulating
CA 02653398 2008-11-25
WO 2007/140316 PCT/US2007/069771
11
proteins, cell cycle regulating proteins. Given the limitation of genomic
arrays and
conventional protein processing methods, protein microarrays like the RPPA
have the
potential to complement transcriptional profiling by offering a new means to
quantify the
expression level and activation status of cancer-associated proteins.
The present invention also provides microarray slide comprising a plurality of
protein
samples printed or sets of samples, a positive control, and a negative
control. The samples or
sets of samples are arrayed on the slide and each sample or set of samples is
associated with a
positive control and a negative control. In certain embodiments, the
microarray also may
include a normal sample, a cell line sample, and purified proteins.
The slide may be normalized for background and scale using the positive and
negative
controls. These controls provide a grid across the slide that can be used to
measure
background (e.g., from uneven staining). Not all slides will have perfectly
even background
across the slide, and the grid may be used to measure the background across
the slide. By
using the negative controls, a three-dimensional topographical map of
background intensity
may be generated and used to correct for background. This correction for
background may be
referred to as "topographical normalization." Similarly, the three-dimensional
grid of the
positive controls may be used to set scale correction. Accordingly, the
present disclosure also
provides methods for normalizing a signal from a microarray comprising
generating a three-
dimensional topographical map from a plurality of signals and correcting
irregularities found
in the three-dimensional topographical map, wherein the plurality of signals
is from one or
more of a negative control and a positive control.
The data from each assay is clustered based on patterns, for example, using
perturbation bootstrap validation/clustering. This clustering method factors
in randomness
and errors and allows for correction of biases, which increases the
reliability of the data.
Additionally, a Bonferoni correction may be performed to account for the
number of samples
and proteins/antibodies when calculating statistical significance. For
example, clustering may
be based on cytogenetic changes. 11
In one example, the assays may be clustered using principal component
clustering
based on the absolute value of Pearson correlation to define proteins
clusters. In the case of
AML, for example, this resulted in 9 proteins clusters. To define a protein
signature, the score
CA 02653398 2008-11-25
WO 2007/140316 PCT/US2007/069771
12
for each cluster for each patient was determined and an overall vector
determined. When
patients were clustered based on this overall score 7 proteins signature
groups emerged.
A heat map of the clustered data may be generated. In this way, the data can
be
structured so provide prognostic and/or diagnostic information. A "heat map"
or "heat map
visualization" is a visual representation of a tabular data structure of
protein expression or
activation values, wherein color coding is used for displaying numerical
values. The
numerical value for each cell in the data table is encoded into a color for
the cell. Color
encodings run on a continuum from one color through another, e.g. green to red
or yellow to
blue for gene expression values. The resultant color matrix of all rows and
columns in the
data set forms the color map, often referred to as a "heat map" by way of
analogy to
modeling of thermodynamic data.
The term "color coding" refers to a software technique that maps a numerical
or
categorical value to a color value, for example representing high levels
expression as a
reddish color and low levels of gene expression as greenish colors, with
varying
shade/intensities of these colors representing varying degrees of expression.
Color coding is
not limited in application to expression levels, but can be used to
differentiate any data that
can be quantified, so as to distinguish relatively high quantity values from
relatively low
quantity values. Additionally, a third color can be employed for relatively
neutral or median
values, and shading can be employed to provide a more continuous spectrum of
the color
indicators.
In one example, a protein activation and expression signature heat map may be
based
on protein expression levels evaluated across FAB classifications. Such
signature data could
be used to suggest when to use targeted therapies. For example, an anti-BCL2
agent might be
selectively used in MO, Ml, and M2 where levels are high, and not in other FAB
classifications where it is already low.
In another example, a protein activation and expression signature heat map may
be
based the average level of protein expression by cytogenetic category. Such
signature data
may be used to suggest that targeted therapies need to be applied selectively
to those
cytogenetics categories where expression or activation of that particular
protein is found. For
example, agents like nutlins would not likely be effective in cases with a -5
or -7 where p53
levels are very high.
CA 02653398 2008-11-25
WO 2007/140316 PCT/US2007/069771
13
In another example, a protein activation and expression signature heat map for
AML
may be generated. Such a heat map may show the average signal of each protein
sample
assayed within 7 protein signature clusters. Some of the resulting protein
clusters may show
positive correlation, while other groups may show both positive and negative
correlation.
Accordingly, the signature allows recognition of unique, recurrent patterns or
signatures
observed in AML. This may aid the selection of enhanced, individualized
treatment plans.
Protein activation and expression signatures may be used to estimate the
response rate
of patients stratified by protein signature and cytogenetics. In the case of
AML for example,
all the favorable cytogenetic patients achieved, remission so the signature
was not
informative; however, the remission and relapse rate varied for prognosis
cytogenetics
depending on the proteins expression signature. Further, the different
remission and relapse
rates associated with the different proteins expression signatures results in
significant
differences in overall survival within each cytogenetic category.
The present disclosure also provides a method for preparing a protein
expression and
activation signature comprising obtaining protein sample; obtaining one or
more of a protein
expression level and a phosphorylation level corresponding to a protein being
measured;
clustering samples based on patterns of one or more of expression levels or
phosphorlation
levels; and generating a heat map using the clustering and the proteins being
measured. Such
methods may be used to assess prognosis or diagnosis of a disease.
Further, a protein expression and activation signature of the present
disclosure may be
used in methods for classifying a protein sample with respect to a phenotypic
effect, for
example, presence or absence of a protein marker or predicted treatment
outcome, comprising
correlating a protein expression and activation signature with a phenotypic
effect, thereby
classifying the sample with respect to phenotypic effect. Such an approach
accounts for the
multitude of molecular defects often present in different cancers by profiling
multiple signal
transduction pathways simultaneously and defining a carcinogenic "fingerprint"
specific to
the patient. The samples can be classified as belonging to (i.e., derived
from) an individual
who has or is likely to develop the disease of interest. Alternatively,
according to methods of
the present disclosure, samples can be classified as belonging to a particular
class of
treatment outcome. That is, a sample can be classified as belonging to a high
risk class (e.g., a
class with a prognosis for a high likelihood of recurrence of disease, or a
class with a poor
CA 02653398 2008-11-25
WO 2007/140316 PCT/US2007/069771
14
prognosis for survival after treatment) or a low risk class (e.g., a class
with a prognosis for a
low likelihood of recurrence or a class with a good prognosis for survival
after treatment).
Duration of illness, severity of symptoms, and eradication of disease can also
be used as the
basis for differentiating or classifying samples.
In some embodiments, protein expression and activation signatures that
classify
cancer by type or response may be identified, and this may help better predict
how a patient
may respond to a certain treatment for the cancer. For example, patients with
low
probabilities of responding to conventional therapies may be treated with
novel agents or
stem cell transplants earlier during treatment. In these embodiments, the
patterns of
expression that classify cancer by type or response may be different
activation states of key
signal transduction pathway, apoptosis, cell cycle regulating proteins,
cytokines, and
chemokines.
A protein expression and activation signature also may be used to devise an
individualized treatment regimen for the patient. In this way, a therapeutic
agent may be
rationally allocated to a patient depending on the expression or activation
signature for that
particular patient. Furthermore, as targeted therapies become available,
determination of
active protein pathways could be utilized to select targeted therapies most
likely to be
effective based on the classification and protein expression signature of an
individual patient.
To facilitate a better understanding of the present invention, the following
examples
of specific embodiments are given. In no way should the following examples be
read to limit
or define the entire scope of the invention.
EXAMPLES
In 85% of AML patients, a bone marrow collected 14 days after start of
induction
chemotherapy will reveal an empty marrow with "too few cells to count."
Despite this
"empty" marrow some patients will show leukemia regrowth within a few weeks,
while
others will achieve remission only to relapse later. This regrowth must arise
from the rare
leukemia cells remaining after chemotherapy ("survivor cells") and these cells
must possess
stem cell characteristics. This raises the question of whether the
expression/activation pattern
observed in stem cells is similar or distinct from the pattern of the bulk
leukemia cells.
Peripheral blood, leukopheresis, or bone marrow specimens were collected
prospectively from patients with newly diagnosed AML evaluated at The
University of Texas
CA 02653398 2008-11-25
WO 2007/140316 PCT/US2007/069771
M. D. Anderson Cancer Center between September 1, 1999, and January 1, 2004.
Samples
were acquired during routine diagnostic assessments in accordance with the
regulations and
protocols sanctioned by the Investigational Review Board of M. D. Anderson.
Generation of a leukemia enriched fraction
Samples were placed on ice immediately after collection and were processed
fresh
within two hours of collection. A leukemia cell-enriched fraction is generated
by isolating the
mononuclear cell fraction by Ficoll-Hypaque separation (Mediatech,
Hearndon,VA) followed
by the depletion of CD3+/CD19+ B- and T-cells by magnetic antibody-conjugated
sorting
(Miltenyi Biotec, Auburn, CA), as previously described. The cells were used
fresh to make
whole-cell lysates for Western blotting or RPPA arrays. To assess stability of
phosphoepitopes, cryopreserved cells were thawed, kept at room temperature for
2 hours, and
an aliquot lysed for RPPA. The remainder of the cells was refrozen. The same
cycle was
repeated once. Cells were then prepared in the usual fashion for RPPA.
Generation of CD34+/CD38- "Stem Cell" fractions
To isolate a "stem cell" enriched fraction CD34+ cells were purified from the
leukemia enriched fraction described above by MACS (Miltenyi, Biotech Inc.,
Auburn, CA)
and then separated into CD34+/CD38- and CD34+/CD38+ fractions by flow sorting
after
incubation with anti-CD34, anti-CD38 antibodies and IgG controls (Becton
Dickinson, San
Jose, CA). Cells displaying greater fluorescence intensity than their controls
were considered
positive. An aliquot of sorted cells was reanalyzed for purity. Sorted and
separated cells were
lysed in RPPA lysis buffer as described below.
Cell Lines
Leukemia cell lines (U937, HL60, OCI-AML3, KG-1, Mo7e, TFl), obtained from
ATCC, were grown in RPMI 1640 medium supplemented with 0.5% or 10% fetal
bovine
serum, 100 mg/nL Penicillin/Streptomycin, 4nM Glutamate (all Gibco, USA).
Cells were
kept at subconfluent levels until harvest, then washed twice in ice cold
phosphate buffered
saline (PBS) and lysed in either of the above lysis buffers for 20-30 min,
centrifuged at
14.000 RPM and the pellet was discarded. Cell lysates were diluted as
described below in the
RPPA section.
Western Blot
CA 02653398 2008-11-25
WO 2007/140316 PCT/US2007/069771
16
Western immunoblotting analyses were performed using material from 4-5x10⁵
cells
and the Biorad Criterion system (Biorad, Hercules, CA), with bone marrow and
peripheral
blood samples loaded on the same blot with control cell lines (K562 and Jurkat
cells) and
molecular-weight markers as previously described. Numerous Western blot
studies have
shown that these samples are free of protein degradation (assessed by absence
of actin
laddering) and that the phosphoprotein status remains stable for at least a
decade (for
retinoblastoma protein).
Validation of Antibodies
One of the limiting factors in protein-biochemistry is the availability and
quality of
antibodies (ABs). Each candidate antibody was subjected to a stringent
validation procedure
before being certified for use by RPPA. The AB has to have a predominant
single band in
WB against cell lines and patient samples and not have any nonspecific
binding. It is
acceptable if the AB recognizes known cell characteristics, including size
variants due to
cleavage, mutation, or deletions. Antibodies against phosphorylated epitopes
had to
demonstrate specificity against samples stimulated (e.g. growth factors) or
inhibited (specific
inhibitors) to yield phosphorylated or non-phosphorylated forms of a protein.
Alternatively,
genomically altered cells, (e.g. transfected or siRNA inhibited) and cell
lines could be used to
validate ABs. Finally, for antibodies passing the above criteria, results by
RPPA had to
parallel those seen by WB.
RPPA
For quantification purposes protein cell lysates were serially diluted (6 or 8
serial
dilutions: full strength, 1/2, 1/4, 1/8, 1/16, 1/32, 1/64, 1/128) with
additional lysis buffer
immediately prior to array preparation in 98 well plates. Dilutions were done
with multi-
channel pipettes by hand. Diluted samples were transferred into 384 well
plates and heated at
95 C for 10 min. From these plates the lysate material was printed onto
nitrocellulose coated
glass slides (FAST Slides, Schleicher & Schuell BioScience, Inc. USA, Keene,
NH) with an
automated robotic GeneTac arrayer (Genomic Solutions, Inc., North Bellerica,
Ann Arbor,
MI). Up to 24 identical slides can be printed at one time. The RPPA transfer
method
employed is a non-contact method where approximately 1 nL of protein lysate
(corresponding to 10 cell equivalents from full strength protein lysate) is
transferred to the
nitrocellulose glass slide per array pin touch. The protein concentration
spotted onto the glass
CA 02653398 2008-11-25
WO 2007/140316 PCT/US2007/069771
17
slides can be adjusted by varying the number of pin touches from 5 to 10 per
dot-spot
(corresponding to 100 down to 0.8 cell equivalents after 8 serial dilutions),
depending on the
original protein concentration in a sample set. Up to 1152 single dots can be
printed onto one
slide. Each spot on the array slide represents a certain dilution of the
lysate of a particular
sample. If 6 serial dilution steps are used, as many as 192 samples can be
spotted on a single
slide. Once printed, the slides are stable at -80 C and stainable for at least
6-12 months.
Diluted protein printing plates (384 well plate) are storable at -80 C for at
least 12-18 months
and can be used for multiple repeated printing processes of new array slides
from the same
original samples.
Probing
After slide printing the same stringent conditions for slide blocking,
blotting, and
antibody incubation used for immunoblotting are applied. First the microarray
slides were
blocked for endogenous peroxidase, avidin, and biotin protein activity prior
to the addition of
the primary antibody. The DAKO (Copenhagen, Denmark) signal amplification
system was
used to detect and amplify AB-binding intensity. This commercially available
catalyzed
system kit uses 3,3'-diaminobenzidine tetrachloride (DAB) and catalyzed
reporter deposition
of substrate to amplify the signal detected by the primary antibody. A
biotinylated secondary
antibody (anti-mouse or -rabbit) is used as a starting point for signal
amplification. A
streptavidin-biotin complex attached to the secondary antibody and biotinyl-
tyramide
deposition on this complex will be used to amplify the reaction. Tyramide-
bound horseradish
peroxidase cleaves DAB, giving a stable brown precipitate with excellent
signal-to-noise
ratio. This technique is sensitive and reproducible to the femtomolar
sensitivity range.
Signal intensity was measured by scanning the slides with the ImageQuant
(Molecular
Dynamics, CA) and quantified using the MicroVigeneTM automated RPPA module
(VigeneTech Inc., MA). Using MicroVigene software the intensity of each spot
is calculated
and an intensity concentration curve is calculated with a slope and intercept.
This allows
relative quantification of each sample if the expression intensities are
compared to a reference
standard curve generated from control lysates, and absolute quantification can
be determined
by comparison to known quantities of purified peptides. The ratio of signal
intensity from
phosphorylated and nonphosphorylated antibodies allows for relative
quantification of the
activation state of a given protein across samples. Differences in loading was
assessed and
CA 02653398 2008-11-25
WO 2007/140316 PCT/US2007/069771
18
corrected for by normalizing expression intensities as described in the
results section. For
differentially regulated proteins, immunoblotting (WB) was performed to
confirm results. To
establish the use of human leukemic cell lines and primary specimens for RPPA
analysis we
systematically addressed and validated each experimental step of RPPA. The
Leukemia
Sample Bank (LSB) at MDACC has systematically stored hundreds of AML patient
protein
samples over the past 15 years. Complete outcome data is available. Therefore,
we tested
existing LSB protein samples with RPPA.
Utility and Sensitivity of RPPA
Cell lysates in the LSB are prepared using a WB lysis buffer containing
bromophenol
blue (called "blue" lysates) at a cell concentration of 10 cell equivalents
per nL. Samples are
aliquotted into single use vials containing 50 L before freezing. To assess
if the prepared,
stored and ready to use WB blue lysates could be analyzed by RPPA we compared
these with
newly prepared cell lysates ("clear lysates") using cryopreserved specimens
from the same
patient and the same date prepared at a concentration of either 7 or 10
cells/nL. Both "blue"
and "clear" lysates gave strong signals in the linear part of the dilution
curve (Figure 2) that
were analyzable for data evaluation (Figure 1). Intrapatient variability
between "clear" and
"blue" lysates was minimal. Slides in Figure 1 give an example of phospho-
protein staining
from patient samples stained for Stat3 and p-Stat3 (Tyr705). Peripheral blood
(PB) and bone
marrow (BM) samples obtained on the same day from 5 different patients are
printed in
alternating colunms with the first row being from the newly prepared "clear"
lysates and the
second row from the existing "blue" lysate. The stronger signals in the second
row, relative to
the top row, are due to higher cell numbers per nL in the original sample for
blue lysates
versus clear lysates. In conclusion, the bromophenol blue of the WB lysis
buffer did not
interfere with signal detection and analysis as illustrated in Figure 1,
indicating that the
existing protein lysates in the LSB can be used for RPPA.
To detect the limit of resolution and the sensitivity in terms of the smallest
detectable
difference in cell numbers, we prepared cell lysates at 7 and 10 cell
equivalents per nL,
respectively. Arrays were printed with 10 touches and probed with 6 different
antibodies as
shown in Figure 3. The curves from PB or BM derived material are superimposed
suggesting
equivalency of source material as previously reported. The minimal difference
of 3 cells/nL
between the 7 and 10 cell/nL preparations (equaling 30 cells per dot) between
the two
CA 02653398 2008-11-25
WO 2007/140316 PCT/US2007/069771
19
samples could readily be detected in all samples for all 6 different ABs
confirming the
quantitative nature of the assay. In experiments where the most concentrated
sample had
either 1000 or 500 cell equivalents per dot, and where the 8th dilution
contained protein form
8 and 4 cells respectively, we were able to detect a difference in signal
intensity. The smallest
numbers of cells from which protein was reliably detectable was 3 cells.
The sensitivity of RPPA was demonstrated by the ability to detect protein
expression
in primary samples at levels down to the femto-molar range using comparison to
know
purified protein preparation standards. 100 different phospho and total
peptides have been
obtained sufficient for quantification of 1000s of patient samples. The
peptides can be
arrayed on each slide allowing reference peptide curves from each array. The
ability to detect
expression in as few as three cell equivalents and to reliably detect
differences in expression
intensities between as few as 3 cells demonstrates the robustness and
sensitivity of the RPPA
system. Neither WB, nor MALDI-TOF achieves this sensitivity on a large scale
basis.
Immunohistochemistry assesses single cells, but is not suitable for a large
scale comparison
of many cells for many proteins. Fixation and protein stability are issues and
the entire
proteome is not as reliably represented as with RPPA. RPPA is a complementary,
high-
throughput screening tool, where individual results can be confirmed and
expanded on with
IHC or other methods.
Protein- and Phospho-Epitope Stability
To assess phosphoepitope stability we tested whether the handling of cells
used to
generate protein affected phosphoprotein detection. Vials of cryopreserved
blood and marrow
derived cells, obtained on the same day from a patient, were thawed and a
portion was
removed to make a whole cell lysate, and the remaining cells refrozen. This
was repeated for
2 cycles after which a second lysate was prepared. These Freeze-thaw
specimens, along with
the freshly prepared lysate, were printed onto slides and probed with eight
total and phospho-
proteins: ERKI/2, p-MAPK 42/44, Stat3, p-Stat3 (Thr 705), Akt, p-Akt (Ser473),
p38, p-p38
(Thrl80/Tyr182). There was no statistically significant difference in
phosphoepitope
expression intensity between the freshly prepared blue lysate and the samples
prepared from
cryopreserved derived samples (either PB or BM) from the first or third
thawing. (Figure 5
and Figure 6). Similar levels of expression of (phospho)-proteins were
observed in PB and
BM samples (except patient 5) consistent with our findings using WB or Flow
cytometry,
CA 02653398 2008-11-25
WO 2007/140316 PCT/US2007/069771
indicating that leukemia enriched PB and BM samples can be used in the same
analysis when
only one is available. The above observation was further confirmed in a third
sample set of
23 AML samples with simultaneously collected PB and BM samples. Expression
profiles of
these specimens showed no statistically significant difference between PB or
BM from the
same patient on unsupervised hierarchial clustering (p=0.67 for 23 samples and
37
antibodies).
The stability of phosphoepitopes over time was demonstrated by the similar
findings
obtained from freshly prepared protein samples made from cryopreserved cells
when
compared to protein samples prepared from the same specimen years before and
stored at -
70 C since preparation. Furthermore, these results demonstrated that
phosphoprotein epitopes
in cryopreserved cells were relatively stable to repetitive freeze-thawing and
to variability of
specimens processing. This is important to know as it increases the confidence
in the results
of AML profiling.
Reproducibility and Precision of Printing/Spotting
To assess the reproducibility and variability of RPPA, the variation between
lysate
preparations, as well as the variation between plate and experiment setups and
array runs, was
tested (inter- and intrasample and intra- and interarray variation).
First to test the effect of array set up and preparation, the same lysate was
prepared
twice (two array plates) and printed onto the same array slide (inter-plate
preparation). High
correlations (R2=0.89-0.97) were observed. We next tested the variability of
preparing new
lysates from the same leukemia specimen (interexperiment). Again, when printed
on the same
array, high correlations (R2=generally from 0.79-0.96) were observed,
demonstrating
reproducibility within protein lysates production. Lastly, inter-array
comparison (the same
sample spotted onto different slides) is high, with coefficients of variation
< 15%. Assayed
proteins in all experiments were: p38, p-p38, Stat3, p-Stat3 (Tyr705), ERK, p-
MAPK 40/42,
m-Tor, p-mTOR (Ser2448), p-AktS473, p-p70S6kinase (Thr389).
Duplicate spotting, (printing the same sample from a plate twice onto the same
slide),
is used by most groups but reduces the number of different samples that can be
printed on a
single slide. The correlation between duplicate spots was tested for 6
different antibodies and
extremely high concordance was observed (Mean R2 =0.9926; ERK1/2=0.9973, pMAPK
(42/44)=0.9919, Stat3=0.9825, pStat3 (Thr 705)= 0.9979, Akt=0.9920, pAkt
CA 02653398 2008-11-25
WO 2007/140316 PCT/US2007/069771
21
(Ser473)=0.9941) (Figure 4). This lack of variability suggests that
duplication is not
necessary.
Protein Quantification
To accurately determine the absolute concentrations of proteins in a sample,
we
currently gcnerate standard signal intensity-concentration curves for purified
proteins or
recombinant peptides of known concentration for comparison with the samples in
which
protein concentrations are unknown. Using these peptide standard-reference
curves the
unknown protein concentration of each samples/lysate can be calculated. First
the protein
concentration for control cell lysates printed onto each slide (e.g. U937,
HL60, Jurkat), is
determined to serve as reference point for the signal intensity of "a slide."
Each slide can then
be normalized to the protein expression intensities of the control cell
lysates. From that, the
absolute protein concentration can be determined reading off the peptide
standard curve. An
example is shown in Figure 7. Purified activated Akt protein and p-Akt 473
peptide were
arrayed by RPPA. Signal intensity (Y-axis) versus protein concentration
(Protein (pg) log
scale) was plotted. There was a linear relationship between the concentrations
of purified
activated AKT and phospho-AKT peptides and signal intensity. The RPPA assay
detected
activated AKT protein to picogram and phospho-AKT peptide to femtogram levels
complementing our observation of the ability to detect minimal differences in
cell numbers or
protein concentration.
Analysis of Hematopoetic Stem Cells by RPPA
Most analyses of protein expression in leukemia utilize the bulk population of
leukemic cells in the marrow or blood, rather than the rare stem cell
population. An
unresolved question is whether protein expression in stem cells is similar or
distinct from that
of the bulk population of leukemia cells. Since only 10-20,000 LSC or HSC can
realistically
be isolated from a sample (0.001% of 1x10' cells = 10,000 stem cells)
traditional methods
(WB, Flow) have not been able to analyze protein expression in stem cells. In
contrast, a
single slide for RPPA analysis requires only -200 cells protein equivalents,
for a series of 8
dilutions, making RPPA ideally suited to analysis of low abundance populations
of cells and
10-20,000 stem cells would provide sufficient lysate to allow for printing of
50 to 200 slides
(equals 50 to 200 different AB's) from one sample. This number could be
doubled using
flurochrome probes Cy3 and Cy5 for each slide. As a pilot we generated protein
lysates from
CA 02653398 2008-11-25
WO 2007/140316 PCT/US2007/069771
22
isolated CD34+/CD38- stem cells, CD34+/CD38+ cells, CD34+ cells and the bulk
leukemia
cell population. Figure 8 gives several examples of lineage positive and
negative (CD 34/38)
HSC assayed by RPPA and probed with various ABs. Results have shown that HSCs
have a
different protein signature compared to normal SCs (data not shown).
Correlation of RPPA with Western Blotting and Immunohistochemistry
The correlation of RPPA with conventional techniques was assessed in human
leukemia cell lines U937 and NB4. Cells were incubated with varying doses of
cytarabine
alone or in combination with idarubicin. Cells were lysed and analyzed at
varying time points
and probed by RPPA and WB. Expression levels with RPPA were highly correlated
with
expression levels determined by Western Blotting. There was excellent
correlation between
WB and RPPA results with correlations coefficients were between R2=0.89-0.98
for Akt, p-
Akt (473), Erk, p-Erk (42/44), Bcl-2 (data not shown).
Approach to Data Normalization and Loading Control
Inter-Array Comparison. One challenge in array analysis is the variability and
comparability of staining between arrays (inter-array). One approach to
increase inter-slide is
to run positive controls, consisting of unstimulated, stimulated and inhibited
cell lysates (e.g.
MDA-468 EGF, U937, HL60, Jurkat + FAS or niixtures of cell lysates) on each
slide.
These serve as a reference point for the signal intensity of "a slide."
Individual samples can
be compared relative to the average slide intensity as well as in relation to
the intensity of a
particular sample on a slide stained for a different antibody. Thus cross-
comparison of
samples and antibodies from distinct arrays can be compared.
Once a signal intensity of a sample (corrected for varying parameters) is
determined,
the absolute concentration can be determined from the peptide standard curve,
similar to an
ELISA assay. Alternatively if only relative protein expression levels are
compared and
numbers for absolute protein concentrations are not required, a set of
samples/slides/experiments can be compared based on correction for the
difference in signal
intensity to the control cell lysates only. We routinely use both approaches
depending on the
specific question.
Protein Loading Correction/Normalization
Protein loading affects signal intensity. To correct for printing, AB
binding/detection
and staining variability, we aimed to develop a protein loading correction
method. The
CA 02653398 2008-11-25
WO 2007/140316 PCT/US2007/069771
23
necessity for this is supported by the observation that unsupervised
hierarchical clustering of
different samples sets (cell lines, primary samples, stem cells) arranges
samples according to
their corresponding set. The samples cluster according to their protein
loading rather their
true value for individual proteins expression intensity.
Therefore a protein loading/normalization approach was developed in a set of
96
primary AML samples. Surprisingly, the commonly used WB "housekeeping"
proteins like
Actin and GAPDH showed large variations amongst samples. This is not as
surprising as we
have made similar observations of leukemic samples analyzed by WB for Actin
and GAPDH.
A potential explanation is that WB membranes are saturated with proteins
including Actin
and GAPDH. Abundance of the added antibodies yields homogeneously dense bands
on WB.
The more sensitive RPPA can detect differences over a 3-41og range whereas the
range is 1.5
log for a typical WB. Protein-AB binding and concentration relationships are
not assayed at
their saturation in RPPA allowing detection of protein concentrations in the
linear range
depicting variations in Actin or GAPDH staining.
Similar to transcriptional arrays we aimed to compare different ways of
correcting for
loading using new housekeeping proteins. Empirically, we observed that 5 AB
did show
relatively stable expression across samples across slides (mTor, Erk, JNK,
GSK, p38).
However as these proteins might undergo functional regulation and changes, we
hypothesized
that the least regulated proteins ("housekeeping" proteins) might be a better
normalization
approach and corrected against the 1/3`d of proteins with the least variation
in expression
intensities. Finally a validated approach is to normalize against the average
of all proteins. All
three approaches yielded similar results with correlation (R) between 0.82-
0.92. Sample
distribution on unsupervised clustering of the 96 AML samples was identically
for all three
approaches. We usually stain 1-2 slides per arrays set with AB against our
housekeeping
proteins.
Alternatively if the absolute concentration of a protein does not need to be
determined, building the ratio of the phospho over the corresponding total
protein is another
way to compare expression results amongst samples. Ratios factor out protein
loading
reflecting the change in the activity of proteins relative to the total amount
of that particular
protein. Either corrected numbers or ratio numbers can then be used for
hierarchical
clustering or other means of data analysis and representation.
CA 02653398 2008-11-25
WO 2007/140316 PCT/US2007/069771
24
Finally a new approach is proposed to overcome some of the normalization and
quantification difficulties in proteomic analysis. As not all samples may have
protein
concentration or cell numbers available, a protein loading procedure needs to
correct for
potential uneven loading. Correcting each spot/sample for an average of 5-8
stable expressed
proteins (housekeeping) or all proteins can factor out to a large part,
printing, detection and
staining variability before analyzing the data and still allow detection if
total and
phosphoprotein are regulated differentially. At the same time, this highlights
the need for
standardization of protein sample collection and processing. For the 96 AML
samples
presumably same cell numbers per volume were lysed for the last 10-15 years.
Statistical Analysis
This data set will be analyzed using programs and algorithms identical to
those used
for analysis of gene expression arrays. The data will be analyzed for the
presence of clusters
based on differential protein expression by a monethetic (binary variables)
clustering method
using statistical software. Chi-square test with continuity corrections will
be used for
statistical analysis. A variety of clustering methods (including hierarchical
clustering, K-
means, independent component analysis, mutual information, and gene shaving)
will be used
to classify the samples into statistically similar groups. The robustness and
statistical
significance of these groups will be evaluated by bootstrap resampling of the
data. In
addition, the drivers of this classification can be determined by analyzing
the pathways
activated using pathway analysis software (Ingenuity Syst., Mountain View,
CA). The patient
samples are linked to the Leukemia Sample Bank Database including patient
characteristics
(incl. cytogenetics, age gender, FAB type, prior hematological disorder, blast
percent) and
outcome data (response to therapy, type of therapy, remission duration etc).
These data can
be correlated with the RPPA clusters using standard statistical methods,
including Fisher's
exact test, analysis of variance, and Cox proportional hazards models for time
to recurrence.
In this way, we can determine if clusters of patient samples generated by
RPPAs have clinical
significance and correlate with specific endpoints such as cytogenetics, type
of
chemotherapy, etc. Adequate power to determine differences requires a
"training set" of -80
patient samples and at least 120 patient samples as independent "test and
validation sets." It is
important to emphasize that the 320 patient samples to be analyzed is larger
than any
analyzed by transcriptional profiling in any study providing high information
content. The
CA 02653398 2008-11-25
WO 2007/140316 PCT/US2007/069771
MDACC Leukenlia Sample bank has more than sufficient numbers of liquid
nitrogen stored
patient samples and ready to use western blot lysates available for immediate
processing (we
have already identified 80-100 training and 240 test set samples).
Cytokine And Chemokine Expression In Aml And Mds Patient Samples
Methods according to certain embodiments of the present disclosure were used
in
conjunction with existing technology to test a large set of acute myeloid
leukemia (AML) and
myelodyspasia (MDS) patient samples for their cytokine and chemokine
expression, and
patterns of exprssion were determined and correlated with clinical outcomes.
Protein
expression and activation determines the pathophysiology of leukemic cells in
Myelodysplasia (MDS) and Acute Myelogenous Leukemia (AML) and is dependent on
endogenous changes (e.g mutation, methylation) and exogenous signals from
stromal
interactions, cytokines (CTKN) and chemokines.
The level of 26 CTKN (IL-1RA, IB, 2, 4 5, 6, 7 , 8 , 9, 10,12, 13, 15, 17,
Eotaxin,
FGFB, G-CSF, GM-CSF, IFNy, IP10, MCP1, MIP1a, MIP1(3, PDGF, TNFa and VEGF) was
measured using multiplex cytometry (BioplexTM, Biorad) in serum samples from
176 AML
(138 untreated (New), 38 relapsed (REL)) and 114 MDS patients (97 New, 10 post
biological
therapy, 7 REL) and 19 normal (NL) subjects. Individual CTKN expression was
not
correlated with clinical features (e.g. age, gender, cytogenetics, FAB, HB,
WBC, platelet etc).
The levels of IL -1 R, 4, 5, 6, 7,10,12, 13, 17, IFNy, FGFB and MIP 1 a were
significantly
lower and IL-8 and 15 higher in AML/MDS compared to NL. The expression
profiles of
AML and MDS were statistically indistinguishable whether analyzed individually
or by
unsupervised hierarchical clustering, except for IL-8 and 13 (higher in AML)
and VEGF
(higher in MDS).
When CTKN were evaluated individually in new AML cases higher levels of IL4, 5
and 10 correlated significantly with remission attainment, and higher levels
of IL8, Il l Ra, IP-
10, Miplo, VEGF and ILR, correlated significantly with shorter survival. No
CTKN
predicted remission attainment or survival in MDS. Unsupervised hierarchical
bootstrap
clustering using Pearson correlation and average linkage of CTKN expression
relative to
other CTKN expression, where high levels of one CTKN correlated with high
expression of
the other, revealed 6 highly reproducible expression patterns: 1) IL-1(3 4, 7,
10, 12, 13, G-
CA 02653398 2008-11-25
WO 2007/140316 PCT/US2007/069771
26
CSF, IFNy, MIPIa and PDGF 2) IL lra, 6, 8 Eotaxin, IP-10, MIPI(3 and VEGF, 3)
IL2, 9, 15
and GMCSF, 4) IL5 5) IL-7, FGF-Basic, TNFa and 6) MCP1.
Similar unsupervised clustering of the samples based on CTKN expression using
average linkage also revealed 5 disease clusters and a NL sample cluster
(containing all 19
NL samples). Average expression levels of each CTKN in these 5 clusters show
diminished
expression of most CTKN that had high expression in the NL samples, with each
group
showing increase in expression in a distinct subset of CTKN relative to NL.
Remission
attainment was strongly associated with cytokine signature (P=0.005). In
summary, most
CTKNs showed different expression in AML and MDS compared to NL;
interestingly,
CTKN expression in AML and MDS were similar; many CTKN are predictive of
outcome
individually; CTKN signatures distinguish groups of patients and are
predictive of outcome;
correlation with proteomic profiling may suggest CTKN to target in combination
with other
targeted therapies to maximally affect activated pathways.
RPPA Analysis and Associated Expression Signature Analysis
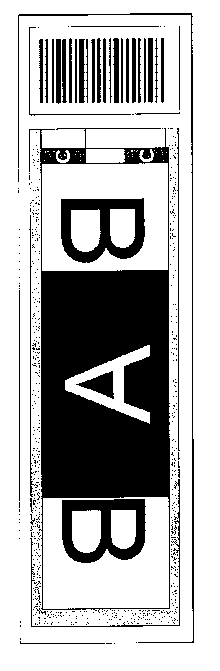
RPPA. A RPPA slide formatted as described above was used to analyze 550
patient
samples with 52 proteins and phosphoproteins. The patient derived samples were
whole cell
lysates made from leukemia enriched CD3/CD19 depleted blood or marrow at a
cell
concentration of about 1x10⁴ cells per microliter. These samples were printed
in replicate,
one group in the spot designated by the "A," and the other split on either
side of that in a
reversed orientation represented by the upside down "B." For normalization, a
positive
control consisting of a mixture of 11 cell lines and a negative control
consisting of the protein
lysate buffer were used. For expression controls, 18 cell lines, including
baseline and growth
factor or cytokine stimulated versions shown on the schematic by the letter
"C" and 18
normal peripheral blood samples, shown by the letter "N," were used. To permit
quantification of signal strength 138 purified peptides covering many of the
proteins expected
to measure, shown by the purple band encircling the patient samples, was
included. A
diagram illustrating the printing schematic is illustrated in Figure 9.
The arrays were printed on an Aushon BioSytems 2470 arrayer using custom 175
micron pins. Each slide had 7968 dots printed. 5 serial 1 to 3 dilutions of
each sample were
printed, with the dots having an estimated ranged from about 85 cell
equivalents of protein
down to 1 cell equivalents of protein. At the end of each row of patient
sample was printed
CA 02653398 2008-11-25
WO 2007/140316 PCT/US2007/069771
27
either the positive or negative control. These create a grid across the whole
slide, shown by
the alternating red and black dots. Figure 10 illustrates a representative
slide created using
this process.
Dilution-Concentration-Expression Curve And Expression Level Analysis. Protein
expression intensity was measured with an automated software program called
MicroVigene.
The dilution series of the samples provide a dilution-concentration-expression
curve giving
numbers that can be read off the linear part of the curve and are used for
data processing.
Figure 2 demonstrates such a curve. The data was standardized using
topographical
normalization and perturbation bootstrap validation/clustering was performed.
This clustering
method factors in randomness and errors and allows for correction of biases.
This greatly
increases the reliability and trustfulness of the data. A Bonferoni correction
was also
performed which accounts for the number of samples and proteins/antibodies
when
calculating statistical significance.
The protein expression levels in the leukemia enriched samples prepared from
blood
and marrow were analyzed. Overall clustering revealed no difference, but there
were 8 of the
52 proteins with statistically significant differences. 4 were higher in blood
and 4 higher in
marrow. While the differences were statistically significant, the fold
differences were all low.
From this it can be concluded that blood and marrow samples can be used in the
same
analysis. The scale was normalized for the 8 proteins with differences. Table
3 illustrates the
results of this analysis with respect to blood and marrow samples.
CA 02653398 2008-11-25
WO 2007/140316 PCT/US2007/069771
28
TABLE 3: Protein Expression Levels in Leukemia Enriched Samples Prepared from
Blood
and Marrow
Protein Expressed Higher in Samples Prepared from Marrow
Protein Fold
pMTOR 1.076
pS6RP.p240-244 1.321
S6.p2211 1.239
Survivin 1.071
Proteins Expressed Higher in Samples Prepared from Blood
Protein Fold
BAD 1.070
BAK 1.051
SRC 1.154
pSRCp527 1.169
Protein expression levels, shown in blue in Figure 11, did not correlate with
any of the
traditional clinical correlates including age, gender, infection, performance
status, or
hematological parameters, shown as red in Figure 11. As illustrated in Figure
11, these
criteria were separate on this cluster diagram.
Protein expression was different depending on disease status for 10% of the 52
proteins. Expression of ten proteins differed between newly diagnosed and
relapsed. These
included: pAKTp308, BCL2, pERK2, MTOR, pMTOR, PTEN, pPTEN, SMAC, pSRC.p527,
and SSBP2.
Figure 12 shows the mean levels of protein expression for particular proteins
organized by disease status, going from newly diagnosed to, primary refractory
first- relapse
and second or greater relapse. Various patterns were present with some
proteins increasing
with increasing resistance and others decreasing. In some cases, the greater
change was
between new and relapse, in others between new and primary refractory. This
suggests that
relevance of some proteins changes during the evolution of leukemia, and this
may affect
whether agents targeting these proteins are more or less likely to be
effective.
CA 02653398 2008-11-25
WO 2007/140316 PCT/US2007/069771
29
Figure 13 shows unsupervised clustering of protein expression levels.
Unsupervised
clustering revealed 4 clusters. The first was composed mostly of
phosphorylated STP, the
second and third mainly of apoptosis related proteins and the last of
phosphorylated stat
proteins.
Bootstrap clustering was performed and showed that these four clusters were
highly
reproducible, as shown in Figure 14. Bright yellow indicates 100% correlation
and pure blue
shows that 2 proteins are never correlated.
FAB Classification. Protein expression levels were then evaluated across FAB
classification. Significant differences were noted for 23 proteins. As shown
in Figure 15, the
protein expression signatures of these 23 proteins could be used to classify
patients. This data
may be used to suggest when to use targeted therapies. For example, it may be
desired to
selectively use an anti-BCL2 agent in MO, Ml and M2 where levels are high, and
not in other
FAB classifications where it is already low.
Cytogenetics. Protein expression signatures were further evaluated in the
context of
cytogenetics (Figure 16). A patient again could be clustered with different
protein signatures
being associated with particular cytogenetic changes. Of note, to the right
side of FIGURE
16, all of the changes involving chromosomes 5 and 7 , individually or in
combination, were
found in the same cluster, with the exception of those with an 11q23
abnormality. Notably,
favorable cytogenetic changes inversion 16 and translocation 8 21, which both
affect core
binding factor did not cluster with each other. Figure 17 shows a heat map
shows the average
level of protein expression by cytogenetic category, arrayed in the same order
as the prior
dendogram. As might be expected, diploids, and miscellaneous likely
representing a polyglot
of changes, had median expression for most proteins. Figure 17 suggest that
targeted
therapies need to be applied selectively to those cytogenetics categories
where expression or
activation of that particular protein is found. For example, agents like
nutlins would not be
likely to be effective incases with a -5 or -7 where p531evels are very high.
Principal component clustering, based on the absolute value of Pearson
correlation,
was used to define proteins clusters. This initially suggested 10 clusters.
The total score or
"signature" for a patient was determined by taking the sum of the score for
each protein
cluster. To define a protein signature, the score for each cluster for each
patient was
CA 02653398 2008-11-25
WO 2007/140316 PCT/US2007/069771
determined and an overall vector determined. When patients were clustered
based on this
overall score, 7 proteins signature groups emerged.
Figures 18 illustrates a heat map showing the average signal of each proteins
within
the 7 protein signature clusters. The components of the 10 protein clusters
and average
expression of each protein in each group are shown. In some groups the
proteins all generally
show positive correlation, while in other groups there are protein with both
positive and
negative correlation. This demonstrates that there are unique recurrent
patterns or signatures
observed in AML.
Within these 7 protein signature clusters patients were not evenly divided on
the basis
of cytogenetics. Table 4 shows how patients within a cytogenetic group were
divided among
the 7 signatures. Some groups had over representation, or under
representation, within a
group.
TABLE 4: Cytogenetics Unevenly Distributed Within Protein Signature Groups
Group Favorable Intermediate Unfavorable
1 22.7% 23.5% 20.2%
2 9% 12.1% 10%
3 4.5% 7.3% 10%
4 4.5% 8.9% 16%
5 18.2% 29.2% 18.4%
6 31.8% 16.2% 7.5%
7 9% 2.4% 17.6%
Table 5 shows the response rate when patients are stratified by protein
signature and
cytogenetics. Since all the favorable cytogenetic patients achieved remission
the signature
was not informative, however the remission rate varied greatly for both
intermediate and
unfavorable prognosis cytogenetics depending on the proteins expression
signature. The same
stratification of patients by protein signature and cytogenetics was used to
analyze relapse
rates. This revealed that protein signatures are associated with markedly
different relapse
rates within cytogenetic groupings. Table 6 below illustrates these findings.
CA 02653398 2008-11-25
WO 2007/140316 PCT/US2007/069771
31
TABLE 5: Response Rate By Protein Signature Group And Cytogenetics
Group Favorable Intermediate Unfavorable
1 100% 78% 42%
2 100% 71% 50%
3 100% 71% 50%
4 100% 30% 53%
100% 59% 35%
6 100% 63% 75%
7 100% 0% 37%
TABLE 6: Relapse Rate By Protein Signature Group And Cytogenetics
Group Favorable Intermediate Unfavorable
1 60% 34% 63%
2 50% 60% 40%
3 0% 20% 80%
4 0% 33% 63%
5 50% 50% 67%
6 29% 75% 0%
7 50% NA 100%
Protein Expression Signatures Are Prognostic
73 AML patents were evaluated using the methods according to certain
embodiments
of the present disclosure. 22 proteins and 15 phosphoproteins were measured.
Distinct protein
expression signatures existed and were prognostic. Differing response rates
and differing
relapse rates were present. The response rate, primary refractory or
resistance rate and the
rate of relapse for each signature group is shown in Table 7. While CR and
resistance rates
differed across the groups, the overall relapse rate was similar in all groups
except group 7.
Within these 7 protein signature clusters, patients were not evenly divided on
the basis
of cytogenetics. Table 8 shows the percentage of each signature made up by
each of the 3
CA 02653398 2008-11-25
WO 2007/140316 PCT/US2007/069771
32
large cytogenetic groups. Some groups had over representation shown in red, or
under
representation, shown in yellow within a group.
TABLE 7: Cr, Resistance And Relapse Rates By Group
Group # %CR %Fail + % Relapse
Resistant
1 47 66 34 45
2 27 66 34 50
3 18 61 39 45
4 26 46 54 50
55 54.5 45.5 53
6 30 73 26.6 50
7 21 47.6 53.4 80
TABLE 8: Cytogenetics Unevenly Distributed Within Protein Signature Groups
Group Favorable (%) Intermediate (%) Unfavorable (%)
1 8.6 50 41.4
2 6.7 50 40%
3 4.5 40.9 54.5
4 3.2 35.5 61.3
5 6.3 57.1 34.9
6 19.4 55.6 25
7 10.7 7.1 75
Figure 19 shows the mean levels by disease status, going from newly diagnosed
to
first relapse, primary refractory and second or greater relapse. Blue lines
are blood and red
are marrow. You can see that various patterns were present with some proteins
increasing
with increasing resistance and others decreasing. In some cases, the greater
change was
between new and relapse, in others between new and primary refractory. This
may suggest
changing importance of certain proteins during the evolution of leukemia and
may affect
when agents targeting these proteins are more or less likely to be effective.
CA 02653398 2008-11-25
WO 2007/140316 PCT/US2007/069771
33
Thus, RPPA expression arrays define distinct protein expression signatures
associated
with: FAB, cytogenetics, response rates, resistance, and relapse rates.
Signatures may guide
targeted therapy to settings where greater efficacy may occur.
Notwithstanding that the numerical ranges and parameters setting forth the
broad
scope of the invention are approximations, the numerical values set forth in
the specific
examples are reported as precisely as possible. Any numerical value, however,
inherently
contain certain errors necessarily resulting from the standard deviation found
in their
respective testing measurements.
Therefore, the present invention is well adapted to attain the ends and
advantages
mentioned as well as those that are inherent therein. While numerous changes
may be made
by those skilled in the art, such changes are encompassed within the spirit of
this invention as
illustrated, in part, by the appended claims.