Note: Descriptions are shown in the official language in which they were submitted.
CA 02662893 2009-03-06
WO 2008/028298 PCT/CA2007/001581
-1-
FLUORESCENCE QUANTIFICATION AND IMAGE ACQUISITION IN
HIGHLY TURBID MEDIA
FIELD
[0001] Various embodiments of methods and devices are described
herein that relate to fluorescence imaging, which can be used in various
applications including medical imaging.
BACKGROUND
[0002] Administration of a targeted fluorescent marker is one approach
that can enhance a physician's ability to visualize early cancers and other
medical conditions. After administration of the fluorescent marker, the tissue
can be illuminated with light of an appropriate wavelength to excite the
fluorescent marker while the resulting fluorescence is detected using a
sensitive light detector.
[0003] The diagnostic accuracy of this approach has varied widely
mainly due to reliance on more traditional, passive targeting strategies.
These strategies attempted to exploit the differences in vasculature or
pharmacokinetics between tumors and normal tissues. However, non-specific
uptake of more traditional fluorescent markers resulted in low fluorescence
contrast between tumors and surrounding normal tissue.
[0004] Recent advances in genomics, proteomics and nanotechnology
have enabled the engineering of nanoparticies that comprise a targeting
moiety (such as antibodies, antibody fragments or peptides) conjugated to a
marker ligant. The advent of these new particles suggests the possibility of
active targeting of a region of interest in the body. Imaging of these
particles
can be used for early detection of cancer as well as for yielding functional
information, on a molecular level, about the invasiveness, progression and
treatment response of the disease. This information, directly available to the
clinician during 'molecular diagnostic screening' or 'molecular image-guided
surgery', has the potential to improve clinical decision-making and could
ultimately improve diagnostic accuracy and outcome.
CA 02662893 2009-03-06
WO 2008/028298 PCT/CA2007/001581
-2-
[0005] Both diagnostic screening and image-guided surgery involve
high throughput, high-resolution images of the tissue surface, with real-time
display of at least approximately 30 frames/sec being preferred. However,
MRI, SPECT, PET, optical fluorescence tomography, hyper-spectral
fluorescence imaging and bioluminescence imaging do not currently offer
such high frame rates. By contrast, 2-Dimensional (2D) ultrasound and 2D
optical fluorescence imaging do offer high throughput imaging. Ultrasound
typically offers B-scan images representing a section through the tissue while
optical fluorescence imaging offers tissue surface images, at a high
resolution
with relatively low technological complexity and significantly lower cost.
[0006] However, extracting functional information about the disease
state in vivo requires accurate, quantitative measurements of fluorescence.
This is a major challenge, because the in vivo fluorescence depends on many
parameters other than the concentration of the fluorescent marker which
degrades the quantitative measurements. For example, variations in the
tissue-to-detector geometry, autofluorescence and tissue optical properties,
degrade the quantitative measurements such that the raw fluorescence image
can be subject to several artifacts that compromise accurate quantification.
SUMMARY
[0007] In a first aspect, at least one embodiment described herein
provides a method for quantification of fluorescence from fluorophores in a
region of interest of an object. The method comprises selecting at least one
type of fluorophore from the region of interest; providing at least one
excitation
signal to the region of interest to produce fluorescence from the at least one
type of fluorophore and to generate at least one reflectance signal; obtaining
the produced fluorescence and reflectance signals from the region of interest;
producing a quantified fluorescence signal for each of the resulting
fluorescence signals by dividing by the corresponding reflectance signals; and
calculating at least one ratio of the quantified fluorescence signals.
CA 02662893 2009-03-06
WO 2008/028298 PCT/CA2007/001581
-3-
[0008] In a second aspect, at least one embodiment described herein
provides a fluorescence imaging system for acquisition and quantification of
fluorescence from a region of interest of an object. The system comprises a
light source unit configured to produce at least one excitation signal that is
provided to the region of interest to enable at least one fluorescence signal
to
be produced from at least one type of fluorophore in the region of interest
and
at least one reflectance signal to be produced from the region of interest; a
detection unit configured to obtain the fluorescence and reflectance signals
produced from the region of interest; and a data processing unit configured to
calculate a quantified fluorescence signal for each of the produced
fluorescence signals by dividing by the corresponding reflectance signals, and
calculate at least one ratio of the quantified fluorescence signals.
[0009] In a third aspect, at least one embodiment described herein
provides a method for quantification of fluorescence from fluorophores in a
region of interest of an object. The method comprises selecting a single type
of fluorophore from the region of interest; providing light energy at first
and
second excitation wavelengths to the region of interest corresponding to
relative absorption maxima and minima of the fluorophore to produce first and
second fluorescence signals at a similar emission wavelength from the
fluorophore or providing light energy at an excitation wavelength to the
region
of interest to produce first and second fluorescence signals at a relative
maxima and minima of the emission spectra of the fluorophore; obtaining the
first and second fluorescence signals from the region of interest; calculating
a
ratio of the first and second fluorescence signals; and generating a final
image
of at least a portion of the region of interest based on the ratio.
[0010] In a fourth aspect, at least one embodiment described herein
provides a method for quantification of luminescence originating from
luminescent particles from a region of interest of an object. The method
comprises obtaining at least one first type of signal from the region of
interest;
obtaining at least one second type of signal from the region of interest;
calculating a quantified signal for the at least one first type of signal by
CA 02662893 2009-03-06
WO 2008/028298 PCT/CA2007/001581
-4-
dividing by the corresponding second type of signal; calculating at least one
ratio of the quantified signals; and generating a final image of at least a
portion of the region of interest based on one of the at least one ratios. The
first type of signal comprises luminescence and the second type of signal
comprises one of reflectance and luminescence that depends similarly on
optical properties as the first type of signal.
BRIEF DESCRIPTION OF THE DRAWINGS
[0011] For a better understanding of the various embodiments
described herein and to show more clearly how they may be carried into
effect, reference will now be made, by way of example only, to the
accompanying drawings in which:
Figure 1 shows a flow chart diagram of an exemplary
embodiment of a method for acquisition and quantification of fluorescence
signals;
Figure 2 shows a schematic representation of an exemplary
embodiment of a fluorescence imaging system for carrying out the method of
Figure 1;
Figures 3A-3C show schematic excitation and emission spectra
of tissues containing various markers;
Figure 4 is a graph showing the modeled absorption coefficient
for deoxygenated blood, oxygenated blood and tissue as well as the reduced
scattering coefficient for tissue;
Figures 5A and 5B show graphs of fluorescence intensity versus
fluorophore concentration for raw and corrected fluorescence images
respectively;
Figures 6A-6E demonstrate the potential usefulness of the
methods described herein when applied to surgical resection.
CA 02662893 2009-03-06
WO 2008/028298 PCT/CA2007/001581
-5-
Figures 7A-7E show red, blue and green pixel intensities,
respectively, plotted against PpIX concentration, at varying working distances
of excitation wavelength 1 (left row) and excitation wavelength 2 (right row)
using varying proportions of PpIX extract in tissue-simulating phantoms
5(Na=1.9cm"1, Ns'=8.0cm-1 at 635 nm); and
Figure 8 shows a quantified signal calculated according to
method Q3 in a test case in which PpIX was used as a target fluorophore and
Fluorescein was used as a reference fluorophore.
DETAILED DESCRIPTION OF THE VARIOUS EMBODIMENTS
[0012] It will be appreciated that numerous specific details are set forth
in order to provide a thorough understanding of the various embodiments
described herein. However, it will be understood by those of ordinary skill in
the art that the various embodiments may be implemented without these
specific details. In other instances, well-known methods, procedures and
components have not been described in detail so as not to obscure the
embodiments described herein. Further, where considered appropriate,
reference numerals may be repeated among the figures to indicate
corresponding or analogous elements.
[0013] The word fluorophore used herein can be defined in many ways.
A fluorophore can be considered to be a component of a molecule that
causes the molecule to be fluorescent. A fluorophore absorbs energy of a
specific wavelength and re-emits energy at a different, but equally specific,
wavelength. Fluorophores can also be considered to be any fluorescent
particle or portion of a particle. Such a particle can be naturally occurring
or
engineered. It can be untargeted, passively targeted or actively targeted by
conjugating with a targeting moiety including, but not restricted to,
antibodies,
antibody fragments and peptides, or may employ any other targeting or non-
targeting strategy.
[0014] Synonymous to fluorophores as described herein are:
fluorescent dyes, fluorescent markers, fluorescent labels, fluorochromes,
CA 02662893 2009-03-06
WO 2008/028298 PCT/CA2007/001581
-6-
fluorescent biomarkers, molecular probes, microspheres, quantum dots,
nanochrystals, fluorescent probes and any other terms used to describe
fluorescent particles or fluorescent components of a particle. Historically
common examples of fluorophores are fluorescien, porphyrins, rhodamine,
coumarin, cyanine, phthalocyanines and any derivatives thereof. Newer
generations of fluorophores include Alexa Fluors, DyLight, Fluorscent, green
fluorescent protein, DsRED, fluorescent microspheres and nanochrystals.
Fluorophores as described herein can, amongst other things, be endogenous
or exogenous.
[0015] Various embodiments of methods and devices are described
herein that can be used to generally acquire 2D fluorescence signals (i.e.
image data) and subsequently correct these signals for artifacts caused by
variations in excitation geometry, photodetector collection efficiency,
autofluorescence, tissue absorption, e.g. blood oxygenation and blood
volume, and tissue scattering in real-time based on ratiometric
quantification.
Accordingly, the methods are generally independent of variations in tissue
autofluorescence, detector geometry, excitation geometry, tissue optical
properties, irradiance and collection efficiency. The resulting signal, in
effect,
becomes independent of variation in the above parameters and provides
quantitative rather than qualitative information about the fluorescent marker.
The methods are also minimally dependent on tissue autofluorescence. The
2D fluorescence images are taken of a region of interest in an object that has
embedded fluorophore markers or naturally occurring fluorophores that can
be used with a method described herein. The methods can be used in vivo
and can be used with a wide variety of fluorescent markers. These methods
allow for an improved determination of fluorophore concentration, or
alternatively determining the degree of quenching versus unquenching, in
highly turbid media such as biological tissues by eliminating or reducing the
contribution of parameters other than the fluorophore of interest. These
ratiometric quantification methods can be used in conjunction with various
applications such as endoscopic screening or image-guided surgery.
CA 02662893 2009-03-06
WO 2008/028298 PCT/CA2007/001581
-7-
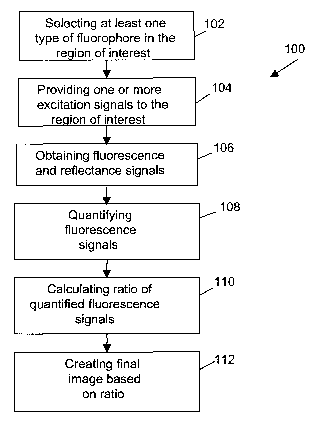
[00161 Referring now to Figure 1, shown therein is a flowchart diagram
for a general embodiment of a method 100 for acquiring and quantifying
fluorescence signals. At step 102, at least one type of fluorophore is
selected
for a region of interest of the target object that is to be imaged. The one or
more types of fluorophores are selected based on the physical properties of
the region and the object of interest and the information that is desired. It
will
be appreciated that different combinations of fluorophores and object
properties will yield different types of information about the region and
object
of interest. It should be noted that if the selected one or more types of
fluorophore do not naturally occur in the region of interest then this step
includes introducing or administering these one or more types of fluorophores
to the region of interest. At step 104, one or more excitation signals at
different excitation wavelengths are provided to the region of interest. The
excitation signals correspond to the one or more types of fluorophores that
are being imaged in that the excitation signals include energy at the proper
excitation wavelengths to cause the one or more types of fluorophores of
interest to fluoresce. In step 104, light is also provided to the region of
interest such that reflectance signals are produced from the region of
interest
at wavelengths corresponding to those used for excitation.
[0017] At step 106, fluorescence and reflectance signals from the
region of interest are obtained. The reflectance signals of interest include
diffusely reflected signals, however, the reflectance signals may also include
a
portion of spectrally reflected signals. The diffuse reflectance signals are
of
interest because they similarly depend on the media optical properties as
compared to the fluorescence signal. Thus, the diffusely reflected signal can
be used to minimize the dependency of the fluorescence signal on optical
properties.
[0018] At step 108, the fluorescence signals that have been obtained
are quantified. This can be done by dividing an obtained fluorescence signal
by a corresponding obtained reflectance signal; in this case the word
corresponding generally means the reflectance signal obtained at the
CA 02662893 2009-03-06
WO 2008/028298 PCT/CA2007/001581
-8-
wavelength that was used to excite the fluorescence signal. However, it
should be noted that in some embodiments of the method 100, reflectance
signals are not required and division by a reflectance signal is not
performed;
rather division by another fluorescence signal is used as is discussed in
further detail below with respect to quantification methods Q2 and Q3.
[0019] At step 110, at least one ratio of fluorescence or quantified
fluorescence signals is calculated. At step 112, an image of the region of
interest is created using at least one of the calculated fluorescence ratios.
It
should be noted that step 112 can optionally include overlaying at least two
images, one of which is an image based on the calculated ratio. Also, it
should be noted that in some cases step 112 can be optional in instances in
which the information provided by the calculated ratio can be used in ways
other than generating an image. Various embodiments of the method 100
exist, examples of which are now given.
[0020] In one exemplary embodiment, step 102 involves the
introduction of only one type of fluorophore, and step 104 involves the use of
two excitation signals having excitation wavelengths )"eX1 and ?IeX2
respectively. Step 106 involves the measurement of fluorescence signals
F(Aexl,Aem1) and F('\eX2,'\em1) both at an emission wavelength 4m1 and the
measurement of reflectance signals R(Aexi) and R(Aex2) at the excitation
wavelengths a.e,c1 and 4XZ respectively. The measured fluorescence and
reflectance signals in this and other embodiments described herein are
generally in units of mW/cm2 and the wavelengths or bands described herein
and in other embodiments are in units of nm. Step 108 involves the
quantification of the fluorescence due to a given excitation wavelength by
dividing by the reflectance at the given excitation wavelength according to
F(Aexl,Aem1)/R(,\ex1) and F(AeX2,Aem1)/R(1\eX2) respectively. The ratio at
step 110
is then calculated according to equation 1 by dividing the quantified
fluorescence at the first excitation wavelength by the quantified fluorescence
at the second excitation wavelength.
CA 02662893 2009-03-06
WO 2008/028298 PCT/CA2007/001581
-9-
l = F\~exl+~eml/ R\~ex2J (~)
S~ R`,exl/ F(kx2+kml)
To create the final image at step 112, the signals obtained at step 106 are
two
dimensional image signals and one performs the mathematical operations of
steps 108 and 110 for each pixel of the two dimensional image signals.
Accordingly, the final image can be the corrected fluorescence image.
Alternatively, the final image can be a combination of the corrected
fluorescence image and another image, such as a white light image, which is
described in further detail below.
[0021] Accordingly, in this case the method 100 comprises injecting
excitation light to a region of interest, such as a biological tissue, at a
first and
a second excitation wavelength, detecting fluorescence signal at an emission
wavelength, measuring a reflectance signal from the region of interest at the
first and second excitation wavelengths and providing a ratio of the
fluorescence signals in which each signal is normalized with the reflectance
signal at the corresponding excitation wavelength. Because the fluorescence
at the different excitation wavelengths depends differently on tissue optical
properties the method itself is dependent on optical properties. However, this
is minimized by dividing by the reflectance signals that have similar
dependencies on optical properties and the dependency on tissue optical
properties largely cancels out.
[0022] In an alternative embodiment, a method Q2 is performed using a
single type of fluorophore, providing excitation at first and second
wavelengths XeX1 and 4x2, and obtaining the resulting fluorescence signals
F(4X,, Xemi) and F(Xex2, 4ml) at the emission wavelength Xem, for the
fluorophore. The method Q2 then provides a corrected fluorescence
measurement by dividing the obtained fluorescence signals by one another as
shown in equation 2.
Q2 = F\Xexl ~Xem1 / /2)
F ( \Xex 2 1 )em I / l
CA 02662893 2009-03-06
WO 2008/028298 PCT/CA2007/001581
-10-
One may expect that Q2 provides a constant, however, this is not the case
because a background signal is also obtained when the fluorescence signals
are obtained and the division in equation 2 provides an initial slope that is
useful in measuring low concentrations of this type of fluorophore in the
region
of interest. However, improved quantification results are obtained using
methods Ql, Q3 and Q4 (methods Q3 and Q4 are described below).
[0023] For method Q2, the step of providing excitation signals includes
providing light energy at first and second excitation wavelengths to the
region
of interest corresponding to relative absorption maxima and minima of the
fluorophore to produce first and second fluorescence signals at a similar
emission wavelength from the fluorophore. Alternatively, this step can include
providing light energy at an excitation wavelength to the region of interest
to
produce first and second fluorescence signals at a relative maxima and
minima of the emission spectra of the fluorophore.
[0024] When the quantification method Q, is based on a ratio on
relative maxima and minima of the absorption spectra, which is explained in
further detail below, the response to the marker concentration is non-linear
and reaches a plateau at higher concentrations, such that the concentration
range that can be detected is limited. However, the quantification method Q,
can be modified such that it has a linear response to marker concentration.
This can be achieved by modifying the quantification method Q, for use with
two markers with differences in absorption and/or emission spectra.
[0025] Accordingly, in another alternative embodiment of the method
100, the method is performed such that the quantification method results in a
linear response to fluorophore concentration. This embodiment requires the
use of two types of fluorophores including a target fluorophore and a
reference fluorophore in the region of interest at step 102. In some cases,
the
target and/or reference fluorophores can be naturally occurring in the region
of interest. In other instances, the target and/or reference fluorophores are
added to the region of interest. The selection of the target fluorophore is
based on the information desired and is expected to vary in concentration
CA 02662893 2009-03-06
WO 2008/028298 PCT/CA2007/001581
-11-
throughout the region of interest with a parameter of interest, while the
reference fluorophore is expected to remain nearly uniformly distributed
throughout the region of interest and act as a reference to which the target
fluorophore is compared. Alternatively, there can be other instances in which
the concentration of the target fluorophores is constant, but the fluorescence
of the target fluorophores changes due to quenching and unquenching of the
fluorescence of the target fluorophores. The target and reference marker
fluorophores can be of any form, for example non-targeting, passively
targeting, actively targeting, unconjugated, or conjugated to a single or
multiple targeting moiety.
[0026] At step 104, two excitation signals at two different wavelengths
Xex1 and kex2 respectively are provided to the region of interest. Step 106
involves the measurement of fluorescence signals Ftar(1\exl,,kem1) and
Fret(Aex2,Aem2) at emission wavelengths Xem1 and Xem2 from the target
fluorophore and the reference fluorophore respectively. Step 106 also
involves the measurement of the reflectance signals R(Aexi) and R(Aex2) at the
excitation wavelengths Xex1 and 4x2 respectively.
[0027] At step 108, the quantification of the fluorescence from the
target fluorophore is with respect to the reflectance at the excitation
wavelength used with the target fluorophore, i.e. Ftar(Aexl,/\em1)/R(Aex1),
and the
quantification of the fluorescence from the reference fluorophore is with
respect to the reflectance at the excitation wavelength used with the
reference
fluorophore, i.e. Fref(,\ex2,,kem2)/R(1\ex2). The ratio at step 110 is then
calculated
according to equation 3 by dividing the quantified target fluorescence by the
quantified reference fluorescence in the event that the absorption and
emission spectra of the target and reference fluorophores are different.
^3 = Frur`~exl~em1J R(Xex2) /3)
~/ R(~ex1) Fref(Xex2,Xem2)
`
[0028] In an alternative, the emission spectra for the target and
reference fluorophores can be similar, but the absorption spectra can be
different in which case the fluorescence signals are measured as
Ftar(kexl,4m1)
CA 02662893 2009-03-06
WO 2008/028298 PCT/CA2007/001581
-12-
and Fref(Aex2,'\em1) at wavelength 4m1, quantified as they were previously and
the ratio is calculated according to equation 3'.
Q 1 = Ftar`~exl~eml) R\Xex2/ (3~)
~ R`Lexl) Fref (Xex2+Xem1)
[0029] In another alternative, the absorption spectra for the target and
reference fluorophores can be similar, but the emission spectra can be
different in which case the fluorescence signals are measured as
Ffar(Aexl,Aem1)
and Fref(Aex1,Aem2) at wavelengths Xem1 and Xem2 and the ratio is calculated
according to equation 3". In this case, the reflectance signals do not have to
be measured since they are with respect to the same excitation wavelength
and will cancel out during the calculation of the ratio.
Q' _ Ftar(),exl+Xem1/ /3~~)
3 r l \
Fref \ Xexl 9 Xem 2 /
[0030] The various quantification methods Q3 are dependent on
variations in autofluorescence of the region of interest, however, this can
also
be dealt with in an alternative embodiment of the method 100. This
alternative embodiment involves the introduction of two types of fluorophores,
a target fluorophore and a reference fluorophore, to the region of interest at
step 102 as was described for quantification method Q3. Similarly, steps 104
and 106 are conducted as described for quantification method Q3. However,
step 106 also involves obtaining separate control measurements to be taken
for both the target and reference fluorophores. The control measurements
R1(cfar=0) and (32(cref=o), are taken prior to the administration of the
fluorophores
to the region of interest or in a region with negligible dual fluorophore
uptake
such that the concentrations of the target and reference fluorophores, Cfar
and
Cref, respectively are zero or negligible. The control measurements are
defined in equation 4a.
P_ Far \Xex17 Xeml / and 0_ Fref \~ex2 9 ~em2 / (4a)
1(C1a.&C.et=o) F~Xex2 ~ Xeml ) 2(~~a,&~,f-o) Fr(i1exl ~ aem2 )
tar ef
CA 02662893 2009-03-06
WO 2008/028298 PCT/CA2007/001581
-13-
[0031] At step 108, prior to quantifying the measured fluorescence
signals with the measured reflectance signals, the control measurements are
subtracted from the measured fluorescence signals. At step 110, the ratio is
calculated as defined in equation 4b for the case in which the absorption and
emission spectra of the target and reference fluorophores are different.
n4 _ Ftar(Aexl~)em1J-~"1Ftar(Xex29 )em1/ , R(Xex2) (4b)
5~ R( Xexl ) Fref ( kx2 dem 2 / - P2Fref ( kex1 1Xem 2 )
[0032] In an alternative, the emission spectra are similar for the target
and reference fluorophores, but the absorption spectra are different. In this
case, the fluorescence signals are measured as Ftar(Aexl,Aem1) and
Fref(,\ex2,Aem1) at emission wavelength Xem1, and the control measurements are
taken according to equation 4a'. The control measurements are then
subtracted from the measured fluorescence signals and quantified as they
were previously and the ratio is calculated according to equation 4b'.
Ftar(Xexl9Xem1) Fref(Xexl9 Xeml) (4a')
~3(C,a,&C,f=o) - Ftar(~ X) and ~4(C~a.&~.f=o) - F (~ex2X ex2+ eml ref ~ eml
~4 = Ftar(kexl~~'em1) -N3Ftar(Xex2+kem1) R(a'ex2)
(4b')
R( Lexl / Fref `Aexl 5~eml J - I" 4 Fref ( Aex2 l~eml ) [0033] In another
alternative, the absorption spectra are similar for the
target and reference fluorophores, but the emission spectra are different. In
this case, the fluorescence signals are measured as Ftar(/\exl,Aem1) and
Fref(Aex1,Aem2) at wavelengths Xm1 and Xem2, and the control measurements are
taken according to equation 4a". The control measurements are then
subtracted from the measured fluorescence signals and quantified as they
were previously and the ratio is calculated according to equation 4b".
Ftar(Xexl9~em1) and - Fref(~exl9 Xem2) 4a"
NS(C,o,&C, f=0 ~6(C,o,&C, f=0) ( )
Ftar ( Xexl 1Xem 2 ) Fref ( Xex1 9km1 )
CA 02662893 2009-03-06
WO 2008/028298 PCT/CA2007/001581
-14-
~j' _ Ftar\Xexl9Aem1/- 1"5Ftar\Xex19Xem2/ (4b")
L~ a r l /~ r l
Fref \ ~exl I ~em 2 / - I" 6Fref \ kxl 9 )~ eml /
[0034] In another alternative embodiment of the method 100, the
method can be performed such that more than one characteristic of the region
of interest may be investigated. In this case, step 102 involves the selection
of three types of fluorophores. Two of these types of fluorophores are target
fluorophores based on the information desired and are expected to vary in
concentration throughout the region of interest while the other type of
fluorophore is a reference fluorophore expected to remain nearly uniformly
distributed throughout the region of interest and acts as a reference to which
the target fluorophores are compared. Alternatively, the target fluorophores
can have a constant concentration and their fluorescence can be varied by
quenching or unquenching as explained previously. Step 104 involves
providing excitation at three wavelengths and step 106 involves measuring or
obtaining the fluorescence and reflectance signals from each of the types of
fluorophores. Step 108 then involves dividing the fluorescence signals for
both target fluorophores by the corresponding reflectance signals and step
110 involves calculating two ratios, one for each target fluorophore, as
defined
in equations 5a and 5b for the case in which the absorption and emission
spectra of the target fluorophores and the reference fluorophore are
different.
For N different target fluorophores, one can compute N corrected
fluorescence images.
Qtarl - Ftarl\XexlI 2em1/ R\,~ex2J (5a)
R`,kexl/ Fref1\kx21 k m2/
Qtar2 = Ftar2('kex3+)'em3/ . R\Aex2/ (5b)
R`Xex3J Fref1(Xex29Xem2)
[0035] This alternative method can be varied by using two target
fluorophores and two reference fluorophores. Step 104 involves providing
excitation at four wavelengths and step 106 involves measuring the
fluorescence and reflectance signals from each of the types of fluorophores.
CA 02662893 2009-03-06
WO 2008/028298 PCT/CA2007/001581
-15-
Step 108 then involves dividing the fluorescence signals for both target
fluorophores by the corresponding reflectance signals and step 110 involves
calculating two ratios, one for each target fluorophore, as defined in
equations
5a' and 5b' for the case in which the absorption and emission spectra of the
target fluorophores and the reference fluorophore are different.
_ Ftar1 `XexVXem1 / R`Xex2 ) (5a')
Qtarl
Rr \ l
Xex1l / Frefl r `kx2l km2/
Qtar2' = Ftar2\;~ex3lkm3/ . R\~ex4J (5b')
R\Xex3/ Fref2(Xex4+)L'em4
[0036] It will be appreciated by one of ordinary skill in the art that there
can be other variations of the methods outlined above. For instance, the
fluorescence and reflectance signals may be measured in sequence or
simultaneously, depending on the emission wavelengths. For instance, if
excitation at two different wavelengths provides emission at the same
wavelength, then excitation at one of the wavelengths is done followed by
measurement at the emission wavelength, and when emission has sufficiently
subsided, excitation at the other wavelength can be done followed by
measurement at the same emission wavelength. In another alternative, it can
be possible to introduce a very high number of targeted fluorophores into the
region of interest, along with any reference fluorophores as required, in
order
to monitor several different characteristics. Also by way of example, there
may be times when certain ratios are more useful than others and the user
may wish to have different results displayed as circumstances change.
[0037] In addition, it should be noted that for the methods that use a
single type of fluorophore, the contrast in the final image will be maximized
when one excitation wavelength corresponds with the absorption maximum of
the fluorophore while the other excitation wavelength corresponds with the
absorption minimum of the fluorophore. That being said, methods Ql, Q2 and
Q4 can be done by using off-maxima excitation or off-minima excitation in
which there may be some degradation in the final results but the performance
CA 02662893 2009-03-06
WO 2008/028298 PCT/CA2007/001581
-16-
is still better than that which can be achieved using conventional techniques.
Accordingly, the excitation wavelengths for Xex, and Xex2 used for methods Ql,
Q2 and Qa can correspond to a relative absorption maximum and a relative
absorption minimum of the fluorophore, such that there is enough of a
difference in absorption for the fluorophore at the different excitation
wavelengths that are used to provide good image correction results. In other
words, a first wavelength can be selected from a range that includes the
wavelength at which maximum absorption occurs, i.e. selected from a band
that includes the wavelength for maximum absorption, and then the second
wavelength can be selected from a range that includes the wavelength at
which minimum absorption occurs. In this way, the wavelengths at which
maximum and minimum absorption occurs may not be exactly selected but
the wavelengths are selected such that there is enough of a difference in the
resulting fluorescence signals so that the corrected image will be useful
although it the results may not be optimal.
[0038] It should also be noted that for the excitation and emission
wavelengths described herein, energy at these wavelengths can be provided
or measured in a broadband or a narrowband (including just the wavelength
of interest) fashion. In addition, the reflectance signal can be a narrowband
signal or it can be a broadband reflectance including white light reflection.
[0039] It should also be noted that useful information and correction
can be obtained by inverting the ratios used for the final calculation in each
of
the quantification methods.
[0040] It should also be noted that these different methods can also be
used with luminescence and/or fluorescence standards, to further improve
quantification by minimizing day-to-day and experiment-to-experiment intra-
device variation and by minimizing inter-device variations through cross
calibrations. Examples of such standards are Anthracene, Napthalene, p-
Terphenyl, Tetraphenylbutadiene, Compound 601, Rhodamine B, SRM 1932 -
Fluorescein Solution (NIST), and SRM 936a - Quinine Sulfate Dihydrate
(NIST). Another example of the use of these methods with a fluorescent
CA 02662893 2009-03-06
WO 2008/028298 PCT/CA2007/001581
-17-
standard is during surgical image guided resection in which the standard can
be placed in the surgical cavity to further aid quantification.
[0041] In usage with a standard, a calibration measurement of a
fluorescent crystal can first be taken, prior to any experimental
measurements. For instance, a fluorescent crystal sphere (e.g. ruby sphere)
of approximately 1 mm diameter can be mounted on a thin rod. This sphere
can be characterized by measuring the fluorescence intensity versus distance
to a photodetector. This can then be used as an intraoperative standard that
can be placed in the surgical cavity, since at a known distance this gives a
known fluorescence without dependencies on geometry, autofluorescence,
tissue optical properties, etc. This, for example, can demonstrate the
degradation of any light sources or detectors that are used.
[0042] Referring now to Figure 2, shown therein is a schematic
representation of an exemplary embodiment of a fluorescence imaging
system 200 that can be used to carry out the acquisition and quantification of
fluorescence signals from a region of interest. The system 200 enables the
acquisition of an image processed by the various aforementioned methods
described previously. As such the system 200 generally comprises optical
means allowing for the acquisition of fluorescence and reflectance signals at
multiple wavelengths as required. The acquisition rate of the system 200 is
generally high enough to provide real-time imaging; for example, image
acquisition rates on the order of 30 frames per second can be achieved.
[0043] The system 200 comprises a synchronization unit 202, a light
source unit 204, a delivery module 206, a receiving module 208, a detection
unit 210, a data processing unit 212 and a display 214. It will be appreciated
by one of ordinary skill in the art that there are many possible ways to
implement the system 200. Each component can be implemented and
interconnected in a variety of ways, which can be selected based on the
desired application for the system 200 as well as the equipment and
resources available. These components are now described and an
CA 02662893 2009-03-06
WO 2008/028298 PCT/CA2007/001581
-18-
exemplary prototype system is described in further detail below in conjunction
with experimental results.
[0044] A timing signal is sent from the synchronization unit 202 to the
light source unit 204 for creating the required signals. An additional timing
signal is sent to the detection unit 212, which then prepares to receive
measured signals including fluorescence and reflectance signals, depending
on the particular quantification method that is used. One or more excitation
signals are sent to the delivery module 206 to be delivered to the region of
interest of an object 216 that is being imaged. The region of interest then
generates fluorescence and reflectance signals, which are transmitted to the
detection unit 210 via the receiving module 208. The detection unit 210
transduces and measures the fluorescence and reflectance signals,
depending on the quantification method that is used. The detection unit 210
then transmits the measured signals to the data processing unit 212, where
the measured signals are processed according to one of the aforementioned
methods described herein. The data processing unit 212 also receives a
timing signal from the synchronization unit 202 to synchronize operation with
the other components of the system 200.
[0045] The synchronization unit 202 is any device capable of
synchronizing the operation of the light source and detection units so that
the
timing of the generation of the excitation signals as well as the measurement
and processing of the fluorescence and reflectance signals generated by each
excitation signal can be timed properly. In alternative embodiments, the
synchronization unit 202 does not have to be used since one of units 204, 210
and 212 can each provide a master synchronization signal to which the other
components of the system 200 can be operated as slaves as required.
[0046] The light source unit 204 includes one or more light sources,
and optionally additional components, for generating one or more excitation
signals that include energy at one or more excitation wavelengths as required
by the particular fluorophore or fluorophores that have been delivered to the
region of interest as well as for generating at least one reflectance signal
from
CA 02662893 2009-03-06
WO 2008/028298 PCT/CA2007/001581
-19-
the region of interest when needed. Accordingly, the light source unit 204
provides single or multi-wavelength excitation. For example, the light source
unit 204 can include a lamp positioned behind a fast rotating filter wheel
with
different excitation filters (elements not shown). The type of lamp and
excitation filters that are used are selected to provide excitation at the
proper
wavelengths or bands based on the fluorophores that are used as well as to
get the resulting reflectance signals when needed, according to the
aforementioned methods described herein. The light source unit 204 also
leaks a small fraction (approximately 10-3 to 10-4) of light at the excitation
wavelengths for the measurement of the reflectance used in the ratiometric
measurements. The light source unit 204 can also illuminate the region of
interest by providing white light for example so that white light images can
be
taken as is described in more detail below. The excitation is performed such
that it is synchronized to the output frequency of the detection unit 210 or
vice-versa. For example, the filter wheel can be synchronized to the detection
unit 210 such that every frame of data measured by the detection unit 210
can correspond with a different excitation filter at a desired rate, such as
30
frames per second, for example.
[0047] The delivery and receiving modules 206 and 208 are capable of
transmitting the excitation light signals from the light source unit 204 to
the
object 208 being imaged and transmitting the resulting fluorescence and
reflectance signals from the object 208 to the detector unit 210 respectively.
The delivery and receiving modules 206 and 208 can be fiber optic bundles or
other suitable light guides. While not strictly necessary to the functionality
of
the system 200, the delivery and receiving modules 206 and 208 are helpful
in certain medical applications since the region of interest is often inside a
patient in which case bringing the light source unit 204 and the detector unit
210 directly to the region of interest may be impractical under certain
circumstances. In certain medical applications, the delivery and receiving
modules 206 and 208 can be combined into a single instrument, such as a
laparoscope or an endoscope.
CA 02662893 2009-03-06
WO 2008/028298 PCT/CA2007/001581
-20-
[0048] The detection unit 210 generally includes spectral separation
and detection components that are capable of separating light provided by the
receiving module 208 into different spectral wavelength bands and
subsequently detecting and/or measuring the light in these spectral
wavelength bands. The spectral wavelength bands correspond to the
emission and reflectance wavelength measurements of the fluorophores that
are used in the region of interest according to one of the aforementioned
methods described herein.
[0049] The spectral separation components can be implemented in a
variety of ways and generally include, but are not limited to, single or
multiple
prisms with or without dichroic coatings, single or multiple gratings, single
or
multiple filter wheels or other filter switching mechanisms, an RGB mosaic
filter or a tunable filter (e.g. liquid, crystal, acousto-optical, Fabry-
Perot) or
combinations thereof where appropriate. The implementation of the spectral
separation components is such that the measured light signals are isolated or
narrowed to a spectral band of appropriate size to capture the emission and
reflectance signals that are being measured. For example, a detection band
can range from 30 to 50 nm Full Width at Half Maximum (FWHM), but
depending on the circumstances could be anywhere from 1 to 100 nm FWHM,
or broader.
[0050] The detection components can also be implemented in a variety
of ways, and generally include but are not limited to photomultiplier tubes,
charge coupled devices (i.e. CCD, EMCCD, ICCD), photodiodes, CMOS
detectors, a CCD camera, or other suitable photo detectors arranged in such
a way as to provide two-dimensional image information for the spectral band
of interest.
[0051] Based on the variety of spectral separation and detection
components, the detection unit 210 can be implemented in a variety of ways.
For instance, in one exemplary implementation, the spectral separation
components include 3 prisms with dichroic mirrors, which separate the
incoming light into 3 different wavelength bands: red, green and blue. Each
CA 02662893 2009-03-06
WO 2008/028298 PCT/CA2007/001581
-21 -
wavelength band is detected with a photo detector such as a charge coupled
device (CCD) creating red, green and blue image frames. The color of each
of these frames corresponds to a wavelength that is being measured
according to one of the aforementioned quantification methods described
herein. If more than three measurements are required than additional
spectral separator and detection components can be added as required.
[0052] In another exemplary implementation, the detection unit 210
includes multiple photosensitive layers to separate light into different
spectral
wavelength bands and a light detector, such as a CMOS detector, is used to
detect the light in these spectral wavelength bands. For example, 3
photosensitive layers can be used to separate the incoming light into 3
different wavelength bands: red, green and blue to allow for the creation of
red, green and blue image frames. If more than three measurements are
required than additional spectral separator and detection components can be
added as required. For instance, N layers are needed for N wavelength
bands.
[0053] If image processing speed is important, ideally one wants to
collect all signals simultaneously as fast acquisition leads to faster
processing
of the final image. As an example looking at method Ql, four signals are
needed with 2 different excitation wavelengths. One option is to collect these
signals with a single CCD and a filter wheel such that one collects 4 images
sequentially. If each image acquisition takes 1 second the total time required
is 4 seconds. Alternatively, one could design optics that focuses all 4
signals
at a single CCD and the acquisition time has decreased to 1 second.
Similarly, one can use 4 CCD detectors in parallel and have an acquisition
time of 1 second.
[0054] For example, when using the method Q3 in case that the
emission spectra are similar, but the absorption spectra are different, the
filter
wheel in the light source unit switches to a position ex1 and the generated
fluorescence signal (Fexi,emi) in the red wave band is detected by the red
channel of a 3 CCD camera. The blue reflectance signal (Rexi) is measured
CA 02662893 2009-03-06
WO 2008/028298 PCT/CA2007/001581
-22-
in parallel in the blue channel. This takes about 30 ms. Subsequently, the
filter wheel changes to a position ex2 to provide a different excitation
signal, a
fluorescence signal is generated (FeX2,emi) at the same red wavelength in the
red channel of the 3 CCD camera, but at a different yield, and the blue
reflectance signal (Rex2) is measured on the blue channel, which takes about
another 30 ms.
[0055] One of ordinary skill in the art will understand that the choice of
spectral separation and detection components depends on the information
sought, the nature of the object of interest, the equipment available and any
other resources available. A person of ordinary skill in the art will be able
to
choose the proper spectral separation and detection components based on
the particular circumstances.
[0056] The data processing unit 212 is any device capable of receiving
the raw image data streams, and processing the raw image data according to
at least one the aforementioned methods described herein to generate the
final image. Accordingly, the data processing unit 212 can perform
mathematical and image processing functions as needed by these
aforementioned methods, in which these functions include at least one of
subtraction, addition, multiplication, division, and superimposing or
overlaying.
[0057] The data processing unit 212 can be a processor, or a personal
computer for example that executes computer software code for performing at
least one of the fluorescence quantification methods described herein.
Alternatively, the data processing unit 212 can be implemented with at least
one of an Application Specific Integrated Circuit (ASIC) or a Digital Signal
Processor (DSP) to perform the fluorescence quantification methods
described herein. The data processing unit 212 can also generate white light
images of the region of interest in concert with the other components of the
system 200. In at least some implementations, the data processing unit 212
can generate final images at a rate of 30 frames per second. In some
embodiments, the synchronization unit 202, the data processing unit 212 and
possibly the display 214 can be implemented with a personal computer.
CA 02662893 2009-03-06
WO 2008/028298 PCT/CA2007/001581
-23-
[0058] In an alternative, while performing any one of the
aforementioned methods described herein, the data processing unit 212 can
also augment the color images received from the detection unit 210 to
improve contrast between normal and tumour tissue. For example, when
processing Red, Green, and Blue (i.e. RGB) images to produce the final
image, the data processing unit 212 can augment or attenuate at least one of
these images depending on the spectral band that exhibits the highest
contrast between normal to tumour tissue. The data processing unit 212 can
integrate the dual excitation and RGB color components into a real time
composite video that can be tailored to enhance any number of fluorophores.
Accordingly, the system 200 can be customizable for a large array of surgical
applications.
[0059] A general problem with fluorescence correction methods is that
the structural or anatomical information is mostly lost. This is problematic
when the images are used to image a biopsy or a tumor resection at various
times during the procedure. To alleviate this problem, the data processing
unit 212 can superimpose or overlay the image obtained through application
of these methods over top of another image, and display both images
concurrently. For instance, the data processing unit 212 can superimpose or
overlay the corrected fluorescence images on the raw fluorescence images or
white light images, to provide both structural information for orientation,
which
can be used for surgical guidance, as well as functional information. This can
be done in real-time (i.e. at 30 frames/sec).
[0060] In addition, prior to overlaying the corrected image on the raw
fluorescence image or a white light image, the corrected image can be
processed such that an area of interest (e.g. hotspot) remains, but the
surrounding pixels are set to an intensity of zero. This then results in a
white
light or raw fluorescence image with an overlayed quantitative hotspot
according to one of the aforementioned methods described herein.
[0061] A modeling study was conducted to demonstrate the
performance of the various aforementioned methods described herein. The
CA 02662893 2009-03-06
WO 2008/028298 PCT/CA2007/001581
-24-
correction performance of these methods was evaluated by describing the
method analytically using mathematical descriptions for florescence emission
from turbid media, defining standard input parameters and introducing
variations around these standard values. In this modeling study, one
parameter was varied at a time, with the other parameters fixed at their
standard value. As a measure of the quantification or correction performance,
a factor CP was defined as the change in the corrected signal due to the
introduced variations relative to a signal with standard input parameters. A
Signal Change index SCparameter was calculated as the maximum divided by
the minimum correction performance and the total signal change SCroral was
defined as the product of the signal changes due to the individual parameters,
at fixed target fluorophore concentration. A value of 1.50 for SCrora, can be
interpreted as a variation in output signal of less than 25%.
[0062] The fluorescence and diffuse reflectance are represented by
F(Ae,,Aen,) and R(AeX) in mW/cm2, where a, and Aem stand for the excitation
and emission wavelengths in nm, respectively as summarized in Table 1. The
raw fluorescence signal QRa,,, uses a single excitation wavelength in the
Ultra
Violet (UV) to blue light range and a second single emission wavelength in the
far red to Near-InfraRed (NIR) range and is defined in equation 6.
QRaw = F'~~ex>>Xeml) (6)
The quantification method Q,, defined previously in equation 1, employed the
first excitation wavelength at an absorption maximum of the fluorescent
marker (a red fluorescent marker) and the second excitation wavelength at an
absorption minimum of the fluorescent marker.
CA 02662893 2009-03-06
WO 2008/028298 PCT/CA2007/001581
-25-
TABLE 1: Chosen excitation and emission wavelengths
Method Marker AeX1 Aex2 Aem1
QRaw PpIX 406 630
Qi PpIX 406 436 630
Q2 PC4 686 650 710
Q3 Duall 620 700
Q3 DuaI2 730 800
Q4 Duall 620 640 700
Q4 DuaI2 730 750 800
[0063] Protoporhyrin IX (PpIX) was used as the model fluorescent
marker. It will be appreciated that other fluorescent markers can be used.
The excitation and emission spectra are shown in Figures 3A-3C. Figures
3A-3C show, respectively, a schematic representation of the excitation (grey
line) and emission (black line) spectra of tissues containing the fluorophore
Protoporhyrin IX (PpIX), Phthalocyanine 4 (PC4) and a Dual fluorescent
marker (DM). The dashed line shows the tissue auto fluorescence. Both the
PpIX fluorescence and the tissue autofluorescence, were based on previous
measurements in human subjects (Wilson BC, Weersink RA, and Lilge L
(2003), Fluorescence in Photodynamic Therapy Dosimetry, In Handbook of
biomedical fluorescence. M. Mycek and B.W. Pogue, Eds. Marcel Dekker,
Inc., New York. pp. 529-561).
[0064] The fluorescence and diffuse reflectance at the tissue surface
were described by analytical solutions to the diffusion equation as shown in
equations 7a-7c. These formalisms used here are valid for excitation in the
entire UV-NIR wavelength range and have been validated and demonstrated
accuracy similar to Monte Carlo modeling (Farrell TJ and Patterson MS
(2003), Diffusion modeling of fluorescence in tissue, In Handbook of
biomedical fluorescence, M. Mycek and B.W. Pogue, Eds. Marcel Dekker,
Inc., New York. pp. 29-60).
R(~eJ = nY[V + W ] (7a)
F(~eX,~e,,,)=ilY[X+Y+Z] (7b)
CA 02662893 2009-03-06
WO 2008/028298 PCT/CA2007/001581
-26-
1(~ ) 1
s
V=-W 1+1.82D(~ 7~eX e ex ff(~l ) .'(~ex)ex
1+1.82D(a.eX) eff(Aex)' w D(~ex~ ',2 etr2
(~eX~
x -Y1+1.82D(Xe,j eff (,~ej _Z 1+1.82D(,kem) ,'(Xe,j (7c)
1 + 1.82D( ~em ) eff ( Aem ) 1 + 1.82D( Aem ) eff ( Aem )
Y---V[CmM(A, Aem)+CaZ_[W +1(Xej][CmM(Ae,Xej +CaA(~ex~em~~
D(Aem)[ effzp.ej - effz(Xem)] ' tte,ff2(Aem/,
[0065] The dimensionless functions, y and -7 represent the influence of
geometry on the excitation irradiance and the collection efficiency of the
photo
detector, respectively. The parameters Cm and Ca represent the fluorophore
and autofluorophore concentrations [M] respectively, with fluorescence yields,
M(AeX,Aem) and A(A,,Aem) [cm"'.M"'], respectively. The excitation irradiance
is
given by I(Ae,) [mW/m2]. The parameter D(A) is the optical diffusion
coefficient, D(),)= [3 't (A)rl , where p't(A) [cm"'] is given by
'p r W- 's W+ f~arota[(~)
The parameters N'S(A) is the reduced scattering
coefficient and iiat tal(A) is the absorption coefficient of the tissue
fluorophores
total (~) - atissue (Jluorophores (k)
(target plus auto), so that a \~'~ + a . The effective
attenuation coefficient Neff(A) is given by eff P )= ~3Ma totat 0')[ Q` ` t
(A) + 'S NI .
The absorption of the tissue was considered much larger than that of the
fluorescent marker plus the autofluorophores, i.e.
(Patissue)>Pamarker+autofluor) so
that Namarker+aut flu r was negligible in calculating D(A), N't(A) and
Neff(A).
[0066] The standard values for optical properties of biological tissues
were determined using the model by Svaasand et al. (Svaasand LO, Norvang
LT, Fiskerstrand EJ, Stopps EKS, Berrns MW, and Nelson JS (1995), Tissue
parameters determining the visual appearance of normal skin and port-wine
stain, Lasers in Med Sci., 10, pp. 55-65). According to this reference, the
parameters that dominate absorption of human skin in the visible to near-
infrared wavelength range are blood volume, blood oxygenation and melanin
content.
CA 02662893 2009-03-06
WO 2008/028298 PCT/CA2007/001581
-27-
[0067] Since most tissues other than skin contain no melanin, the
model was modified by decreasing the melanin content by a factor of 3 from
that of Caucasian skin (at 694 nm), so that it can be used to represent
unknown absorbers. This modified model produces optical properties that are
generally more representative of tissues that do not contain melanin (Cheong
W-F (1995), Appendix to chapter 8: Summary of optical properties, In Optical-
Thermal Response of Laser-Irradiated Tissue, A.J. Welch and M.J.C. van
Gemert, Eds. Plenum Press, New York, pp. 275-303) and at 630 nm, were in
the range of brain white matter (Yavari N, Dam JS, Antonsson J, Wardell K,
and Andersson-Engels S (2005), In vitro measurements of optical properties
of porcine brain using a novel compact device, Med Biol Eng Comput. 43, pp.
658-66). Figure 4 shows the modeled values for the absorption coefficient for
deoxygenated (grey line) and 90% oxygenated (St02) (solid line) blood, tissue
(dashed), and the reduced scattering coefficient of tissue (grey dashed). The
blood volume (B) is 2%.
[0068] The standard values for fluorescence yields M(Aex,Aem) and
A(Aex,Aem) are listed in Table 2. These were assumed constant. Their relative
magnitudes were estimated based on the excitation and emission spectra
shown in Figures 3A-3C.
TABLE 2: Modeled fluorescence yields used in the quantification methods.
Marker Aex, Aem [nm] M [a.u] A a.u]
PpIX 406, 630 16 2
436,630 4 1.8
PC4 656,710 4 0.2
686,710 16 0.18
DF 620,700 16 0.22
640,700 4 0.20
730,800 16 0.15
750, 800 4 0.13
[0069] The standard values for the remaining parameters and the
range over which they were varied are listed in Table 3. Listed values for the
CA 02662893 2009-03-06
WO 2008/028298 PCT/CA2007/001581
-28-
parameters I, y, rl and Ca were chosen rather arbitrarily, as literature
values
are not widely available, however ranges for B, StO2 and N'S span reported
values for normal and cancerous tissues (Bogaards A, Sterenborg HJCM, and
Wilson BC (2007), In vivo quantification of fluorescent molecular markers in
real-time: a review study to evaluate the performance of five existing
methods,
Photodiagnosis and Photodynamic Therapy, in press; van Veen RL,
Sterenborg HJ, Marinelli AW, and Menke-Pluymers M (2004), Intraoperatively
assessed optical properties of malignant and healthy breast tissue used to
determine the optimum wavelength of contrast for optical mammography, J
Biomed Opt. 9, pp. 1129-36; Cheong W-F (1995), Appendix to chapter 8:
Summary of optical properties, In Optical-Thermal Response of Laser-
Irradiated Tissue, A.J. Welch and M.J.C. van Gemert, Eds. Plenum Press,
New York, pp. 275-303).
TABLE 3: Standard values and ranges for parameters used in modeling
Parameter Standard Range Unit Reference
1 100 30-100 mWcm Bogaards et al.
y, n 1.0 0.3-1.0 r.u Bogaards et al.
Cm 0.01 Fixed M -
Ca 0.01 0.002-0.02 M Bogaards et al.
B 2 1-10 % vanVeenetal.
St02 90 30-90 % van Veen et al.
N'S 1.0 0.1-1.0 r.u. ICheong
[0070] Table 4 shows the results of the modeling study which include
the signal change due to variations in the individual parameters, SCparameter,
and the total signal change, SCtota,, for each quantification method and each
marker. The quantification method Q, demonstrated a quantification
performance of SCroral = 1.59, which can be interpreted as a variation in the
output signal of approximately less than 30%. This is an improvement of
more than 2 orders of magnitude as compared to the raw fluorescence (SDtotai
= 245). Also, the quantification method Q, allows less sensitive detectors
with
CA 02662893 2009-03-06
WO 2008/028298 PCT/CA2007/001581
-29-
a lower dynamic range to be employed as it measures diffuse reflectance
instead of autofluorescence.
[0071] In addition, the ratio used in the quantification method Q,
cancels out variations in irradiance, excitation geometry and collection
efficiency. A small fraction of autofluorescence plus a large fraction of
marker
fluorescence present in both numerator and denominator minimizes the
dependence on variations in autofluorescence. Correction for optical
properties is achieved by representing these equally in the numerator and
denominator by combining fluorescence and reflectance. To demonstrate the
effect of the reflectance term in the quantification method Ql, the
performance
was also modeled without it, which is referred to as Q2. The quantification
method Q2 also had a decreased performance (SCrora1 = 2.97) as compared to
Qi (SCtotai = 1.59) demonstrating that use of the reflectance term minimizes
the dependency on optical properties.
TABLE 4: Results of Modeling Study (Indep.: Independent by definition)
Method Marker Linear SCi SCce SCB SCsr02 SC S SCroral
QRaw PpIX Yes 3.33 1.22 4.47 1.07 1.14 245
Qi PpIX No Indep. 1.23 1.03 1.17 1.07 1.59
Q2 PpIX No Indep. 1.24 1.21 1.77 1.12 2.97
Qi PC4 No Indep. 1.08 1.01 1.01 1.02 1.12
Q3 Dual Yes Indep. 1.07 1.05 1.05 1.04 1.23
Q4 Dual Yes Indep. Indep. 1.02 1.05 1.04 1.11
[0072] The quantification method Q, can be used with markers that
absorb and emit in the NIR range such as phthalocyanine 4 (PC4). Due to
the decreased autofluorescence, blood absorption and scattering in the NIR,
the performance further improved to SCrorai = 1.12, as listed in Table 4.
[0073] Two markers are used, as per method Q3, with different
absorption and emission spectra conjugated to a single targeting moiety, as
shown in Figures 3A-3C. The fluorescence of one marker can vary to yield
functional disease information, whereas the fluorescence of a second marker
CA 02662893 2009-03-06
WO 2008/028298 PCT/CA2007/001581
-30-
is used as reference and assumed constant. For Q3, the performance is
SCrora1 = 1.23 as listed in Table 4 is in a similar range as compared to Q,
with
PC4, but has the additional advantage of a linear response to marker
concentration. When Q3 was modified as per method Q4, the performance
further improves to SCroral = 1.11.
[0074] It has been found that for fluorescence quantification with
optimum accuracy, the fluorescent layer can be exposed to the tissue surface
and should be thick relative to the penetration depth of light. Hence, UV/blue
excitation light can be used for quantification of fluorescence in small
lesions
of a few mm in depth whereas far red/NIR light excitation can be used for
thicker lesions. This is because the effective penetration depth of UV versus
NIR light changes from the sub-millimeter range to several millimeters.
[0075] A study was also conducted using a prototypical clinical version
of the fluorescence imaging system 200 on optical phantoms having different
optical properties as well as patients undergoing radical prostatectomy. The
light source unit 204 included a custom-made 300 Watt Xeon arc lamp
(Cermax, Perkin Elmer, US) and a filter wheel containing 2, 4 or 8 excitation
(or white light) filters. The synchronization unit 202 ensured that the filter
wheel spun at a frequency so that subsequent frames were excited or
illuminated with alternating wavelengths and were properly measured by the
detection unit 210. Excitation wavelengths that were used were 406 nm and
436 nm. The excitation irradiance was approximately 50 mW/cm2 at a typical
working distance of 2 cm. Alternatively, a broadband optical density filter
can
also be installed in the filter wheel to obtain a white light reflectance
image in
addition to a fluorescence image. A standard clinical Iaparoscope with a
liquid
light guide served as the delivery and receiving modules 206 and 208. A 3-
CCD compact surgical camera (DXC-C33, Sony, Canada) served as the
detection unit 210. Multi-spectral images were acquired using the blue, green
and red channels. The camera's sensitivity towards the NIR was extended by
replacing the standard NIR cut-off filter. The 3-CCD camera featured a frame
rate of 30 frames/sec (NTSC), 796 x 494 pixels and 8 bit dynamic range. A
CA 02662893 2009-03-06
WO 2008/028298 PCT/CA2007/001581
-31 -
long-pass 500 nm filter (Chroma, US) was also placed between the camera
and the laparoscope to leak a small fraction of the UV/blue excitation light
for
measurement of the diffuse reflectance. The long-pass filter was designed to
allows a small fraction of the excitation light to leak though while also
allowing
transmission of fluorescence signals. This filter allows for blue reflectance
measurements over a sufficiently wider wavelength range, such that it can
transmit the reflectance of multiple excitation wavelengths over a relatively
large bandwidth in the blue wavelength range. This provides improved
structural/anatomical information. A computer (Intel, Pentium 4) served as the
data processing unit 212. The digital video output from the 3-CCD camera
was captured by the computer and could be displayed on the monitors in the
operating room for visualization hence allowing surgical guidance. Image
processing was performed on the computer using LabVIEWTM software
(National Instruments, US).
[0076] Experimental performance evaluation was conducted in tissue
equivalent phantoms with lntralipid-20% as a scattering medium and Evans
Blue as an absorber. These were prepared with 3 different sets of Na and Ns
at 630 nm. Values are listed in Table 5 and fall within ranges used in the
modeling study. In these experiments, the parameters 1, y, and rl were held
constant. The marker PpIX (Sigma-Aldrich, Canada) was used as the single
fluorophore. Prior to use, the phantoms were shaken continuously for 72
hours to allow PpIX to bind to the lipids. The raw fluorescence and the signal
output of the quantification method Q, were determined over a PpIX
concentration range of 0.01 to 10 Ng/mI. The lower detection limit of the
marker PpIX was also investigated.
TABLE 5: Optical Phantom Properties at 630 nm
Phantom N'S Pa
cm"' cm"'
1 15 0.25
2 30 0.5
3 60 1
CA 02662893 2009-03-06
WO 2008/028298 PCT/CA2007/001581
-32-
[0077] It was observed that the raw fluorescence and data from the Q,
quantification method increased with increasing PpIX concentration as shown
in Figures 5A and 5B. The raw fluorescence signals shown in Figure 5A
demonstrate a large deviation in response signals between the 3 phantoms.
At a PpIX concentration of 1.25Ng/mg, the maximum difference between
phantom 1 and 3 is approximately 200%. Figure 5B shows the same dataset
as Figure 5A but corrected according to the quantification method Ql. It can
be seen that there is a decreased deviation between the response curves.
The deviation between the response curves has decreased in Figure 5B
compared to Figure 5A as the three separate curves have collapsed to one
universal response curve in Figure 5B. At a PpIX concentration of 1.25pg/mg,
the maximum difference decreased 10-fold to approximately 20%. At lower
PpIX concentrations a plateau was reached that was interpreted as the lower
detection limit, as indicated by the dashed lines in Figure 5A. This plateau
was not due to camera noise, but by the autofluorescence of the phantom, as
was confirmed by switching off the excitation light.
[0078] Clinical quantitative fluorescence imaging employing the
quantification method Q, was investigated for patients with prostate cancer
undergoing radical prostatectomy. Approval for this study was obtained from
the research ethics board of the University Health Network and patients
agreed to participation by signing a consent form. This study is ongoing and
to date 6 patients have been enrolled, hence the results obtained here are
preliminary in nature and serve the purpose only of demonstrating clinical
feasibility. To induce PpIX, 20 mg/kg of 5-aminolevulinic acid (ALA) was
administered orally in 50 mt of orange juice 5-6 hours prior to fluorescence
imaging. The preliminary clinical results showed that the system is capable of
detecting diffuse reflectance, autofluorescence, as well as marker
fluorescence and can compute and display the corrected fluorescence images
in real-time.
CA 02662893 2009-03-06
WO 2008/028298 PCT/CA2007/001581
-33-
[0079] Intraoperatively, the capsule of the prostate showed a green
autofluorescence with small amounts of diffusely reflected UV/blue excitation
light. Various areas with red fluorescence were found on the prostate capsule
and surgical bed. Figure 6A shows a white light image of the prostate capsule
with forceps around a nodule. Figure 6b shows the unprocessed, raw
fluorescence image showing small amounts of blue reflectance, green
autofluorescence of the prostate capsule and bright red fluorescence of the
nodule. Figure 6C shows the same fluorescence image, which has now made
quantitative through image processing according to method Ql. As can be
observed, most of the anatomical/structural information is lost. To alleviate
this problem this image is thresholded (blue = 0 intensity), as shown in
Figure
6D, and overlaid on the raw fluorescence image so that the resulting final
image, shown in Figure 6E, contains both structural/anatomical information as
well as functional quantitative information. The clinical prototypical
fluorescence imaging system was able to compute, display and store data
computed according to the method Q, in real time (30 frames/sec) without
dropping frames.
[0080] In another study, to further characterize the parameters and the
performance of the clinical prototypical version of the fluorescence imaging
system 200, a liquid phantom was prepared with methylene blue dye,
fluorescein and intralipid solution. The absorption and reduced scattering
coefficients were Na = 1.9 cm"' and Ns' = 8 cm-' at 635 nm respectively. These
optical properties were selected to be close to those found in the brain.
System sensitivity was measured using different PpIX concentrations in the
liquid phantom. For this, PpIX extract was added to the methylene blue-
Intralipid phantom at 1.25, 0.62, 0.31, 0.15, 0.075 and 0.039 pg/mL. At each
dilution, fluorescence images were taken at both of the dual excitation
wavelengths, denoted here as excitation wavelength N, and excitation
wavelength N+1. Images were taken at 1, 2, 3, 4, and 5 cm away from the
phantom surface, with the camera focused at the 3 cm working distance.
CA 02662893 2009-03-06
WO 2008/028298 PCT/CA2007/001581
-34-
[0081] The ratiometric method Q3 was used based on two excitations
and two emission wavelengths. The first excitation wavelength is in the
absorption peak of PpIX (k = 405 nm) and the emitted red fluorescence is
divided by diffusively reflected excitation light. Next, this first
fluorescence/reflectance ratio is divided by a second fluorescence/reflectance
ratio excited using a second excitation wavelength at a lower PpIX absorption
peak (k = 440 nm). In this case, the target fluorescence Ftar originates from
PpIX that is allowed to vary and the reference fluorescence Fref originates
from fiuorescein and is assumed constant. Images of each phantom were
taken, as well as an image of the phantom to provide a value for the
background signal. The red channel of the 3-chip CCD was plotted as a
function of base PpIX concentration.
[0082] To perform quantitative analysis on the in vivo images, a
rectangular region of interest (ROI) was drawn within the red fluorescing
lesion for each image. The red, green, and blue components were averaged
within each ROI. The resulting data set comprised of red, green, and blue
components for each of three images taken at each of the three ALA dose
levels. Figures 7A-7C show the PpIX fluorescence intensities, diffuse
reflectance and green fluorescence for kEXcl and %EXc2 in the tissue phantom.
Differences in red fluorescence intensity in response to the differences in
work
distances and PpIX concentration are clearly observed.
[0083] Employing the fluorescence ratio imaging method Q3 minimized
the differences in response at different working distances, resulting in a
universal curve which is linear to the PpIX concentration but is independent
of
the working distance, as shown in Figure 8. This demonstrates the ability of
this method to correct for variations in intensities and tissue properties and
the
sample geometry.
[0084] It should be noted that the quantification methods described
herein can be modified so it can be used for NIR excitation and detection of
phthalocyanine 4, and applied to novel dual-fluorescent markers. These
markers can be conjugated to various targeting moieties, provide a linear
CA 02662893 2009-03-06
WO 2008/028298 PCT/CA2007/001581
-35-
response to marker concentration and further minimize the dependence on
autofluorescence, as demonstrated through modeling.
[0085] It should also be noted that the various embodiments of the
methods and system described herein may be further generalized to perform
measurements, quantification and correction of luminescence signals
originating from any luminescent particles from a region of interest of an
object. For instance, a luminescence signal may be obtained instead of a
target fluorescence signal in methods Ql-Qq, if the luminescence signal is
known to vary with the parameter of interest in the region of interest.
Alternatively, a luminescence signal may be obtained instead of a reference
fluorescence signal in methods Q3-Q4, if the luminescence signal is known to
remain constant in the region of interest. In another alternative, a
luminescence signal may be obtained and used instead of a reflectance
signal, if it is known that the luminescence signal depends similarly on
optical
properties as the target or reference signal; in this last case, the target or
reference signal can be a fluorescence signal or more generally a
luminescence signal.
[0086] It should be noted that the methods described herein can be
used in the detection of diseases or progress of diseases, such as cancer, as
well as in the assessment of treatments. For example, detection of
fluorescence from a fluorophore coupled to a targeting molecule such as an
antibody can be used to detect the presence of a target such as a tumor. The
various methods described herein allow for improved detection of such
markers. For example, fluorescence imaging of the marker PpIX can provide
high resolution and high tissue-contrast images of tumour margins during
intraoperative procedures, and the quantified signal may be used to aid the
surgeon in determining at which point to stop or continue surgical resection.
[0087] The various methods described herein also provide for real-time
imaging of tissues. Also, the fluorescence images generated using the
methods described herein allow for the visualization of a region of interest
comprising the fluorophore without interference from other signals such as
CA 02662893 2009-03-06
WO 2008/028298 PCT/CA2007/001581
-36-
contribution from oxygen, autofluorescence and the like that would be
included in the raw (unprocessed) signal. Images obtained using the methods
described herein can also be superimposed on each other or on raw
fluorescence images to provide images with different types of information.
Thus, for example, functional information provided by the fluorophore can be
combined in this way with anatomical information provided in a raw
fluorescence image.
[0088] The various embodiments of the methods and systems
described herein can be used for the quantification of luminescence or
fluorescence. The various embodiments of the methods and systems
described herein can be used for at least one of imaging, spectroscopy and
interferometry purposes for various uses such as medical diagnosis including
cancer detection. In this regard, the various embodiments of the methods and
systems described herein can be applied in the operation of microscopes,
stereoscopes, endoscopes, bronchoscopes, cystoscopes, colposcopes,
laparoscopes, robotic arms, capsules or other detection devices that can be
inserted into the human body.
[0089] It will also be appreciated that the various embodiments of the
methods and systems described herein can be used in combination with at
least one of Magnetic Resonance Imaging (MRI), Computed Tomography
(CT) imaging or any other imaging technique as well as for surgical guidance
followed by at least one of photodynamic therapy, chemotherapy,
radiotherapy, or any other type of adjuvant therapies. The various
embodiments of the methods and systems described herein can also be used
in at least one of locating a specific site for PhotoDynamic Therapy (PDT),
monitoring PDT, performing PDT dosimetry and monitoring PDT response.
[0090] It should also be noted that the various embodiments of the
methods and systems described herein can be used in various in vivo
applications such as applications previously mentioned herein as well as real-
time image guided surgery for many types of surgery such as brain tumor
surgery, prostate cancer surgery, breast cancer surgery and other types of
CA 02662893 2009-03-06
WO 2008/028298 PCT/CA2007/001581
-37-
surgery. Other in vivo applications include functional tissue imaging,
measurement of gene and protein expression, quantification of genes and
proteins, small/large animal imaging, pH measurement, measurement of
fluorophore quenching and un-quenching, measurement of in vivo singlet
oxygen concentration and measurement of (fluorescent) photosensitizer
concentration in Photodynamic therapy.
[0091] It should also be noted that the various embodiments of the
methods and systems described herein can be used in various ex vivo
applications such as ex vivo measurement of fluorophores, ex vivo
quantification of fluorophores, quantification of fluorescence in tissue
samples,
biopsies, fresh cut tissues, and fixed tissues including tissue arrays and
micro
tissue arrays. Other ex vivo applications include any microscopy application
including confocal microscopes, which use a pinhole to achieve optical
sectioning to provide a quantitative, 3D view of the sample. Other
applications include applications in biochemistry such as immunofluorescence
and immunohistochemistry in tissue arrays and micro tissue arrays.
[0092] It should also be noted that the various embodiments of the
methods and systems described herein can be used in cytomics such as in
flow cytometry and fluorescence-activated cell-sorting. Other applications
include any application in DNA large-scale sequencing strategies, any
application in quantification of genes an proteins, any application to measure
gene and protein expression, applications in DNA sequencing, applications in
mRNA or gene expression profiling, applications in DNA micro arrays,
applications in Dye-terminator sequencing, and any application in Polymerase
Chain Reaction (PCR).
[0093] It should be understood that various modifications can be made
to the embodiments described and illustrated herein, without departing from
the embodiments, the general scope of which is defined in the appended
claims.