Note: Descriptions are shown in the official language in which they were submitted.
CA 02666894 2009-05-27
SYSTEM FOR CONDITION-BASED MAINTENANCE OF COMPLEX EQUIPMENT
AND STRUCTURES
Since deregulation of the electricity market in America's Northeast over the
last ten
years, the demands on existing generators have introduced new operating rules:
multiple daily starts and stops, spin-no-load availability and machines pushed
to their
limits when market prices are attractively high. In order to benefit from this
new
reality, the short-term advantages of pushing generators should not be
outweighed by
a reduction in the reliability or in the expected life of the equipment. The
traditional
model of time-based maintenance that was used when generators were employed
for
base load production is not well suited to the new strenuous conditions
because
degradation is expected to accelerate unless the mean time between maintenance
interventions is reduced. Clearly, the resulting increase in maintenance costs
is not a
desirable solution. To keep reliability at an acceptable level effectively,
the best option
is to migrate from time-based maintenance to condition-based maintenance
(CBM).
Unfortunately, this is easier said than done, because it requires a
significant change
in practice, in the sense that knowing the condition of a generator calls for
a variety of
results from different constantly available measurement tools. This
information then
needs to be logged, analyzed and displayed in order to have an appreciation of
not
only each generator, but also of a whole plant or even the entire fleet of
generators.
Over the last decade, several diagnostic platforms have been proposed as
integrated
systems or expert systems, stressing the need for improvement in maintenance
practices to make an efficient transition to CBM. The proposed approaches have
their
strengths, but none is entirely satisfying. There are many detailed case
studies
analyzing results from a single tool such as PD measurements or air gap
monitoring
systems. But one disappointing finding is that, over time, none of the systems
developed during the 1990s left a trail of successful case studies combining
measurement results and analysis from multiple tools. Moreover, some
diagnostic
applications disappeared entirely shortly after being introduced. One of the
conclusions drawn from this is that a good idea is not always viable. To
improve the
chances of long-term success of any system, its use and maintenance should be
as
simple as possible, because once the developers are out of the loop, if the
end-user
does not grasp the potential of the system to make his/her work easier, he/she
will not
use it. The choice of using a Web-based application in accordance with the
invention
addresses both these issues. First, direct access from computers anywhere
within the
utility will provide quick, straightforward information via a user-friendly
interface.
Second, any new data file, logged intervention or change in the application is
now
centralized on a main server and the information is constantly updated and
always
the same for everyone.
The need for such a system is probably even greater nowadays, as many
utilities are
facing the problem of losing experts with years of experience, who most of the
time
have gained sufficient background knowledge about their plants to keep
equipment
failure risk to a minimum. When those experts retire, most of their knowledge
will be
lost. Without a way to capture this wealth of information and face the change
from
traditional base-load operation of generators to a load-cycling operation mode
1
CA 02666894 2009-05-27
imposed by open-market rules, reduction of the reliability of generators
belongs to the
realm of the unknown. With the integrated diagnostic system according to the
invention, it will be easier to determine the rate of degradation of any
failure mode
and keep track of the condition of all machines. The system is also a perfect
training
bench for new engineers and technicians because it compiles what experts have
gathered during their careers. Once the personnel have learnt to use the
diagnostic
system, they can use it wherever they go because it is accessible from
anywhere in
the utility. In this way, the system alleviates the problems raised by
personnel
rotation. Once an employee gets to a new position, he/she can readily access
all
pertinent information about the condition of the generators in the new plant
and
should be better able to manage their maintenance.
Since optimization of the maintenance program is about cost-effectiveness,
there is
no point in building a diagnostic system more expensive than a time-based
maintenance program. One object of the invention is therefore to establish a
diagnostic strategy that limits the number of measurement points/tools used
for
generators in good condition and pay closer attention to those showing signs
of
deterioration. As will be presented below, this is possible with a judicious
combination
of on-line/off-line measurement tools.
In addition to the diagnostic strategy, another object is to design a global
approach
that attributes roles with identified tasks to every specialist and technician
involved
without increasing their workload. This can be done by reorganizing part of
the work
they are already doing.
One aspect of the invention is the development of the system using Web-based
technology and providing a user-friendly system that maintenance personnel can
use
to transfer new measurement data and consult past results. The system is more
than
just a centralized data bank of raw data: the core of the system includes the
logic to
analyze, aggregate and display condition indexes for each generator in a
simple
comprehensive form. Automation of this step provides large payback in data-
processing time, because one expert alone cannot measures, analyzes,
classifies
and provides an overall picture of a large number of generators. Moreover, to
keep all
this information updated is an impossible task for any individual or even for
an entire
department unless they rely on an automated diagnostic system such as the
system
according to the invention. Furthermore, it is almost impossible to remember
every
maintenance action and to correlate its impact on measurement results, yet
this
information is also a part of the equation that the maintenance specialist
needs to
consider in his/her diagnostic. Without a global centralized system, it is
very laborious
just to obtain all the information on any one generator whenever necessary.
By converting part of the knowledge of diagnostic specialists into the
diagnostic
system, at least a first classification of generators can be done, leaving the
few
specialists still around to work on a more detailed diagnostic of those
generators
requiring special attention. Typically, considering an annual generator
failure rate
around 1.5%, it can be assumed that the large majority of the units do not
require a
comprehensive diagnostic through a technical audit program. Since condition
based
maintenance relies on the interpretation of raw measurements, some of the
2
CA 02666894 2009-05-27
specialists' knowledge for each measurement tool used in the diagnostic is
encoded.
In addition, by fixing acceptable limits for each tool, interpretation
accessible to
anyone is achieved, whereas in the past it has often been only within the
reach of
specialists. Another difficulty overcome by the invention is to combine the
results from
different tests in order to generate a reliable diagnostic for any generator,
regardless
of the number and combination of diagnostic tools used. Finally, the system is
simple
and easy to use for anyone, even those with little knowledge about specific
diagnostic
results and their interpretation. At the same time, it provides detailed
results from
every diagnostic tool so that a specialist can go back to the raw data and
perform a
more detailed diagnostic than that made automatically.
The diagnostic can be implemented for slow degradation processes evolving over
years if not decades. For such degradation mechanisms, which concern most
failure
modes, there is no need to monitor parameters such as partial discharge (PD)
activity
every minute. The system can rely on periodic measurements performed every
year
or more, depending on the type of diagnostic tool.
The integrated diagnostic system provides two levels of information: general
easy-to-
understand information with overall generator classification and detailed
diagnostic of
every single unit. The combination of the two levels improves the diagnosis of
problematic generators and help specialists to decide where and when a more
detailed diagnostic may be necessary. At the same time, most generators
observed
to be in good condition in the system continue to operate with minimal
diagnostic
efforts. Thus, as maintenance budgets are optimized, the overall reliability
of the fleet
increases over time.
Perfect diagnosis of a generator is difficult or almost impossible because it
requires
many measurements coming from different combinations of diagnostic tools. In
addition, it should be pointed out that no single tool alone can provide an
overall view
of all components. Meanwhile, detailed evaluation is not necessary for
generators in
good condition, which represent the majority of the fleet. However, detailed
diagnostics could be necessary for specific generators to determine their
exact
condition and see if they are suitable for operation or if they require
corrective
maintenance. In order to optimize the maintenance and diagnostic efforts with
the
increasing need for generation, a three-level diagnostic strategy is proposed,
as
illustrated in Figure 1. It suggests that on-line diagnostic tools should be
deployed to
obtain an initial diagnostic of all generators, while maximizing their
availability.
Several tools can be contemplated for this Level-1 diagnostic, and those used
should
be selected for their capability to reveal a wide variety of problems. This
first line of
diagnostics may eventually be used for triggering the next two levels. The
diagnostic
tools of levels 1, 2 and 3 can therefore be selected so as to be
complementary. An
illustrative first selection for Level-1 can be PD (partial discharge) and
ozone
measurements, but other tools can also be used, e.g. air gap monitor or
temperature
measurements. Since large generators are often instrumented with PD couplers,
PD
measurement can be a logical choice. For smaller machines not equipped with PD
couplers, periodic ozone measurements can be used as the Level-1 diagnostic.
3
CA 02666894 2009-05-27
In the normal scheme, only generators showing abnormal readings require a
second-
level diagnostic. This level may consist mostly of off-line diagnostic tools,
which
require partial dismantling of the machine or at least a minimum downtime,
typically
less than half a day. Level-2 consists of tools such as
polarization/depolarization
current measurements, DC ramp test measurements and limited visual inspection.
The selection of the tests to be performed may depend on the results of the
first level.
If the second-level results confirm the potential risk stressed at Level-1 but
are
insufficient to ascertain and decide the course of action and the exact nature
of the
active failure mode, a third-level diagnostic may be necessary before putting
the
generator back on-line. This third level is more intrusive than the first two
and should
be limited to the few units where the two first levels were unable to provide
a
complete diagnostic. Tools and diagnostic techniques used in Level-3 can
include
detailed visual inspection, resistance measurements between the stator bar
semi-
conductive armor and ground, radial wedge tightness measurements, TVA
(Tennessee Valley Authority) probe or ELCID (Electromagnetic Core Imperfection
Detection) readings and many others. The tools can be selected based on the
analysis of the previous results. All of these tests/techniques require
substantial
dismantling of generator components such as fans, shrouds or air baffles, the
removal of few poles or the entire rotor. The detailed information gained from
these
results is of great value but is obtained at significant cost. This is why
Level-3
diagnostics should not be done on all generators, but limited to those singled
out by
levels I and 2 as requiring more input in order to determine the cause and the
solution so that the failure risk can be reduced to an acceptable level. This
does not
mean that when the opportunity arises, such as a change of runner, that the
three-
level sequence always needs to be respected. In fact, at any time, any
individual
diagnostic tool or technique can be used, and the results are considered by
the
system, which automatically provides an overall diagnostic for the generator
under
evaluation regardless of the tools used.
In addition to the strategy applied in the field and presented above, the
diagnostic
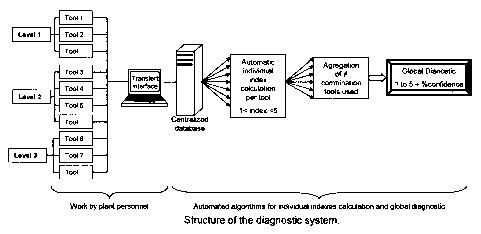
system itself can be structured as summarized in Figure 2. The first part of
the
process, seen on the left-hand side of the figure, pertains to data
collection. With the
system according to the invention, data can be collected and processed more
systematically, according to the three-level diagnostic strategy using
predefined tools.
Once measurements are made, everyone can directly access the integrated
diagnostic system through a simple interface designed to accept files from
every tool
and transfer them to a centralized database. This feature departs from
traditional
methods where the results were saved locally on PCs, in folders or on a shelf,
to be
later laboriously retrieved when it came time to perform the diagnosis of a
generator
while requiring specialist knowledge about all diagnostic tools in order to
come up
with a diagnostic. Even when all results were available, it was never a
straightforward
task to propose a diagnostic based on the results from several diagnostic
tools
because millivolts or picocoulombs from PD measurements cannot readily be
compared or combined with polarization index values or with evidence of
magnetic
core buckling.
4
CA 02666894 2009-05-27
To simplify analysis and aggregation of results, algorithms are implemented in
the
system in order to determine individual condition indexes for each of the
tools
selected. The rating of the results can be based on a 1 to 5 scale, from best
to worst,
for every measurement technique. An individual index of 5 for one tool does
not
necessarily translate into a short-term failure risk of a generator or one of
its
components but, when this flag comes up, the results can be further analyzed
by a
maintenance specialist. For instance, a high level of contamination in the end-
windings may give an individual index of 5 for the polarization current, but
cleaning of
the machine would most probably reduce this index to a lower acceptable value.
The
generation of individual indexes is based on sets of rules reproducing the
judgment of
the expert in this technical field.
The equilibrium between the three diagnostic levels in Figure 1 and their
ability to
cover the maximum of failure modes is preferably considered in the selection
of the
diagnostic tools. A selection of complementary instruments leading to a global
diagnostic of all major components of the generator can be considered. For
example,
on-line 2-D PD measurement (pulse repetition rate vs. magnitude) can be used
as the
first-level diagnostic. The second-level tool selected can be an instrument
measuring
polarization and depolarization currents (ITERG) from which the polarization
index
and insulation resistance can be extracted. Finally, the third-level
diagnostic tool can
be an instrument (BARTACT) measuring the resistance between the semi-
conductive
coating of stator bars and the stator core, which indicates whether the
electrical
contact between the coating of the bar and the core is good or not.
A modular approach makes the system easily expandable if more diagnostic tools
are
added later, for example:
= Level-1: Ozone measurements.
= Level-2: DC ramp test, limited visual inspection, Phase Resolved Partial
Discharge (PRPD) measurements.
= Level-3: Complete visual inspection.
The PRPD measurement is an on-line measurement which can be used when the
first-level diagnostic (2-D PD measurements) reveals a problem. Since the PRPD
is
more complex to measure and to analyze, it can be decided to not performing it
for
generators with low PD activity.
Since visual inspection can be done with limited or substantial dismantling,
it can be
considered either a Level-2 or a Level-3 tool. The system has a Web-based
interface
to log any observations made during a visual inspection. Subjective
information
collected from visual inspection is translated into an objective condition
index that can
be aggregated with those of the other tools.
The system can be summarized by the four groups of functions illustrated in
Figure 3:
Classification, Results, Trending and Documentation. Most of the information
is
accessible and easy for everyone to understand, but one section of the
application is
dedicated to maintenance specialists who need to access individual measurement
5
CA 02666894 2009-05-27
files to push their diagnostic further and plan the next actions (measurements
or
corrections).
Once the user enters the system application, he/she sees a two-part window
with a
tree on the left-hand side showing all the plants where diagnostic results
exist for at
least one tool. On the right is a global classification of all generators.
This information
is probably the most important for managers in charge of maximizing
generation,
while minimizing failure risks. Plant managers, however, are usually
interested in a
more limited classification related to only the units of their installation.
The system is
designed to easily display all the generators or different groups of
generators, as
summarized in the left-hand column in Figure 3. The global classification,
illustrated in
Figure 4, can show the entire distribution of all of the generators at once
(in the top
graph, each bar represents a generator) or a more spread-out representation
(bottom
graph) allowing identification of specific units. In this view, a scroll bar
allows the user
to slide the distribution from worst (global index > 4 shown in red) to the
best
generator (global index < 2 shown in green). With a single click in the tree
structure, it
is also possible to display a partial classification such as the one in Figure
5 for the 12
units of power plant "X". In this representation, the calculated diagnostic of
the
generators can be seen to go from a global condition index of 4.0 down to 1.2
for
generators with a similar number of operating hours and start/stop sequences.
Thus,
not all generators of this plant aged exactly alike. When the time comes to
replace
them, the decision of the sequence in which to do so, while minimizing the
failure risk,
is facilitated by this classification. Other types of grouping can also be
displayed to
compare the degradation of generators with thermosetting or thermoplastic
insulation,
generators from different manufacturers, etc. Finally, similar classifications
(global or
partial) are also available for every single tool.
The results displayed in Figures 4 and 5 are those of the global diagnostic
coming
from the aggregation of all diagnostic tools used over the years for a number
of
generators. Aggregation algorithms implemented in the system give a valid
global
diagnostic regardless of the number or the set of tools used in the
diagnostic.
However, similar to what a doctor would get from a medical diagnosis of a
patient, the
use of a few basic tools will give a first-level diagnostic (our Level-1), but
with levels of
confidence lower than if a large battery of tests is carried out. This is
reflected by the
calculation of a level of confidence that the global index corresponds to the
overall
condition of the generator. This confidence level is displayed by the lower
bars inside
each global index bar in the histograms of Figures 4 and 5. When the lower bar
goes
to the top of the entire bar, it means 100% confidence, whereas if the global
index bar
is only half-filled, it means 50% confidence. The more detailed the diagnosis
(more
tools and measurements over the years), the higher the confidence level. Thus,
it is
possible to know at a glance the global diagnostic of any generator and
whether one
can be confident with this information or not, stressing the need to call for
additional
measurements (levels 2 and 3). This need will be greater when the global index
is
higher. For good generators with low global indexes, only yearly measurements
of
Level-1 tools may be required, assuming the Level-1 diagnostic detects most of
the
problems affecting the generators.
6
CA 02666894 2009-05-27
When a generator has been identified as potentially at risk and the confidence
level is
low, a maintenance specialist may analyze the results from the individual
tools
contributing to the diagnostic and recommend further measurements or
corrective
actions. Based on the evidence, tools from levels 2 and 3 can be selected to
confirm
or invalidate the existence of suspected failure modes.
One major advantage of the system according to the invention is that it offers
a
platform for managers and maintenance engineers to communicate using common
facts (global indexes and individual tool indexes) about the condition of the
units. An
example of this is shown in Figure 6, where plant C is selected by clicking in
the tree
of the global classification interface (Figure 4) to reveal the global indexes
of the four
units. The right-hand side shows graphically the same information as that
appearing
in the tree (in Figure 6, "cote" represents the global index of the unit). In
plant C, it can
be seen that unit 1 is the worst with an index of 4.8 and a confidence level
of 21%,
whereas unit 2 is the best at 2.2 and 63%. The difference in confidence levels
stems
from the combination of tools used in the diagnostic, the number of
measurement
campaigns and the date of the last measurement (more recent measurements give
a
higher confidence than older ones). As time passes, the application
automatically
updates the confidence levels without human intervention. It is easy to see
that
managers do not need to be specialists in generator diagnostics to understand
this
information, which is accessible at any time directly from their personal
computer. Up
to this point, anyone, with no knowledge about interpretation of PD, ozone or
DC
ramp test measurements, for instance, can access the diagnostic. If a plant
manager
is more concerned about a specific generator, such as unit 1 in the example of
Figure
6, he can than call for help from a specialist if desired.
The next level of information is obtained by clicking directly on the unit
number in the
tree, which reveals the calculated individual index for each tool used in the
diagnostic,
as illustrated in Figure 7. Here the detailed results of unit 1 came only from
PD
measurements made with the PDAH, whereas the diagnostic of unit 2 was the
result
of the aggregation of five different tools (BARTACT, visual inspection, ITERG,
PDAH
and PRPD). This is why the confidence level of unit 1 (21 %) is lower than
that of unit
2 (63%).
The system has a measurement procedure for each tool and, when it is
respected,
the confidence level will be higher than when it is not or only partially
respected. For
instance, sometimes it is not possible to carry out an entire test for lack of
time or
accessibility. When the data from a tool is transferred, automatic routines
calculate
both the index and the confidence level according to predefined rules,
eliminating the
subjectivity in the process.
In the example of Figure 7, it can be seen for unit 2 that the confidence
level of the
different diagnostic tools ranges from 97% for the PDAH down to 47% for the
visual
inspection. The high confidence level for PD suggests that the measurements
were
done in accordance with prescriptions, and that the last measurement is
recent. The
lower confidence for the visual inspection may indicate that too few
components were
inspected or that the last inspection dates back too far. Up to this level,
all the
information is easy to understand and allows recognizing that unit 1 is
potentially in
7
CA 02666894 2009-05-27
worse condition than unit 2. To confirm this, the specific PD results for unit
1 may be
analyzed to understand the reason for this high index if desired. According to
the
detailed analysis of PD measurements, other complementary tests can be
prescribed.
The detailed results for any diagnostic tool can be accessed by anyone
interested. To
access the results, the user only has to click on the name of the tool he/she
wants to
study below the number of the unit in the tree, such as the one in Figure 7.
This
displays the corresponding results in the right-hand portion of the screen, as
illustrated in Figure 8 for the PDAH of unit 1. The twelve graphs presented
here are
those of twelve couplers installed on this generator (one per parallel circuit
of each of
the three phase windings). Positive (darker) and negative (lighter) discharges
can be
compared in each histogram. Other quantities, such as amplitude, discharge
rate,
NQN, maximum amplitude and positive/negative ratio can all be extracted from
the
display. On the date of these measurements there were four data series,
corresponding to the different gain settings used that day. Each series can be
displayed just by clicking on the appropriate series number in the tree. Here,
only one
date appears but, when several measurement campaigns exist, they can all be
displayed and analyzed. The detailed analysis allows determining if slot
discharge,
end-winding discharges or internal delamination might be present. Based on the
conclusion reached, other tests can be arranged to obtain a more thorough
diagnostic
with an appreciation of the problem with higher level of confidence.
Sometimes, when the degradation mode identified is considered to be slow, the
conclusion may be to wait one more year for the next set of PD measurements.
Since
the calculated index of PD measurements always includes the results from all
measurement dates and since the confidence level of this tool will increase
with more
measurement campaigns, it is probably wise not to base the PD diagnostic on a
single set of measurements.
However, in cases where critical features appear from interpretation of PDAH
results,
it will be better to react faster with additional diagnostics: visual
observation for PD
identified as external or BARTACT for slot PD, for example.
When new results are measured by field personnel with any of the diagnostic
tools,
the data are transferred to the system using the appropriate window. For PD
measurement for instance, the user has only to click on the transfer button at
the
bottom of the screen in Figure 8 (circled). The system, without any other
human
intervention, accepts the predetermined file format, integrates the new files
in the
database, calculates a new value for the individual index with its confidence
level for
this tool and aggregates it with all other existing tools to get a global
diagnostic index
for the generator. Therefore, 1 or 2 min after a transfer, all users have
access to the
new data as well as new index and confidence.
Visual inspection in the calculation of indexes with confidence is included in
the
system in the same way as any other tool, with the calculations transparent
for users.
The differences for visual inspection are that there is no numerical file to
transfer and
the information from a visual inspection can depend on the person performing
this
task. Certain training may be necessary to make sure all observe the same
8
CA 02666894 2009-05-27
component in the same detail, using the same approach. The precision of the
readings can also be slightly reduced for greater simplicity. The readings are
converted into a numerical index of 1 to 5 for any observation made,
regardless of the
components observed.
One approach used can be that of associating pictures with each component in a
known state of degradation. For example, Figure 9 shows three pictures
illustrating
contamination in the end arms of stator windings. Three degrees of severity
are
shown (high, average, low). The user clicks on the appropriate boxes to
register the
level of contamination, a high level of contamination, or average or low
contamination.
If the high-contamination box is checked, it means that similar or worse
contamination
was observed on the machine's end arms. In addition to the severity, the user
indicates the spread of contamination over the generator (generalized to the
entire
machine, observed only on some of the end arms, or located only in limited
areas).
Thus, one of the three circles beside the text
"Generalisee/Rependue/Localisee"
(widespread/spread/localized) is marked for each severity level present. The
connection end and opposite connection end of the generator can be marked
independently, depending on whether they are accessible. Air baffles sometimes
prevent observation of one or both ends and this will have an impact on the
confidence level for this component.
Visual inspection is a two-step process, the first one being the reading in
the field and
the second, logging the information in the system. Using the same interface as
field
data sheet as the one displayed in the system eliminates the risk of
discrepancies.
Once the observations for this component are logged, the user confirms the
information by clicking the button at the bottom of the screen to
automatically
generate a value of 1 to 5 (better to worse) for this degradation sign
according to
predefined rules.
There is a logging interface for each sign of degradation for every component
and
sub-component of the generator. Each interface uses characteristic pictures
showing
different severities and distributions in the generator. For instance, the
number of
end-arms affected by traces of corona PD degradation at the junction of the
grading
system can be counted and logged in one of three groups of severity, whereas
other
components or signs of degradation are quantified with more macroscopic rules.
For most generators, a visual inspection will only reveal a few signs or no
signs of
degradation. Therefore, only a few signs require opening a detailed
quantification
window, similar to that in Figure 9, to make the visual association with the
proposed
pictures. In addition to all detailed quantification interfaces, the system
application
uses a main visual inspection interface to quickly log and display the results
of an
inspection. This main window is displayed on the right in Figure 10. To
facilitate the
transfer process, the user can click in this single window all the boxes for
signs where
no anomalies were observed and this will automatically result in a value of
1Ø Any
detailed quantification window can be accessed by clicking directly on the
name of
the sign in Figure 10 and, once the information is logged and accepted, the
main
window comes back on screen with a calculated index for this particular sign.
9
CA 02666894 2009-05-27
The aggregation of all signs is calculated with respect to the weight of every
component and sub-component. The more signs are logged in, the higher the
confidence level, suggesting that this visual inspection represents the
overall
condition of the generator. The solution of using simple picture associations
to
convert a priori subjective information into a numerical index for visual
inspection
through quantification algorithms mimicking experts reasoning results in an
index that
can then be treated mathematically the same way as the other tools in the
aggregation of the global diagnostic of the generator.
In addition to the display of simplified and detailed results used to make a
diagnostic
at a specific point in time, it is also of interest to trend the evolution of
the global index
for a generator over time, and of individual indexes for each tool. The system
can
offer user-friendly trending options, like the three as schematized in the
third column
on Figure 3. They go from the macroscopic display of how the entire fleet
evolves
over time (getting better or worse), to a microscopic view of the change in
condition of
any generator. An intermediate level allows a display of all the generators at
a plant.
Figure 11 illustrates the evolution of the diagnostic of a single unit over
time, in this
case for generator 2 at plant C. This display is obtained simply by clicking
on the label
"Historique" in the tree of the global classification underneath the number of
the unit,
as shown in Figure 7.
In the example of Figure 11, it can be seen that the global diagnostic is
obtained by
the aggregation of five diagnostic tools (PDAH, ITERG, BARTACT, PRPD and
Visual
Inspection) and a sixth element, which show maintenance interventions on the
unit
over the years. Each adjacent bar in the histogram represents a different
tool,
showing the evolution of the results over time. The global diagnostic,
represented by
the black line, is calculated from different indexes.
At any point in time, only the tools used up to that date compose the global
condition
index of the machine. For instance, before September 2002, the global
diagnostic
came from aggregation of the PDAH (first bar), BARTACT (third bar) and ITERG
(second bar). Since the PDAH readings were high with an individual index of
4.8, in
December of that same year, a PRPD measurement (fourth bar) was performed to
identify the exact nature of the discharge sources. Detailed analysis of those
results
revealed that the intense PD activity mainly came from gap type discharges
occurring
in the end-arm region of the winding. Later in 2008, when the generator was
accessible, a visual inspection was made and the reading was logged in (fifth
bar).
The individual index of the visual inspection was low at 2.2 and the only
signs
showing values different from unity (see Figure 10) were: a slight red powder
accumulation, waving of the stator yoke and the presence of conductive debris
on the
circuit rings which were removed. The low index of the visual inspection
contributed to
further improving the generator's global condition index.
One other piece of information appearing on this graph is the presence of the
maintenance interventions during the generator's life. In Figure 11, only one
intervention is present, marked by the bar extending from the bottom to the
top of the
CA 02666894 2009-05-27
graph. When the user moves the mouse over this bar, it shows the nature of the
intervention. Some interventions, which can be added for example from a list
of 45
predefined actions, can have an immediate impact on the diagnostic, such as a
rewind or. a restacking of the unit. When such actions are logged in, all the
results
from previous measurements are automatically reinitialized. However, for other
actions, such as solvent cleaning of the overhang like that appearing in
Figure 11
(2002/11/01), the effectiveness of the procedure cannot be assumed anymore
than its
effect on the measurements. Thus, for this action, all results are left as
they were but,
to anyone looking at the graph in Figure 11, it is clear that here the
cleaning was
successful, resulting in a reduction of PD activity and, consequently, a
sustained
reduction of the individual and global indexes.
This level of detail is of great value to the maintenance specialist but
managers, more
concerned about the overall reliability of their entire installations, will be
interested in
a more macroscopic analysis of the plant. The second level of "Historique" for
the
three generators of plant M is illustrated in Figure 12. Here a slow overall
degradation
of the units over time is observed, with unit 13 being the worst and 11 the
best. At this
level, it is not possible to know why unit 13 is in such a poor condition but,
if the plant
manager is concerned about it, he/she can ask a specialist to have a look at
the
details and give him/her the reason behind this global diagnostic.
The last portion of the application, appearing in the last column in Figure 3,
is the
documentation section. The first item of the section is the generation of
condition
reports, based on automatic algorithms, which may be designed not to replace
maintenance specialists but rather help them out in proposing guidelines for
their
diagnostics. These reports also have the advantage of helping new personnel to
learn
the difficult process of generator diagnosis.
Two levels of report may exist: for a plant or for a specific unit. As for
trending at the
unit level, data are analyzed for each tool and a summary of the analysis is
found in
the report with the global condition index of the machine. Specific comments
associated with the automated analysis of the results of each tool are listed,
such as
the potential source of PD for the PRPD or whether the intrinsic insulation
quality is
acceptable for the ITERG measurements. The more general report at the plant
level
will give a classification of the generators in different categories as shown
in the
following example:
= List of generators with a very high global condition index:
None
= List of generators with a high global condition index:
None
= List of generators with an intermediate global condition index:
11
CA 02666894 2009-05-27
04, Index = 2, 6, Confidence = 69%
06, Index = 3,0, Confidence = 68%
08, Index = 2,7, Confidence = 43%
= List of generators with a low global condition index:
01, Index = 1,4, Confidence = 77%
02, Index = 1,2, Confidence = 43%
03, Index = 1,9, Confidence = 72%
05, Index = 1,2, Confidence = 43%
07, Index = 1,4, Confidence = 56%
09, Index = 1,2, Confidence = 43%
10, Index = 1,8, Confidence = 69%
11, Index = 1,1, Confidence = 43%
12, Index = 1, 2, Confidence = 43%
= List of generators with no global condition index:
None
To access each of these diagnostic reports, the user clicks on the label
"Diagnostic"
at the plant or unit level as indicated in Figure 13.
Other documents found in this section and permanently accessible from anywhere
in
the utility, are measurement procedures for every diagnostic tool used on
site, with all
the details on how to prepare and perform the measurements. In addition,
simple
one-page job aids are also supplied so that field personnel can effectively
carry out
any measurement without having to read an extensive report. The user's manual
for
the diagnostic site is also found in this section. This manual explains how to
transfer
new data and display results and trending. Among other things, it contains
reports on
the theory of each type of measurement. The documentation section is not
static and
accepts new reports, case studies or any other documents that are of interest
to the
personnel involved in performing diagnostics.
The system according to the invention allows migrating from preventive
maintenance
to CBM so as to become more efficient in generator diagnostics and leave a
12
CA 02666894 2009-05-27
permanent trace of every diagnostic performed. In the past, there were no
standardized tools to characterize a generator and, depending on the team
doing the
diagnostic, the measurements and inspection could differ. Moreover, most of
the
results were difficult to find and, when they were located, specialists needed
to
analyze the data and produce a report that would often leave few traces over
time.
Thus, after changes in personnel or retirement of those involved, it would be
a tedious
task to find the information a few years later. The system circumvents the
problem of
data mining. The centralized data bank is a center point of the approach to
ensure all
diagnostic measurements from every tool are always be readily accessible.
Computation of simple individual indexes per tool and their aggregation to
come up
with an integrated diagnostic comprised the second step of the process. Since
this
approach is evidence-based, it would be difficult to make an integrated
diagnostic if
there is no way to access all relevant information quickly and on request.
Moreover,
maintenance can only be optimized if all diagnostics are constantly updated
and
accessible to specialists and managers.
Adjustments can be made to the system and if every algorithm, quantification
rule and
aggregation principles is thoroughly documented in reports and continuously
updated,
it is possible to build the entire approach systematically, one step at a
time. This
common knowledge makes sure that the ensuing diagnostic is as objective as
possible and reflects the facts as measured on the generators.
Another advantage of having fixed diagnostic rules is that now generator
diagnostics
are less variable and do not depend on the person performing a test or a set
of tests.
In addition, the selection of the tests to be performed is now organized and
no longer
subjective: Level-2 tests are generally triggered by Level-1 results and so
on. The set
of complementary diagnostic tools used is selected in terms of achieving a
more
comprehensive diagnostic. New tools can be added on an as-needed basis. The
modular approach ensures that addition of any tool is simple. Calculation of
the global
diagnostic index for a generator is defined in a way that the diagnostic is
always valid
regardless of the number or combination of tools used. However, depending on
the
selection and number of tools, the confidence level will change to reflect how
well the
diagnostic truly represents the overall condition of a generator. The
advantage of
having a single system using a Web-based approach is that, from one day to the
next, if one algorithm is modified, it is automatically accessible to everyone
and the
change is entirely transparent to the user.
In itself, compiling diagnostic data on a single server is already a major
improvement
compared to past practices. With the system according to the invention,
anyone, from
anywhere in the utility, can check this information in a few minutes. In
addition, it is
possible for any user to know if the index is good or bad, see its trend over
time and
get a brief report, and this is true for any diagnostic tool. The strength of
the approach
is also to have this user-friendly system with simple accessible information,
without
losing any information about the detailed files when the diagnostic needs to
be carried
further.
13
CA 02666894 2009-05-27
When a specialist gets a call from a plant manager, he/she can now, in a few
minutes, consult the information about a specific generator while looking at
the same
results as the manager on the screen. By being connected to the system, they
now
share the same data simultaneously and can work together on a course of action
according to the planned outage schedule of the unit.
The above described integrated diagnostic system for generators can be used
utility-
wide and is accessible by Intranet from anywhere. The system accepts
measurement
results from diagnostic tools/techniques including visual inspection. As soon
as new
results are transferred to the corporate server hosting the application,
automatic
calculations are performed generating simple conditions indexes and an
integrated
diagnostic for the generator. The classification of all generators, from worst
to best, is
continuously updated and displayed to identify where maintenance intervention
is
most likely required. This common source of information is based on validated
quantification rules making generator diagnostics quick, systematic and less
subjective. The system facilitates the transition from time-based maintenance
to
condition-based maintenance.
Although the system has been described above in reference with generators, it
should be noted that it can be also used for condition-based maintenance of
other
complex equipment and structures.
14