Note: Descriptions are shown in the official language in which they were submitted.
CA 02681641 2009-09-17
WO 2008/116110 CT/US2008/057734
ATTORNEYDO nr,i ivU.: iZ_)ai-ii~+vvvi
PREDICTIVE COST REDUCTION BASED ON A THERMODYNAMIC MODEL
CROSS-REFERENCE TO RELATED APPLICATIONS
This application claims the benefit of U.S. Provisional Application Serial No.
60/919,105, filed on March 20, 2007, and the benefit of U.S. Provisional
Application
Serial No. 60/919,289, filed on March 21, 2007, both of which are incorporated
by
reference in their entirety.
TECHNICAL FIELD
This description generally relates to predicting cost reduction based on
process
improvement.
BACKGROUND
Within processes there are costs resulting from inefficiencies and waste.
Investing in process improvement may reduce the costs and increase growth.
However, a qualitative, predictive measure of the growth resulting from a
reduction in
costs is generally not available.
SUMMARY
According to one general implementation, a predictive measure of the growth
resulting from a reduction in costs is provided by applying empirically
determined
economic data to a thermodynamic model.
In another general implementation, a cost reduction system includes a
thermodynamic model configured to determine a predictive cost reduction for a
process, the predictive cost reduction being derived from thermodynamic
principles, a
processor, and an output module. The processor is configured to access
parameters
associated with a process, the parameters including a quantity of units of
work-in-
process at first and second times, and first and second constants respectively
indicative of growth between the first and second times, and of a translated
reduction
of the work-in-process to a reduction of cost. The processor is further
configured to
apply the thermodynamic model to the accessed parameters, and determine a
predictive cost reduction associated with an improvement of the process. The
output
module is configured to output the determined predictive cost reduction.
1
CA 02681641 2009-09-17
WO 2008/116110 CT/US2008/057734
ATTORNEYDO nr,i ivU.: iZ_)ai-ii~+vvvi
In another general implementation, parameters associated with a process are
accessed. The parameters include a quantity of units of work-in-process (WIP)
at first
and second times, and first and second constants respectively indicative of
growth
between the first and second times, and of a translated reduction of the WIP
to a
reduction of cost. A thermodynamic model is applied to the accessed
parameters, and
a predictive cost reduction associated with an improvement of the process
based on
applying the thermodynamic model is output.
Implementations may include one or more of the following features. The
thermodynamic model may be derived from Carnot's equation. Little's Law may be
used to derive an expression that is analogous to Carnot's equation. The
thermodynamic model derived from Carnot's equation may include an expression
analogous to Carnot's equation, the expression being derived from Little's
Law. The
first constant indicative of growth may include a ratio of an economic value
at the
second time and the economic value at the first time. The economic value at
the
second time may represent demand at the second time, and the economic value at
the
first time may represent demand at the first time. The economic value at the
second
time may represent revenue at the second time, and the economic value at the
first
time may represent revenue at the first time.
In some implementations, applying the thermodynamic model may include
determining the predictive cost reduction using:
PredictiveCostReduction=l+Relogz aRWf ~ (1)
W
In Equation (1), Re represents the second constant, Wf represents the quantity
of units of the WIP at the second time, Wi represents the quantity of units of
the WIP
at the first time, and aR represents a ratio of the growth at the first time
to the value of
the growth at the second time. The second constant may have a value between
0.09
and 0.11. The first and second constants may be determined based on empirical
data.
In some implementations, the process may include value-added costs and non-
value added costs, and the non-value added costs may include 50% or more of a
total
cost associated with the process. The non-value added costs may include rework
of at
least one of the units of WIP, and the rework may include performing the at
least one
of the units of WIP more than one time. The total cost associated with the
process
may be driven by the rework. The cost reduction may be proportional to the
2
CA 02681641 2009-09-17
WO 2008/116110 PCT/US2008/057734
ATTORNEY DOCnr, i iv U.: i Z_)a i- i i~+vv v i
logarithm of a reduction in the quantity of units of WIP from the first time
to the
second time. In other implementations, the process may be modified based on
the
predictive cost reduction.
In another general aspect, a predictive cost reduction associated with
improvement of a process is output, the predictive cost reduction being based
on
applying a thermodynamic model to an accessed quantity of units of WIP at
various
times, and constants indicative of growth between the various times, and of a
translated reduction of WIP to reduction of cost.
Implementations may include one or more of the following features. The
constants indicative of growth may include a ratio of an economic value at one
of the
various times and the economic value at another of the various times. The
economic
value may represent demand. The economic value may represent revenue. Applying
the thermodynamic model may include determining the predictive cost reduction
using Equation (1).
In another general aspect, a computer program product is tangibly embodied in
a machine-readable medium, and the computer program product includes
instructions
that, when read by a machine, operate to cause a data processing apparatus to
access
parameters associated with a process. The parameters include a quantity of
units of
WIP at first and second times, and first and second constants respectively
indicative
of growth between the first and second times, and of a translated reduction of
the WIP
to a reduction of cost. A thermodynamic model is applied to the accessed
parameters,
and a predictive cost reduction associated with an improvement of the process
output
based on applying the thermodynamic model is output.
Implementations may include one or more of the following features. The
thermodynamic model is derived from Carnot's equation. Applying the
thermodynamic model may also include determining the predictive cost reduction
using Equation (1).
Implementations of any of the techniques described above may include a
method or process, a system, or instructions stored on a computer-readable
storage
device. The details of particular implementations are set forth in the
accompanying
drawings and description below. Other features will be apparent from the
following
description, including the drawings, and the claims.
DESCRIPTION OF DRAWINGS
3
CA 02681641 2009-09-17
WO 2008/116110 PCT/US2008/057734
ATTORNEY DOCnr, i
FIG. 1 is a contextual diagram of an exemplary system.
FIG. 2 is a block diagram of an exemplary system.
FIG. 3 is a flowchart of an exemplary process.
FIGS. 4 to 6 are graphs that illustrate exemplary example relationships
between cost reduction versus reduction in WIP.
FIG. 7 depicts a graph of revenue variations.
FIG. 8 is a schematic diagram of an exemplary system.
Like reference numbers represent corresponding parts throughout.
DETAILED DESCRIPTION
According to one general implementation, a predictive measure of the growth
resulting from a reduction in costs is provided by applying empirically
determined
economic data to a thermodynamic model. Specifically, a predictive cost
reduction
associated with improvement of a process is output, the predictive cost
reduction
being based on applying a thermodynamic model to an accessed quantity of units
of
WIP at various times, and constants indicative of growth between the various
times,
and of a translated reduction of WIP to reduction of cost.
FIG. 1 illustrates an exemplary system 100 in states before and after a
thermodynamic model is applied to provide a predictive measure of growth
resulting
from a reduction in costs. Specifically, the system 100 includes a process 105
(such
as a business process), that may be analyzed for improvement by a
thermodynamic
model 140. A predictive cost reduction achieved from contemplated process
improvements may be determined based on applying a thermodynamic model to
parameters associated with the process 105. In particular, and as discussed in
greater
detail below, the thermodynamic model 140 analogizes waste in the process 105
to
entropy in a thermodynamic process in order to determine a predicted reduction
in
cost associated with the process 105 as a result of an investment in
improvement of
the process 105. The thermodynamic model 140 may be derived from Carnot's
equation. In some implementations, and as shown below in Equation (22),
Little's
Law may be used to derive a thermodynamic model of the process 105 that is
analogous to Carnot's equation. The time for an item to transit the process
105 may
be referred to as the lead time, and the lead time is a primary driver of the
costs
associated with the process 105. The time for an item to transit completely
through
4
CA 02681641 2009-09-17
WO 2008/116110 PCT/US2008/057734
ATTORNEY DOCnr, i iv U.: i Z-)a i- i i~+vv v i
the process 105 may be analogized to a velocity of the process 105. Increasing
the
velocity of the process 105 leads to a reduced lead time and a reduction in
costs
associated with the process 105. As shown below, Little's Law may be used to
determine a measure of process improvement corresponding to increasing the
velocity
of the process 105 by a particular amount.
The process 105 may be any type of process implemented by, for example, an
enterprise, an organization, or group of enterprises and/or organizations. The
process
105 also may be referred to as a microeconomic process. As discussed in more
detail
below, the process 105 is associated with a cost related to the amount of
waste and
inefficiency in the process 105. Modifications may be made to the process 105
to
improve the process 105 and reduce the cost associated with the process 105
by, for
example, reducing the waste and inefficiencies in the process 105. However,
making
such modifications entails making an investment in the process 105,
particularly an
investment in improving the process 105. Thus, predicting a quantitative
measure of
cost reductions that result from investing in the process 105 may allow for
more
rational investment in process improvement as compared to techniques in which
a
quantitative measure of cost reduction is not available prior to making an
investment
in process improvement.
A decision to improve a process of an enterprise without a predictive measure
of the reduction in cost achievable as a result of the process improvement may
rest on
judgment or anecdotal evidence. For example, a consultant to the enterprise
may,
without the benefit of a predictive cost reduction, estimate a savings of 3%
based on
process improvements, when in fact the process improvements would result in a
savings of 8%. Had the enterprise known that a savings of 8% was possible, the
enterprise may have been more willing to invest in the process improvements.
In
another example, a process improvement that appears to have the potential to
greatly
reduce costs actually may not result in a reduction of costs. In this example,
a
quantitative predictive cost reduction may save the enterprise from investing
in
unprofitable process improvements.
The process 105 may be any type of process. For example, the process 105
may implemented by an enterprise. The enterprise may be an organization formed
to
achieve a common commercial or social goal. For example, the enterprise may be
an
organization that oversees, arranges and/or engages in manufacturing. For
example,
the process 105 may be a manufacturing process implemented by an enterprise
that
CA 02681641 2009-09-17
WO 2008/116110 PCT/US2008/057734
ATTORNEY DOCnr, i iv U.: i Z-)a i- i i~+vv v i
engages in the manufacture and sale of automobiles. In some examples, the
enterprise
may be an organization that participates in transactional engagements with
other
enterprises or within the enterprise itself. For example, the enterprise may
be an
insurance company and the process 105 may be implemented to receive and
process
insurance claims. In another example, the enterprise may be a law firm, and
the
process 105 may represent a workflow that occurs when the law firm accepts a
new
legal case and the law firm processes the case to completion. In yet another
example,
the process 105 may be a process to develop proposed designs for automobiles
implemented by an enterprise involved in product development. In some
examples,
the process 105 may include aspects of both manufacturing and transactional
processes.
The process 105 is associated with a cost related to the amount of waste in
the
process 105. As discussed in more detail below, the cost of the process 105
may be
analogized to entropy in a thermodynamic process, and the costs of the process
105
may be primarily driven by WIP. WIP may be the number of units of work that
are in
the process 105 at a particular time. In other words, WIP may be considered to
be the
number of units of work that are in various stages of completion within the
process
105. In some examples, WIP may be a number of tasks that are in various stages
of
completion within the process 105.
For example, the process 105 may be an process to manufacture automobiles.
In this example, a unit of work may be any action item related to
manufacturing
automobiles, such as attaching doors to an automobile frame. If the doors are
attached at a particular workstation, and there are fifteen automobile frames
at the
workstation waiting for doors to be attached, the WIP has a value of fifteen.
In
another example, the process 105 may be a transactional process, such as a
process to
process documents related to a legal case handled by a law firm. In this
example WIP
may be the number of tasks in progress in the process 105. In this example,
the
process 105 may include a task to create binders to hold the papers and a task
to scan
physical documents into an electronic system. The WIP associated with the
process
105 may include of variety of different items, each of which may have a
different
completion time. However, as discussed in more detail below, the lead time of
the
process 105 is governed by the average completion rate of the different items.
Although WIP is a primary driver of costs in the process 105, costs in the
process 105 also may result from obsolescence (e.g., items made in the process
105 or
6
CA 02681641 2009-09-17
WO 2008/116110 PCT/US2008/057734
ATTORNEY DOCnr, i iv U.: i Z-)a i- i i~+vv v i
tasks performed as part of the process 105 are no longer needed by a
customer), flaws
within the process 105 that cause items made in the process 105 to be
defective or
unusable, and indirect costs (e.g, overhead costs stemming from administering
the
process, costs of equipment and facilities, and research and development
costs).
In greater detail, in the example shown in FIG. 1 A, the system 100 includes
the process 105, a new work item 108, a work handler 110, workstations 120 and
122,
a quality control module 130, and a completed work item 142. The new work item
108 enters the process 105 at a time ti. The new work item 108 may be, for
example,
an order, or other indication, that the system 100 is to process the new work
item 108
into the completed work item 142. For example, the process 105 may be an
automobile manufacturing process, and the new work item 108 may be an order
for an
automobile.
The work handler 110 acts as a gatekeeper and assigns the new work item 108
to the workstation 120 at time ti. In some implementations, the work handler
110
may include a controller with process monitoring capabilities that monitors
the
process 105. In these implementations, the work handler 110 may determine to
which
of multiple workstations to assign the new work item 108 based on the
capabilities of
the workstations or a current workload of the workstations. In some
implementations,
the work handler 110 may assign the new work item 108 through an automated
process. In some implementations, the work handler 110 may assign the new work
item 108 manually and with human intervention. In the example shown, the work
handler 110 assigns the new work item 108 to the workstation 120.
In the example shown, the system 100 includes the workstation 120 and the
workstation 122. The workstations 120 and 122 are points in the process 105
that
process units of work or perform one or more tasks. The workstations 120 and
122
receive a new task or a new unit of work 125 and process the task or unit of
work 125
to produce a draft work item 128. Thus, the workstations 120 and 122 transform
the
new work item 108 partially or completely into the completed work item 142.
Although two workstations are shown in the example of FIG. 1A, in other
examples,
more or fewer than two workstations may be included. In some examples, the
workstations 120 and 122 may perform different actions as compared to each
other.
In some implementations, the workstations 120 and 122 may each perform more
than
one task or type of unit of work. The workstations 120 and 122 may include
machines, automated processes running on machines, or partially automated
processes
7
CA 02681641 2009-09-17
WO 2008/116110 PCT/US2008/057734
ATTORNEY DOCnr, i iv U.: i Z-)a i- i i~+vv v i
that includes human interaction by, for example, a workstation operator. For
example, the process 105 may be a process to manufacture automobiles, and the
workstations 120 and 122 may each be stations that attach doors to automobile
frames. In some examples, the process 105 may be a process to process
insurance
claims and the workstations 120 and 122 represent claims adjusters.
The workstation 120 includes existing WIP 127 that is waiting to be processed
by the workstation 120. Such WIP may be considered to be, for example, a
backlog
of work units or tasks that have accumulated at a particular workstation. In
the
example shown in FIG. 1A, the existing WIP 127 waits to be processed by the
workstation 120. The new work item 108 is assigned to the workstation 120,
and, as a
result, a new task or unit of work 125 is added to the existing WIP 127. As
discussed
above, the workstation 120 may be considered as a processing point within the
process 105 that transforms the new work item 108, partially or completely,
into a
completed work item 142. For example, the process 105 may be a process to
manufacture a welded workpeice, and the workstation 120 may be a welding
station,
the new task 125 may be a part to be welded to partially complete the
workpeice, and
the WIP 127 may include other parts to be welded. Additionally, new work may
be
entering the system 100 at any point in the process, assigned to a workstation
120 by
the work handler 110, and added to the existing WIP 127.
A quality control module 130 reviews the draft work item 128 and determines
if the draft work 128 is satisfactory. If the draft work 128 is satisfactory,
the draft
work 128 becomes the completed work item 142. However, if the draft work 128
is
not satisfactory, rework is needed, and the task is returned to the
workstation 120 as
rework 135 at time t4. The rework 135 is added to the WIP 127 at time t5 and
processed by the workstation 120 into processed rework 137 (not shown). In
some
implementations, the rework 135 may be assigned to a workstation other than
the
workstation that produced the draft work item 128.
At time t6, the processed rework 137 is reviewed by the quality control module
130. At time t7, the processed rework 137 that has been checked by the quality
control module 130 exits the system 100 as the completed work item 142.
Thus, the rework 135 causes a delay in the transition of the new work item 108
into the completed work item 142. In particular, without rework the transition
from
the new work item 108 to the completed work item 142 occurs shortly after time
t3.
However, in examples in which the quality control module 130 determines rework
is
8
CA 02681641 2009-09-17
WO 2008/116110 PCT/US2008/057734
ATTORNEY DOCnr, i iv U.: i Z_)a i- i i~+vv v i
needed, the new work item 108 transitions to the completed work item 142 at
time t7.
In some examples, more that one cycle of rework occurs, thus the transition
from the
new work item 108 to the completed work item 142 may occur at a time later
that
time t7. Accordingly, as rework does not add features to the completed work
item 142
beyond what was originally intended for the completed work item 142, rework
adds a
non-value-added cost to the process 105. Other non-value-added costs include
costs
resulting from items that are unusable or defective to the point that the
items cannot
be made satisfactory through rework. The total cost of the process includes
value-
added costs, such as research and development costs, in addition to non-value
added
costs.
Thus, rework may increase the total cost associated with the process 105.
For example, in a particularly inefficient process, non-value added costs,
such as
rework, may account for 50% or more of a total cost associated with a process.
A thermodynamic model 140 may be used to monitor the process 105 such
that a predictive cost reduction resulting from improvements to the process
105 may
be determined. In particular, the process improvements may be designed to
reduce
the time for the new work item 108 to transition to the completed work item
142. As
shown in the example of FIG. 1A, the thermodynamic model 140 may monitor the
process 105 to, for example, collect data associated with the process in order
to
determine a predictive cost reduction associated with an improvement in the
process
105. For example, the thermodynamic model 140 may access parameters in the
work
handler 105 to determine which workstations are receiving the highest number
of
units of work. In another example, the thermodynamic model 140 may access
parameters in the quality control module 130 to determine the duration of time
between a new work item entering the process 105 and the corresponding
completed
work item leaving the process 105.
Referring to FIG. 1B, an illustration the system 100 including a modified
process 155 that incorporates feedback from the thermodynamic model 140 is
shown.
In this example, the modified process 155 is an improved version of the
process 105
discussed above. In the modified process, a new work item 160 enters the
modified
process 155 at time ti. The work handler 110 assigns the new work item 160 to
the
workstation 120. The assignment of the new work item 160 to the workstation
120
may be based on feedback from the thermodynamic model 140. For example, the
thermodynamic model may provide the work handler 110 with data to improve
9
CA 02681641 2009-09-17
WO 2008/116110 PCT/US2008/057734
ATTORNEY DOCnr, i iv U.: i Z-)a i- i i~+vv v i
process efficiency, by for example, assigning the new work item 160 to a
workstation
with no WIP. The workstation 120 processes the new work item 160 into a draft
work item 165 at time t3, and the draft work item 165 is checked by the
quality control
module 130. At time t4, a completed work item 170 exits the system 100.
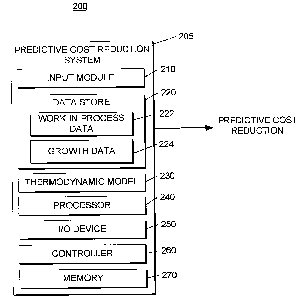
Referring to FIG. 2, a block diagram of a system 200 that includes a
predictive
cost reduction system 205 is shown. The system 200 includes an input module
210, a
data store 220, a thermodynamic mode1230, a processor 240, an UO device 250, a
controller 260, and a memory 270. The predictive cost reduction system 200 may
be
used to determine a predictive cost reduction associated with an improvement
in a
process (such as the process 105 discussed above with respect to FIG. 1A) The
predictive cost reduction system 200 may be implemented within hardware or
software.
The input module 210 imports data associated with a process. The data may
include a quantity of units of WIP at various times and locations in the
process. For
example, the input module 210 may receive data that includes a measure of the
amount of WIP in the process at a first time and a measure of the amount of
WIP in
the same process at a second time. The data also may include data acquired
from
outside of the process, such as an empirically determined constant that
relates a
reduction in the amount of WIP between two times to a reduction in the costs
associated with the process. In some implementations, the input module 210
receives
data from a source external to the system 205. In some implementations, the
input
module 210 receives data from a source within the system 200. In some
implementations, the input module 210 accesses data, either from within the
system
205 or from a source external to the system 205. In some implementations, the
input
module 210 reformats and/or transforms the data such that the data may be
processed
and stored by other components within the system 205.
The predictive cost reduction system 200 also includes a data store 220. In
some implementations, data from the input module 210 is stored in the data
store 220.
The data store 220 may be, for example, a relational database that logically
organizes
data into a series of database tables. The data included in the data store 220
may be,
for example, data associated with a process such as the process 105 or the
process
155. Each database table arranges data in a series of columns (where each
column
represents an attribute of the data stored in the database) and rows (where
each row
represents attribute values). The data store 220 may be, for example, an
object-
CA 02681641 2009-09-17
WO 2008/116110 PCT/US2008/057734
ATTORNEY DOCnr, i iv U.: i Z_)a i- i i~+vv v i
oriented database that logically or physically organizes data into a series of
objects.
Each object may be associated with a series of attribute values. The data
store 220
also may be a type of database management system that is not necessarily a
relational
or object-oriented database. For example, a series of XML (Extensible Mark-up
Language) files or documents may be used, where each XML file or document
includes attributes and attribute values. Data included in the data store 250
may be
identified by a unique identifier such that data related to a particular
process may be
retrieved from the data store 220.
The data store 220 includes WIP data 222 and growth data 224. The WIP data
222 includes a quantity of WIP for a process at a first and second time. The
WIP data
222 also may include data related to a quantity of WIP at more than two times,
and
the WIP data 222 may include data related to a quantity of WIP for more than
one
process. The WIP data 222 may include a measure of all of the WIP in the
process at
a particular time, or all of the WIP in the process over a defined time
period. As
discussed above, the WIP in any process may include more than one type of work
unit
or more than one type of task. Thus, the WIP data 222 also may include data
that
represents the total WIP in the process. The WIP data 222 may include WIP for
a
particular part number, a particular type of work unit, or a particular task
within a
transactional process.
The growth data 224 includes data related to the growth of the process at the
first and second time. For example, the growth data 224 may include revenue
generated by the process at the first time and revenue generated by the
process at the
second time. In this example, the growth data 224 may be represented by data
indicating a change in dollars of profit realized from the process as a result
of process
improvements.
The predictive cost reduction system 205 also includes the thermodynamic
mode1230. The thermodynamic mode1230 may determine a predictive cost
reduction based on an equations of cost reduction derived from thermodynamic
principles, such as Equation (1). For example, reduction in lead time (e.g.,
the time
from the injection of work into the process until the time at which the work
is
completed) as expressed by Little's Law leads to an expression for the
reduction of
waste in the process. In some implementations, the thermodynamic mode1230
receives data indicative of growth between various times from the data store
220
and/or the growth data 224. In other implementations, the thermodynamic
mode1230
11
CA 02681641 2009-09-17
WO 2008/116110 PCT/US2008/057734
ATTORNEY DOCnr, i iv U.: i Z_)a i- i i~+vv v i
may access such data from the data store 220, the WIP data 222, or a source
external
to the predictive cost reduction system 205.
The thermodynamic mode1230 receives data indicative of a quantity of WIP
in the process at various times from the data store 220 and/or the WIP data
222. In
other implementations, the thermodynamic mode1230 may access such data from
the
data store 220, the WIP data 222, or a source external to the predictive cost
reduction
system 205. The components of the predictive cost reduction system 205 may
translate or reformat data from the input module 210 into data suitable for
the
thermodynamic mode1230. For example, growth data associated with the process
at
various times may be received from the input module 210 and used to determine
constants indicative of growth including a ratio of economic value at one of
the times
to economic value at another of the various times. The economic value may
represent
demand or revenue.
The thermodynamic mode1230 may be a specialized hardware or software
module that is pre-programmed or pre-configured to invoke specialized or
proprietary
thermodynamic functionality only. In another aspect, the thermodynamic module
230
may be a more generic hardware or software module that is capable of
implementing
generic and specialized functionality, including thermodynamic functionality.
The predictive cost reduction system 205 also includes the processor 240. The
processor 240 may be a processor suitable for the execution of a computer
program
such as a general or special purpose microprocessor, and any one or more
processors
of any kind of digital computer. Generally, a processor receives instructions
and data
from a read-only memory or a random access memory or both. The processor 240
receives instruction and data from the components of the predictive cost
reduction
system 205 to, for example, output a predictive cost reduction associated with
improvement of a particular process. In some implementations, the predictive
cost
reduction system 205 includes more than one processor.
The predictive cost reduction system 205 also includes the UO device 250,
which is configured to allow a user selection. For example, the UO device 250
may
be a mouse, a keyboard, a stylus, or any other device that allows a user to
input data
into the predictive cost reduction system 205 or otherwise communicate with
the
predictive cost reduction system 205. In some implementations, the user may be
a
machine and the user input may be received from an automated process running
on
the machine. In other implementations, the user may be a person. The UO device
250
12
CA 02681641 2009-09-17
WO 2008/116110 PCT/US2008/057734
ATTORNEY DOCnr, i iv U.: i Z_)a i- i i~+vv v i
also may include a device configured to output the predictive cost reduction
associated with an improvement in one or more processes.
The predictive cost reduction system 205 also includes the controller 260. The
controller 260 is an interface to a process such as the process 105 or the
process 155.
The controller 260 may receive feedback from the process, such as quantities
of WIP
and growth data associated with the process at various times. The controller
260 also
may cause changes in the system in response to the feedback, such as, for
example,
actuating a control valve in a pipeline such that the pipeline is opened or
shut to
accommodate a higher or lower flow of material, respectively. In other
examples, the
controller 260 may turn a tool on or off, shut down or activate a system, or
activate a
user interface that affects a transactional process.
The predictive cost reduction system 205 also includes a memory 270. The
memory 270 may be any type of machine-readable storage medium. The memory
270 may, for example, store the data included in the data store 220. In some
implementations, the memory 270 may store instructions that, when executed,
cause
the thermodynamic mode1230 to determine a predictive cost reduction associated
with process improvement.
Although the example predictive cost reduction system 205 is shown as a
single integrated component, one or more of the modules and applications
included in
the predictive cost reduction system 205 may be implemented separately from
the
system 205 but in communication with the system 205. For example, the data
store
220 may be implemented on a centralized server that communicates and exchanges
data with the predictive cost reduction system 205.
Referring to FIG. 3, an example process 300 is illustrated. The example
process 300 outputs a predictive cost reduction associated with an improvement
of a
process. The process 300 may be performed by one or more processors included
in a
predictive cost reduction system 205 discussed above with respect to FIG. 2.
The
process may be a process such as the process 105 or the process 155 discussed
above
with respect to FIGS. 1A and 1B.
Parameters associated with a process are accessed (310). The parameters
include a quantity of units of WIP at first and second times. For example, the
first
time may be a time before any process improvements are made to the process,
and the
second time may be a time after the process has been improved.
13
CA 02681641 2009-09-17
WO 2008/116110 PCT/US2008/057734
ATTORNEY DOCnr, i iv U.: i Z-)a i- i i~+vv v i
The accessed parameters also include a constant indicative of growth between
the first and second times. Continuing the above example, the constant
indicative of
growth may be based on growth of an economic value at a first time before
process
improvement and a second time after process improvement. The first time may be
referred to as an "initial time" and the second time may be referred to as a
"final
time." The constant indicative of growth may be, for example a ratio of an
economic
value at the second time and the economic value at the second time. For
example, the
economic value may be a ratio of revenue generated by the process before
process
improvement and revenue generated by the process after process improvement.
Revenue may be represented as an amount of income produced by the process over
a
period of time. Thus, revenue at the first time may be income from the process
over,
for example, a week. Revenue at the second time may be income over a week from
the process after process improvements have been implemented.
In some examples, the economic value may be demand. Although demand,
which may be demand per unit, may provide more accuracy, data related to
demand is
oftentimes not maintained by the enterprise. Thus, revenue may be used as a
surrogate for demand when demand data is not available. Revenue is a close
approximation to unavailable demand data. Revenue data may be, for example,
data
that tracks revenue in dollars per unit of product produced by the process.
Referring
to Equation (1) shown above, the first constant may be represented by aR in
examples
where the ratio is based on revenue. In examples in which the ratio is based
on
demand, such as the equations expressed below, the first constant may be
represented
by aD. In some examples, the constant indicative of growth between the first
and
second times may represent a change in the units produced by the process at
the first
time and the units produced by the process at the second time. The units
produced by
the process at the first time may be, for example, the units produced by the
process
prior to investing in and implementing process improvements, and the units
produced
by the process at the first time may represent the units produced by the
process over a
defined time period. For example, the units produced at the first time may
represent
the automobiles produced by an automobile manufacturing process in a month,
and
the units produced at the second time may represent the automobiles produced
in a
month the manufacturing process after process improvements have been
implemented. In other examples, the constant indicative of growth between the
first
and second times may represent work items completed by a transactional
process.
14
CA 02681641 2009-09-17
WO 2008/116110 PCT/US2008/057734
ATTORNEY DOCnr, i iv U.: i Z-)a i- i i~+vv v i
Although in the examples above, the economic values are values determined over
a
week or a month, in other examples any time period that provides a consistent
comparison of the process at the first time to the process at the second time
may be
used.
The accessed parameters also include a second constant indicative of a
translated reduction of the WIP to a reduction in the cost of the process. The
second
constant relates a reduction in WIP in the process to a reduction in the costs
associated with the process. The second constant may be referred to as a gas
constant
of economics. The second constant may be empirically determined. FIGS. 4-6
below
show examples of data from which the second constant may be derived. In some
examples, the second constant has a value between 0.09 and 0.11.
A thermodynamic model is applied to the accessed parameters (320). The
thermodynamic model may be derived from Carnot's equation, and the
thermodynamic model may include equations of cost reduction such as Equation
(1).
A predictive cost reduction associated with an improvement of the process is
output based on applying the thermodynamic model (330). In some
implementations,
the process may be modified based on the predictive cost reduction. For
example,
data maybe output by the controller 260 to modify the process.
The following provides an analytical discussion of determining a predictive
cost reduction associated with an improvement of a process, such as the
process 105
discussed above, as output by the thermodynamic model, such as the
thermodynamic
models 140 and 230 discussed above.
The application of process improvement using conventional tools such as Lean
Six Sigma and Complexity reduction promises significant cost reduction in
Microeconomic processes. However, to justify the investment in process
improvement, it can be helpful to have an estimate of the cost reduction
benefit. In a
case study contained herein, a reduction of Cost of Goods Sold of 3% was
projected,
but in fact an 8% reduction was achieved. It had been empirically noted that
the cost
reduction was best correlated with the reduction of the logarithm of the
reduction in
WIP. Such an equation may be derived from first principles of Queuing Theory,
Information Theory and Thermodynamics together with an understanding of
process
improvement. The results of each are shown below and process improvement is
discussed.
CA 02681641 2009-09-17
WO 2008/116110 PCT/US2008/057734
ATTORNEY DOCnr, i iv U.: i Z-)a i- i i~+vv v i
The efficiency of the transformation of revenue to profit not only can drive
the
share value of corporations, but also the destiny of economies, nations, and
the career
opportunities available to their citizens. Many firms have been slow to apply
the
early versions of process improvement, and, in consequence, suffered loss of
market
share. If a CEO and senior management could project a cost reduction of
greater than
8% based on process improvement, rather than the 3% estimate provided by the
consultant, the CEO and senior management would more likely take immediate
action.
The following is a discussion of the elimination of waste in an engine. As
discussed in more detail below, the discussion of the elimination of waste in
an engine
provides the background for understanding waste elimination in a microeconomic
process.
In each cycle, an engine receives heat energy, QH, from a hot combustion
source at temperature, TH. With each power stroke of a piston in the engine,
the
engine transforms part of the received heat energy into useful work to drive a
shaft.
The rest of the input energy is expelled as waste energy, Qc, to the
environment at a
cold sink temperature of Tc -25 C at which point the cycle is complete and the
engine is ready to receive more heat energy. Entropy, S, is drawn from the hot
source, and at least as much entropy as is drawn from the hot source is
delivered to
the cold temperature sink, as reflected in Equation (2):
Entropy = S = QH < Qc
TH Tc
(2)
Thus, the minimum waste energy, Qc, delivered to the cold temperature sink is
reflected in Equation (3), below:
Waste = Qc _ TcS
(3)
In Equations (2) and (3), temperature is expressed in the absolute scale where
0 C=273 Kelvin. Minimum waste in an engine is proportional to the entropy that
is
16
CA 02681641 2009-09-17
WO 2008/116110 PCT/US2008/057734
ATTORNEY DOCnr, i iv U.: i Z-)a i- i i~+vv v i
output to the cold sink. The "greater than or equal to" sign is "greater than"
in a real
engine due to the process being irreversible, which creates additional waste.
For
example, when a gas expands through a nozzle virtually all the entropy created
is
irreversible. According to Equation (2) entropy falls as the temperature from
the hot
combustion source, TH, increases. This discovery helped inform the development
of
engines, from atmospheric engines of the 18th century, which operated at 3%
efficiency and about 100 C, to modern gas turbines, which can operate at 40%
efficiency and 3000 C. As discussed below, the entropy flows in a
microeconomic
process, such as the process 105 discussed above with respect to FIG. 1, may
be
analogies to the entropy flow in an engine. Deriving the entropy flows of a
microeconomic process and the parameters related to entropy reduction can
similarly
inform the reduction of waste which is cost in a microeconomic process.
The expression for the entropy change of an ideal gas undergoing compression
at a constant temperature can be derived and may be used to derive an
equivalent
expression for microeconomic entropy. Change in entropy is reflected in
Equation
(4), below:
Change in Entropy = AS = dQ (4)
From the first law of thermodynamics, and as reflected in Equation (5), below:
dQ=dU+pdV (5)
In Equation (5), Q represents heat, T represents temperature, U represents
internal energy, P represents pressure, and V represents volume. The
substitution of
Equation (5) into Equation (4) results in an expression reflected in Equation
(6),
below:
~S = $(d1V) _ (c1dT+PdV)
= PdV (6)
T T T
17
CA 02681641 2009-09-17
WO 2008/116110 PCT/US2008/057734
ATTORNEY DOCnr, i iv U.: i Z_)a i- i i~+vv v i
In Equation (6), cõ represents the specific heat. The right-most expression
represents an expression for isothermal processes, where dT=O, involving an
ideal
gas. The pressure and volume of an ideal gas are reflected as Equation (7),
where n
represents a number of moles, below:
PV=nRT (7)
Substituting Equation (7) into Equation (5) results in the expression shown in
Equation (8):
VHn.]
~S = f VT nRTdV = nR ~ = nRlog(VF,n., /Vjii,, ) (8)
vi'ud.]
Similarly, the energy expended by an external force performing isothermal
compression on an ideal gas, as reflected in Equation (9):
vf vf
Energy expended in compression = P ( -dV ) _ - nV dV= -nRTlog (Vf/V ) = -TAS
(9)
f f
Accordingly, the minimum waste in an engine is proportional to the entropy
delivered to the cold sink times the cold sink temperature. Whether comparable
entropy exists in a microeconomic process may be determined, and an equation
representing such a comparable entropy can similarly inform the reduction of
waste
cost in the microeconomic process.
By way of example, if an enterprise has W units of WIP inventory and ships
products that include C units of WIP inventory per year, then the company
turns
inventory Z according to Z=C/W times per year. Each turn of inventory may be
analogized to a power stroke (or cycle) of an engine. WR units of revenue are
drawn
in to the process at revenue per unit r and processed by the process. Wc units
of
equivalent cost are expelled from the process at dollars of cost per unit,
which may be
represented as c. For example, in a microeconomic process, to produce WR units
of
18
CA 02681641 2009-09-17
WO 2008/116110 PCT/US2008/057734
ATTORNEY DOCnr, i iv U.: i Z_)a i- i i~+vv v i
revenue may require more than Wc equivalent units of cost due to scrap,
rework, and
obsolescence. Total cost c is the average total dollars of cost per unit
including
indirect expenses such as, for example, administrative and general expenses,
research
and development expenditures, and costs associated with acquiring and
maintaining
capital (e.g., machinery, information technology equipment, plants and
manufacturing
facilities, and office space). Profit is the difference between revenue and
total cost.
The input revenue per turn is $Rt= rWR. Likewise, a business can expel cost
per
inventory turn of $Ct=cWc. If $R and $C are analogous to energy and that $r
and $c
are analogous to temperature, ratios can be formed similar to Equation (2), as
reflected in Equation (10):
Qx Rc rWx cWc Cc Qc
->_ =WR<_Wc= _ ----)
Tx r r c c Tc
(10)
In Equation (10), Rt (which also may be expressed as rWR) dollars of revenue
flow into the microeconomic process from the market (e.g., customers and
clients),
and at least Ct (which also may be expressed as cWc) dollars of waste flow out
of the
microeconomic process. The difference between dollars of revenue flowing in
and
dollars of waste following out, Rt - Ct, can flow to the shareholders on each
inventory
turn as dollars of profit. Again, by analogy to an engine, energy flows from
the hot
source to the engine, waste heat is delivered to the cold sink, and the
difference is
useful work. Most of the entropy of WIP is irreversible, similar to that due
to the free
expansion of a gas. Thus, the entropy of a microeconomic process can be a
function
of units of WIP, W.
Waste may be defined as any cost that does not add a form, feature or function
of value to the customer. Such costs also may be referred to as non-value
added costs.
Reduction in waste in labor and overhead costs through process improvement
generally results in shorter lead time (e.g., the time for a new item entering
the
microeconomic process to transition into a completed work item ready for the
customer). The lead time also may be referred to as the cycle time. Such
reductions
in waste in labor and overhead costs may be achieved through conventional
techniques such as Lean Six Sigma, Complexity Reduction, and Fast Innovation.
Shorter lead time may result in lower total cost. Reduction in total cost
resulting from
19
CA 02681641 2009-09-17
WO 2008/116110 PCT/US2008/057734
ATTORNEY DOCnr, i
shorter lead time is observed in both transactional (non-manufacturing)
microeconomic processes such as, for example, product development, marketing,
planning, and budgeting and in manufacturing microeconomic processes.
Because the lead time of a process may be found empirically to drive process
cost, analysis of the contributors to lead time leads to insight into the
process cost.
The average lead time of a process is governed by Little's Law. The lead time,
per
cycle of production, from injection of work into a process to that work's
completion is
reflected in Equation (11):
Number of Units of Work In Process W
Lead Time of any Process= _-= i= time/cycle
Average Completion Rate D
(11)
As an example of Little's Law, if a process has WIP (WIP) of fifty units and
has an average completion rate of two units per hour, then the average time
for a unit
of WIP to transit the process is reflected in Equation (12):
Lead Time of Process 50 units = = 25 hours
2 units/hour
(12)
Thus, in the above example, a manufacturing cycle is completed every twenty-
five hours. In a transactional process, the average completion rate can be
measured in
number of tasks completed per unit time. The average completion rate, D, in
Equation (11) is, on average, equal to the customer demand rate, and hence is
exogenous to the process. The WIP in Little's Law is a dimensionless numerical
quantity. For example, WIP may be the number of units, rather than dollars of
cost or
revenue associated with each of the units. Although the WIP may include a
variety of
different items having different completion rates, the average completion rate
D
governs the lead time of the process. Moreover, Little's Law is distribution
independent. Thus, regardless of whether task completion times follow a
Gaussian
distribution as in manufacturing, a Rayleigh distribution as in product
development,
or whether arrivals/departures are Poisson can be irrelevant to lead time.
CA 02681641 2009-09-17
WO 2008/116110 PCT/US2008/057734
ATTORNEY DOCnr, i iv U.: i Z-)a i- i i~+vv v i
To discover if entropy exists in microeconomic processes, a derivation of
Equation (9) can be followed. Little's Law can be transformed into a velocity
equation by inversion as reflected in Equation (13):
Average Completion Rate 1 D
Process Velocity = v= = cycles/unit time
No. of Units of Work In Process i W
(13)
This velocity represents the number of manufacturing cycles completed per
unit time, or in the case of product development the number of design cycles
per unit
time. The velocity is inversely proportional to the WIP, W, and directly
proportional
to the average completion rate, D. A pull system can be established such that
not only
the average completion rate, but also the instantaneous completion rate is
equal to the
market demand. As noted above, the average completion rate, D, is a constant
exogenous variable driven by the market during periods comparable to the lead
time.
As a first approximation, it can be assumed that the average completion rate,
D, is constant. However, in some implementations, a variable average
completion
rate, for example, may not affect the derivation of the equation of projected
cost
reduction. The rate at which the velocity of a process in Equation (13) is
accelerated
is related to the rate at which WIP, W, can be reduced, assuming that the
average
completion rate, D, is constant. Thus, the decrease in WIP over a unit time,
which
may be expressed as -dW/dt, is a factor in the force shortening the process
lead time,
e.g., accelerating the velocity of the WIP. Taking the first derivative of
Equation (13)
as reflected in Equation (14):
Process Acceleration = a = dv - D dW cycles/hour/hour
dt W Z dt
(14)
Equation (14) is the acceleration of the velocity with which the WIP completes
a cycle of production. The role of the factors in Equation (14) is discussed
in the
following. A reduction of WIP can accelerate the process, hence this factor
can be
related to an external force applied by process improvement which reduces WIP
while
21
CA 02681641 2009-09-17
WO 2008/116110 PCT/US2008/057734
ATTORNEY DOCnr, i iv U.: i Z-)a i- i i~+vv v i
maintaining D constant, hence accelerating the process velocity expressed in
Equation
(13).
The term "inertia" generally means "the innate force possessed by an object
which resists changes in motion." The greater the inertial mass, the less will
a body
accelerate under a given external force such as -dW/dt. According to Equation
(14),
it can be concluded that, for a given magnitude of force -dW/Dt, the larger
the W2, the
smaller the acceleration of the process. In statistics, the Probability Mass
Function
has the characteristics of Mass. W2 may be associated as having the
characteristics of
the inertial mass of the process. One might intuitively expect the inertial
mass of a
process to be directly proportional to W. However, each unit of WIP can
advance
through the process on average if all units of WIP ahead of the unit of WIP
also
advance, as well as all those units of WIP behind the unit of WIP. Thus, each
unit of
WIP is, on average, coupled to all the other units of WIP in the process
through
Little's Law. This coupling is analogous to an inductor, in which each turn is
coupled
to all the other turns in the inductor, leading to self inductance
proportional to the
square of the number of turns rather than directly with the number of turns.
WIP W is
a dimensionless number, as is the inertial mass of a process, W2.
However, unlike the dynamics of particles, the acceleration of WIP is
determined, not by its mass in kilograms, but by the total number of units of
WIP in
the process. Because the inertial mass of a mechanical body is measured in
kilograms, the word "mass" cannot be used in its technical sense to describe a
process. Therefore, a distinction may be made between mechanical inertial mass
and
process inertial mass, and the term "Prinertia" may refer to process inertia,
or process
inertial mass, as expressed in Equation (15):
Process Inertia = Prinertia = W2 = MM = MassXficroeconomic
(15)
In Equation (15), a microeconomic analogy can be denoted by the subscript
M.
Thus, W2 may be considered the Prinertia of a process, and may be used to
determine whether the derivation thus far is consistent with Newton's Second
Law.
22
CA 02681641 2009-09-17
WO 2008/116110 PCT/US2008/057734
ATTORNEY DOCnr, i iv U.: i Z-)a i- i i~+vv v i
Momentum can be determined by using Equation (13), v=D/W and Equation (15) as
reflected below in Equation (16):
Momentum=p=Mv=W2(w) = DW
(16)
Using the Variational Principle known as the Principle of Least Action, p and
v can be considered to be independent variables in phase space that take on
the values
pivi at t; and pfvf at tf. Therefore, action can be reflected as shown in
Equation (17):
tf tf
Action= pvdt= DWw)dt = D 2 (tf-t)
ti ti
(17)
Because Equation (17) includes all constants, and D is an exogenous constant,
a variation in action may be reflected as shown in Equation (18):
tf tf tf
A(Action) =0=0 pvdt= JA(D2)dt)dt = J(o)dt =0
tr ti ti
(18)
Because, as shown in Equation (18), the variation in action is zero, the Euler-
Lagrange criterion is satisfied, and Newton's Laws are the equations of motion
of a
process.
While the role of W2 and -dW/dt in process acceleration is shown above, the
role of the D factor, unit demand per unit time, is discussed in the
following.
Equation (14) may be parsed in two ways. To determine whether the D factor in
Equation (14) is part of force -dW/dt or Prinertia W2, the "energy" to
accelerate the
WIP from the initial velocity to a faster velocity can be calculated. The
resulting units
of measure of "energy" expended by the external force can be in appropriate
units of
i/2(Mv2). The parsing of Equation (14) which fails to achieve this criterion
can be
23
CA 02681641 2009-09-17
WO 2008/116110 PCT/US2008/057734
ATTORNEY DOCnr, i iv U.: i Z-)a i- i i~+vv v i
rejected. This will thus determine if the D factor is part of Force or
Prinertia. Given
that M =W2 is dimensionless in a process, process energy can be measured in
terms of
a velocity squared which is (units/unit time)2 , as reflected in Equation
(19):
1z
~~Mv2 [W2
12 (w J= 12(D2)
(19)
In some examples, for the kinetic energy of moving WIP, the term "energy"
may not be used in its strict technical sense since energy is typically
measured in
Joules. Moreover, the Joules expended on WIP, and likewise the dollar value of
WIP,
may have nothing to do with the velocity of WIP, which is governed by Little's
Law,
as shown in Equation (11). Therefore the term Process energy or "Prenergy" can
be
used to describe the process equivalency to i/2(Mv2) that results from the
external
force of process improvement. A unit of WIP can be followed down the process.
Process improvement may include continually reducing setup time, batch size
and,
hence, reducing WIP, W. In a unit of time, dt, the unit of WIP can, on
average, be
slightly accelerated as it moves a distance, ds, through the process, reducing
ti, hence
increasing the number of production cycles per unit time.
The amount of "Prenergy" applied by the external force of improvement in
accelerating the WIP is reflected in Equation (20):
Sf
APrenergy = f Fds
si
(20)
However, if v is the velocity of the WIP then ds=vdt, and with a D factor in
Force, MM --->Prinertia = W2 which is dimensionless since W is a dimensionless
number, then, as reflected in Equation (21):
F DdW
dt
(21)
24
CA 02681641 2009-09-17
WO 2008/116110 PCT/US2008/057734
ATTORNEY DOCnr, i iv U.: i Z_)a i- i i~+vv v i
With v=DIW and ds=D/Wdt, where ds is movement down the process from
one workstation to another, therefore a change in Prenergy is reflected in
Equation
(22):
Wf
APrenergy = f Fds = (-D ~W )(w dt~ = D2 w = -D2 (logWf-logWi)
si wi
(22)
Equation (22) includes the correct units of measure per Equation (19). Other
parsings of Equation (14) between mass and force do not necessarily yield the
correct
units of measure. The right-hand side of Equation (22) resembles the energy
expended by an external force in the compression of an ideal gas at constant
temperature per Equation (9) with D2 tentatively taking the place of
temperature,
because n and R are constant and not parameters of the isotherms as is
discussed more
fully below. The second factor on the right-hand side of Equation (22) is
tentatively
the entropy change of an economic process at constant temperature. D in
Equation
(22) is a parameter, rather than a universal constant.
To investigate this new form of external expenditure of process improvement
energy D2logW, -logW can be computed to determine its relationship to process
improvement, entropy, and information. When the total WIP, W, of a
manufacturing
process or transactional process is examined, it can include Q different types
of items
or sub-products in process, or different tasks not yet completed. Then, as
reflected in
Equation (23):
Q
W = wl + wa+...wewi
~-~
(23)
In Equation (23), w; is the number of units of the ith subproduct or task type
in
WIP. An expression can be derived for Q = 2, as shown in Equation (24) and
then
generalized, as shown below:
CA 02681641 2009-09-17
WO 2008/116110 PCT/US2008/057734
ATTORNEY DOCnr, i
W = Wi+ W2
(24)
Thus far the natural logarithm logW=logeW has been used. The
log2W=1.441ogeW can be used, along with the conversion factor where needed.
This
allows results to be stated in bits rather than nats. Therefore, as reflected
in Equation
(25):
Wl+W2 wl W2 W1 1 W2 1
logzW = W log zW = W logzW + W logzW = W logz W- W logz W (25
)
When adding 0+0, as reflected in Equation (26):
wl 1 W2 1 wl wi w2 W2
logaW = - -loga - I --loga - 1+ -logawI --logawI + -logawa--logawa (26
W W W W W W W W
)
Then, as reflected in Equation (27):
wi wi wa wa wi wa
logaW =- w loga w- w loga w+ w logawI + w logawa
(27)
Equation (27) can be generalized from Q=2 to Q different types which
comprise W by defining the probability that a unit of WIP is the i th product
as
p;=w;/W, as reflected in Equations (28) and (29):
Q Q Q
logzW= -~ pdogzpi + pdogzW = HQ + pdogzW
(28)
26
CA 02681641 2009-09-17
WO 2008/116110 PCT/US2008/057734
ATTORNEYDOCnr,i ivu.: i~+vvvi
log2W=HQ +slogzwi
(29)
In Equation (29), s is the expectation, as reflected in Equation (30):
Q
slogzwi _ ~pdogzW
~-~
(30)
The term HQ of Equation (29), as reflected in Equation (31), may be referred
to as the Shannon Equation of Information in bits:
Q
- pilogzpi = HQ
~-~
(31)
The term HQ is also identical to the Boltzmann expression for thermodynamic
entropy, as reflected in Equation (32), with k = 1:
Q
S= -kpilogzpi
~-~
(32)
Thus, the nature of the work for the reduction of logW to accelerate the
process and eliminate waste is equivalent to the increase in information added
to the
process to reduce entropy. Shannon's equation of information is developed from
first
principles below. As shown above in Equation (31), HQ is entropy in bits, and
the
term slogzw;, as reflected in Equation (33), can also be represented by bits:
Q
pilogzwi
~-~
(33)
Hence Equation (29) can be defined as the Generalized Entropy of a Process.
27
CA 02681641 2009-09-17
WO 2008/116110 PCT/US2008/057734
ATTORNEYDOCnr,i ivu.: i~+vvvi
The role of each term in Equation (31) can be explained as follows. For
example, if it is assumed that each of the Q items of WIP, W, had about the
same
quantity of units w; - W/Q. Then the probability of occurrence of the i th
item is
p;-w;/W=1/Q and, as expressed in Equation (34):
HQ =-Lpilogapi =-Z 1 loga 1=- 1 loga + 1 loga 1 Q terms =1og2Q
i-1 i-1 Q Q Q Q Q Q)...
(34)
Therefore, H represents the variety of internal products in WIP to deliver m
different end products to the customer. H can be reduced by reducing
complexity, Q,
through internal standardization. For example, a company reduced the number of
internal part numbers to produce a fixed external product line from
approximately
Q=1000 to 260. For approximately uniform usage, HQ-logz1000, whereas
Hi,tr,,,s,c-logz260, where Intrinsic refers to a minimum irreducible set of
components.
In addition, the reduction of complexity, Q, reduces the entropy due to the
second
term in Equation (29). The gross profit margin increased from 18% to 37% as a
result
of the reduction in complexity. The larger is Q and H, the more setups may be
required to meet demand, hence the greater the non value add cost of setup
time, and
accompanying scrap as well as the cost of tooling and dies. Value add costs
add a
form, feature or function valued by the customer. All else can be waste, such
as for
example, the cost of setup, scrap, rework, warehousing, distribution, labor
and
overhead cost. The minimum amount of non value add cost is determined by the
Value Stream Mapping process. As Q is reduced, more volume is driven through
fewer part numbers leading to lower procurement costs, with similar impact on
non-
manufacturing processes.
The second term in Equation (29) can similarly be understood. Assuming that
p;-1/Q, w;-W/Q, then as reflected in Equation (35):
ElogaW p logaW ( ~ )oga (~ )_ ( ~ )10g2(W + -Qterms =1oga ~ WQ
(35)
28
CA 02681641 2009-09-17
WO 2008/116110 PCT/US2008/057734
ATTORNEYDOCnr,i ivu.: i~+vvvi
Therefore the second term, 81og2w;, can represent the log of the average
amount of WIP per part number. Thus the larger the term slogzw; is, the larger
the
waste due to, for example, scrap, rework, obsolescence, maintenance of
warehouses
and distribution centers, transportation costs, and IT systems, and all
related indirect
personnel to control and store all the material as well as expediting expense
to
compensate for long lead times. In manufacturing, the term Clogzw; may be
primarily
driven by setup time, machine downtime, and quality defects.
For example, material cost of a product can be fixed. However, complexity
reduction can drive the unit volume of each component up, thus reducing
procurement
and purchase cost. Scrap and rework costs can fall in direct proportion to WIP
because less material is at risk prior to usage and test, and the resulting
shorter lead
time results in more cycles of learning and improvement. In addition, shorter
lead
time can lead to less fixed capital investment and working capital costs. In
some
material or energy intensive industries there may be a "plateau" on which the
potentially WIP sensitive cost rides. The thermodynamic distinction between
costs
that can and cannot be removed is further discussed. As a conservative
estimate, the
WIP sensitive costs include the total cost of labor, overhead, and quality as
well as the
cost of capital, to name a few examples. In the analysis that follows, costs
related to
WIP can be susceptible to major reduction, be they manufacturing or
transactional.
Irreversibility can enter into microeconomic processes. The purchase of raw
material can be so negotiated that untouched material can be returned to the
supplier
for a small "restock" charge, and hence the procurement process is an example
of a
nearly reversible cost. The cost of raw material is thus analogous to the
inevitable
losses in a Carnot cycle engine.
Once raw material is injected into a manufacturing process, labor and
machinery transform it into intermediate states that can exit as finished
goods and be
sold to a customer. Otherwise the cost of the WIP can be recognized as waste.
The
manufacturing process, and indeed any process can therefore be entirely
irreversible.
A single item of raw material may take on Q different part numbers in WIP, and
the
total amount of material w; in WIP may be much larger than in raw material.
This
greatly increases the entropy in Equation (29). Thus the increase in entropy
is due to
the irreversibility of WIP and is analogous the free expansion of a gas as
initially
29
CA 02681641 2009-09-17
WO 2008/116110 PCT/US2008/057734
ATTORNEYDOCnr,i ivu.: i~+vvvi
discussed in Equation (3). The goal is to reduce WIP to the minimum using
process
improvement.
In the example above, the costs of complexity can be reduced through
engineering and design choices. Such choices may be considered to add
information
that reduces the entropy (related to number of internal choices) to produce
the same
external product line. The added information can reduce both the material cost
(for
example, due to higher volume per part) and lower labor cost (due to, for
example,
fewer setups, less scrap, fewer "stock outs" and downtime, simplified stock
control,
and standardized assembly and test procedures). The residual irreversible
costs
related to the large WIP can be eliminated by reducing setup time, processing
time per
unit, scrap and rework using Lean Six Sigma process improvement tools, for
example.
To reduce irreversible costs that can be avoidable waste, the relationship
between process improvement and resulting WIP can be examined. These
relationships are presented for both manufacturing and non-manufacturing
processes,
discussed below.
Two principal expressions for the calculation of WIP as a function of demand
per unit time and process parameters have been derived. The minimum WIP in a
factory has been derived, and a representative equation shown below as
Equation
(36):
FactoryWIP > QAsD +QA ,
1-X-~D
(36)
where s represents setup time, A represents a number of workstations in the
process,
X represents a defect rate, Q represents the number of internal part numbers,
D is
demand per unit time (e.g., month), and ~ represents a processing time per
unit.
Reducing the number of different internal part numbers, Q, by 50% reduces WIP
by
50%. For example, the actual WIP in a factory can be 10-20 times the minimum
of
Equation (36).
The cause of this massive WIP can be due to scheduling policy such as using
the economic lot size formula for batch sizing as is done by many Enterprise
Resource
Planning (ERP) programs. This effectively disconnects WIP from immediate
actual
CA 02681641 2009-09-17
WO 2008/116110 PCT/US2008/057734
ATTORNEYDOCnr,i ivu.: i~+vvvi
market demand. The reduction of WIP is possible due to the improvement
process,
principally due to the implementation of pull systems to synch up WIP with
demand,
followed by reduction setup time, s, and defect rate, X, through Lean Six
Sigma and
the number of different internal part numbers, Q, through complexity
reduction.
Traditional manufacturing engineering focused on reducing processing time per
unit,
~, often through time and motion studies and automation. Finally as the setup
time, s,
approaches zero, WIP approaches the product of the number of internal part
numbers,
Q, and the number of workstations, A. Hence, the independence of WIP from
changes in demand, D, holds throughout the improvement process. Similar
conclusions may be drawn from transactional processes discussed below.
A conclusion is that WIP, W, and, hence, w; and F-logw;, are driven by process
improvement and are virtually independent of demand, D, until WIP --->QA.
H,",,,pieR,ty
is driven down by complexity reduction initiatives and is independent of
demend, D,
for all levels of demand. In general, Q is directly proportional to the number
of
external part numbers, m, shipped to customers.
If the setup time, s, can be driven toward zero, then according to Equation
(37), below, w;=1, and because log(1)=0:
w_2H+810g2w: = 2H 2Elogzwi = 2H 20 = 2H
(37)
In such an instance, there is one unit per part number hence p; =1/Q, H=1og2Q
and W-->QA in Equation (36). In this instance logQ--> Entropy H. Generalized
entropy logW>H and hence in general is larger than log of the number of
accessible
states (the definition of entropy) of the market which will be studied below.
In a microeconomic process in which the customers are not offered a
selection of products, and each workstation produces only one part, the setup
time, s,
in Equation (36) is zero and logQ=H. Thus, adding information to the process
to
reduce setup time and defects reduces generalized entropy and waste.
A transactional (non-manufacturing processes) such as product development,
marketing, and planning, generally does not have the opportunity to batch
identical
items. In non-manufacturing processes, the Clogzw; term is primarily driven by
defects and non- value-added costs rather than setup time. The WIP in a
transactional
31
CA 02681641 2009-09-17
WO 2008/116110 PCT/US2008/057734
ATTORNEYDOCnr,i ivu.: i~+vvvi
process is approximated by in Equation (38), a fundamental equation of
transactional
processes:
1 ~ p~ {l+Z}~ Cs~+CA~
WIP = No.of Tasks In Process K+l 1 p{l+Z} ~ 2
(38)
In Equation (38), p represents a percentage of maximum capacity utilized, K
represents a number of resources cross trained, Z represents a percentage of
defectives
that can be reworked, Cs represents a coefficient of variation of time to
perform tasks,
CA represents a coefficient of variation of arrival of tasks, and C is
represented in
Equation (39):
C 6=1 Standard Deviation
,u=Mean Time
(39)
The application of Equation (39) to process improvement is first applied to
the
product development process. The challenge in applying Lean Six Sigma and
complexity reduction to transactional processes is the near complete absence
of
process data. Even the application of Little's Law is hampered by the lack of
data on
average completion rate and number of units of WIP, data that is commonly
available
in manufacturing. However, the widespread training in Lean Six Sigma
principles
created the capability to capture and use this data in non-manufacturing
processes. A
conclusion is that large WIP can be due to a bad process and causes waste.
However,
less apparent is the impact of internal complexity upon waste which is the
subject of a
case study below. Both forms of waste can be comprehended in a theory of
microeconomic waste.
Entropy has connections with initiatives such as Lean, Six Sigma and
Complexity reduction. These initiatives inject information into the process,
and that
information can be negative entropy which reduces waste. Information, which
may
be represented by the term I, conveys something unexpected or previously
unknown.
For example, information that there is there was four feet of snow on the
ground in
32
CA 02681641 2009-09-17
WO 2008/116110 PCT/US2008/057734
ATTORNEYDOCnr,i ivu.: i~+vvvi
Dallas on a July day, this highly improbable event would be unexpected, and,
hence,
convey huge information.
Therefore, the amount of information is inversely related to the probability
of
the event. Additionally, regardless of the functional form of the information,
if two
independent events, a first event and a second event, occur, the total
information is the
sum of the separate information of the first event (information h) and the
second
event (information Iz). But the probability of the first event and the second
even both
occurring is the product of the probability of each individual event
occurring. The
probability of the first event occurring may be represented by pi and the
probability of
the second event occurring may be represented by P2. Thus, the probability of
both
the first event and the second event occurring may be expressed as p1&z= pipz.
So
some function is necessary for information, I, such that: h&z (pipz)
=h(pi)+Iz(pz) and
the function that satisfies this requirement is I=1og(p) since log(pipz)
=1og(p1)+log(p2). Therefore, I(p)=1og(p). But because it is desirable that the
information to be larger if the probability of occurrence is smaller, we will
define
I(p)=1og(1/p) = -log(p), which still satisfies
1og(1/pip2)=1og(1/pi)+log(1/p2). The
average amount of information among N choices is the sum of the probability of
each
choice times the value of each choice, as reflected in Equation (40):
N N
H= Y p I= Y
pilogzpi
(40) Equation (40) is known as the Shannon equation of
Information. Note that it is similar to the entropy of statistical mechanics,
as reflected
in Equation (41), but with k = 1:
N
S= -ky pilogzpi
~-~
(41)
The thermodynamics of process velocity yields k=1 automatically. Hence,
microeconomic processes are accelerated by the addition of information. It can
now
be shown how the market place transmits information to the company. For
example,
a company produces two products, product 1 in quantities di per month, and
product 2
in quantities d2 per month, where di + d2 = D total units produced per month.
The
33
CA 02681641 2009-09-17
WO 2008/116110 PCT/US2008/057734
ATTORNEYDOCnr,i ivu.: i~+vvvi
actual demand of the market for the two products is random, and results in a
variety of
possible sequences such as:
1121221122212212
2211212211121221
2122122111211212
The market makes N choices monthly (in this example, the unit of time is a
month) of
either 1 or 2. Each sequence is a state of the market or complexions. The
number of
distinct sequences or "messages" sent by the market, to be satisfied by the
company,
is calculated by the combinatorial formula as reflected in Equation (42):
D! D D!
Number of Distinct Messages=M= = I I _
di!dz! di dAD-di)!
(42)
By taking the logarithm of the number of states, which in the microeconomic
case is the number of distinct messages from the market, then according to
Stirling's
formula, to first order, as reflected in Equations (43) to (47):
logaD! - Dlog2D-D
(43)
D=(D-d,)+d, =dz+d,
(44)
logaM=(DlogzD -dilogzd,-(D-di) logz(D-di))
(45)
log2M= (((D-di)+di) logzD -dilogzd,- (D-di) logz (D-di))
(46)
34
CA 02681641 2009-09-17
WO 2008/116110 ~PCT/US2008/057734
ATTORNEYDO nr,i
logaM=- (D-di)logz D-Ddi+ n,log2 dD'
(47)
By multiplying by D/D, Equation (48) is obtained:
log2M=-D (~d') logz(~d')+ (dD')log2 (dD')
(48)
If pi=di/D, and pz=(D-di)/D, then Equation 49, below, is obtained:
m
logzM=D(-{pllogzpl+pzlogzpz})-->D {_Pilo2Pi =DHm
~-~
(49)
For m products, and M=2Dx"'= Number of Distinct Messages M due to m
different products. Shannon's equation for Information emerged naturally. The
market is making D variety choices per month, selected from one of the m
products,
each of the D events per month containing information of H,,, bits. The M
messages
per month corresponds to the number of unique states per month, as reflected
in
Equation (50):
m
Hm= -Y pilogpi =Shannon Information in Bits per Choice
~-~
(50)
Therefore, the Transmission Rate of Market is reflected in Equation (51):
Transmission Rate of Market --> DHm Choices Bits Variety Bits per Month
Month Choice
(51)
CA 02681641 2009-09-17
WO 2008/116110 PCT/US2008/057734
ATTORNEY DOCnr,i ivu.: iZOa i-i i~+vv vi
Thus the market is acting like a communication system, transmitting DHM bits
of information per month about the variety of products the market wants to buy
that
the company presently offers. For example, initially the market may demand
utility
transportation and an automaker may respond with m=1 in the form of a single
automobile offered by the automaker. As tastes evolve, the market demands more
variety, e.g., m of five or more, and the original single automobile offered
by the
automaker becomes obsolete. Thus, the market began sending more complex
messages,.
The goal is to reduce WIP, W, such that the amount of information in a factory
is equal to that needed to produce any part number or number of choices
demanded by
the market, and no more. The production of m different end items needed to
compete
with, for example, another auto manufacturer may require Q different items of
WIP.
Each of the choices the market makes per month carries H,,, bits of
information, as
shown in Equation (51), which translates to HQ bits of internal information.
A conclusion is that entropy, H,,,, flows from the marketplace to the company
through the revenue stream. The company responds to input H,,,, transforming
the m
different products desired by the marked to Q different subsystems with
corresponding entropy of component variety HQ. The internal processes add
total
entropy HQ - Hintrinsic +Clogzw;. Lean Six Sigma initiatives drive Clogzw; ---
>0 by
driving w; --->1. Through Complexity reduction initiatives, HQ is driven down
to
H,,,tr,,,s,c by eliminating Hco,,,pieR1ty thus achieving the minimum
irreducible set needed
to produce m different external products for customers. Although Hintrinsic
may not be
known, differences in entropy may be sufficient for this purpose. Therefore,
as
reflected in Equation (52):
Generalized Entropy =1ogW= Hint6nsic+HcomPIexity+Flogwi
(52)
Thus, the company draws in entropy H,,,, the operations process expands the
drawn in entropy to H,,,tr,,,s,c +waste, and compresses H,,,tr,,,s,c to H,,,
and expels H,,, as a
product. The connection between revenue and the internal process is H,,,, and
the
36
CA 02681641 2009-09-17
WO 2008/116110 PCT/US2008/057734
ATTORNEY DOCnr,i ivu.: iZ_)a i-i i~+vv vi
response of the process in creating total entropy which in turn increases the
cost per
unit.
A goal of process improvement in general is to reduce the addition of process
entropy due to complexity, setup, quality defects, to name a few examples, and
its
associated waste to zero. The equality of input and output entropy corresponds
to
maximum efficiency for a given Q.
In Equation (36), an interpretation has been developed in which the two
sources of waste, complexity and process deficiencies (setup, defects, etc)
appear co-
equally important. The internal entropy of a process has now been determined.
The
internal temperature of the process as D2 in Equation (22) has been derived
from
Little's Law which is independent of dollars of cost or revenue. To determine
the
waste that can be eliminated and apply Equation (3); Tc, the external cold
temperature
related to the cost of the process can be determined, which when multiplied by
the
generalized entropy will yield the waste in a process. The external
temperature of the
Revenue (hot source) and the Cost of Goods Sold (cold sink) can be computed
using
the general thermodynamic relation between entropy and energy. From
thermodynamics, as represented in Equation (53):
aEntropy _ 1
aEnergy )vN Temperature
(53).
Below, it is shown that TReõeT11,e=r=revenue per unit, and Tcost=c=avg cost
per
unit.
Both r and c are intensive variables as is Temperature, whereas entropy and
WIP are
extensive variables. The cost per unit c are those costs susceptible to
reduction by WIP
reduction. Again, as a conservative estimate, these costs can include the
total cost of
labor, overhead, and quality as well as the cost of capital, to name a few
examples and
provide a starting point. In most cases we have found that the cost of
material is
similarly susceptible to reduction through complexity reduction. Virtually all
of the
entropy in WIP is irreversible in analogy with the free expansion of a gas. In
Equation
(9), the conversion of internal entropy to waste in an external heat sink was
through nR,
with n being the number of moles and R being the gas which was experimentally
37
CA 02681641 2009-09-17
WO 2008/116110 PCT/US2008/057734
ATTORNEY DOCnr,i ivu.: iZOa i-i i~+vv vi
determined. Because c is the cost per unit, set n=1 and determine the coupling
of
internal entropy to an external heat sink through the experimentally
determined value
Re. Therefore, an equation for the waste in a microeconomic process subject to
experimental verification may be determined. From Equation (9) it may be
determined,
as reflected in Equations (54) and (55), that:
Waste in a Thermodynamic Process 3= nR (Cold Temp) (Entropy) = nRTc1og(Vf /
V,. ) (54)
Waste in a 1VTicroeconomic Process =(Re)(c) (gen entropy) 3=(Re)clogz (Wf /
W)/ unit (55)
The value of Re= the Gas Constant of microeconomics, measured in reciprocal
bits, may be determined empirically. Therefore, a guiding principle is that
the
reduction of generalized entropy is a key to the elimination of microeconomic
waste
and increase of profit just as reduction of entropy is the guiding principle
of heat
engine design. An Equation of Profit is reflected in Equation (56):
Increased Profit = AProfit = (Waste ) iiuai- ( Waste ) Fin.i
(56)
As Equation (36) shows, if a lean initiative is launched and the volume and
related
revenue doubles setup times were cut in half, the total WIP and hence waste
can remain
constant. Thus, the same amount of waste can be spread over twice as much
output.
Therefore, changes in revenue can be corrected for by multiplying final WIP by
a
correction factor aR as shown in Equation (57):
aD _ (Demand/unit time) initii
(Demand/unit time) an.i
(57)
When several periods are compared from an initial condition, the initial
starting point in the numerator can be fixed with subscript 1, and subsequent
periods
in the denominator can bear their period number. For example, item 4 of Table
1
38
CA 02681641 2009-09-17
WO 2008/116110 PCT/US2008/057734
ATTORNEY DOCnr,i ivu.: iZ-)a i-i i~+vv vi
shows that the ratio of WIP in each period is the ratio of the WIP in the
period to the
WIP in the first (or initial) period.
Because demand per unit time may not be readily available, revenue can
generally be used as a surrogate, and per Equation (36), the same factor
applies to
change in complexity c;=cost per unit initial, cf--cost per unit final, as
reflected in
Equations (58) to (60):
ci - cf = AWaste = Reci (logWi-logWf )
(58)
cf = ci - Reci (logWi-logWf )
(59)
AProfit/unit = ci -cf =Reci (logWi-logWf ~
(60)
With the revenue correction factor, equations of projected cost reduction can
be determined, as reflected in Equation (la) and (61):
Cost/Unit as % of Initial =~ f =1+Relog ~aDWf ~ W (1a)
ci
A$Profit/unit output =Re($ci) (logWi-log(aDWf
(61)
For these equations to be useful to predict potential cost reduction due to
process improvement, the magnitude of Re can be estimated as shown in the
following
case studies.
In a example, a $2.3 billion revenue computer products company is losing
money on a product line that includes m;,,;t;ai =3500 different end items.
From
Equation (36) it is known that the number of internal part numbers, Q, is
proportional
to the number of external part numbers m shipped to customers. Hence, cutting
m in
half cuts the number of internal part numbers, Q, and hence WIP in half. The
new
39
CA 02681641 2009-09-17
WO 2008/116110 PCT/US2008/057734
ATTORNEY DOCnr,i ivu.: iZ-)a i-i i~+vv vi
CEO reduces the number of part numbers offered to customers to mf,,,ai =499.
The
gross profit increases from 32% to 43%, due to a 32% reduction in labor and
overhead
cost. Table 1 illustrates the relevant data.
Table 1
Parameter Year 1 Year 2 Year 3
(i=1) (i=2) (i=3)
1. Number of External Products, m 3500 2300 499
2. Revenue in Millions of Dollars 2300 3200 4000
3. aD=(Demand)i/(Demand); 1 0.72 0.58
4. WIP,/WIPi 1 0.59 0.14
5. aD (WIP,/WIPi) 1 0.43 0.08
6. Qi = (COGS% of Revenue);/(COGS% of 1 0.96 0.83
Revenue) i
Referring to FIG. 4, a graph 400 illustrates an example relationship between
cost reduction versus reduction in WIP. In particular, the graph 400 depicts a
cost
reduction vs. WIP reduction (item 5 vs. item 6 in Table 1). A curve 410 shows
the
relationship between cost reduction and WIP reduction for this example. The
curve
410 may be fit to data points 415a, 415b, and 415c, which are fit to an
equation 420.
In this example, the equation 420 has a coefficient of 0.065 for the natural
log,
converting this to logz using logzX =(logeX)(logze),and since log2e=1.44 we
have,
according to Equation (1), Re = (0.065)(1.44) = 0.093, as a first estimate of
the gas
constant of a microeconomic process. Return on investment of the initiative in
this
case study is approximately 300% per year.
In a second example, a company produces m=168 different products with an
average cost per part of $50 and operates at 10.5% Gross Profit Margin (GPM).
Because internal components are quality tested and approved by clients,
negligible
opportunity for internal complexity reduction exists. Rather that waste has to
be
eliminated via classical system lead time reduction. It is estimated that cost
of goods
sold could be reduced 3%, whereas actual cost is reduced by 8%. The lead time
is
reduced from 14 days to 4 days resulting in major revenue growth. The result
of cost
reduction and revenue growth resulting from lead time reduction results in
earnings
CA 02681641 2009-09-17
WO 2008/116110 PCT/US2008/057734
ATTORNEY DOCnr,i ivu.: iZ00i-i i~+vv vi
before interest, taxes, depreciation, and amortization (EBITDA) growing from
$10.4
Million to $46.7 million in three years. In particular, the setup time at key
workstations was reduced from an average of 2 hours to approximately 10
minutes,
the resulting gross profit margin increased from 12.0% to 19.5%, the operating
margin grew from 5.4% to 13.8%, sales grew from $144 million to $311 million
per
year, cost of goods sold rose from $127.4 Million to $250.6 Million, and the
product
complexity remained approximately constant. Table 2 illustrates the relevant
data.
Table 2
Parameter Year Year Year 4
1 2 3 (i=4)
(i=1) (i=2) (i=3)
1) Number of External Products, m 168 155 170 175
2) Revenue in $Millions 144 191 246 311
3) aD = Demand;/Demandi 1 0.75 0.58 0.46
4) WIP,/WIPi 1 0.96 0.96 0.57
5) aD (WIP,/WIPi) 1 0.72 0.56 0.26
6) Qi = (COGS% of Revenue);/(COGS% of 1 0.98 0.97 0.91
Revenue) i
Referring to FIG. 5, a graph 500 illustrates an example relationship between
cost reduction versus reduction in WIP. In particular, the graph 500 shows a
reduction of cost (item 6) vs. reduction of WIP (item 5). A curve 510 shows
the
relationship between cost reduction and WIP reduction for this example. The
curve
510 may be fit to data points 515a, 515b, 515c, and 515d, which are fit to an
equation
520. In this example, a second estimate of the gas constant of microeconomics
is Re =
(0.067)(1.44)=0.097.
As can be seen from the data, the actual reduction of Cost of Goods Sold is
8% and is consistent with the equation of projected cost reduction which
asserts that
waste is a function of logW. For large initial values of W, small changes in W
remain
in the flat area of the log curve 510. Dramatic reductions toward the origin
can drive
the log function down. This effect can be considered counterintuitive and
suspect
when first observed, and its best fit to a log function can be puzzling.
Notice that the
actual data shows that as W is initially reduced, the cost reduction is
modest. As W
41
CA 02681641 2009-09-17
WO 2008/116110 PCT/US2008/057734
ATTORNEY DOCnr,i ivu.: iZ_)a i-i i~+vv vi
approaches 35% of its original value, the cost suddenly falls. One of the
major items
of non value add cost that is eliminated is a warehouse comparable in size to
the
factory. The cost of the warehouse is fairly constant as WIP/part number fell.
When
WIP/part number and lead time fall to 35% of their original value, the lead
time is
such that the warehouse could be closed leading to a quantum of cost
reduction. Non-
value-added costs are often quantized, and this quantization can be the
phenomenological reason why waste reduction follows a log curve.
The cost reduction can proceed until the waste is removed and only the value
add cost remains. In a manufacturing process this sets Wf in Equation (22) at
Q. In a
transactional process this sets Wf at the number of workstation in the
process, e.g., the
one task or work unit per workstation. Equation (36) predicts that complexity
reduction which reduces Q is just as powerful as Lean initiatives which reduce
w;.
This is also evident from Equation (36) for factory WIP.
It can be shown that a microeconomic process is improved by the addition of
information. This can be illustrated with a specific example which relates
process
improvement to information. For example, when processing in batches of
quantity B,
an amount of information is added by selecting a given product to setup and
run.
Assume that a factory includes A workstations, each of which processes on
average
Q/A = N part numbers. If there are N products produced at a given workstation,
the
decision to select one creates HN bits of information. However, the
probability is 1 of
running that product for the rest of B-1 units in the batch. Therefore, the B-
1 units
add zero information. As the setup time is cut in half, the batch size can be
cut in half
and still maintain the same production rate according to Equation (53). Now
however, information is added twice as often because the particular product of
the N
possibilities is selected twice as often. In general, the information supplied
to the
process is thus reflected in Equations (62) and (63): N Iv=Information in
production of N Products per month= B HN
(62)
B > sD +1
1-X- ;D
(63)
42
CA 02681641 2009-09-17
WO 2008/116110 PCT/US2008/057734
ATTORNEY DOCnr,i ivu.: iZ-)a i-i i~+vv vi
In Equations (62) and (63), s represents setup time, X represents scrap rate,
represents processing time per unit, D represents total demand in units per
unit time
(B can increase as a function of variation of parameters via simulations).
Therefore,
as reflected in Equation (64):
In,= N HN --> NHNass --> O
sD +1
1-X- ;D
(64)
For A workstations, AN=Q to produce m external products for customers, as
reflected in Equation (65):
ANHN --> QHN --> Hm
(65)
Thus a goal of the system is to respond "Just In Time" and produce what is
needed when it is needed is equivalent to an information flow within the
factory
which matches market demand. In regard to entropy due to average WIP, Lean Six
Sigma process improvement results in Equations (66) and (67):
Si,~tia, - Sfi-d = cokwsQ ( logz%n..~ - log2w;5n.)
(66)
S~ritia1D 55na1D
S~;ti~ - S~~ = cokwse logz + 1- logz +1
(67)
Applying Lean initiatives such as driving s-->0 drives entropy related to WIP--
>O and
leaves the entropy related to H,,, due to the Complexity of parts. Applying
Six Sigma
to drive X--->0 can be of equal power. The addition of information by Lean Six
Sigma
as a means of reducing entropy is merely one example of a general theory
propounded
43
CA 02681641 2009-09-17
WO 2008/116110 PCT/US2008/057734
ATTORNEY DOCnr,i ivu.: iZ00i-i i~+vv vi
by the Physicist Leon Brillouin in which he coined the term Negentropy for
Information since it is Negative Entropy as is seen in Equation (90) as the
amount of
entropy subtracted by addition of process information. Although the specific
process
improvement tools change, the same conclusion can apply to transactional
processes.
For a manufacturing process the minimum WIP is Q, that is, one of every
internal
item necessary to produce the current mix of products. For a transactional
process the
minimum WIP is one task per step in the process, or A since there are A steps.
Operational Procedure to Predict Cost reduction due to Process Improvement
Estimation of Non-Value-Added Cost
A Value Stream Mapping process can determine the value-added and non-
value-added cost of the process. Value Stream Mapping includes walking the
flow of
the work-in-process and noting if each step adds a form, feature or function
without
which the customer will find the output unacceptable. The cost of those steps
that
meet this criterion are known as value add cost. Those steps which do not, in
whole
or in part meet this criterion, contain non-value add costs. The sum of these
non
value add costs will, according to equation (1) tend to zero as WIP falls
according to
equation (69) below. Most of the non-value-added cost resides in labor and
overhead
cost and can exceed 50% of those costs.
Measurement of Current WIP
The number of units of initial WIP, W;, at each workstation or node and
average completion rate can be determined. This information is typically
available in
manufacturing companies but can be gathered empirically in non-manufacturing
processes. The minimum WIP can also be defined as Wf = Qf (number of internal
part numbers needed to produce output after complexity reduction initiative)
in
manufacturing, and Wf = A the number of steps in a transactional process. If
the
company is experiencing growth, the Revenue;,,,t,al and Revenuefinal (after Y
years of
improvement) can be estimated to compute aD in Equation (57).
Defining the Maximum Cost Reduction Improvement goal
44
CA 02681641 2009-09-17
WO 2008/116110 PCT/US2008/057734
ATTORNEY DOCnr,i ivu.: iZ_)a i-i i~+vv vi
Given the data in Equation (3), the maximum profit improvement can be
computed that can result from process improvement, as reflected in Equation
(69):
Max % Reduction in Cost of Goods Sold = 1+Relog 2 UDWf
Wi
(69)
This value, multiplied by current Cost of Goods Sold, should be less than the
total
non-value-added cost defined on page 44 as a check on the data.
Cost of Process Improvement
The cost of achieving minimum WIP, Wf , or some practical alternative to
minimum WIP, can be the basis for a request for quotation to determine the
invested
Capital $C from the many process improvement consultants. The initiative
should
include Lean, Six Sigma, and internal and external Complexity reduction. As an
alternative, the company can consider the use of internal resources. Whatever
Wf is
chosen, the resulting percent reduction in WIP can be substituted into
Equation (69)
and multiplied by the current Cost of Goods sold to obtain the increase in
profit AP.
Return On Capital
The company can estimate the company's share price multiple M of earnings
before interest, taxes, and depreciation from the appropriate stock market
(M=14 for
the S&P 500 as of Oct 2007). The Return on Capital can be calculated, as
reflected in
Equation (70):
ROC % = M(OP) Y -1
C
(70)
CA 02681641 2009-09-17
WO 2008/116110 PCT/US2008/057734
ATTORNEY DOCnr,i ivu.: iZ-)a i-i i~+vv vi
If the ROC exceeds 100% per year it can more than justify management execution
of
process improvement on a risk adjusted basis. ROC %= 11% for the S&P 500 Oct
2007.
Guidance for Management
Complexity Reduction
Because of Equation (36) the impact HQ of the Cost of Complexity can be viewed
as
yet another source of profit improvement of equal magnitude to Lean Six Sigma
initiatives which reduce w;.
Greatest Gains can be from High Hanging, rather than Low Hanging Fruit
The equations of projected cost reduction, such as Equation (1), predict that
waste will follow a logW curve. Referring to FIG. 6, a graph 600 shows that
gains
from modest reductions of WIP can be negligible but a reduction of WIP of
greater
than 70% will yield significant returns per the Equations of Profit (e.g.,
Equation (1)).
Thus the "high hanging fruit" are biggest as is depicted by the log curve 610
and can
be limited by Wfinal.
Thus a goal to drive WIP to Q, that is one unit of each item, can be
understood. Using equations, one can conservatively estimate c as total cost
of labor,
overhead, and quality as well as the cost of capital per unit of output.
The market is transmitting DH,,, bits per month, per Equation (61). The
company receives information at this rate and may processes the information
per
Equation (1), for example. If the company can apply process improvement such
that
the rate at which the company internally processes information matches the
rate of
transmission from the market, related waste is eliminated. The system is
therefore a
process of maximizing the external entropy of the product offering so that it
responds
to the market subject to; of maximizing profit by the reduction cost by
process
improvement of complexity reduction and process improvement, and of increasing
revenue growth by expanding the profit frontier of offering complexity though
process improvement and rapid product development.
46
CA 02681641 2009-09-17
WO 2008/116110 PCT/US2008/057734
ATTORNEY DOCnr,i ivu.: iZ-)a i-i i~+vv vi
Referring to FIG. 7, a graph 700 shows how revenue varies between product
families for cumulative EBITDA 710, and cumulative revenue 720.
The overall goal of management can be to maximize shareholder value
through growth of economic profit, generally defined as operating profit less
cost of
capital. Increasing m, the breadth of the portfolio of products offered to
customers has
a higher probability of responding to market demand by increasing DH,,, in
Equation
(61), increasing revenue and potentially profit. Portfolio entropy H,,,
equates to the
market applying input entropy HQ to the process. Increasing m will, however,
increase internal complexity, Q, as well as w; in Equation (36) and hence
increasing
HQ and F-logzw; and hence increasing logzW and waste. The optimization process
can
involve maximization of economic profit subject to the increasing revenue less
increasing cost. At maximum, the next incremental cost of complexity due to
Q+1
can be greater than the resulting incremental economic profit. The
optimization is
driven by the forces of market demand and changes over time, an example of
which
was given in the discussion following Equation (61). Process improvement plays
the
pivotal role of allowing increases in customer portfolio m which reducing
waste
related to logW, as demonstrated by the large ROI of the case studies.
Companies report manufacturing WIP once per year in the inventory footnotes
of their financial statements (such as Internal Revenue Service "Form 10K" in
the
United States). However, companies do not report unit volume, but revenue data
may
be used as a surrogate for unit volume. In addition, companies do not report
and often
do not even capture the data on WIP or cost of transactional processes.
To obtain statistically significant data, WIP and unit volume can be measured
periodically (such as monthly) during an improvement process in both
manufacturing
and transactional processes and correlated with cost reduction. This can allow
the
value of the gas constant of microeconomic processes to be more accurately
defined,
to determine if the gas constant is universal for both manufacturing and
transactional
processes, and confirm, modify or confute the equation of projected cost
reduction.
In the next section, it is demonstrated that Shannon Entropy is proportional
to
Boltzmann Entropy, as expressed in Equation (71):
Boltzmann Entropy=S=klogS2, where S2=Number of distinct States
(71)
47
CA 02681641 2009-09-17
WO 2008/116110 PCT/US2008/057734
ATTORNEY DOCnr,i ivu.: iZ-)a i-i i~+vv vi
Assuming M=2 types of products where d;=number of the ith product shipped
in a month, and D=di+dz, then Equation (72) follows:
52= D! log S2 =1ogD!-logdi!-logd2!
di!dz!
(72)
In Equation (71) and Equation (72), the exclamation points represent
factorials. Stirling's approximation can be derived to second order from
Poisson
distribution as reflected starting in Equations (73) and (74):
logD!=D1ogD-D+ ~ log2~D
(73)
logS2=D1ogD-D+ ~ log2~D- dilogdi-di+ ~ log2~di~ - nalogda-da+ ~ log2~da
(74)
Since D=ni+nz, Equations (75) to (80) result:
logS2=D1ogD + ~ log2~D- nilogdi+ ~ log2~di~ - nalogda+ ~ log2~da~,.
(75)
logS2=D1ogD + ~log2~D -dilogdi -dalogda- ~log (2~dadi) now d2=D-di (76)
logS2=D1ogD + ~ log2~D-dilogdi- (D-di) log (D-di) - ~ log (2~{D-di}di)
(77)
48
CA 02681641 2009-09-17
WO 2008/116110 PCT/US2008/057734
ATTORNEYDOCnr,i
0 = -dilogD+dilogD
(78)
1ogS2 =(D-di)logD-dilog(~~-(D-di) 1og(D-di) -~1og(2~{D-di}di) +~1og2~D
(79)
1ogS2=-di1og(~~-(D-di)log ~d~~ -~log(2~{D-d,}d,) +~log2~D
(80)
Multiplied by D/D and defining pi, Equations (81) to (87) are obtained:
logS2=D ~- ~ ~ ~ log ~ D ~ ~ D-di ~ log ~ D-di ~ + 2D log2~D- 2D log ( 2~ {D-
d,} d,) ~ _S
k
(81)
(di
pl=
D
(82)
1 {D di}di S a~l g~{D-~ilai)~
1og52=D H-~D log D k' S2_2
(83)
s 1 { D-di} di S 1 1 M
H=-+-log _> -+-log -fldi for M types
Dk 2D D Dk 2D D;_1
(84)
S=k1ogS2 = DkH-s
(85)
49
CA 02681641 2009-09-17
WO 2008/116110 PCT/US2008/057734
ATTORNEYDOCnr,i
M
s=- klog 1 fl di
2 D
(86)
Boltzmann Entropy = ( Dk ) (Shannon Entropy) -s
(87)
As noted above, the Stirling approximation is in error by 1% when D=10.
The next section illustrates the calculation of the "temperature" of revenue
and
cost. Equation (10) infers that the "temperature" of revenue is $r per unit
and that of
cost is $c per unit. The common thread running in many references is reflected
in
Equations (88) and (89):
Thermodynamic Engine: Work = Hot Input Energy-Cold Waste Energy
(88)
Business Enterprise: $Profit = $Revenue - $Cost
(89)
To move beyond analogies, such as Equation (88) and Equation (89) to useful
quantitative equivalencies that result in a new Equation of Projected Cost
Reduction
as reflected in Equation (61), that is subject to testing, it is important to
determine if
Equation (10) is borne out analytically by the proposed methodology. A
temperature
of revenue can be computed.
From thermodynamics, "Temperature" of Revenue (which may be analogized
to the hot source that provides heat to an engine) is reflected by Equation
(53)
aEntropy _ 1
aEnergy )VN "Temperature" of Revenue
(53)
CA 02681641 2009-09-17
WO 2008/116110 PCT/US2008/057734
ATTORNEY DOCnr,i ivu.: iZ-)a i-i i~+vv vi
From Equation (51), it is shown that the entropy of revenue per month is
entropy of revenue=DH,,,, thus, as reflected in Equation (90):
m m
= - pilogpi = )og( )
Y(H= D D
(90)
The Energy of Revenue is analogous to the hot source heat energy, average
revenue per unit, r, multiplied by the number of units produced per month D =
rD,
thus, as reflected in Equation (91):
a(Entropy of Revenue) d(DHm )_ 1 _ 1
a(Energy of Revenue) ' d (rD) "Temperature" of Revenue TR
(91)
Since neither D nor H,,, is a function of r, Equations (92) to (98) are
expressed
as:
d(DHm)_ d(DHm) =Hm+ D dHm _ 1
d (rD) (1) rdD r ~ r~ dD TR
(92)
dHm= ~ ~~m ~ dD+ ~ ~m
dD
(93)
m
all Dm aD (D)og(D)
a
i=1
(94)
51
CA 02681641 2009-09-17
WO 2008/116110 PCT/US2008/057734
ATTORNEYDOCnr,i
m
(*ImJ = aD(D)1og(D)+(D) aD1og(D)
~-~
(95)
aD(D)=_(D2)'aD1og(D) d~/D~ D2 D
(96)
m
(*Im
J -(D21og(D)+(D)( DJ
i=1
(97)
m
(*Im
J D D1ogDJ+(D) = ~( llm+1)
i=1
(98)
The first term is expressed in Equation (98). The second term is expressed
reflected in Equation (99):
(am)(Z
(99)
The derivative of Shannon entropy is reflected in Equations (100) and (101):
(am)=-(DAD4D) Hm (D+ADD D~+4D)log( DA4DD
(100)
52
CA 02681641 2009-09-17
WO 2008/116110 PCT/US2008/057734
ATTORNEYDOCnr,i
Am - ( D~0 ) Hm +HD,~ ~ - ~ D J Hm +HD,~
HD,.= is Entropy of a binary random variable with values D and AD.
(101)
In these equations, HDAD represents entropy of a binary random variable with
values D and AD. If a uniform distribution of D unit spread among the m
products is
assumed, then a subset such as half the products m will be spread over half
the
demand D, and so on, as reflected in Equations (102) to (112):
m 4m
D 4D
(102)
all mm)(aD) -(D)~(AD D ) Hm+HD,-
C a
(103)
dHm= ~ ~~m ) dD+ (M amm)(I aD ) dD= ~ ~ ( -Hm+ 1 ) ~ dD - (~ )((~ ) Hm +Hn,- ~
dD
(104)
dD - (D(-Hm+1)~-~D~ (AD ) Hm+HD,.
(105)
( ) (DHm~= Hm+D
ddlrDm)- (r ) dD r( dD ) TR
(106)
D)~~
TR r IHm+D1Hm+1)1I1Hm+HD,
) - D
(107)
53
CA 02681641 2009-09-17
WO 2008/116110 PCT/US2008/057734
ATTORNEY DOCnr,i ivu.: iZOa i-i i~+vv vi
T. r(Hm Hm+l-m(( D ) Hm _(D+ADD (D~AD)log(D~AD)))
D (108)
m(AD ) Hm ~ D+4D D )log ( D+4D D )_( D~4D )log ( DA~D 0 as OD ~ 0
D (109)
1 ~ 1(Hm- Hm+1~
TR r r
(110)
TR = rasOD ---> 0
(111)
dD(DHm) - 1asOD0
(112)
The "temperature" of Cost of Goods Sold is now described. The WIP, W, that
is drawn in to serve demand D units with entropy DH,,, corresponds to entropy,
as in
Equation (52):
Generalized Entropy =1ogW= Hint6nsic+HcomPIexity+Flogwi
(52)
In Equation (52), H,,,tr,,,s,c corresponds to DH,,,. The energy related to
cost of
goods sold is cD where c is the average cost per unit, as reflected in
Equations (113)
and (114):
a(Entropy of Cost of Goods Sold)
a(Energy of Cost of Goods Sold) "Temperature" of Cost of Goods Sold Tc (11
3)
54
CA 02681641 2009-09-17
WO 2008/116110 PCT/US2008/057734
ATTORNEYDOCnr,i
Hinhinsic+Hcomplexity+ElOgWi ) a( DHm+Hcomplexity+ElOgWi ) 1
a(cD) = ca(D) = Tc
(114)
Because all variables are independent of c, from the conclusion following
Equation (36), Hco,,,pieR1ty and slogwi are also independent of D. Therefore,
as reflected
in Equations (115) to (117):
DHm+HcompIexity+Elogwi 1 DHm = 1
ca D -~c)aD( ) Tc
(115)
aD ( DHm) 1
(116)
Tc= c, as AD -> 0
(117)
The next section describes a derivative of discrete Shannon entropy. To
evaluate an expression for the derivative of the discrete Shannon entropy as a
function
of increasing the number of products m is needed, as reflected in Equations
(118) to
(120):
m
Shannon Entropy= -Y pilogpi
i=1
(118)
di
pi= D
(119)
CA 02681641 2009-09-17
WO 2008/116110 PCT/US2008/057734
ATTORNEYDOCnr,i
m
D=Y di,
~-~
(120)
In these equations, m represents a number of different products, D represents
a
total number of products produced per month, d; represents a number of the i
th product
type produced per month.
One assumption is that a number of different outcomes increases from
m to m+1 and adds d,,,+i to D, hence d,,,+i =AD. For i<_ m, d; are unchanged,
as
reflected in Equations (121) to (134):
_ d~
pl D+AD
(121)
AH Hm+l-Hm
Am 4m=1
(122)
m.'m.' di )log d
i
Hm+1=-I Yi'logYi'_ - ~j ;_1 ;_1 D+AD D+AD
(123)
M+1 m di lo di + AD lo AD
-
Hm+1=~ pi'logpi' ~ D+AD g D+AD D+AD g D+AD
(124)
m
Hm+l=- y(Ddi)(D+ADD (D)(D+4D) +( D~+4D)log( DA4DD
(125)
Hm+l=- ( D+AD D ) , m ( D ) log ~ d-D' ~ +log ( D+AD D ) + ( D+AD )log ( DA4DD
(126)
56
CA 02681641 2009-09-17
WO 2008/116110 PCT/US2008/057734
ATTORNEYDOCnr,i
I~~DJlOg~-J=-Hm, l(-)=1
(127)
Hm+l= ( D+AD D ) Hm+log ~ D+AD D ~ + ( D+AD )log ( DAOD
(128)
Hm+l= ( D ~D ) Hm+log ( D+AD D+AD ) log ( D+AD (129)
Hm+l= ( D+AD D+AD )log ( D+AD D )_( D~+4D D )log ( DA4DD
(130)
( DHm 1(D+AD)HmADHmIADHm
D+4D ) D+4D D+4D )
(131)
Hm+1=Hm ~ D+D4D )_( D+AD D )log ( D+AD D )_( D+AD )log ( D+AD (132)
4H Hm+l Hm AD Hm D logD )_( AD log4D
Am 4m=1 D+4D D+AD D+AD D+AD D+AD
(133)
Am - ( D+AD) Hm +HN,~ ~ - ~ ~ ) Hm +HN,~ D (134)
57
CA 02681641 2009-09-17
WO 2008/116110 PCT/US2008/057734
ATTORNEY DOCnr,i ivu.: iZ-)a i-i i~+vv vi
In the above equations, HNAN represents entropy of a binary random variable
with outcomes N and AN. Substituting the approximation, as reflected in
Equations
(135) to (139):
AD
D+4D) 111PT1=11R)
(135)
D D)log(D+4D)=_(1 A ~log~1 AD)
~D+4
(136)
log l- 4D) AD
D D
C
(137)
D
D+4D)log(D+4D)=_(1 AD )(_AD D) = AD
(138)
Am AD 1 Hm log~AD)
(139)
In other examples, m--->m+1, but D remains constant, for example, yielding
the same equations as reflected above.
Microeconomic analogies can be denoted in reference to their thermodynamic
counterparts with the subscript M. Little's Law resulted in Equation (22),
which
provided the analogy that process:
1. Mass=MM--W2,
2. Internal Process Temperature TM-->D2
3. Volume=VM-->WIP W,
4. Entropy Change=SM at constant temperature -->log(Wf/W;).
58
CA 02681641 2009-09-17
WO 2008/116110 PCT/US2008/057734
ATTORNEY DOCnr,i ivu.: iZ-)a i-i i~+vv vi
5. nMRM=1 comparing Equation (32) with Equation (9) discussed below
6. Energy= EM= Prenergy=i/2(Mv2)= i/2(D2)
7. nM = RM =1: Referring back to analogy 5, nMRM=1, note that RM is a
universal
constant. Their product can be unity if RM =1/nM and hence either RM is not a
universal constant if nM is extensive, or nM = RM =1 in which case RM is a
universal constant and nM =1. The later case is selected in which is a
universal
RM constant, to continue the discussion.
Proof that Mass = W2 is the Self-Consistent Parsing of Equation (14)
It can be shown how a self-consistent parsing of the acceleration from
Equation (14) into factors of mass (Equation (140)), and force (Equation
(141):
Acceleration = a= dv _ D dW cycles/hour/hour
dt W 2 dt
(14)
(Mass) M=W2
(140)
(Force) M=-DdW
dt
(141)
This is the parsing consistent with units of measure of energy in which an
integration resulted in Equation (22) where there are units of measure of the
square of
a velocity.
An alternative parsing of Equation (14) is to incorporate D as a factor in the
mass rather than the force, as reflected in Equation (142) to (144):
(Mass~M= w
D
(142)
59
CA 02681641 2009-09-17
WO 2008/116110 PCT/US2008/057734
ATTORNEYDOCnr,i
(Force) M = - dW dt , then
(143)
Sf Wf
Prenergy= Fds = (- ~W )(w dt~ _ -D ~ = -D (logWf-logW~)
si wi
(144)
The units of measure resulting from this alternative parsing are inconsistent
with a kinetic energy because there is a velocity D units per unit time, not a
velocity
squared and can be rejected based on the criterion of units of measure of
kinetic
energy. Several other tests of the parsing Equation (141) can be explored to
show it is
entirely consistent with the results of thermodynamics and statistical
mechanics.
More importantly, it is the parsing that led to Equation (22) with the result
-D2 (logWf-loff) indicating that the entropy of a process is a function of
logW that
leads to the application of Information Theory, ultimately leading to the
equation of
cost reduction.
Equation (22) was derived in analogy with the isothermal compression of an
ideal gas. It can be determined if the four analogies above are self-
consistent with the
equation of state of an ideal gas. From Thermodynamics it is known, as
reflected in
Equation (145):
Pressure=P=T(aV) ~D2~~~logWDz=w =PM
U
2
(145)
At first glance the expression for pressure does not appear to be an intensive
variable, because the expression shown in Equation (145) includes an extensive
quantity W. The units of measure of pressure in a microeconomic process can be
studied by considering a small displacement, ds, as reflected in Equation
(146):
CA 02681641 2009-09-17
WO 2008/116110 PCT/US2008/057734
ATTORNEYDOCnr,i
(PressureLitSofMeas `e Force Area F A _ Fds Ads _ Energy Volume
)UnitsOfMeasure
(146)
Thus, the units of measure of pressure are Force/Area or Energy/Volume, and
the latter can be used for this purpose. The numerator is D2 which is in units
of
Prenergy and the denominator is in units of Volume equivalent WIP, as
reflected in
Equation (147):
Pressure = P = Energy ~ D~ ~ D~ ---> Energy/Unit Volume, Intensive Variable
Volume ~ W W
(147)
Substituting this equation into the Ideal Gas Law with Volume-->W, as
reflected in Equation (148), results in Equation (149), where nMRM=1.
PV=nRT
(148)
z
PV= (W) =D2
(149)
Hence, it can be concluded that the WIP obeys the Ideal Gas Law, as reflected
in Equation (150):
PMVM=D2
(150)
The WIP can include particles which obey the Ideal Gas Law as derived from
Little's Law resulting in the analogies above. The average velocity of ideal
gas
particles may be derived from the entirely different starting point of
Newtonian
mechanics. However, as discussed, on average each particle of WIP is coupled
to
every other particle of WIP and acts as a single unit. Instead of substituting
the mass
of a single particle into the average velocity formula, one can substitute the
mass
MM=W2 and temperature TM=D2 and of the internal process into Maxwell's
velocity
61
CA 02681641 2009-09-17
WO 2008/116110 PCT/US2008/057734
ATTORNEY DOCnr,i ivu.: iZ-)a i-i i~+vv vi
law to again determine consistency. Maxwell determined that a gas has energy
1/2 kT
per degree of freedom. Integrating Little's Law over one dimension, as
reflected in
Equations (151) and (152), which is analogous to Little's Law if kM=1:
1 MV2= 1 kT
2 2
(151)
V M JkMD2DjjM
(
152)
That an analogy based on Little's Law should square with Maxwell's velocity
based on Newtonian dynamics can be surprising. The conclusion that the
internal
Boltzmann constant for a microeconomic process is kM=1 provides the linkage
between statistical mechanics, Information Theory and microeconomics. In the
discussion following Equation (22) it was noted that nMRM=1 and that T=D2. It
can be
seen that this is in fact consistent with Little's Law, as reflected in
Equation (153):
m m
Boltzmann S= -k pilogpi - - - > -1 pilogpi = Shannon H
(153)
That the Boltzmann constant internal to a process indicates that a process is
controlled by information. The connection to the better known version of the
Boltzmann equation S=k1ogS2, where S2 is the number of states is derived
above. The
Internal Process microeconomic Boltzmann constant kM =1.
Therefore a microeconomic process can be an information based, rather than a
physical, process. It should also be noted that the analogies mass MM=W2 and
temperature TM=D2 will satisfy Equation (152) resulting in units of measure of
a
velocity.
It has been described that the microeconomic analogies, as tested thus far,
satisfy the requirements of an ideal gas. Now compare the entropy of a mixture
of
ideal gases as derived from statistical mechanics versus the statistically
derived
62
CA 02681641 2009-09-17
WO 2008/116110 PCT/US2008/057734
ATTORNEY DOCnr,i ivu.: iZ-)a i-i i~+vv vi
equation for microeconomic entropy of WIP consisting of a mixture of different
products. First recall that WIP moves in one dimension in Little's Law, as
opposed to
three dimensions for an ideal gas, as was pointed out in the derivation of
Equation
(152). One can examine the entropy of a One Dimensional ideal gas consisting
of D
atoms, of Q different types of atoms, there being d; indistinguishable atoms
within a
given type, each of mass m; where, as reflected in Equation (154):
Q
D= ~ di
~-~
(154)
The equation for the entropy of a mixture of ideal gases can be derived from
statistical mechanics, as reflected in Equations (155) and (156), where h
represents
Planck's constant:
= DR
Q Z1n(
+ln D j 1n6; (155)
lh2 ~
6i=
47cm;
(156)
Equation (157) is used to determine if the microeconomic entropy of WIP in
Equation
(36) is consistent with the entropy of an ideal gas:
Q Q Q
logzW= -~ pdogzpi + pdogzW = HQ + pdogzW
(157)
63
CA 02681641 2009-09-17
WO 2008/116110 PCT/US2008/057734
ATTORNEY DOCnr,i ivu.: iZ-)a i-i i~+vv vi
Equations (155) and (156) first derive an expression for the mass of the WIP
of a product type, m; to be used in above. Begin with the case for WIP
consisting of
just two products Q=2, as reflected beginning with Equations (158) and (159):
Q
M= W2 = (wI+w2)2 where W= (wI+wz) = wi
s=i
(158)
1VI = (wi+wz)z = wi2+ w1w2 +w2wi+w2 2
(159)
If the quantity per type regresses to the mean, as reflected in Equations
(160) to (163)
(which can be generalized for 3 products, as reflected in Equation (162)):
wi - W2 -(wi) =average over all
(160)
z
M=(W1+WZ) wl~+ W1WZ+WZW1+WZ~ = 2w1~+2WZ~
(161)
M=(wi+wz+ws)z = wiz + wzz + W3 2 + 2wiwz+ 2wiws+ 2wswz
(162)
in - 3w~z
(163)
In general, the i th product type makes a contribution, as reflected in
Equation
(164) to the total mass, as reflected in Equation (165):
64
CA 02681641 2009-09-17
WO 2008/116110 PCT/US2008/057734
ATTORNEYDOCnr,i
IIIiQ(Wi\2
(164) v /
M ^Z /Wl\2
(165) (~ (\ /)
If Equation (164) is substituted and the macroeconomic analogies into
Equations (155) and (156), Equations (166) and (167) are obtained:
D2 1/2
W Q Q
S = D ~+ln 2 - dD'1n6; ~ln( dD
D~
(166)
h2 '/2 h~ )/2 _ h )rln
4~m; 4~Qw,2 wi (167)
Substituting Equation (167) into Equation (166), results in Equations (168) to
(170):
Q Z1n( S=D ~+ln W + dDln(h' 4Qn (168)
di
Pi= D
(169)
CA 02681641 2009-09-17
WO 2008/116110 PCT/US2008/057734
ATTORNEYDOCnr,i
Q Q
S = D ~+ln W + piln ( h' 4Q )i- pilnpi
~D~ (170)
If h 4Q is moved out of the brackets in the 3rd term in Equation (170),
Equation (171) results:
Q Q
S = D ~+ln W + h + pilnwi- pilnpi
Y Y
~D~
(171)
Now it can be recalled that the entropy of WIP is, as reflected in Equation
(172):
Q Q
EntropyM =1og2W= pilnwi - pilnpi
(172)
Thus the log expectation and Shannon entropy of WIP in Equation (36) enters
the entropy relationship in microeconomics just as the log expectation and
Shannon
entropy of molecules enter the entropy formula for a multi-component gas. This
indicates again that the parsing of Mass=W2 in Equation (15) based on the
parsing
Equation (141) is at least consistent with the equations of Statistical
Mechanics.
An alternative comparison of Equation (170) to Equation (36) can be made. If
1
4Q is not moved out of the 3rd term in Equation (170), the resulting
comparison
h
with Equation (36) implies Equation (173):
66
CA 02681641 2009-09-17
WO 2008/116110 PCT/US2008/057734
ATTORNEYDOCnr,i
hM 4Q =1, hM - 3.5~
(173)
The microeconomic equivalent of Planck's constant, is expressed reflected in
Equation (174):
hM = 3.5~Q
(174)
This microeconomic equivalent is not a universal constant since Q, the number
of different products, does change as a function of complexity reduction and
hence
falls afoul of the logic above leading up to nM = RM =1 . The relationship in
Equation
(174), however unlikely, can be tested by statistical simulations of
microeconomic
processes.
The process for the derivation of Equation (164) for total mass can be used
and can be applied to total demand, as reflected in Equations (175) to (178):
D2 _ ydi2 Q2 (di)z
~-~
(175)
v- F~kT d'd', - WZ ~ QZ ~w ~2 (w )
(176)
1'd', =(D)
w>
~ W( (177)
v=~wJZ
(178)
67
CA 02681641 2009-09-17
WO 2008/116110 PCT/US2008/057734
ATTORNEY DOCnr,i ivu.: iZ_)a i-i i~+vv vi
The above equations again illustrate the collective motion of WIP as
distinguish from the individual motion of gas molecules.
Process improvement can also be compared to the thermodynamics of a
nozzle. Taking a global view, process improvement can be viewed as a
methodology
which accelerates low velocity WIP into high velocity WIP at the same demand
rate
D. The thermodynamic analogy of process improvement is that of a mechanical
nozzle which similarly accelerates low velocity gas to a higher velocity at
the same
overall flow rate. The thermodynamic equations of a nozzle provide another
test of
the analogies and therefore the parsing Equation (141). The Thermodynamic
equations of a nozzle are, as reflected in Equation (179):
Pr Sr
0( KineticEnergy ) Nozzle = 0( U) Nozzle = VdP TdS
Pi si
Flow-Expansion Entropy Dissipation
(179)
In Equation (179), V represents Volume, S represents entropy, P represents
pressure, T represents temperature, and U represents kinetic energy. In the
first term,
dP is negative, and VdP is the difference between differential flow work,
d(VP), and
differential expansion work, PdV, since VdP=d(VP) -PdV. The second term on the
right-hand side of Equation (179) is the energy dissipation of the nozzle due
to
entropy created by friction in the flow process. In a thermodynamic process,
reduction of mechanical friction may increase final velocity and kinetic
energy.
However, in the case of a microeconomic process, kinetic energy is, as
reflected in
Equation (180):
U=Kinetic energy= 1 Mv2 ___> 1 W2 D2 = D~ = Prenergy,
2 2 ~W~ 2
(180)
68
CA 02681641 2009-09-17
WO 2008/116110 PCT/US2008/057734
ATTORNEY DOCnr,i ivu.: iZOa i-i i~+vv vi
Thus in a microeconomic process, an increase in velocity does not increase
Prenergy due to the dependence of process inertia upon velocity. First take
the case
of D as a constant exogenous parameter, then, as reflected in Equation (181):
DU=A D2 = 0
2
(181)
The left side of Equation (179) is zero. Substitution of the microeconomic
analogies derived in Section A and Equation (145) into the right side of
Equation
(179) also may yield zero. There are expressions for all thermodynamic
variables in
Equation (179) in terms of their microeconomic analogies.
An expression for pressure has been derived in Equation (145): D
Fressure=P=T(~~ ~D2(a~logW~ = W
z
2
(145)
Therefore, as reflected in Equation (182), with expressions for V, T, S from
above, the right side of Equation (179) becomes Equation (183):
D2 D2
dP= d --dW
W Dz W2
2
(182)
Pf Sf Wf Wf Wf Wf
VdP TdS ~ IW1---dW"1 - D2 dW _ D2 dW D2 dW = 0
-f -f W2 W W W
Pi si wi wi wi wi
(183)
The above equations show that the derived microeconomic analogies based on
the parsing Equation (141) are self consistent with the thermodynamic
equations of a
nozzle.
69
CA 02681641 2009-09-17
WO 2008/116110 PCT/US2008/057734
ATTORNEYDOCnr,i
Prinertia MM= W2 Even When Demand D is Variable
An expression has been derived for process inertia of W2 when exogenous
demand, D, is constant. A check can be made to determine if Prinertia remains
W2
when demand is variable. First take the derivative of the velocity, Equation
(13) with
dD/dt #0 and obtain Equation (184):
Acceleration= d = d ( D 1 (dD ) D~ (dW )
dt dt W W dt W dt
(184)
The showing can be made that M=W2 and determine if the resulting Prenergy
is still self-consistent; Equation (28). Because, as reflected in Equations
(185) and
(186), 1/W2 can be factored out of Equation (184):
Acceleration
Force =
Mass = WZ
(185)
Force = W(dD ) D(dW )
dt dt
(186)
Recalculating Prenergy between the pair of initial values (W;,D;) and final
values (Wf, Df), in which Demand D is an exogenous market variable and not a
function of internal W, as reflected in Equations (187) to (191):
Df,Wf Dr,Wr
Prenergy = Fds = ~W( ~~ ) - D ~W ))( w dt )
Di,Wi Di,Wi
(187)
CA 02681641 2009-09-17
WO 2008/116110 PCT/US2008/057734
ATTORNEYDOCnr,i
Df,Wf Df,Wf
Prenergy = I W(~D )( w dt ) - D(~W )( w dt
Di,Wi Di,Wi
(188)
Df Df,Wf
Df
Prenergy= DdD D2 w= ~ D2 -(D2logW ) Df,wf
Di Di,Wi
Di Di,Wi
(189)
Prenergy= ~(Df2 -D,2~-(Df2logWf-Di 21ogW, ~
(190)
as Df ---> Di, Prenergy ~ -D2 (logWf-logWi)
(191)
If Df ~ Di but there is no process improvement, i.e., in the above case
studies,
where Wi=Wf, and, as reflected in Equation (192):
PrenergyChange= ~(Df2 -D,2 )-(Df2 -D,2)logW
(192)
Notice that the resulting increase in Kinetic Energy due to the increase in D
is
reduced by the second term which is analogous to the frictional force in a
nozzle
which appears as the second term in Equation (179), as reflected in Equation
(193):
Sr
Prenergy Change = JTdS (Df 2 -D,2 )logW
si
(193)
In a second example, D is constant D;=Df--D, but W;>Wf due to process
improvement is reflected in Equation (194):
71
CA 02681641 2009-09-17
WO 2008/116110 PCT/US2008/057734
ATTORNEYDOCnr,i
Sf
Prenergy Change = JTdS -> -D2 (logWf-logW,)
si
(194)
Equation (194) agrees with the case when Df--D; and is self-consistent with
the
hypothesis that Prinertia=W2 for both constant and variable demand, D. This
allows
the use of Prinertia =W2 when considering growth in demand, D, by scaling the
WIP
in proportion to the demand at a fixed percent of total capacity. Revenue
growth can
require these concepts and concepts from statistical mechanics. A conclusion
is the
result of the trials is that the assumption that Prinertia=W2 is self-
consistent and leads
to process entropy of logW for constant and variable demand.
Thus, thermodynamics applies to microeconomics. Little's Law led to an
expression for process entropy of logW, resulting in Prinertia of W2 , and
internal
temperature D2 , volume = WIP, W. The substitution of these values into the
Kinetic
Theory of Gases, the Statistical Mechanics of entropy of a mixture of gasses,
as well
as the thermodynamics of a nozzle were consistent with thermodynamics. Queuing
Theory can be connected with Entropy. The resulting decomposition of W in
Equation (36) led to Information Theory. Thermodynamics is a macroscopic
approximation of Statistical Mechanics. The demonstration by Jaynes that Z,
the
Partition Function from which thermodynamic variables are determined, is a
consequence of maximizing Shannon's Entropy of Information. In this view,
Statistical Mechanics, and therefore Thermodynamics, is not a physical theory
at all,
but rather is a branch of Information Theory.
The statistical nature of thermodynamics is not apparent in macroscopic
measurements due to the extreme sharpness of the probability of states as a
function
of energy, for example as reflected in Equation (195):
4E 1
10-12 because f = degrees of freedom - 1024
E Tf
(195)
72
CA 02681641 2009-09-17
WO 2008/116110 PCT/US2008/057734
ATTORNEY DOCnr,i ivu.: iZ_)a i-i i~+vv vi
For example, in the case of a process, each unit of WIP has one degree of
freedom and WIP is seldom less than 1000 units. Hence variability of cost of
<_ 2%
can be expected.
Table 3 is a consolidated Table of Thermodynamic¨> microeconomic Analogies
Table 3 includes a summary of parameters in from thermodynamics and
corresponding microeconomic parameters.
Table 3
Thermodynamics ~ Microeconomic Process
Internal Process Parameters
1. Universal Constants R, k,n ~ 1
2. Volume V ~ W No. of units of WIP
3. Mass M ~ W2 Inertia of Process
4. Internal Temperature T ~ D2
5. Energy to Compress Gas nRT1ogV ~ D2logW to accelerate WIP
6 Kinetic Energy ~ Mv2 ~ ~ D2 Process Energy
7. Entropy, T=Const. nRlogV ~ 1ogW
DZ
8. Pressure P ~ -
W
9. Equation of State PV=nRT ~ PV= D2
note:D is the external demand of the market in units/unit time ,
Q is the number of different types of products or tasks
External Process Parameters
10. External Source Temp TH ~ r = $revenue/unit
External Sink Temp Tc ~ c = $cost/unit
Gas Constant Re 0.1 (case study estimate)
FIG. 8 is a schematic diagram of a generic computer system 800. The system
800 can be used for the operations described in association with any of the
computer-
implement methods described previously, according to one implementation. The
system 800 includes a processor 810, a memory 820, a storage device 830, and
an
input/output device 840. Each of the components 810, 820, 830, and 840 are
interconnected using a system bus 850. The processor 810 is capable of
processing
instructions for execution within the system 800. In one implementation, the
processor 810 is a single-threaded processor. In another implementation, the
processor 810 is a multi-threaded processor. The processor 810 is capable of
73
CA 02681641 2009-09-17
WO 2008/116110 PCT/US2008/057734
ATTORNEY DOCnr,i ivu.: iZ_)a i-i i~+vv vi
processing instructions stored in the memory 820 or on the storage device 830
to
display graphical information for a user interface on the input/output device
840.
The memory 820 stores information within the system 800. In one
implementation, the memory 820 is a computer-readable medium. In one
implementation, the memory 820 is a volatile memory unit. In another
implementation, the memory 820 is a non-volatile memory unit.
The storage device 830 is capable of providing mass storage for the system
800. In one implementation, the storage device 830 is a computer-readable
medium.
In various different implementations, the storage device 830 may be a floppy
disk
device, a hard disk device, an optical disk device, or a tape device.
The input/output device 840 provides input/output operations for the system
800. In one implementation, the input/output device 840 includes a keyboard
and/or
pointing device. In another implementation, the input/output device 840
includes a
display unit for displaying graphical user interfaces.
The features described can be implemented in digital electronic circuitry, or
in
computer hardware, firmware, software, or in combinations of them. The
apparatus
can be implemented in a computer program product tangibly embodied in an
information carrier, e.g., in a machine-readable storage device or in a
propagated
signal, for execution by a programmable processor; and method steps can be
performed by a programmable processor executing a program of instructions to
perform functions of the described implementations by operating on input data
and
generating output. The described features can be implemented advantageously in
one
or more computer programs that are executable on a programmable system
including
at least one programmable processor coupled to receive data and instructions
from,
and to transmit data and instructions to, a data storage system, at least one
input
device, and at least one output device. A computer program is a set of
instructions
that can be used, directly or indirectly, in a computer to perform a certain
activity or
bring about a certain result. A computer program can be written in any form of
programming language, including compiled or interpreted languages, and it can
be
deployed in any form, including as a stand-alone program or as a module,
component,
subroutine, or other unit suitable for use in a computing environment.
Suitable processors for the execution of a program of instructions include, by
way of example, both general and special purpose microprocessors, and the sole
processor or one of multiple processors of any kind of computer. Generally, a
74
CA 02681641 2009-09-17
WO 2008/116110 PCT/US2008/057734
ATTORNEY DOCnr,i ivu.: iZ_)a i-i i~+vv vi
processor will receive instructions and data from a read-only memory or a
random
access memory or both. The essential elements of a computer are a processor
for
executing instructions and one or more memories for storing instructions and
data.
Generally, a computer will also include, or be operatively coupled to
communicate
with, one or more mass storage devices for storing data files; such devices
include
magnetic disks, such as internal hard disks and removable disks; magneto-
optical
disks; and optical disks. Storage devices suitable for tangibly embodying
computer
program instructions and data include all forms of non-volatile memory,
including by
way of example semiconductor memory devices, such as EPROM, EEPROM, and
flash memory devices; magnetic disks such as internal hard disks and removable
disks; magneto-optical disks; and CD-ROM and DVD-ROM disks. The processor
and the memory can be supplemented by, or incorporated in, ASICs (application-
specific integrated circuits).
To provide for interaction with a user, the features can be implemented on a
computer having a display device such as a CRT (cathode ray tube) or LCD
(liquid
crystal display) monitor for displaying information to the user and a keyboard
and a
pointing device such as a mouse or a trackball by which the user can provide
input to
the computer.
The features can be implemented in a computer system that includes a back-
end component, such as a data server, or that includes a middleware component,
such
as an application server or an Internet server, or that includes a front-end
component,
such as a client computer having a graphical user interface or an Internet
browser, or
any combination of them. The components of the system can be connected by any
form or medium of digital data communication such as a communication network.
Examples of communication networks include, e.g., a LAN, a WAN, and the
computers and networks forming the Internet.
The computer system can include clients and servers. A client and server are
generally remote from each other and typically interact through a network,
such as the
described one. The relationship of client and server arises by virtue of
computer
programs running on the respective computers and having a client-server
relationship
to each other.
A number of implementations have been described. Nevertheless, it will be
understood that various modifications may be made without departing from the
spirit
CA 02681641 2009-09-17
WO 2008/116110 PCT/US2008/057734
ATTORNEY DOCnr,i ivu.: iZ-)a i-i i~+vv vi
and scope of this disclosure. Accordingly, other implementations are within
the scope
of the following claims.
76