Note: Descriptions are shown in the official language in which they were submitted.
CA 02702938 2010-04-16
WO 2009/054939 PCT/US2008/011969
CANCER CLASSIFICATION AND METHODS OF USE
FIELD OF THE INVENTION
The present invention relates to methods of classifying cancer cells based on
the presence,
absence or level of a tyrosine kinase or a phosphorylated tyrosine kinase. The
present invention also
relates to methods of treating cancer using cancer classification. The present
invention further relates
to methods of determining the effectiveness of a treatment for cancer using
cancer classification.
BACKGROUND OF THE INVENTION
Lung cancer is the leading cause of cancer mortality in the world today.
Despite decades of
intensive analysis, the majority of molecular defects that play a causal role
in the development of lung
cancer remain unknown. Two oncogenes important in lung cancer are K-RAS and
EGFR, mutated in
15% and 10% ofNSCLC patients. Large-scale DNA sequencing efforts have
identified mutations in
PI3KCA, ERBB2, and B-RAF that together represent another 5% of NSCLC patients
(Greenman, C.,
Stephens, P., Smith, R., Dalgliesh, G.L., Hunter, C., Bignell, G., Davies, H.,
Teague, J., Butler, A.,
Stevens, C., et al. (2007). Patterns of somatic mutation in human cancer
genomes. Nature 446, 153-
158; Thomas, R.K., Baker, A.C., Debiasi, R.M., Winckler, W., Laframboise, T.,
Lin, W.M., Wang,
M., Feng, W., Zander, T., Macconnaill, L.E., et al. (2007). High-throughput
oncogene mutation
profiling in human cancer. Nat. Genet. 39, 347-351). Analysis of recurrent
chromosomal aberrations
including amplification and deletion using CGH and SNP arrays promises to
identify many additional
genes altered in cancer (Chin, K., DeVries, S., Fridlyand, J., Spellman, P.T.,
Roydasgupta, R., Kuo,
W.L., Lapuk, A., Neve, R.M., Qian, Z., Ryder, T., et al. (2006). Genomic and
transcriptional
aberrations linked to breast cancer pathophysiologies. Cancer Cell 10, 529-
541; Neve, R.M., Chin,
K., Fridlyand, J., Yeh, J., Baehner, F.L., Fevr, T., Clark, L., Bayani, N.,
Coppe, J.P., Tong, F., et al.
(2006). A collection of breast cancer cell lines for the study of functionally
distinct cancer subtypes.
Cancer Cell 10, 515-527). However, genetic approaches suffer from the
difficulty of identifying a
small number of causal changes within a sea of changes associated with genome
instability. Thus,
there remains a need for methods that focus on the key lesions driving
disease.
One such strategy involves analysis of the cellular signaling pathways
corrupted in
cancer (Vogelstein, B., and Kinzler, K.W. (2004). Cancer genes and the
pathways they control. Nat.
Med. 10, 789-799). Signaling via tyrosine kinases is often deregulated in
cancer as these enzymes
mediate most growth and survival signaling in multicellular organisms (Blume-
Jensen, P., and
Hunter, T. (2001). Oncogenic kinase signalling. Nature 411, 355-365).
Selective tyrosine kinase
inhibitors have recently shown success in treating cancer. However, their
success depends upon the
CA 02702938 2010-04-16
WO 2009/054939 PCT/US2008/011969
-2-
identification of tumors that are driven by activated kinases and are
therefore dependent upon the
targeted kinase for their survival and clinical benefit (Dowell, J.E., and
Minna, J.D. (2005). Chasing
mutations in the epidermal growth factor in lung cancer. N. Engl. J. Med. 352,
830-832; Weinstein,
I.B. (2002). Cancer. Addiction to oncogenes-the Achilles heal of cancer.
Science 297, 63-64). Thus,
there remains a need for methods to identify activated tyrosine kinases in the
initiation and
progression of disease.
SUMMARY OF THE INVENTION
It has now been found that cancer cells can be classified based on aberrant
tyrosine
kinase. Such classification is useful in treating cancer and in determining
the effectiveness of cancer
treatment.
Accordingly, the present invention provides methods of classifying cancer
cells in a
sample based on the presence, absence, or levels of the one or more tyrosine
kinases in at least one
signaling pathway. The present invention also provides methods of classifying
cancer cells based on
the presence, absence, or levels of one or more phosphorylated tyrosine
kinases in at least one
signaling pathway.
In addition, the present invention provides methods of treating cancer in a
subject by
classifying cancer cells based on the levels of one or more aberrantly
expressed tyrosine kinases in at
least one signaling pathway and administering an effective dose of one or more
tyrosine kinase
inhibitors based on the classification. The present invention also provides
methods of treating cancer
by classifying cancer cells based on the levels of one or more aberrantly
phosphorylated tyrosine
kinases in at least one signaling pathway and administering an effective dose
of one or more tyrosine
kinase inhibitors based on the classification.
The present invention further provides methods of determining the
effectiveness of a
treatment for cancer in a subject, based on detecting the presence, absence,
or levels of one or more
tyrosine kinases in at least one signaling pathway in a sample, wherein the
presence, absence, or
levels of the one or more tyrosine kinases is correlated to the effectiveness
of the treatment. The
present invention also provides methods of determining the effectiveness of a
treatment for cancer,
based on detecting the presence, absence, or levels of one or more
phosphorylated tyrosine kinases in
at least one signaling pathway in a sample, wherein the presence, absence, or
levels of the one or
more tyrosine kinases is correlated to the effectiveness of the treatment.
In some embodiments, the presence, absence, or levels of the one or more
tyrosine
kinases is determined using one or more of FISH, IHC, PCR, MS, flow cytometry,
Western blotting,
or ELISA.
CA 02702938 2010-04-16
WO 2009/054939 PCT/US2008/011969
-3-
In some embodiments, the presence, absence, or levels of one or more
phosphorylated tyrosine kinases is determined by immunoprecipitating
phosphopeptides and
analyzing the immunoprecipitated phosphopeptides.
In some embodiments, the tyrosine kinases is selected from EGFR, FAK, Src,
ALK,
PDGFRa, Erb2, ROS, cMet, Axl, ephA2, DDRI, DDR2, or FGFR.
In some embodiments, the cancer cells are classified using one or more
statistical
methods. In some aspects of this embodiment, the statistical method is
unsupervised Pearson
clustering.
In some embodiments, the cancer cells are classified as having only one or two
highly
phosphorylated tyrosine kinases. In other embodiments, the cancer cells are
classified as expressing
phosphorylated Fak, Src, Abl, and at least one receptor tyrosine kinase
selected from the group
consisting of EGFR, ALK, PDGFRa, Erb2, ROS, cMet, AxI, ephA2, DDR1, DDR2,
FGFR, VEGR-
2, IGFR1, LYN, HCK, HER2, IRSI, IRS2, BRK, EphB4, FGFRI, ErbB3, VEGFR-1,
EphBI, EphA4,
EphAl, EphA5, Tyro3, EphB2, IGFI R, EphA2, EphB3, Mer, EphB4, and Kit. In
other embodiments,
the cancer cells are classified as expressing phosphorylated DDRI, Src, and
Abl. In other
embodiments, the cancer cells are classified as expressing phosphorylated Src
and at least one
receptor tyrosine kinases selected from the group consisting of EGFR, ALK,
PDGFRa, Erb2, ROS,
cMet, Axi, ephA2, DDRI, DDR2, FGFR, VEGR-2, IGFR1, LYN, HCK, HER2, IRS1, IRS2,
BRK,
EphB4, FGFRI, ErbB3, VEGFR-l, EphBI, EphA4, EphAl, EphA5, Tyro3, EphB2, IGFIR,
EphA2,
EphB3, Mer, EphB4, and Kit.. In other embodiments, the cancer cells are
classified as expressing
phosphorylated Src and Abl.
In some embodiments, the cancer cells are from lung cancer, hematological
cancer,
prostate cancer, breast cancer, or tumor of the gastrointestinal tract. In
some embodiments, the
methods are used to classify non-small cell lung cancers (NSCLCs).
BRIEF DESCRIPTION OF THE FIGURES
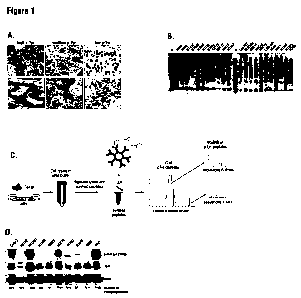
Figure I A is micrographs of IHC staining of paraffin-embedded human NSCLC
tumor tissues
showing high, medium, and low phosphotyrosine expression.
Figure 1 B is a Western blot showing phosphotyrosine signaling in 22 different
NSCLC cell
lines showing different patterns of phosphotyrosine reactivity.
Figure I C is a diagram showing an embodiment of immunoaffinity profiling
method. Cells or
tissues are lysed in urea buffer and digested with protease. The resulting
peptides are immunoaffinity
purified using immobilized phosphotyrosine-specific antibody (P-Tyr-100) and
analyzed by LC-
MS/MS. Because larger liquid chromatography peaks are sampled more times than
are smaller peaks,
the number of observed spectra assigned to a particular protein is a
semiquantitative measure of the
abundance of that protein.
CA 02702938 2010-04-16
WO 2009/054939 PCT/US2008/011969
-4-
Figure I D is a Western blot showing Met and Phospho-Met(Tyrl234/5) expression
in
NSCLC cell lines. Shown below is a comparison of the number of phosphopeptides
identified by
MS/MS with the immunoblotting. The number of different sites identified are
shown in parenthesis.
Figure 2A is pie charts showing distribution of phosphoprotein types. Each
observed
phosphoprotein was assigned a protein category from the PhosphoSite ontology.
The numbers of
unique proteins in each category, as a fraction of the total, are represented
by the wedges of the pies.
Figure 2B is pie charts showing distribution of spectral counts among receptor
tyrosine
kinases (RTK). The total numbers of observed spectra assigned to each RTK over
all of the cell lines
(top) or the tumors (bottom) are represented as fractions of the total RTK
spectra observed.
Figure 2C are pie charts showing distribution of spectral counts among
nonreceptor tyrosine
kinases. The total numbers of observed spectra assigned to each TK
(nonreceptor) over all of the cell
lines (top) or the tumors (bottom) are represented as fractions of the total
TK (nonreceptor) spectra
observed.
Figures 2D and 2E are graphs showing phosphorylation of tyrosine kinases in
lung cancer cell
lines. The total number of boserved spectra assigned to each TK in each cell
line was used as the basis
for clustering using the Pearson correlation distance metric and average
linkage. In Figure 2D, no
normalization has been applied. In Figure 2E, each value in a row has had the
row average subtracted.
Figure 3A is a graph showing clustering of tumors by tyrosine phosphorylation.
Spectral
counts for tyrosine kinases in patient tumors were normalized to the count for
GSK3(3 and then
clustered as described in Figure 2E. Clustering produced five groups of tumors
with different sets of
tyrosine kinases predominating.
Figures 3B-3D are graphs showing phosphorylation of selected nonkinase
proteins in
different tumor groups. Tumor samples were divided into the groups defined by
the clustering in
Figure 3A, and spectral counts were normalized to the count for GSK3(3. After
all kinases were
removed from the protein set, the data were clustered as in Figure 2E and the
top 30 proteins
displayed. The tumors used in Figure 3B were from group I in Figure 3A, those
in Figure 3C from
group 2, and those in Figure 3D from group 4.
Figures 3E-3G are graphs showing most prominent phosphoproteins. Proteins were
ranked,
based on spectral counts, and the top 25 are shown. Before ranking the tumor
proteins, each protein's
counts were normalized to those for GSK3(3, then the average count for that
protein over all tumors
was subtracted. Cell line proteins had their average count over all cell lines
subtracted. Arrows
indicate proteins shared between cell lines and tumors.
Figures 4A and 4B are pie charts showing distribution of spectral counts among
receptor
tyrosine kinases in H2228 and HCC78 cell lines. The total numbers of observed
spectra assigned to
each RTK are represented as fractions of the total RTK spectra observed.
CA 02702938 2010-04-16
WO 2009/054939 PCT/US2008/011969
-5-
Figure 4C is a schematic representation of the EML4, ALK, and EML4-ALK fusion
proteins.
Arrow indicates the chromosomal breakpoint.
Figure 4D is a schematic representation of the TFG, ALK, and TFG-ALK fusion
proteins.
Arrow indicates the chromosomal breakpoint.
Figure 4E is a schematic representation of the SLC34A2, ROS, and SLC34A2-ROS
fusion
proteins. Arrow indicates the chromosomal breakpoint.
Figure 4F is a schematic representation of the CD74, ROS, and CD74-ROS fusion
proteins.
Arrow indicates the chromosomal breakpoint.
Figure 5A is a pie chart showing distribution of spectral counts among
receptor tyrosine
kinases in H1703.
Figure 5B is Western blots showing the effects of EGFR and PDGFR inhibitors on
Akt
phosphorylation. H1703 cells were either untreated or treated with EGF, EGF
with Iressa, or Gleevec
for 1 hr, and the levels of EGFR, PDGFRa, Akt were determined by western blot.
Phosphorylation of
EGFR(Tyr1068) and Akt(Ser473) were determined using phosphorylation-state-
specific antibodies.
Figure 5C is a graph showing that Imatinib mesylate inhibits cell growth and
induces
apoptosis in H1703 cells. H1703 cells were treated with Gleevec for 72 hr, and
MTS assay was
performed. Results from the means of triplicate experiments (error bars
indicate standard deviations)
were shown.
Figure 5D is a graph showing treatment of Imatinib on H1703 mouse xenographs.
Mice with
similar tumor size were divided to two groups, one group (5 mice) was treated
with Gleevec, the other
group (5 mice) was not treated. After 7 days of treatment, the size (mm length
x mm width) of each
tumor was measured.
Figure 5E is a cartoon showing regulation of PDGFRa phosphorylation in H1703
cells by
Imatinib. H1703 cell were labeled with light and heavy amino acids and
analyzed by LC-MS/MS
tandem mass spectrometry as described for SILAC. PDGFRa phosphorylation sites
detected by mass
spectrometry were indicated as well as the fold change measured after a 3 hr
treatment with Imatinib.
Figure 5F is a cartoon showing regulation of PDGFRa downstream signaling in
H1703 cells
as deermined by SILAC and LC-MS/MS. Red circles depict proteins with decreased
phosphorylation
following Imatinib treatment. Black and red arrows indicate known and
predicted (scansite and
netphosK) substrates, respectively.
Figure 6 is a graph showing clustering of phosphorylation sites on tyrosine
kinases. For each
tumor sample, the average count for the site across al I samples was
subtracted. The samples were then
clustered using the 120 sites with the highest standard deviation across all
samples, with the Pearson
correlation distance metric, and average linkage.
CA 02702938 2010-04-16
WO 2009/054939 PCT/US2008/011969
-6-
Figure 7 is a T-Test comparison showing signaling difference between tumor and
adjacent
tissues. Spectral counts for each protein in tumor and adjacent tissues were
normalized to the count
for GSK3 beta. Average counts across adjacent tissues were subtracted from all
tumors and adjacent
tissues. T-Test was carried out using TIGR's MeV program (Saeed, A.I., Sharov,
V., White, J., Li, J.,
Liang, W., Bhagabati, N., Braisted, J., Klapa, M., Currier, T., Thiagarajan,
M., et al. (2003) TM4: a
free, open-source system for microarray data management and analysis.
Biotechniques 34, 374-378)
with Pearson Correlation Distance and Average linkage clustering to identify
tyrosine phosphorylated
proteins that showed a significant difference between adjacent and tumor
tissue.
Figure 8A is a Western blot showing ALK expression in NSCLC cell lines. ALK
expression
is highly restricted to H2228 cell.
Figure 8B is a Western blot showing ROS expression in NSCLC cell lines. ROS
expression is
highly restricted to HCC78 cell line.
Figures 8C and 8D are a bar graph and Western blots, respectively, showing
that knock down
of ROS inhibits cell growth and induces cell death in HCC78 cells. HCC78 and
H2066 cells were
transfected with siRNA for ROS for 48 hrs. The viability of control and
transfected cells was
determined by the Trypan blue exclusion method. The mean percentage (of 4
experiments) +/- SD of
viable cells is represented as bar graphs. The cell lysates from both control
siRNA and ROS siRNA
(100 nM) were immunoblotted with ROS, Cleaved-PARP, and ^-actin antibodies.
Figure 8E is a bar graph and a Western blot showing an in vitro kinase assay.
pExchange-2 or
pExchange-2/SLC34A2-ROS(S) vector was transiently transfected into 293T cells,
ROS fusion
protein was immunoprecipitated with Myc-tag antibody, and kinase assay was
performed.
Figure 8F is Western blots showing subcellular localization of ROS fusion
protein.
pExchange-2 or pExchange-2/SLC34A2-ROS(S) vector was transiently transfected
into 293T cells.
Subcellular localization of the fusion protein was detected with Myc-tag
antibody. IGFI R, (i-actin,
and lamin A/C were used as a marker for plasma membrane (PM), Cytosol, and
Nuclei fraction.
Figure 8G is a diagram and micrographs showing that the ALK break-apart
rearrangement
probe contains two differently labeled probes on opposite sides of the
breakpoint of the ALK gene.
When hybridized, the native ALK region appears as an orange/green (yellow)
fusion signal, while
rearrangement at this locus will result in separate orange and green signals.
The H2228 cell line and a
patient sample contain two normal copies of ALK (yellow) and one proximal
probe (red; white arrow)
from the 3' part of the ALK locus. The 5' part of the locus appears to be
deleted. Schematic
representation of the EML4, ALK and EML4-ALK fusion proteins. Arrow indicates
the chromosomal
breakpoint.
Figure 8H is a diagram and micrographs showing rearrangement within the ROS
locus. A
break-apart probe was used to analyze rearrangement within the ROS locus.
Translocation within the
CA 02702938 2010-04-16
WO 2009/054939 PCT/US2008/011969
-7-
ROS locus leads to separation of yellow signals into red or green signals
(white arrows) shown in cell
line HCC78 (left) and an NSCLC adenocarcinoma sample (right).
Figure 9A is a Western blot showing PDGFRa in NSCLC cell lines. PDGFRa
expression is
highly restricted to H1703 cell line.
Figure 9B is Western blots showing dose-dependent inhibition of PDGFR a and
Akt
phosphorylation by Imatinib mesylate (Gleevec) in Hl 703 cells. HI 703 cells
were treated with the
indicated amount of Imatinib mesylate for 1 hour and the levels of Phospho-
PDGFRa (Tyr754),
phospho-Akt (Ser473), and phospho-MAPK (Thr202/Tyr204) measured by Western
blot. The total
protein levels of PDGFRa, Akt, and MAPK were also determined in the same
samples.
Figure 9C is a bar graph showing results of an apoptosis assay. Imatinib
mesylate (I PM, 10
M) or DMSO (control) was added to 40% confluent H 1703 cells, 24 hours later
both adhering cells
and floating cells were harvested, and apoptosis was measured by quantifying
cleaved caspase-3 by
flow cytometry. Results from the mean of 3 independent experiments are shown
(error bars indicate
standard deviations).
Figure 9D is Western blots showing that Imatinib induces cleaved PARP
expression in H1703
cells. H1703 cells were treated with increasing concentrations of Gleevec for
3 hours and cleaved-
PARP measured by immunoblotting. PDGFR alpha levels were measured to control
for total protein
loading.
Figure 9E is Western blots that confirm gleevec sensitive phosphorylation
sites. Western
analysis using site and phosphorylation-specific antibodies confirms decreased
phosphorylation of
PDGFRa, PLC yl, and SHP2 by Gleevec at the same sites identified by mass
spectrometry and
under the same Imatinib treatment conditions (1 pM for 3 hours).
Phosphorylation of Stat3, as
predicted by mass spectrometry, was not changed.
Figure 9F is pictures showing that Imatinib mesylate blocks tumor growth in
mouse
xenographs prepared from H1703 cells. Typical tumor size from 3 untreated mice
(red arrow) and 3
Gleevec treated mice (blue arrow) after 7 days of Imatinib treatment at
50mg/kg.
Figure 9G is micrographs showing that PDGFRa expression was seen more
frequently in
adenocarcinoma and Bronchioloalveolar Carcinoma.
Figure 9H is a diagram and micrographs showing amplification of PDGFRa. A
normal
control samples is shown on the left. Red signals indicate the PDGFRa probe
(white arrow) and green
signals the centromere, located on chromosome 4 in close proximity to PDGFRa.
Amplification of
PDGFRa in interphase nuclei from a squamous cell carcinoma patient is shown on
the right. The large
amplification is marked with a yellow arrow. This cell has 3 copies of
chromosome 4 of which one
shows amplification in the PDGFRa locus.
CA 02702938 2010-04-16
WO 2009/054939 PCT/US2008/011969
-8-
DETAILED DESCRIPTION OF THE INVENTION
In order that the invention herein described may be fully understood, the
following detailed
description is set forth.
Unless defined otherwise, all technical and scientific terms used herein have
the same
meaning as those commonly understood by one of ordinary skill in the art to
which this invention
belongs. Although methods and materials similar or equivalent to those
described herein can be used
in the practice or testing of the present invention, suitable methods and
materials are described below.
The materials, methods and examples are illustrative only, and are not
intended to be limiting. All
publications, patents and other documents mentioned herein are incorporated by
reference in their
entirety.
Throughout this specification, the word "comprise" or variations such as
"comprises" or
"comprising" will be understood to imply the inclusion of a stated integer or
groups of integers but
not the exclusion of any other integer or group of integers.
In order to further define the invention, the following terms and definitions
are provided
herein.
The term "sample" refers to a specimen that is obtained as or isolated from
tumor tissue, brain
tissue, cerebrospinal fluid, blood, plasma, serum, lymph, lymph nodes, spleen,
liver, bone marrow, or
any other biological specimen containing cancer cells.
The term "treating" or "treatment" is intended to mean reversing, mitigating,
inhibiting the
progress of, preventing or alleviating the symptoms of cancer in a mammal or
the improvement of an
ascertainable measurement associated with that cancer.
The term "subject" refers to a mammal, including, but not limited to, human,
primate, equine,
avian, bovine, porcine, canine, feline and murine.
The term "an effective dose" refers to the amount of an inhibitor sufficient
to inhibit a
tyrosine kinase.
The term "effectiveness of a treatment" refers the degree to which a disorder
or condition, or
one or more symptoms thereof, is reversed, alleviated, or prevented by a
treatment, or the degree to
which the progress of a disorder or condition is inhibited.
Methods of classifying cancer cells
The present invention provides methods of classifying cancer cells in a
sample. In some
embodiments, the methods comprise the steps of obtaining a sample of cancer
cells; detecting the
presence, absence, or levels of one or more tyrosine kinases in at least one
signaling pathway in the
sample; and classifying the cancer cells based on the presence, absence, or
levels of the one or more
CA 02702938 2010-04-16
WO 2009/054939 PCT/US2008/011969
-9-
tyrosine kinases. In alternate embodiments, the methods comprise the steps of
obtaining a sample of
cancer cells; detecting the presence, absence, or levels of one or more
phosphorylated tyrosine kinases
in at least one signaling pathway in the sample; and classifying the cancer
cells based on the presence,
absence, or levels of the one or more phosphorylated tyrosine kinases.
Cancer cells that may be used in the methods of the present invention include,
but are not
limited to, those cells derived from a cancer cell line or a solid tumor
within a subject. Cancer cells
may be obtained from any type of cancer, including, but not limited to, lung
cancer (including
squamous cell carcinoma of the lung), hematological cancer (including
lymphoma), prostate cancer,
breast cancer, and tumor of the gastrointestinal tract. In some embodiments,
the cancer is lung cell. In
preferred embodiments, the cancer is nonsmall cell lung cancer.
As used herein, the term tyrosine kinases generally refers to non-receptor
tyrosine kinases and
receptor tyrosine kinases. Non-receptor tyrosine kinases include, but are not
limited to, ABL, ACK,
CSK, FAK, FES, FRK, JAK, SRC, TEC, and SYK. Receptor tyrosine kinases include,
but are not
limited to, ALK, AXL, DDRI, DDR2, EGFR, EPH, ERB2, FGFR, INSR, MET, MUSK,
PDGFR,
PTK7, RET, ROR, ROS, TYK, TIE, TRK, VEGFR, AATYK, ephA2, VEGR-2, IGFRI, LYN,
HCK,
HER2, IRSI, IRS2, BRK, EphB4, FGFRI, ErbB3, EphBI, EphA4, EphAl, EphA5, Tyro3,
EphB2,
IGFI R, EphA2, EphB3, Mer, EphB4, and Kit. See Robinson, Wu and Lin, 2000, the
entire content of
which is incorporated by reference.
According to one embodiment, the cancer cells in a sample are classified based
on detecting
the presence, absence, or levels of tyrosine kinases. Suitable detection
methods are well known to
those skilled in the art and include, but are not limited to, florescent in
situ hybridization (FISH),
immunohistochemistry (IHC), polymerase chain reaction (PCR), mass spectrometry
(MS), flow
cytometry, Western blotting, and enzyme-linked immunoadsorbent assay (ELISA).
According to another embodiment, the cancer cells in a sample are classified
based on
detecting the presence, absence, or levels of phosphorylated tyrosine kinases.
Suitable detection
methods are well known to those skilled in the art and include, but are not
limited to,
immunoprecipitation of phosphopeptides from a sample and analysis of the
immunoprecipitated
phosphopeptides using, e.g., liquid chromatography (LC) MS/MS.
According to yet another embodiment, cancer cells in a sample are classified
based on
detecting the presence, absence, or levels of the activity of one or more
tyrosine kinases in at least one
signaling pathway in the sample. Suitable detection methods are well known to
those skilled in the art
and include, but are not limited to, those disclosed in U.S. Patent Nos.
6,066,462, 6,348,310, and
6,753,157, and European Patent No. 0 760 678 B9, the entire content of each of
which are
incorporated herein by reference.
CA 02702938 2010-04-16
WO 2009/054939 PCT/US2008/011969
- 10-
In some embodiments, the classification step is performed without the aid of
any statistical or
computational method. This embodiment is preferred when the number of samples
or the number of
tyrosine kinases to be examined are small.
In other embodiments, classification step is performed with the aid of
statistical or
computational methods. This embodiment is preferred when the number of samples
or the number of
tyrosine kinases to be examined are large. Statistical methods are known to
persons of ordinary skill
in the art and include, but are not limited to, computer programs. Suitable
computer programs,
include, but are not limited to, unsupervised Pearson clustering.
In some embodiments, the cancer cells are classified as having only one or two
highly
phosphorylated tyrosine kinases (class I). In other embodiments, the cancer
cells are classified as
expressing phosphorylated Fak, Src, Abl, and at least one receptor tyrosine
kinase selected from the
group consisting of EGFR, ALK, PDGFRa, Erb2, ROS, cMet, Ax I, ephA2, DDRI,
DDR2, FGFR,
VEGR-2, IGFRI, LYN, HCK, HER2, IRSI, IRS2 and BRK (class II). In other
embodiments, the
cancer cells are classified as expressing phosphorylated DDRI, Src, and AbI
(class III). In other
embodiments, the cancer cells are classified as expressing phosphorylated Src
and at least one
receptor tyrosine kinases selected from the group consisting of EGFR, ALK,
PDGFRa, Erb2, ROS,
cMet, Axl, ephA2, DDRI, DDR2, FGFR, VEGR-2, IGFR1, LYN, HCK, HER2, IRSI, IRS2
and
BRK (class IV). In other embodiments, the cancer cells are classified as
expressing phosphorylated
Src and AbI (class V).
In a preferred embodiment, the present invention provides methods to classify
nonsmall cell
lung cancer cells. According to one aspect of this embodiment, the method
comprises obtaining a
sample of NSCLC cells; determining the presence, absence, or levels of one or
more tyrosine kinases
in at least one signaling pathway in the sample; and classifying the NSCLC
cells based on the
presence, absence, or levels of the one or more tyrosine kinases. According to
another aspect of this
embodiment, the method comprises obtaining a sample of NSCLC cells;
determining the presence,
absence, or levels of one or more phosphorylated tyrosine kinases in at least
one signaling pathway in
the sample; and classifying the NSCLC cells based on the presence, absence, or
levels of one or more
phosphorylated tyrosine kinases.
Methods of treating cancer
The present invention also provides a method of treating cancer in a subject.
In some
embodiments, the method comprises the steps of obtaining a sample of cancer
cells from the subject;
classifying the cancer cells based on the levels of one or more aberrantly
expressed tyrosine kinases in
at least one signaling pathway in the sample; and administering an effective
dose of one or more
tyrosine kinase inhibitors based on the classification. In alternate
embodiments, the method
CA 02702938 2010-04-16
WO 2009/054939 PCT/US2008/011969
-11-
comprises the steps of obtaining a sample of cancer cells from the subject;
classifying the cancer cells
based on the levels of one or more aberrantly phosphorylated tyrosine kinases
in at least one signaling
pathway in the sample; and administering an effective dose of one or more
tyrosine kinase inhibitors
based on the classification.
The cancer cells that may be used in this method include, but are not limited
to, those derived
from lung cancer (including squamous cell carcinoma of the lung),
hematological cancer (including
lymphoma), prostate cancer, breast cancer, and tumor of the gastrointestinal
tract. In some
embodiments, the cancer is lung cell. In preferred embodiments, the cancer is
nonsmall cell lung
cancer.
The sample of cancer cells may be obtained by any method known in the art,
including but
not limited to, obtaining a specimen of a tumor from a subject.
In some embodiments, the cancer cells are classified based on aberrantly
expressed tyrosine
kinase. In alternate embodiments, the cancer cells are classified based on
aberrantly expressed
phophorylated tyrosine kinase. According to these embodiments, the expression
or phosphorylation
levels or activities of the tyrosine kinases (or phosphorylated tyrosine
kinases) are detected and
compared with those detected in samples containing normal cells.
In some embodiments, the cancer cells are classified as having only one or two
highly
phosphorylated tyrosine kinases (class 1). In other embodiments, the cancer
cells are classified as
expressing phosphorylated Fak, Src, Abl, and at least one receptor tyrosine
kinase selected from the
group consisting of EGFR, ALK, PDGFRa, Erb2, ROS, cMet, Axl, ephA2, DDRI,
DDR2, FGFR,
VEGR-2, IGFR1, LYN, HCK, HER2, IRSI, IRS2 and BRK (class II). In other
embodiments, the
cancer cells are classified as expressing phosphorylated DDRI, Src, and AbI
(class III). In other
embodiments, the cancer cells are classified as expressing phosphorylated Src
and at least one
receptor tyrosine kinases selected from the group consisting of EGFR, ALK,
PDGFRa, Erb2, ROS,
cMet, AxI, ephA2, DDRI, DDR2, FGFR, VEGR-2, IGFRI, LYN, HCK, HER2, IRSI, IRS2
and
BRK (class IV). In other embodiments, the cancer cells are classified as
expressing phosphorylated
Src and AbI (class V).
In the methods of treating cancer, an effective dose of one or more tyrosine
kinase inhibitors
is administered to a subject based on the classification. Suitable tyrosine
kinase inhibitors that may be
administered in the methods of the present invention are known in the art, and
include, but are not
limited to, Axitinib (also known as AGO 13736; Rugo, H.S., Herbst, R.S., Liu,
G., Park, J.W., Kies,
M.S., Steinfeldt, H.M., Pithavala, Y.K., Reich, S.D., Freddo, J.L., and
Wilding, G. (2005) Phase I
Trial of the Oral Antiangiogenesis Agent AG-013736 in Patients With Advanced
Solid Tumors:
Pharmacokinetic and Clinical Results. Journal of Clinical Oncology 23, 5474-
5483), Bosutinib
(Gambacorti-Passerini, C., Kantarjian, H.M., Baccarani, M., Porkka, K.,
Turkina, A., Zaritskey, A.Y.,
CA 02702938 2010-04-16
WO 2009/054939 PCT/US2008/011969
- 12-
Agarwal, S., Hewes, B., and Khoury, H.J. (2008) Activity and tolerance of
bosutinib in patients with
AP and BP CML and Ph+ ALL. J. Clin. Oncol. 26(May 20 suppl; abstr 7049)),
Cediranib (also
known as AZD2171; Wedge, S.R., Kendrew, J., Hennequin, L.F., Valentine, P.J.,
Barry, S.T., Brave,
S.R., Smith, N.R., James, N.H., Dukes, M., Curwen, J.O., Chester, R., Jackson,
J.A., Boffey, S.J.,
Kilburn, L.L., Barnett, S., Richmond, G.H.P., Wadsworth, P.F., Walker, M.,
Bigley, A.L., Taylor,
S.T., Cooper, L., Beck, S., Jurgensmeier, J.M., and Ogilvie, D.J. (2005)
AZD2171: A Highly Potent,
Orally Bioavailable, Vascular Endothelial Growth Factor Receptor-2 Tyrosine
Kinase Inhibitor for
the Treatment of Cancer. Cancer Res. 65, 4389-4400), Dasatinib (Talpaz, M.,
Shah, N.P., Kantarjian,
H., Donato, N., Nicoll, J., Paquette, R., Cortes, J., O'Brien, S., Nicaise,
C., Bleickardt, E.,
Blackwood-Chirchir, M.A., Iyer, V., Chen, T.-T., Phil., Huang, F., Decillis,
A.P., and Sawyers, C.L.
(2006) Dasatinib in Imatinib-Resistant Philadelphia Chromosome-Positive
Leukemias. N. Eng. J.
Med. 354, 2531-2541), Erlotinib (Perez-Soler, R., Chachoua, A., Hammond, L.A.,
Rowinsky, E.K.,
Huberman, M. Karp, D., Rigas, J., Clark, G.M., Santabarbara, P., and Bonomi,
P. (2004)
Determinants of Tumor Response and Survival With Erlotinib in Patients With
Non-Small-Cell Lung
Cancer. Journal of Clinical Oncology 22, 3238-3247.
Rappsilber, J., Ishihama, Y., and Mann, M. (2003) Stop and go extraction tips
for matrix-assisted
laser desorption/ionization, nanoelectrospray, and LC/MS sample pretreatment
in proteomics. Anal
Chem.75(3):663-70.), Gefitinib (Pao, W., Miller, V., Zakowski, M., Doherty,
J., Politi, K., Sarkaria,
I., Singh, B., Heelan, R., Rusch, V., Fulton, L., et al. (2004). EGF receptor
gene mutations are
common in lung cancers from "never smokers" and are associated with
sensitivity of tumors to
gefitinib and erlotinib. Proc. Natl. Acad. Sci. USA 101, 13306-13311.
Peduto, L., Reuter, V.E., Shaffer, D.R., Scher, H.I., and Blobel, C.P. (2005).
Critical function for
ADAM9 in mouse prostate cancer. Cancer Res. 65, 9312-9319), Imatinib
(Deininger, M.W.N. and
Druker B.J. (2003) Specific Targeted Therapy of Chronic Myelogenous Leukemia
with Imatinib.
Pharmacological Reviews 55, 401-423), Lapatinib (Burris III, H.A. (2004) Dual
kinase inhibition in
the treatment of breast cancer: initial experience with the EGFR/ErbB-2
inhibitor Lapatinib. The
Ongologist 9(suppl 3), 10-15), Lestaurtinib (Cephalon, Frazer, PA), Nilotinib
(Kantarjian, H., Giles,
F., Wunderle, L., Bhalla, K., O'Brien, S., Wassmann, B., Tanaka, C., Manley,
P., Rae, P., Mietlowski,
W., Bochinski, K., Hochhaus, A., Griffin, J.D., Hoelzer, D., Albitar, M.,
Dugan, M., Cortes, J.,
Alland, L., and Ottmann, O.G. (2006) Nilotinib in Imatinib-Resistant CML and
Philadelphia
Chromosome-Positive ALL. N. Eng. J. Med. 354, 2542-2551), Samaxanib
(O'Donnell, A., Padhani,
A., Hayes, C., Kakkar, A.J., Leach, M., Trigo, J.M., Scurr, M., Raynaud, F.,
and Phillips, S. (2005) A
Phase I study of the angiogenesis inhibitor SU5416 (semaxanib) in solid
tumours, incorporating
dynamic contrast MR pharmacodynamic end points. British Journal of Cancer 93,
876-883), Sunitinib
(Motzer, R.J., Hutson, T.E., Tomczak, P., Michaelson, M.D., Bukowski, R.M.,
Rixe, 0., Oudard, S.,
CA 02702938 2010-04-16
WO 2009/054939 PCT/US2008/011969
- 13-
Negrier, S., Szczylik, C., Kim, S.T., Chen, I., Bycott, P.W., Baum, C.M., and
Figlin, R.A. (2007)
Sunitinib versus Interferon Alfa in Metastatic Renal-Cell Carcinoma. N. Eng.
J. Med. 356, 115-124),
and Vandetanib (AstraZeneca, London, England).
The tyrosine kinase inhibitor may be administered using any of the various
methods known in
the art. In some embodiments, the tyrosine kinase inhibitor is administered
intravenously. In some
embodiments, the tyrosine kinase inhibitor is administered intramuscularly. In
some embodiments,
the tyrosine kinase inhibitor is administered subcutaneously.
Methods of determining effectiveness of a treatment
The present invention further provides methods of determining the
effectiveness of a
treatment for cancer in a subject. In some embodiments, the method comprises
obtaining a sample of
cancer cells from a subject; and detecting the presence, absence, or levels of
one or more tyrosine
kinases in at least one signaling pathway in the sample; wherein the presence,
absence, or levels of the
one or more tyrosine kinases is correlated to the effectiveness of the
treatment. In other embodiments,
the method comprises obtaining a sample of cancer cells from a subject; and
detecting the presence,
absence, or levels of one or more phosphorylated tyrosine kinases in at least
one signaling pathway in
the sample; wherein the presence, absence, or levels of the one or more
tyrosine kinases is correlated
to the effectiveness of the treatment.
The cancer cells that may be used in this method include, but are not limited
to, those derived
from lung cancer (including squamous cell carcinoma of the lung),
hematological cancer (including
lymphoma), prostate cancer, breast cancer, and tumor of the gastrointestinal
tract. In some
embodiments, the cancer is lung cell. In preferred embodiments, the cancer is
nonsmall cell lung
cancer.
In some embodiments, the presence, absence or levels of one or more tyrosine
kinases is
detected. In other embodiments, the presence, absence or levels of one or more
phosphorylated
tyrosine kinases is detected. Suitable methods for detecting tyrosine kinase
include, but are not
limited to, FISH, IHC, PCR, MS, flow cytometry, Western blotting, and ELISA.
Suitable methods for
detecting phosphorylated tyrosine kinase are well known in the art (e.g. U.S.
Patent No. 7,198,896
and 7,300,753 both of which are incorporated herein by reference in their
entirety).
Without wishing to be bound by any theory, it is believed that, because
protein tyrosine
phosphorylations exhibit significant differences between cancer cells and
normal cells, and among
different cancer cells, the presence, absence, or levels of tyrosine kinases
or phosphorylated tyrosine
kinases in signaling pathways in different cancer cells may be indicators of
the severity, stage, or type
of cancers, thus correlating with the effectiveness of a cancer treatment.
CA 02702938 2010-04-16
WO 2009/054939 PCT/US2008/011969
-14-
In order that this invention be more fully understood, the following examples
are set forth.
These examples are for the purpose of illustration only and are not to be
construed as limiting the
scope of the invention in any way.
Examples
EXAMPLE 1: Phosphotyrosine Profiles of NSCLC Tumors and Cell Lines
We used immunohistochemistry (IHC) and a phosphotyrosine-specific antibody to
screen 96
paraffin-embedded, formalin-fixed tissue samples from NSCLC patients (Figure 1
A). Approximately
30% of tumors showed high levels of phosphotyrosine expression. This group of
patient samples also
showed high levels of receptor tyrosine kinase (RTK) expression, suggesting
that RTK activity may
play a role in the genesis of these lung tumors. Immunoblotting of 41 NSCLC
cell lines with a
phosphotyrosinespecific antibody also showed heterogeneous reactivity
especially in the molecular
weight range characteristic of receptor tyrosine kinases (Figure 1 B).
To further characterize tyrosine kinase activity in NSCLC cell lines and solid
tumors, we used
an immunoaffinity phosphoproteomic approach. Because phosphotyrosine
represents less than I% of
the cellular phosphoproteome as determined by tandem mass spectrometry (MS/MS)
(Olsen, J.V.,
Blagoev, B., Gnad, F., Macek, B., Kumar, C., Mortensen, P., and Mann, M.
(2006). Global, in vivo,
and site-specific phosphorylation dynamics in signaling networks. Cell 127,
635-648) and is difficult
to analyze by conventional methods, we used immunoaffinity purification with a
phosphotyrosine
antibody to enrich for phosphotyrosine-containing peptides prior to analysis
by tandem mass
spectrometry (Rush, J., Moritz, A., Lee, K.A., Guo, A., Goss, V.L., Spek,
E.J., Zhang, H., Zha, X.M.,
Polakiewicz, R.D., and Comb, M.J. (2005). Immunoaffinity profiling of tyrosine
phosphorylation in
cancer cells. Nat. Biotechnol. 23, 94-101). All tumors were identified as
NSCLC based upon
standard pathology. Only tumors with greater than 50% of cancer cells were
included in the analysis.
We grew NSCLC cell lines overnight in low serum before analysis to reduce
background
phosphorylation resulting from culture conditions.
We detected phosphorylation status of a large number of sites (ranging between
150 and 1200
nonredundant sites/cell line or tumor) using this method and obtained
phosphotyrosine profiles from a
total of 41 NSCLC cell lines and 150 NSCLC tumors. 4551 sites of tyrosine
phosphorylation were
identified on greater than 2700 different proteins, dramatically extending our
knowledge of tyrosine
kinase signaling in NSCLC. We queried these these sites against PhosphoSite
(www.phosphosite.org), a comprehensive resource of known phosphorylation sites
(Hornbeck, P.V.,
Chabra, I., Kornhauser, J.M., Skrzypek, E., and Zhang, B. (2004). PhosphoSite:
A bioinformatics
resource dedicated to physiological protein phosphorylation. Proteomics 4,
1551-1561) and found
CA 02702938 2010-04-16
WO 2009/054939 PCT/US2008/011969
- 15-
that more than 85% appeared novel. These data have been deposited in
PhosphoSite and the data sets
are freely available via http://www.phosphosite.org/papers/rikova0l.html.
EXAMPLE 2: NSCLC Tyrosine Phosphorylation
As an initial step to screen for phosphotyrosine signaling abnormalities and
to compare
NSCLC proteins based upon phosphopeptide data sets, we adopted a
semiquantitative approach using
the number of phosphopeptide assignments to approximate the amount of
phosphopeptide present in
the sample. Roughly speaking, the wider the peak eluting from the LC column
the more frequently a
phosphopeptide is detected by LC MS/MS and hence the more phosphopeptide
present in the sample
(see Figure 1 C). For example, comparison of phosphopeptide numbers for c-Met
with the levels of
phosphorylated c-Met protein observed by western analysis are in good
agreement (Gilchrist, A., Au,
C.E., Hiding, J., Bell, A.W., Fernandez-Rodriguez, J., Lesimple, S., Nagaya,
H., Roy, L., Gosline,
S.J., Hallett, M., et al. (2006). Quantitative proteomics analysis of the
secretory pathway. Cell 127,
1265-1281; Old, W.M., Meyer-Arendt, K., Aveline-Wolf, L., Pierce, K.G.,
Mendoza, A., Sevinsky,
J.R., Resing, K.A., and Ahn, N.G. (2005). Comparison of label-free methods for
quantifying human
proteins by shotgun proteomics. Mol. Cell. Proteomics 4, 1487-1502; Zybailov,
B., Coleman, M.K.,
Florens, L., and Washburn, M.P. (2005). Correlation of relative abundance
ratios derived from
peptide ion chromatograms and spectrum counting for quantitative proteomic
analysis using stable
isotope labeling. Anal. Chem. 77, 6218-6224) (see Figure 1 D). We found this
approach preferable to-
other methods such as parent ion peak height because it allowed simplifying
the analysis by
combining all sites on a given protein.
We next compared the distribution of protein tyrosine phosphorylation in NSCLC
cell lines
and solid tumors based upon protein classification.
As shown in Figure 2A, protein kinases, adhesion proteins, and components of
the
cytoskeleton were the most highly phosphorylated protein types. Tumors
represent a complex tissue
ranging from 50% to 90% cancer cells. The tyrosine kinases, c-Met, EGFR, and
EphA2 showed the
highest levels of receptor tyrosine kinase phosphorylation in cell lines while
tumors showed high
levels of DDRI, EGFR, DDR2, and Eph receptor tyrosine kinase phosphorylation
(Figure 2B). Fak
and Src-family kinases made up the majority of NSCLC nonreceptor tyrosine
kinase phosphorylation
(Figure 2C). Most phosphorylation occured at the activation loop of these
kinases. We analyzed 266
different phosphorylation sites on over 56 different tyrosine kinases and
found that virtually all sites
(with a few exceptions such as the src family C-terminal sites) were
positively associated with kinase
activity (Blume-Jensen, P., and Hunter, T. (2001). Oncogenic kinase
signalling. Nature 411, 355-365;
Ullrich, A., and Schlessinger, J. (1990). Signal transduction by receptors
with tyrosine kinase activity.
CA 02702938 2010-04-16
WO 2009/054939 PCT/US2008/011969
-16-
Cell 61, 203-212). Without wishing to be bound by any theory, we believe that
tyrosine kinase
phosphorylation is a good readout of kinase activity.
EXAMPLE 3: Tyrosine Kinases Activated in NSCLC
A fraction of NSCLC tumors and cell lines exhibited high tyrosine
phosphorylation (Figures
1 A and I B) as a result of activated/overexpressed tyrosine kinases. To
identify abnormally activated
tyrosine kinases, we subtracted an average signaling profile derived from
either the 41 different
NSCLC cell lines or the 150 NSCLC tumors to obtain the unsupervised hierarchal
clustering results
shown in Figures 2E and 3A. This analysis highlighted differences among cell
lines and identified
highly phosphorylated (activated) tyrosine kinases (compare Figures 2D and
2E). Results were
consistent with previous reports of activated EGFR (Amann, J., Kalyankrishna,
S., Massion, P.P.,
Ohm, J.E., Girard, L., Shigematsu, H., Peyton, M., Juroske, D., Huang, Y.,
Stuart Salmon, J., et al.
(2005). Aberrant epidermal growth factor receptor signaling and enhanced
sensitivity to EGFR
inhibitors in lung cancer. Cancer Res. 65, 226-235), ErbB2 (Stephens, P.,
Hunter, C., Bignell, G.,
Edkins, S., Davies, H., Teague, J., Stevens, C., O'Meara, S.,Smith, R.,Parker,
A., et al. (2004). Lung
cancer: intragenic ERBB2 kinase mutations in tumours. Nature 431, 525-526),
ErbB3 (Engelman,
J.A., Janne, P.A., Mermel, C., Pearlberg, J., Mukohara, T., Fleet, C.,
Cichowski, K., Johnson, B.E.,
and Cantley, L.C. (2005). ErbB-3 mediates phosphoinositide 3-kinase activity
in gefitinib-sensitive
nonsmall cell lung cancer cell lines. Proc. Natl. Acad. Sci. USA 102, 3788-
3793), EphA2 (Kinch,
M.S., Moore, M.B., and Harpole, D.H., Jr. (2003). Predictive value of the
EphA2 receptor tyrosine
kinase in lung cancer recurrence and survival. Clin. Cancer Res. 9, 613-618),
and c-Met (Ma, P.C.,
Jagadeeswaran, R., Jagadeesh, S., Tretiakova, M.S., Nallasura, V., Fox, E.A.,
Hansen, M., Schaefer,
E., Naoki, K., Lader, A., et al. (2005). Functional expression and mutations
of c-Met and its
therapeutic inhibition with SUI 1274 and small interfering RNA in nonsmall
cell lung cancer. Cancer
Res. 65, 1479-1488) receptor tyrosine kinases in NSCLC cell lines. EGFR kinase
activity was
elevated in 11 cell lines (Figure 2E), and among these, five cell lines harbor
EGFR-activating
mutations. For example, we observed high levels of EGFR phosphopeptides in
HCC827 (Amann, J.,
Kalyankrishna, S., Massion, P.P., Ohm, J.E., Girard, L., Shigematsu, H.,
Peyton, M., Juroske, D.,
Huang, Y., Stuart Salmon, J., et al. (2005). Aberrant epidermal growth factor
receptor signaling and
enhanced sensitivity to EGFR inhibitors in lung cancer. Cancer Res. 65, 226-
235) and H3255 (Paez,
J.G., Janne, P.A., Lee, J.C., Tracy, S., Greulich, H., Gabriel, S., Herman,
P., Kaye, F.J., Lindeman, N.,
Boggon, T.J., et al. (2004). EGFR mutations in lung cancer: correlation with
clinical response to
gefitinib therapy. Science 304, 1497-1500; Tracy, S., Mukohara, T., Hansen,
M., Meyerson, M.,
Johnson, B.E., and Janne, P.A. (2004). Gefitinib induces apoptosis in the
EGFRL858R non-small-cell
lung cancer cell line H3255. Cancer Res. 64, 7241-7244), known to express
amplified and mutated
CA 02702938 2010-04-16
WO 2009/054939 PCT/US2008/011969
- 17-
EGFR. We observed high levels of c-Met and ErbB2 in H1993 and Calu-3 cell
lines, respectively,
consistent with previous reports (Lutterbach, B., Zeng, Q., Davis, L.J.,
Hatch, H., Hang, G., Kohl,
N.E., Gibbs, J.B., and Pan, B.S. (2007). Lung cancer cell lines harboring MET
gene amplification are
dependent on Met for growth and survival. Cancer Res. 67, 2081-2088; Ma, P.C.,
Jagadeeswaran, R.,
Jagadeesh, S., Tretiakova, M.S., Nallasura, V., Fox, E.A., Hansen, M.,
Schaefer, E., Naoki, K., Lader,
A., et al. (2005). Functional expression and mutations of c-Met and its
therapeutic inhibition with
SU11274 and small interfering RNA in nonsmall cell lung cancer. Cancer Res.
65, 1479-1488;
Minami, Y., Shimamura, T., Shah, K., Laframboise, T., Glatt, K.A., Liniker,
E., Borgman, C.L.,
Haringsma, H.J., Feng, W., Weir, B.A., et al. (2007). The major lung cancer-
derived mutants of
ERBB2 are oncogenic and are associated with sensitivity to the irreversible
EGFR/ERBB2 inhibitor
HKI-272. Oncogene 26, 5023-5027) and confirming known receptor tyrosine kinase
activity in
NSCLC cell lines.
A similar analysis of NSCLC tumors is shown in Figure 3A for all tyrosine
kinases and in
Figure 6 for all tyrosine kinase phosphorylation sites. We identified five
major groups of tumors
using unsupervised Pearson clustering (Figure 3A). From left to right are
tumors aberrantly
expressing the following: only one or two highly active tyrosine kinases
(group 1), tumors expressing
active Fak together with many different Src, Abl, and receptor tyrosine
kinases (group 2), tumors
expressing activated DDRI together with src and abl kinases (group 3), tumors
expressing Src kinases
with RTKs such as EGFR (group 4), and tumors expressing predominately src and
AbI tyrosine
kinases (group 5).
EXAMPLE 4: Tyrosine Kinase Substrate
We separated the analyzed phosphorylated substrates (excluding tyrosine and
Ser/Thr
kinases) from each group described in EXAMPLE 3. We identified the 30 most
informative
substrates (from over 2500 phosphorylated proteins) for groups 1, 2, and 4
(Figures 3B-3D). The
different groups have different active kinases and different phosphorylated
substrates. Group 2
tumors, with many active tyrosine kinases, showed higher levels of downstream
phosphorylation than
group I tumors. For example, group 2 tumors showed phosphorylation of proteins
involved in
motility and cytoskeleton dynamics as well as cell-surface receptors and
glycolytic enzymes. Overall,
group I tumors expressed lower levels of substrate phosphorylation that fall
into several subgroups
showing high SHP-1, IRS-1/2, and PI3KRI/2. Group 4 tumors showed
phosphorylation of different
substrates including PTEN and histones.
In general, we observed high phosphotyrosine IHC staining for group 2 tumors,
consistent
with the MS/MS results. We found no striking correlations of hierarchal
clustering groups with
available patient clinical data and tumor pathology. We also compared tumor
protein tyrosine
CA 02702938 2010-04-16
WO 2009/054939 PCT/US2008/011969
- 18-
phosphorylation to 48 adjacent lung tissue samples using t test comparison
(Figure 7). This analysis
identified significant signaling differences between tumor and normal tissue,
including many
cytoskeleton and signaling proteins.
EXAMPLE 5: Ranking Activated Tyrosine Kinases
We found that a fraction of cell lines and tumors expressed multiple activated
tyrosine kinases
(see group 2 tumors), complicating the identification of "driver" kinase(s)
(causally related to disease
pathogenesis) from other activated kinases functioning in downstream networks.
In addition, we also
found that hierarchical clustering was not useful in grouping tumors with high
EGFR phosphorylation
(see Figure 3A). This prompted us to instead develop an approach to identify
candidate driver
tyrosine kinases based upon identifying unusually high levels of tyrosine
kinase activity in a subgroup
of patients. We summed total phosphorylation for each kinase across either
Figure 2E or Figure 3A
and divided it by the number of cell lines or patients showing above average
phosporylation. Table I
shows the most highly phosphorylated receptor tyrosine kinases ranked by
average
phosphorylation/patient or cell line. This analysis identified unusually high
tyrosine kinase
phosphorylation in subsets of cell lines or patients. Of the top 20 RTKs, 15
were identified in both cell
lines and tumors. Of the top 10, Met, ALK, ROS, PDGFRa, DDRI, and EGFR were
found in both
cell lines and tumors (Table 1).
CA 02702938 2010-04-16
WO 2009/054939 PCT/US2008/011969
- 19-
Table 1. Comparison of RTK Phosphorylation in Subgroups of NSCLC Cell Lines
and
Tumors.
NSCLC cell lines NSCLC tumors
RTK's Phosp Number Phospho RTK's Norm Number Phospho
ho of cell level /cell alized of level
peptid lines line phosp samples /sample
e ho
sum peptid
es
sum
ROS 43 1 43 MET 847 12 71
ALK 36 1 36 ALK 464 7 66
MET 233 11 21 DDR1 3136 63 50
PDGFRa 40 2 20 ROS 50 1 50
ErbB2 44 3 15 1 VEGFR-2 662 16 41
EGFR 132 11 12 IGF1R 675 18 37
DDR1 9 1 9 PDGFRa 1295 37 35
EphB4 28 4 7 VEGFR-1 912 28 33
FGFR1 20 3 7 EGFR 1298 43 30
EphA2 64 10 6 Axl 761 26 29
ErbB3 38 6 6 EphB2 58 2 29
VEGFR- 16 3 5 EphA2 772 29 27
1
EphB1 10 2 5 DDR2 1439 58 25
AxI 24 6 4 FGFR1 93 4 23
EphA4 15 4 4 EphB3 793 38 21
EphAl 14 4 4 Mer 199 10 20
EphA5 3 1 3 Tyro3 167 10 17
Tyro3 12 4 3 EphB4 269 19 14
EphB2 11 5 2 ErbB2 60 5 12
IGF1R 3 2 2 { Kit 147 14 11
Abbreviations: RTK, receptor tyrosine kinase; NSCLC, non-small cell lung
cancer.
Identifying high kinase activity (phosphorylation) in subsets of cell lines
and patients. For patient samples,
phosphopeptide sum represents each protein's spectral counts normalized to
those for GSK3 beta and summed
CA 02702938 2010-04-16
WO 2009/054939 PCT/US2008/011969
-20-
across all 150 tumors, minus the average count for that protein over all
tumors. Number of samples represents
the number of tumors showing above average phosphopeptide count. For cell
lines, phosphopeptide sum
represents each protein's spectral counts after subtraction of the average
count for that protein over all 41 cell
lines; because the same number of cells was used in each experiment,
normalization was omitted. Cell lines and
tissues are ranked in order of decreasing counts per sample.
We next applied a ranking process to identify candidate disease drivers by
ranking kinases
based upon total phosphorylation. Among all cell lines with the highest EGFR
rank, we found that
EGFR was often the most highly phosphorylated tyrosine kinase, in others it is
among the top 2 or 3
kinases. We found all 5 cell lines carrying known EGFR-activating mutations
and cell lines carrying
known EGFR genomic amplification among the cell lines with highest EGFR rank.
We performed a similar analysis of NSCLC tumor samples using phosphorylation
rank to
identify tumors showing activated EGFR (Table 2). NSCLC tumors in this study
were all stage I or 2
and consist of 74% males, 52% smokers, and 30% adenocarcinoma. We found that,
among the 18
tumors with highest EGFR rank, 16 gave readable EGFR kinase domain DNA
sequence (Table 2); of
these, 9/16 tumors showed kinase domain-activating mutations with 8/8
adenocarcinomas and 5/5
female nonsmokers showing EGFR-activating mutations, consistent with previous
reports of
enrichment for female nonsmokers and adenocarcinoma (Lynch, T.J., Bell, D.W.,
Sordella, R.,
Gurubhagavatula, S., Okimoto, R.A., Brannigan, B.W., Harris, P.L., Haserlat,
S.M., Supko, J.G.,
Haluska, F.G., et al. (2004). Activating mutations in the epidermal growth
factor receptor underlying
responsiveness of non-small-cell lung cancer to gefitinib. N. Engl. J. Med.
350, 2129-2139; Pao, W.,
Miller, V., Zakowski, M., Doherty, J., Politi, K., Sarkaria, I., Singh, B.,
Heelan, R., Rusch, V., Fulton,
L., et al. (2004). EGF receptor gene mutations are common in lung cancers from
"never smokers"
and are associated with sensitivity of tumors to gefitinib and erlotinib.
Proc. Natl. Acad. Sci. USA
101, 13306-13311) (Table 2).
Table 2. Patients Grouped by Receptor T rosine Kinase Phos ho lation
EGFR `LK ROS PDGFRa
Nam! N m n o Na ,, ,, o 0 o Na Na Na + H
s~~~ ~>s'e~~m0 eO a e1g g g"s
EGFR 13 38 15 18 15 35 56 6 9 32 12 48 24 24 81 38 A 55 25 10 13 27 33 R 50 M
72 P 10 11 88 72 63
1 L 5 0 at 7 D 8 3
K S G
F
Ra
DDR1 12 18 12 14 19 30 95 31 95 D 12 9 12 0 12 Ep 19 D 23 33 33 16 2
0 8 D D h 4 0
1 R1
IGFIR 69 44 V 17 P 17 P 88 V 33 18
E D 0 E
G G G G
F F F
R1 Ra Ra 1
VEGFR=1 43 12 27 2 6 8 M 9 M 7 E 81 0 45 45 7 12
r at G D
F 1
R
POGFRa 38 17 24 21 11 24 38 8 4 Ep 6 V 62 V 36 46 48
h h E E
A3 .B3 G G
F F
CA 02702938 2010-04-16
WO 2009/054939 PCT/US2008/011969
-21-
DDR2 33 12 16 50 8 14 16 33 12 33 E 8 2 9 2E 4 60 1 6 6
G R E ;G
;"B S F
R '82 R
RI
EphA3 11 20 4 Fp 22 59 Ax 72 17
h .I 1
83
IneR 70 13 11 Ty 9
ro
t ~3
Eph83 1 2 6 1 43 18 Ep 3
s:fi ,~84
,j, E 2 27 2 19 Ep 13
A2
Ax1 42 64 9
t MET 8 39
VEGFR.2 14 62 1
t
A R
motatlon rc g Apa ~{ > ooO a .t Y Y Y ~[ '
m N N 1~ A I:... J J J J 0
QJ, JaJaJ. J JQ.JA, '1^~ IC: a d J G~ S . .~j L.'
= QI n ^ ~i W W W H w~ U t4
a v J a J a ^y on
"011 3= 'c
Pathobgy 0 0 0 0 0 0 a 0 0 0 0 0 0 ca Pa 0 a 0 Pa Pe Pa
Q a a Q a a a 0 0 0 e0 e.) 0 0 N U <
a th th to
N N N N N N N !N 0 +p 0 U
of 0 01 a 0 y cl y H a a
s. ;09 09 09 09
y y' y xY
Smoking no no no no ye no y: ye no y: no no y: no no no no no no S. no ,Sk ye
'S: ye ye ye no ye
- 'r s s s s s ,m in rim s m, s s s s
t , 2 f ofr 0k ok. ok
in. in in,
8.
9
Gender F F F F M M M M F M M M M M M M J G M F M M G' F G' M G' M M M F M
ed en en en
ae ae ae ,d
Abbreviations: AD, adenocarcinoma; SCC, squamous cell carcinoma
Patients grouped by high EGFR, Alk, Ros, Met and PDFGRa phosphorylation. For
patient samples,
each protein's spectral counts were normalized to those for GSK3 beta, and the
average count for that
protein over all tumors was subtracted. Above average receptor tyrosine kinase
phosphorylation counts
are shown. EGFR activating mutations, Alk and Ros transocations are indicated.
Having demonstrated that tumors with EGFR-activating mutations can be
identified by EGFR
phosphorylation rank, we applied the same approach to identify new candidate
driver tyrosine
kinases. As shown in Table 1, we found that Met, ALK, ROS, PDGFRa, DDRI, and
EGFR were
present in both cell lines and tumors. C-Met was found highly phosphorylated
in one patient sample
(Table 2), suggesting amplification as shown for H1993 cells where c-Met is a
known driver
(Lutterbach, B., Zeng, Q., Davis, L.J., Hatch, H., Hang, G., Kohl, N.E.,
Gibbs, J.B., and Pan, B.S.
(2007). Lung cancer cell lines harboring MET gene amplification are dependent
on Met for growth
and survival. Cancer Res. 67, 2081-2088). In contrast to EGFR and c-Met, the
kinases ALK, ROS,
PDGFRa, and DDRI have few literature connections to lung cancer. Because cell
line models are
critical to further testing the role of activated kinases in driving disease,
we examined the expression
of these candidates in NSCLC cell lines. Protein expression of ROS, ALK, and
PDGFRa appeared to
be highly upregulated in at least one NSCLC cell line (Figures 8A, 8B, and
9A). Although DDRI is
active in many tumors (Ford, C.E., Lau, S.K., Zhu, C.Q., Andersson, T., Tsao,
M.S., and Vogel, W.F.
(2007). Expression and mutation analysis of the discoidin domain receptors I
and 2 in non-small cell
CA 02702938 2010-04-16
WO 2009/054939 PCT/US2008/011969
-22-
lung carcinoma. Br. J. Cancer 96, 808-814), only H1993 cells express
phosphorylated DDR1, and
these cells are known to be driven by c-Met. Lack of a good DDRI cell line
model shifted the focus
to ALK, c-ROS, and PDGFRa where MS/MS data identified corresponding NSCLC cell
line models.
Tables 2 shows cell lines and tumors expressing the highest levels of ALK, c-
ROS, c-Met, and
PDGFRa phosphorylation. As seen for EGFR, these RTKs are often but not always
the most highly
phosphorylated tyrosine kinase (Table 2), suggesting that they may play a role
in driving disease. We
also ranked all phosphorylated proteins for cell lines and selected tumors
expressing ALK (Figure
3E), c-ROS (Figure 3F), and PDGFRa (Figure 3G). Among the most highly
phosphorylated
substrates, many are shared between cell lines and tumors and may participate
in downstream
oncogenic signaling (see arrows Figures 3E-3G). We found phosphopeptides in
HCC78, H2228, and
HI 703 cell lines and six different NSCLC tumors expressing ROS, ALK, EGFR,
PDFGRalpha, and
c-Met (over 2000 different phosphotyrosine sites).
We identified NSCLC tumors driven by EGFR-activating mutations. By ranking
EGFR
tyrosine kinase activity across cell lines and tumors, we found that high EGFR
rank dramatically
enriched for EGFR-activating mutations. Of 11 cell lines with high rank, 5
contained known EGFR-
activating mutations, and of the 16 EGFR tumors from which we obtained
sequence information, 8/9
were adenocarcinomas and 9 contained kinase domain-activating mutations. The
remaining squamous
cell carcinoma (SCC) patients showed high EGFR activity.
Roughly half of the high ranking EGFR cell lines and tumors carried EGFR-
activating
mutations. We thus grouped tumors based upon tyrosine kinase rank, leading to
the identification of
tumors expressing kinases activated above mean levels. We found the RTKs (Met,
ALK, DDRI,
ROS, VEGFR-2, IGF 1 R, PDGFRa, EGFR, and Axl) and the non-RTKs (FAK, LYN, FYN,
HCK,
FRK, BRK, and others shown in Figure 3A) to be highly phosphorylated in NSCLC.
EXAMPLE 6: ALK and ROS Fusion Proteins in NSCLC Cell Lines and Tumors
We observed high-level phosphorylation of ALK in the group of patients in the
upper left
corner of Figure 3A, cell line H2228 (Figures 2E and 4A and Table I) and ROS
in one tumor sample
and HCC78 cell line (Figure 4B and Table 1). Phosphorylation rank place ALK
and ROS near or at
the top in these samples (Table 1). Protein expression of ALK and ROS was
restricted among the
NSCLC cell lines and exhibited a smaller than predicted molecular weight
(Figures 8A and 8B). We
performed RT-PCR and DNA sequencing to investigate the expressed RNA
transcripts. 50 RACE
analysis of RNA transcripts derived from H2228 cells and three different tumor
samples demonstrated
fusion of ALK to EML4, a microtubule-associated protein (see Figure 4C). A
short N-terminal region
of EML4 was fused to the kinase domain of ALK at the precise point of fusion
observed in other
previously characterized ALK fusions (Figure 4C), such as the NPM-ALK (Morris,
S.W., Kirstein,
CA 02702938 2010-04-16
WO 2009/054939 PCT/US2008/011969
-23-
M.N., Valentine, M.B., Dittmer, K.G., Shapiro, D.N., Saltman, D.L., and Look,
A.T. (1994). Fusion
of a kinase gene, ALK, to a nucleolar protein gene, NPM, in non-Hodgkin's
lymphoma. Science 263,
1281-1284). ALK was also found fused to TFG (Hernandez, L., Pinyol, M.,
Hernandez, S., Bea, S.,
Pulford, K., Rosenwald, A., Lamant, L., Falini, B., Ott, G., Mason, D.Y., et
al. (1999). TRK-fused
gene (TFG) is a new partner of ALK in anaplastic large cell lymphoma producing
two structurally
different TFG-ALK translocations. Blood 94, 3265-3268) in one tumor sample
(Figure 4D). This
fusion is the same as the short form of TFG-ALK previously observed
(Hernandez, L., Bea, S.,
Bellosillo, B., Pinyol, M., Falini, B., Carbone, A., Ott, G., Rosenwald, A.,
Fernandez, A., Pulford, K.,
et al. (2002). Diversity of genomic breakpoints in TFG-ALK translocations in
anaplastic large cell
lymphomas: identification of a new TFG-ALK(XL) chimeric gene with transforming
activity. Am. J.
Pathol. 160, 1487-1494). In both EML4 and TFG fusions, a coiled-coil domain
was fused to the
kinase domain of ALK, likely conferring dimerization/oligomerization and
constitutive kinase
activity.
We performed a similar analysis of HCC78 cells and found fusion of ROS to the
transmembrane solute carrier protein SLC34A2. The N-terminal region of
SLC34A2, ending just
after the first transmembrane region, was fused N-terminal to the
transmembrane region of ROS
producing a truncated fusion protein with two transmembrane domains. We
observed two forms of
this fusion protein in HCC78 cells that likely represent different splicing
products produced from the
same translocation event (see Figure 4E). We identified a second ROS fusion in
the c-ROS-positive
NSCLC tumor. As shown in Figure 4F c-ROS is fused to the N-terminal half of
CD74, a type 11
transmembrane protein with high affinity for the MIF immune cytokine (Leng,
L., Metz, C.N., Fang,
Y., Xu, J., Donnelly, S., Baugh, J., Delohery, T., Chen, Y., Mitchell, R.A.,
and Bucala, R. (2003).
MIF signal transduction initiated by binding to CD74. J. Exp. Med. 197, 1467-
1476). The N-terminal
region of CD74 was fused to ROS at the precise site of SLC34A2-ROS fusion (see
Figure 4E)
creating a fusion protein with two transmembrane domains as found in the
SLC34A2 fusion.
Expression of a tagged SLC34A2-ROS fusion protein in mammalian cells showed
constitutive kinase
activity that localized to membrane fractions (see Figures 8E and 8F). We
sequenced the kinase
domains of ALK and ROS and found no mutations.
We found that experiments using siRNAs against ALK did not induce cell death
in H2228
cells, suggesting survival signaling independent of ALK, such as activating
mutations in P13K
(Samuels, Y., Diaz, L.A., Jr., Schmidt-Kittler, 0., Cummins, J.M., Delong, L.,
Cheong, I., Rago, C.,
Huso, D.L., Lengauer, C., Kinzler, K.W., et al. (2005). Mutant PIK3CA promotes
cell growth and
invasion of human cancer cells. Cancer Cell 7, 561-573; Samuels, Y., and
Velculescu, V.E. (2004).
Oncogenic mutations of PIK3CA in human cancers. Cell Cycle 3, 1221-1224) or
inactivation of
PTEN (Mellinghoff, l.K., Wang, M.Y., Vivanco, I., Haas-Kogan, D.A., Zhu, S.,
Dia, E.Q., Lu, K.V.,
CA 02702938 2010-04-16
WO 2009/054939 PCT/US2008/011969
-24-
Yoshimoto, K., Huang, J.H., Chute, D.J., et al. (2005). Molecular determinants
of the response of
glioblastomas to EGFR kinase inhibitors. N. Engl. J. Med. 353, 2012-2024). We
performed similar
experiments using siRNAs against ROS. Two different siRNAs against ROS were
effective in
reducing ROS protein expression and inducing cell death in HCC78 cells
(Figures 8C and 8D),
demonstrating a strict dependence upon ROS signaling for HCC78 cell survival.
We analyzed the most highly phosphorylated substrates in ALK-expressing cell
line and
tumor samples (Figure 3E) and identified candidate downstream signaling
molecules such as SHIP2,
IRS-1, and IRS-2 previously shown to be important downstream mediators of ALK
signaling in
anaplastic large cell lymphoma. In addition, phosphorylation of EML4, the
fusion partner, was
prominently seen (Figure 3E). We identified PTPNI I and IRS-2 previously
reported to be important
downstream effectors of ROS in glioblastoma (Charest, A., Wilker, E.W.,
McLaughlin, M.E., Lane,
K., Gowda, R., Coven, S., McMahon, K., Kovach, S., Feng, Y., Yaffe, M.B., et
al. (2006). ROS
fusion tyrosine kinase activates a SH2 domain-containing phosphatase-
2/phosphatidyIinositol-3-
kinase/mammalian target of rapamycin signaling axis to form glioblastoma in
mice. Cancer Res. 66,
7473-7481) as highly phosphorylated in c-ROS-expressing samples (Figure 3F).
We prepared FISH break-apart probes to either side of the ALK or ROS locus and
identified
translocations in both c-ROS-expressing cell lines and tumors (Figure 3H). As
ALK and EML4 are
located on the same arm of chromosome 2, deletion of the intervening DNA
confirmed the expected
break-apart pattern (Figure 3G). We performed RT-PCR analysis using ALK and
EML4 primers from
103 NSCLC tumors analyzed by MS/MS and identified 3 positive samples (Table 2)
giving a 3%
frequency for EML4-ALK; adding in the TGF-ALK sample gives an overall
frequency of ALK
fusions as 4% in the Chinese population.
EXAMPLE 7: PDGFRa Activation in NSCLC: Sensitivity to Imatinib
We identified PDGFRa as aberrantly activated in one NSCLC cell line, H 1703,
and eight
different tumor samples (Figure 5A and Table 1). We found that H1703 cells
also express
phosphorylated EGFR and FGFRI and several other RTKs (Figure 5A). We confirmed
protein
expression for PDGFRa by western blotting (Figure 9A). We investigated
sensitivity of H1703 cells
to the PDGFR inhibitor Imatinib (Gleevec) and the EGFR inhibitor Gefitinib
(Iressa). We found that
phosphorylation of Akt at Ser473 was blocked by Imatinib but not by Gefitinib
treatment (Figure 5B).
We also found that imatinib dose-response experiments (Figure 9B) indicated
almost complete
inhibition of PDGFRa and Akt phosphorylation at 100 nM Imatinib with little if
any effect on
p44/42MAPK phosphorylation.
We performed cell proliferation MTT assays to further investigate the
sensitivity of 20
NSCLC cell lines to Imatinib. As shown in Figure 5C, H1703 cells showed a
sensitivity profile
CA 02702938 2010-04-16
WO 2009/054939 PCT/US2008/011969
-25-
similar to K562 cells that overexpress Bcr-AbI fusion protein (Druker, B.J.,
Sawyers, C.L.,
Kantarjian, H., Resta, D.J., Reese, S.F., Ford, J.M., Capdeville, R., and
Talpaz, M. (2001). Activity of
a specific inhibitor of the BCR-ABL tyrosine kinase in the blast crisis of
chronic myeloid leukemia
and acute lymphoblastic leukemia with the Philadelphia chromosome. N. Engl. J.
Med. 344, 1038-
1042; Mahon, F.X., Deininger, M.W., Schultheis, B., Chabrol, J., Reiffers, J.,
Goldman, J.M., and
Melo, J.V. (2000). Selection and characterization of BCR-ABL positive cell
lines with differential
sensitivity to the tyrosine kinase inhibitor STI571: diverse mechanisms of
resistance. Blood 96, 1070-
1079). In contrast, 19 NSCLC cell lines (A549, H1373, H441, and many others
negative for PDGFRa
expression) were insensitive to Imatinib (Figure 5C), correlating drug
sensitivity with kinase
phosphorylation. The observed Imatinib sensitivity profile differed from a
previous report that
identified PDGFRa expression in A549 cells and showed sensitivity to Imatinib
(Zhang, P., Gao,
W.Y., Turner, S., and Ducatman, B.S. (2003). Gleevec (STI-571) inhibits lung
cancer cell growth
(A549) and potentiates the cisplatin effect in vitro. Mol. Cancer 2, 1). To
examine the effects of
Imatinib on apoptosis, we treated H 1703 cells with Imatinib and examined
cleavage of PARP and
caspase 3 by western blotting and flow cytometry, respectively. Imatinib (0.1
mM) significantly
increased cleaved caspase 3 and cleaved PARP expression in H1703 cells
(Figures 8C and 8D). We
next examined the effects of Imatinib in vivo using mouse xenograft models. We
injected nude mice
subcutaneously with H1703 cells and monitored tumor formation over a period of
several weeks.
Upon appearance of the first visible tumors, we treated the mice daily with
Imatinib (50 mg/kg) or
vehicle for a 2 week period. Imatinib-treated mice showed immediate and
profound effects on tumor
growth, while tumor growth continued in control mice (Figures 5D and 8F). We
quantified tumor
growth in control and Imatinib-treated animals (Figure 5D), demonstrating
exquisite sensitivity to
Imatinib even in the complex tumor environment.
To analyze the effects of Imatinib on phosphotyrosine signaling, we grew H1703
cells in
heavy and light amino acid-labeled media, treated with and without Imatinib,
and analyzed
phosphopeptides by mass spectrometry/SILAC (Everley, P.A., Bakalarski, C.E.,
Elias, J.E.,
Waghorne, C.G., Beausoleil, S.A., Gerber, S.A., Faherty, B.K., Zetter, B.R.,
and Gygi, S.P. (2006).
Enhanced analysis of metastatic prostate cancer using stable isotopes and high
mass accuracy
instrumentation. J. Proteome Res. 5, 1224-1231; Ong, S.E., Blagoev, B.,
Kratchmarova, I.,
Kristensen, D.B., Steen, H., Pandey, A., and Mann, M. (2002). Stable isotope
labeling by amino acids
in cell culture, SILAC, as a simple and accurate approach to expression
proteomics. Mol. Cell.
Proteomics 1, 376-386). Some proteins and phosphorylation sites changed upon
treatment with
Imatinib. Treatment of H 1703 cells with Imatinib had different effects on
different sites of the
PDGFRa receptor (Figure 5E). Ten sites of tyrosine phosphorylation were
observed and three new
sites were identified (Tyr613, 926, and 962). Imatinib also suppressed
tyrosine phosphorylation of a
CA 02702938 2010-04-16
WO 2009/054939 PCT/US2008/011969
-26-
number of important downstream signaling proteins including phospholipase Cg
1, the regulatory
subunit of P13K, Stat5, and SHP-2 (see Figure 5F). In addition, Imatinib
suppressed
tyrosinephosphorylation of proteins regulating the cytoskeleton and actin
reorganization and signaling
molecules involved in membrane recycling and endocytosis. We found the cell-
surface
metalloproteinase Adam 9 (Mazzocca, A., Coppari, R., De Franco, R., Cho, J.Y.,
Libermann, T.A.,
Pinzani, M., and Toker, A. (2005). A secreted form of ADAM9 promotes carcinoma
invasion through
tumor-stromal interactions. Cancer Res. 65, 4728-4738) known to liberate
ligands for EGFR and
FGFR (Peduto, L., Reuter, V.E., Shaffer, D.R., Scher, H.I., and Blobel, C.P.
(2005). Critical function
for ADAM9 in mouse prostate cancer. Cancer Res. 65, 9312-9319) to be highly
phosphorylated in
H1703 cells. Imatinib also inhibited phosphorylation of the ras effector Rini
(Hu, H., Bliss, J.M.,
Wang, Y., and Colicelli, J. (2005). RIN1 is an ABL tyrosine kinase activator
and a regulator of
epithelial-cell adhesion and migration. Curr. Biol. 15, 815-823) and inhibited
phosphorylation of
SMS2, an enzyme involved in ceramide synthesis (Taguchi, Y., Kondo, T.,
Watanabe, M., Miyaji,
M., Umehara, H., Kozutsumi, Y., and Okazaki, T. (2004). Interleukin-2-induced
survival of natural
killer (NK) cells involving phosphatidylinositol-3 kinasedependent reduction
of ceramide through
acid sphingomyelinase, sphingomyelin synthase, and glucosylceramide synthase.
Blood 104, 3285-
3293). Western analysis confirmed selected SILAC results (Figure 9E). We
repeated this experiment
on three different occasions with similar results.
EXAMPLE 8: PDGFRa in NSCLC Tumor Samples
We analyzed peptides from five tumors with the highest levels of PDGFR
phosphorylation in
Table 2. We found that these tumors (group 2; Figure 3A) also expressed FAK,
Abl, DDRI/2, and
VEGFI/2 in addition to many other active tyrosine kinases. Similar to H1703
cells, these NSCLC
tumors also showed highly phosphorylated adhesion and cytoskeleton proteins
(Figure 3G),
suggesting engagement of cell motility pathways. We performed an independent
analysis by IHC
using a PDGFRa-specific antibody to screen NSCLC tumor samples and identified
strong PDGFRa
staining in 2%3% of patient samples (Figure 9G). The results also differed
from the report (Zhang,
P., Gao, W.Y., Turner, S., and Ducatman, B.S. (2003). Gleevec (STI-571)
inhibits lung cancer cell
growth (A549) and potentiates the cisplatin effect in vitro. Mol. Cancer 2, 1)
that 100% of NSCLC
adenocarcinomas express PDGFRa. We observed amplification at the PDGFRa locus
by
fluorescence in situ hybridization (FISH) analysis in one of the IHC-positive
NSCLC samples (Figure
9H).
In order that the experimental procedures described in the Examples be more
fully
understood, some materials and methods used in the Examples are set forth
below. These materials
CA 02702938 2010-04-16
WO 2009/054939 PCT/US2008/011969
-27-
and methods are for the purpose of illustration only and are not to be
construed as limiting the scope
of the invention in any way.
Cell Culture, Reagents, Western Blot, and Immunoprecipitation Analysis
We purchased cell culture reagents from Invitrogen. We obtained human NSCLC
cell lines
from American Type Culture Collection. We purchased ROS and phospho-PDGFRa
antibodies from
Santa Cruz, all other antibodies from Cell Signaling Technology (CST). We
performed Western blot
and Immunoprecipitation analyses following CST protocols.
We obtained human NSCLC cell lines H520, H838, H1437, H1563, H1568, H1792,
H1944,
H2170, H2172, HCC827, H2228, H2347, A549, H441, H1703, H1373, H358, H1993,
Calu-3, H1648,
H1975, H1666, H1869, H1650, H1734, H1793, H2023, H661, H2444, H1299, H1693,
H226, H1623,
H1651, H460, H2122, and SKMES-1 from American Type Culture Collection, and
cultured the cells
in RPMI 1640 medium with 10% FBS and adjusted to contain 2 mM L-glutamine, 1.5
g/L sodium
bicarbonate, 4.5 g/L glucose, 10 mM HEPES, 1.0 mM sodium pyruvate,
penicillin/streptomycin. We
purchased NSCLC cell lines HCC78, Cal-12T, HCC366, HCCI5, HCC44, and LOU-NH91
from
DSMZ, and cultured them in RPMI 1640 containing 10% FBS and
penicillin/streptomycin. We
maintained cells in a 5% C02 incubator at 37 C. For the immunoaffinity
precipitation and
immunoblot experiments, we grew cells to 80% confluence and then starved them
in RPMI medium
without FBS overnight before harvesting. We dissolved drugs (Iressa and
Gleevec) in DMSO to yield
10mM stock solution and stored at -20 C.
We washed treated cells twice with cold PBS and then lysed them in I X cell
lysis buffer (20
mM Tris-HCI, pH 7.5, 150 mM NaCl, 1 mM Na2EDTA, 1 mM EGTA, I% Triton, 2.5 mM
sodium
pyrophosphate, 1 mM beta-glycerophosphate, 1 mM Na3VO4, I g/ml leupeptin)
supplemented with
Complete, Mini, EDTA-free protease inhibitor cocktail (Roche). We sonicated
lysates and centrifuged
them at 14000 rpm for 15 min. We measured the protein concentration using
Coomassie protein assay
reagent (Pierce Chemical Co., Rockford, IL). We resolved equal amounts of
total protein by 8-10%
SDS-PAGE gel and transferred them to nitrocellulose membranes. We incubated
blots overnight at 4
C with the appropriate antibodies by following CST protocols. We used 500 ug
of protein lysate for
immunoprecipitation. We rocked the cleared protein lysate with 2 ug of proper
antibody and 15 ul
protein G agarose beads (Pierce) overnight at 4 C. We washed the beads three
times with I x cell
lysis buffer and boiled them in 30 ul of 2x SDS-PAGE sample buffer for 5 min.
We then analyzed
bound protein by Western blot.
CA 02702938 2010-04-16
WO 2009/054939 PCT/US2008/011969
-28-
Phosphopeptide Immunoprecipitation and Analysis by LC-MS/MS Mass Spectromety
We performed phosphopeptide immunoprecipitation from different cell lines as
described
previously (Rush, J., Moritz, A., Lee, K.A., Guo, A., Goss, V.L., Spek, E.J.,
Zhang, H., Zha, X.M.,
Polakiewicz, R.D., and Comb, M.J. (2005). Immunoaffinity profiling of tyrosine
phosphorylation in
cancer cells. Nat. Biotechnol. 23, 94-101) using the PhosphoScan Kit (P-Tyr-
100) from CST. Briefly,
we lysed 100 million cells in urea lysis buffer (20 mM Hepes, pH 8.0, 9 M
Urea, 1 mM sodium
vanadate, 2.5 mM sodium pyrophosphate, 1 mM beta-glycerophosphate).
For tumor samples, we homogenized 200-500 mg tissue in urea lysis buffer (I
ml/100 mg
tissue) using an electronic homogenizer PolyTron for 2 pulses of 30 seconds
each time. We sonicated
the lysate and cleared it by centrifugation. We reduced cleared lysate by DTT
and alkylated it with
iodoacetamide. We then diluted samples 4 times with 20 mM Hepes to reduce Urea
concentration to
2M, and digested them by trypsin overnight at room temperature with gentle
shaking. We cruedly
purified peptides with Sep-Pak C18 cartridges. We lyophilized eluate and
dissolved dried peptides in
1.4 ml of MOPS IP buffer (50 mM MOPS/NaOH pH 7.2, 10 mM Na2PO4, 50 mM NaCl)
and
removed insoluble material by centrifugation. We carried out
immunoprecipitation at 4 C for
overnight with 160 ug phospho-tyrosine 100 antibody (CST) coupled to protein G
agarose beads
(Roche). We then washed the beads 3 times with I ml MOPS IP buffer and twice
with I ml cold
HPLC grade dH2O in the cold. We concentrated peptides in the IAP eluate and
further purified them
on 0.2 l reverse-phase StageTips (Rappsilber, J., Ishihama, Y., and Mann, M.
(2003) Stop and go
extraction tips for matrix-assisted laser desorption/ionization,
nanoelectrospray, and LC/MS sample
pretreatment in proteomics. Anal Chem.75(3):663-70). We eluted peptides from
StageTips with 5 p1
of 60% MeCN, 0.1 % TFA into an LC-MS sample vial and took them to dryness with
a vacuum
concentrator. We dissolved dry samples in 5 I of 5% formic acid, 5% MeCN. We
loaded the sample
(4 l) onto a 10 cm x 75 pm PicoFrit capillary column (New Objective) packed
with Magic C18 AQ
reversed-phase resin (Michrom Bioresources) using a Famos autosampler with an
inert sample
injection valve (Dionex). We then developed the column with a 45-min linear
gradient of acetonitrile
in 0.4% acetic acid, 0.005% HFBA delivered at 280 nl/min (Ultimate, Dionex).
We collected tandem
mass spectra in a data-dependent manner with an LTQ ion trap mass spectrometer
(Thermo Finnigan),
using a top-ten method, a dynamic exclusion repeat count of 1, and a repeat
duration of 30 sec. We
collected samples which we ran on the LTQ-Orbitrap Tandem mass spectra with an
LTQ - Orbitrap
hybrid mass spectrometer, using a top-ten method, a dynamic exclusion repeat
count of 1, and a
repeat duration of 30 sec. We collected MS spectra in the Orbitrap component
of the mass
spectrometer and collected MS/MS spectra in the LTQ.
CA 02702938 2010-04-16
WO 2009/054939 PCT/US2008/011969
-29-
SILAC Analsysi of H1703 Cells Treated with Gleevec
We split equal number of H1703 cells and grew them in either light or heavy
SILAC medium
(RPMI medium lacking arginine and lysine supplemented with either regular L-
Lysine:HCI and L-
Arginine:HCL (Sigma) for light medium, or supplemented with L-arginine:HCI (U-
13 C6,98%) and
L-lysine:2HCI (U-13C6,98%; U-15N2,98%) (Cambridge Isotope Laboratories) for
heavy medium.
The medium also contained 10% FBS, and penicillin/streptomycin. We grew cells
for at least five
generations to reach 100 million cells in each medium type. We then treated
cells grown in the heavy
medium with IjM Gleevec for 3 hours. We lysed both treated and control cells
in Urea lysis buffer
and combined them for phosphopeptide immunoprecipitation experiment as
described above.
Analysis of Phosphorylation Site Data Sets
To assign peptide sequences, we used the hash string-matching algorithm,
implemented in
Biofacet (Gene-IT) to search proteins in PhosphoSite. If the peptide sequence
matched multiple
proteins, the protein with the first accession number in alphabetical order
was chosen as a
representative. For example, GASQAGM#TGY*GMPR matches both SM22-alpha (P37802)
and
TAGLN3 (Q9UI 15) and would be assigned to SM22-alpha. For a few peptides, we
mannually chose
the best studied protein of a set to be the representative. In the case of the
peptide GEPNVSY*ICSR
matching both GSK3a (P49840) and GSK30 (P49841), we assigned GSK30 as the
representative.
We counted the number of spectra observed for each peptide sequence in a mass
spectrometry
run (Liu, H., Sadygov, R.G., and Yates, J.R., 3rd. (2004). A model for random
sampling and
estimation of relative protein abundance in shotgun proteomics. Anal. Chem.
76, 4193-4201). We
subjected spectra to the quality criteria described below (i.e., in "Methods
for LTQ-FT MS, Sequest
Searches and Vista (pTyr SILAC Samples)"). To calculate a protein spectrum
count, we summed the
numbers for all of the peptides assigned to each protein in that run. We
carried out hierarchal
clustering using TIGR's MeV program (Saeed, A.I., Sharov, V., White, J., Li,
J., Liang, W.,
Bhagabati, N., Braisted, J., Klapa, M., Currier, T., Thiagarajan, M., et al.
(2003) TM4: a free, open-
source system for microarray data management and analysis. Biotechniques 34,
374-378) with
Pearson Correlation Distance and Average linkage clustering. We imported the
number of times a
given phosphoprotein was identified (sum of all observed spectra assigned to
that protein) into MeV
and used it to assemble heat maps.
For each patient sample, we normalized each protein's spectral counts to those
for GSK30,
and subtracted the average count for that protein over all tumors.
CA 02702938 2010-04-16
WO 2009/054939 PCT/US2008/011969
-30-
Methods for LTO-FT MS, Sequest Searches and Vista (pTyr SILAC Samples)
We LC-MS analyzed each phosphopeptide sample in duplicate. We packed a fused
silica
microcapillary column (125 gm x 18 cm) with C18 reverse-phase resin (Magic
CI8AQ, 5 gm
particles, 200 A pore size, Michrom Bioresources, Auburn, CA). We loaded
samples (4 1L) onto this
column with an autosampler (LC Packings Famos, San Francisco, CA) and eluted
them into the mass
spectrometer by a 55-min linear gradient of 7 to 30% acetonitrile in 0.1 %
formic acid. We delivered
the gradient at approximately 600 nl/min using a binary HPLC pump (Agilent
1100, Palo Alto, CA)
with an in-line flow splitter. We mass analyzed eluting peptide ions with a
hybrid linear ion trap-7
Tesla ion cyclotron resonance Fourier transform instrument (LTQ-FT, Thermo
Electron, San Jose,
CA). We employed a top-seven method, whereby we collected 7 data-dependent
MS/MS scans in the
linear ion trap based on measurements made during the previous MS survey scan
in the ICR cell, with
the linear ion trap and the Fourier transform instrument operating
concurrently. We performed MS
scans at 375-1800 m/z with an automatic gain control (AGC) target of 3x10⁶ and
a mass resolution of
105. For MS/MS the AGC was 4000, the dynamic exclusion time was 25 s, and
singly-charged ions
were rejected by charge-state screening.
We assigned peptide sequences to MS/MS spectra using Sequest software (v.27,
rev. 12) and a
composite forward/reverse IPI human protein database. Search parameters were:
trypsin as protease;
1.08 Da precursor mass tolerance; static modification on cysteine (+57.02146,
carboxamidomethylation); and dynamic modifications on serine, threonine and
tyrosine (+79.96633
Da, phosphorylation), lysine (+8.01420, 13C6 15N2), arginine (+6.02013, 13C6)
and methionine
(+15.99491, oxidation). We used a target/decoy database approach to establish
appropriate score-
filtering criteria such that the estimated false-positive assignment rate was
<1 %. In addition to
exceeding charge-dependent XCorr thresholds (for z = 2, XCorr>2.2; for z = 3,
XCorr>3.3; for z=4,
XCorr>3.5), we required assignments to contain phosphotyrosine, to have a mass
accuracy of -5 to
+25 ppm, and to contain either all-light or all-heavy lysine/arginine
residues. We further evaluated
assignments passing these criteria using a custom quantification program Vista
(Bakalarski, C.E.,
Elias, J.E., Villen, J. Haas, W., Gerber, S.A., Everley, P.A., and Gygi, S.P.
(2008) The Impact of
Peptide Abundance and Dynamic Range on Stable-Isotope-Based Quantitative
Proteomic Analyses. J.
Proteome Res. 10.1021/pr800333e) to calculate peak areas and ultimately a
relative abundance
between heavy and light forms of each peptide. We did not consider identified
peptides with signal-
to-noise in the MS scan below 15 for quantification. For those peptides found
only in one of the
conditions we used the signal-to-noise ratio instead.
CA 02702938 2010-04-16
WO 2009/054939 PCT/US2008/011969
-31-
5' RACE and RT-PCR
We performed rapid amplification of cDNA ends with the use of 5' RACE system
(Invitrogen). We extracted total RNA from cell lines and patients with RNeasy
mini Kit (Qiagen).
The primers used to identify aberrant Alk transcript in cell line and patients
in 5' RACE reaction are
Alk-GSPI primer (5'-GCAGTAGTTGGGGTTGTAGTC) for cDNA sysnthesis and Alk -GSP2
(5'-
GCGGAGCTTGCTCAGCTTGT) and Alk-GSP3 (5'-TGCAGCTCCTGGTGCTTCC) for a nested
PCR reaction. The primers used to identify aberrant Ros transcript in cell
line and patient in 5' RACE
reaction are Ros-GSPI primer (5'-TGGAAACGAAGAACCGAGAAGGGT) for cDNA synthesis
and
Ros-GSP 2 (5'- AAGACAAAGAGTTGGCTGAGCTGCG) and Ros-GSP3 (5'-
AATCCCACTGACCTTTGTCTGGCAT) for the nested PCR reaction. We purified the PCR
product
with PCR purification kit (Qiagen) and sequenced it using Alk-GSP3 and Ros-
GSP3 respectively
using ABI 3130 capillary automatic DNA sequencer (Applied biosystem).
SiRNA
We obtained the following ROS siRNA oligonucleoties from Proligo: ROSI(6318-
6340) 5'-
AAGCCCGGAUGGCAACGUUTT-3', ROSI(7181-7203) 5'-AAGCCUGAAGGCCUGAACUTT-
3'. We seeded NSCLC cells in 12 well plates the day before the transfection,
transfected 100 nM
ROSI siRNA using Mirus TranslT-TKO Transfection Reagent and 48 hours after
transfection serum
starved cells for additional 24 hours. We harvested cells by trypsinization,
counted them, and
prepared cell lysate to examine ROS protein levels by western blotting.
Animal Studies
We purchased four to six weeks female NCR nude mice from Taconic ande used
them to
generate H1703 xenograft. We carried out experiments under an IACUC approved
protocol. We
followed institutional guidelines for the proper and humane use of animals in
research. We generated
tumors by injecting 10 mice with 5x10⁶ H1703 cells and reconstituted basement
membrane Matrigel
(BD Biosciences) with 1:1 ratio in PBS. Drug treatment started when the tumor
was about 1 mm x
1 mm size. 5 mice were treated with Gleevec at 50mg/kg/day by oral gavage
using a ball ended
feeding needle. 5 mice were untreated. We sacrified animals 7 days after
treatment initiation, and
excised and weighed tumors. We measured the average tumor diameter using
caliper in both control
and treated groups of mice.
CA 02702938 2010-04-16
WO 2009/054939 PCT/US2008/011969
-32-
Growth Inhibition Assay and Apoptosis Assay
We performed cell growth inhibition assay with CellTiter 96 Aqueous One
Solution Cell
Proliferation Assay (Promega) according to manufacturer's suggestion. Briefly,
we seeded 1000 to
5000 cells onto flat-bottomed 96-well plates and grew them in complete medium
with 10% FBS.
After 24 hours, we changed the cell medium to 100 l complete growth medium
with 10% FBS
containing various concentrations of Gleevec, and incubated the cells for an
additional 72 hours. We
applied each drug concentration to triplicate well of cells. At the end of the
incubation, we added 20
l of CellTiter 96 AQUESOUS One solution to each well, and incubated the plate
for 1-4 hours. We
read absorbance at 490 nm using a Titan Multiskan Ascent microplate reader
(Titertek Instrument).
We expressed growth inhibition as mean SD value of percentage of absorbance
reading from treated
cells vs untreated cells. We repeated the assay at least three times. We
calculated IC50 with the use of
OriginPro 6.1 software (OriginLab, Northampton, MA).
We measured Gleevec-induced apoptosis by quantifying caspase activation using
flow
cytometry. We treated cells with Gleevec (1 M, 10 M, or DMSO only) for 24
hrs in 15 cm
triplicate plates. We rinsed cells briefly in PBS, gently scraped them off the
dish in PBS with a cell
scraper, pelleted them, and immediately fixed them with 3% formaldehyde in PBS
for 10 min at
37 C. We then permeabilized the cells with ice-cold 90% methanol and stored
them at -20 C in this
solution for further analysis. We aliquoted fixed and permeabilized cells
(5x10⁶) into 12x75 mm
polypropylene culture tubes, rinsed them in PBS by centrifugation, and then
incubated them in PBS
with 0.5% BSA (PBS/BSA) for 10 min at room temperature to block nonspecific
binding. We then
incubated cells with an AlexaFluor 488-conjugated cleaved caspase-3 (Asp 175)
antibody (#9669, Cell
Signaling Technology, Danvers, MA) diluted 1:10 in PBS/BSA for one hour at
room temperature. We
subsequently rinsed cells in PBS/BSA by centrifugation, resuspended them in
0.5 ml PBS/BSA, and
analyzed them on a Beckman-Coulter FC500 flow cytometer using a 488 nm argon
laser for
excitation.
In vitro Kinase Assay
We amplified the open reading frame of the short form of SLC34A2-ROS (S)
fusion gene by
PCR from cDNA of HCC78, and cloned it in frame to pExchange-2 vector
(Strategene, CA) with C-
terminal Myc-tag. We transfected 293T cells grown in DMEM with 10% fetal calf
serum with
pExchange-2 and pExchange-2/SLC34A2-ROS (S), respectively. We harvested cell
lysates w 48 hour
after transfection. Following immunoprecipitation with Myctag antibody, we
washed Ros immune
complex 3 times with kinase buffer (60 mM HEPES, 5 mM MgCI2, 5 mM MnC12, 3 p.M
Na3VO4 and
2.5 mM DTT). We initiated kinase reactions by re-suspending the Ros immune
complex into 50 gI
CA 02702938 2010-04-16
WO 2009/054939 PCT/US2008/011969
-33-
kinase buffer that contains 25 M ATP, 0.2 uCi/ul [gamma32p] ATP, with I mg/ml
of either Poly
(EY, 4:1) or AAAEEEYMMMFAKKK as substrate. We stopped reactions by spotting
reaction
cocktail onto p8l filter papers. We then washed samples and assayed them for
kinase activity by
detection with a scintillation counter.
Immunohistochemical Staining
We reviewed hematoxylin and eosin slides of NSCLCs for confirmation of
histopathological
diagnosis and selection of adequate specimens for tissue microarray (TMA)
construction. We
assembled TMAs using a Beecher tissue puncher/array system (Beecher
Instruments). For each case,
we acquired 3 core samples of tumor tissue from donor blocks. We cut serial 4-
m-thick tissue
sections from TMAs for immunohistochemistry study. We stained initial sections
for hematoxylin and
eosin to verify histopathology. We deparafiinized the slides in xylene and
rehydrated through a
graded series of ethanol concentrations. We performed antigen retrieval
(microwave boiling for 18
min in 0.01 M EDTA buffer). We blocked intrinsic peroxidase by 3% hydrogen
peroxide for 10 min.
We used 10% goat serum (Sigma) solution for blocking nonspecific antibody
binding, and used the
primary antibodies at the manufacturer recommended concentration. We left
slides at 4 C overnight.
After removing the primary antibody by washing in TBST for 5 min three times,
we incubated slides
for 30 min with secondary antibody at room temperature. Following three
additional washes in TBST,
we visualized slides using streptavidin-biotinperoxidase. We scanned sections
at low magnification.
We estimated immnunostaining score from 0-3 based on the percentage and
intensity of stained tumor
cells. We also recorded the distribution of staining, membrane or cytoplasmic,
and assessed it at high
magnification. We scored immunoreactivity semi-quantitatively by considering
the percentage and
intensity of the staining of the tumor cells. We also assessed the
distribution of staining, membrane or
cytoplasmic, at high magnification. We scored immunohistochemical staining
visually a four-tiered
scale (0 to 3). We considered samples with 5% of weakly stained cells to
negative (score 0). We
scored samples with > 5 20% positive cells with weak staining intensity weakly
positive (score 1). We
scored samples with >20 50% of positive cells with moderate to strong staining
moderate positive
(score 2) and samples showing >50% of positive cells with strong intensity as
strong positive (score
3). We considered NSCLC samples with IHC score I as positive samples.
Fluorescence in situ Hybridization
We identified amplifications in the PDGFRa locus by FISH using a probe set
that consists of
two BAC clones spanning the PDGFRa locus (RPI 1-23ICI8, RP11-8OLl 1) and a
centromere probe
(CEP4, Vysis (Vysis, Dowers Grove, IL, USA)). The centromere probe allows
amplifications due to
CA 02702938 2010-04-16
WO 2009/054939 PCT/US2008/011969
- 34 -
polysomy to be distinguished from amplifications of the PDGFRa locus itself.
We labeled the
PDGFRa probes with Spectrum Orange dUTP (Vysis), and CEP4 with Spectrum Green
dUTP. For
analyzing rearrangements involving ROS, we designed a dual color break-apart
probe. We labeled a
proximal probe (BAC clone RPI-179P9) and two distal probes (BAC clone RPI 1-
323017, RPI-
94G16) with Spectrum Orange dUTP or Spectrum Green dUTP, respectively. For ALK
we obtained a
dual color, break-apart rearrangement probe from Vysis (Vysis, Dowers Grove,
IL, USA). The break-
apart rearrangement probes contain two differently labeled probes on opposite
sides of the breakpoint
of the ALK gene. For both the ROS and ALK probe sets, the native region will
appear as an
orange/green fusion signal when hybridized, while rearrangement at the locus
will result in separate
orange and green signals. We did labeling of the probes by nick translation
and interphase FISH using
formalin fixed paraffin embedded (FFPE) tissue sections according to the
manufactures instructions
(Vysis) with the following modifications. In brief, we re-hydrated paraffin
embedded tissue sections
and subjected them to microwave antigen retrieval in 0.01 M Citrate buffer (pH
6.0) for 1 I minutes.
We digested sections with Protease (4mg/ml Pepsin, 2000-30000/mg) for 25
minutes at 37 C,
dehydrated them and hybridized them with the FISH probe set at 37 C for 18
hours. After washing,
we applied 4',6-diamidino-2-phenylindole (DAPI; 0.5ug/ml) in Vectashield
mounting medium
(Vector Laboratories, Burlingame, CA) for nuclear counterstaining. We used
arrays of 1 mm tissue
cores from NSCLC patient samples for screening. We further analyzed positive
samples using whole
sections and counted at least 50 cells to analyze the frequency of cytogenetic
changes. 18 patient
samples were available from the set of PDGFRa IHC positive samples for
screening with the FISH
probe set. We scored 14 samples successfully and found one to contain a large
amplification. The
majority of the cancer cells contained the amplification. We analyzed H1703
xenografts but didn't
find amplification.
Accession Numbers
We deposited the nucleotide sequences of CD74-ROS: EU236945, SLC34A2-ROS
(long):
EU236946, SLC34A2-ROS (short): EU236947, EML4-ALK: EU236948 and protein
sequences
CD74/ROS: ABX59671, SLC34A2/ROS fusion protein long isoform: ABX59672,
SLC34A2/ROS
fusion protein short isoform: ABX59673, EML4/ALK: ABX59674 in GenBank.