Note: Descriptions are shown in the official language in which they were submitted.
CA 02708038 2010-06-02
WO 2009/108239 PCT/US2008/085768
1
SLOPE-BASED COMPENSATION
REFERENCE To RELATED APPLICATIONS
[001] This application claims the benefit of U.S. Provisional Application No.
61/012,716 entitled "Slope-Based Compensation" filed December 10, 2007, which
is incorporated by reference in its entirety.
BACKGROUND
[002] Biosensor systems provide an analysis of a biological fluid, such as
whole
blood, serum, plasma, urine, saliva, interstitial, or intracellular fluid.
Typically, the
systems include a measurement device that analyzes a sample residing in a
sensor
strip. The sample usually is in liquid form and in addition to being a
biological
fluid, may be the derivative of a biological fluid, such as an extract, a
dilution, a
filtrate, or a reconstituted precipitate. The analysis performed by the
biosensor
system determines the presence and/or concentration of one or more analytes,
such
as alcohol, glucose, uric acid, lactate, cholesterol, bilirubin, free fatty
acids,
triglycerides, proteins, ketones, phenylalanine or enzymes, in the biological
fluid.
The analysis may be useful in the diagnosis and treatment of physiological
abnormalities. For example, a diabetic individual may use a biosensor system
to
determine the glucose level in whole blood for adjustments to diet and/or
medication.
[003] Biosensor systems may be designed to analyze one or more analytes and
may use different volumes of biological fluids. Some systems may analyze a
single
drop of whole blood, such as from 0.25-15 microliters (,uL) in volume.
Biosensor
systems may be implemented using bench-top, portable, and like measurement
devices. Portable measurement devices may be hand-held and allow for the
identification and/or quantification of one or more analytes in a sample.
Examples
of portable measurement systems include the Ascensia Breeze and Elite
meters
CA 02708038 2010-06-02
WO 2009/108239 PCT/US2008/085768
2
of Bayer HealthCare in Tarrytown, New York, while examples of bench-top
measurement systems include the Electrochemical Workstation available from CH
Instruments in Austin, Texas.
[004] Biosensor systems may use optical and/or electrochemical methods to
analyze the biological fluid. In some optical systems, the analyte
concentration is
determined by measuring light that has interacted with or been absorbed by a
light-
identifiable species, such as the analyte or a reaction or product formed from
a
chemical indicator reacting with the analyte. In other optical systems, a
chemical
indicator fluoresces or emits light in response to the analyte when
illuminated by an
excitation beam. The light may be converted into an electrical output signal,
such
as current or potential, which may be similarly processed to the output signal
from
an electrochemical method. In either optical system, the system measures and
correlates the light with the analyte concentration of the sample.
[005] In light-absorption optical systems, the chemical indicator produces a
reaction product that absorbs light. A chemical indicator such as tetrazolium
along
with an enzyme such as diaphorase may be used. Tetrazolium usually forms
formazan (a chromagen) in response to the redox reaction of the analyte. An
incident input beam from a light source is directed toward the sample. The
light
source may be a laser, a light emitting diode, or the like. The incident beam
may
have a wavelength selected for absorption by the reaction product. As the
incident
beam passes through the sample, the reaction product absorbs a portion of the
incident beam, thus attenuating or reducing the intensity of the incident
beam. The
incident beam may be reflected back from or transmitted through the sample to
a
detector. The detector collects and measures the attenuated incident beam
(output
signal). The amount of light attenuated by the reaction product is an
indication of
the analyte concentration in the sample.
[006] In light-generated optical systems, the chemical detector fluoresces or
emits
light in response to the analyte redox reaction. A detector collects and
measures the
CA 02708038 2010-06-02
WO 2009/108239 PCT/US2008/085768
3
generated light (output signal). The amount of light produced by the chemical
indicator is an indication of the analyte concentration in the sample.
[007] In electrochemical biosensor systems, the analyte concentration is
determined from an electrical signal generated by an oxidation/reduction or
redox
reaction of the analyte or a species responsive to the analyte when an input
signal is
applied to the sample. The input signal may be a potential or current and may
be
constant, variable, or a combination thereof such as when an AC signal is
applied
with a DC signal offset. The input signal may be applied as a single pulse or
in
multiple pulses, sequences, or cycles. An enzyme or similar species may be
added
to the sample to enhance the electron transfer from a first species to a
second
species during the redox reaction. The enzyme or similar species may react
with a
single analyte, thus providing specificity to a portion of the generated
output signal.
A mediator may be used to maintain the oxidation state of the enzyme.
[008] Electrochemical biosensor systems usually include a measurement device
having electrical contacts that connect with electrical conductors in the
sensor strip.
The conductors may be made from conductive materials, such as solid metals,
metal
pastes, conductive carbon, conductive carbon pastes, conductive polymers, and
the
like. The electrical conductors typically connect to working, counter,
reference,
and/or other electrodes that extend into a sample reservoir. One or more
electrical
conductors also may extend into the sample reservoir to provide functionality
not
provided by the electrodes.
[009] The measurement device applies an input signal through the electrical
contacts to the electrical conductors of the sensor strip. The electrical
conductors
convey the input signal through the electrodes into the sample present in the
sample
reservoir. The redox reaction of the analyte generates an electrical output
signal in
response to the input signal. The electrical output signal from the strip may
be a
current (as generated by amperometry or voltammetry), a potential (as
generated by
potentiometry/gaIvan ometry), or an accumulated charge (as generated by
CA 02708038 2010-06-02
WO 2009/108239 PCT/US2008/085768
4
coulometry). The measurement device may have the processing capability to
measure and correlate the output signal with the presence and/or concentration
of
one or more analytes in the biological fluid.
[0010] In coulometry, a potential is applied to the sample to exhaustively
oxidize or
reduce the analyte. A biosensor system using coulometry is described in U.S.
Patent
No. 6,120,676. In amperometry, an electrical signal of constant potential
(voltage)
is applied to the electrical conductors of the sensor strip while the measured
output
signal is a current. Biosensor systems using amperometry are described in U.S.
Patent Nos. 5,620,579; 5,653,863; 6,153,069; and 6,413,411. In voltammetry, a
varying potential is applied to a sample of biological fluid. In gated
amperometry
and gated voltammetry, pulsed inputs are used as described in WO 2007/013915
and WO 2007/040913, respectively.
[0011] In many biosensor systems, the sensor strip may be adapted for use
outside,
inside, or partially inside a living organism. When used outside a living
organism,
a sample of the biological fluid may be introduced into a sample reservoir in
the
sensor strip. The sensor strip may be placed in the measurement device before,
after, or during the introduction of the sample for analysis. When inside or
partially
inside a living organism, the sensor strip may be continually immersed in the
sample
or the sample may be intermittently introduced to the strip. The sensor strip
may
include a reservoir that partially isolates a volume of the sample or be open
to the
sample. When open, the strip may take the form of a fiber or other structure
placed
in contact with the biological fluid. Similarly, the sample may continuously
flow
through the strip, such as for continuous monitoring, or be interrupted, such
as for
intermittent monitoring, for analysis.
[0012] The measurement performance of a biosensor system is defined in terms
of
accuracy and/or precision. Increases in accuracy and/or precision provide for
an
improvement in measurement performance, a reduction in the bias, of the
system.
Accuracy may be expressed in terms of bias of the sensor system's analyte
reading in
CA 02708038 2010-06-02
WO 2009/108239 PCT/US2008/085768
comparison to a reference analyte reading, with larger bias values
representing less
accuracy. Precision may be expressed in terms of the spread or variance of the
bias
among multiple analyte readings in relation to a mean. Bias is the difference
between one or more values determined from the biosensor system and one or
more
accepted reference values for the analyte concentration in the biological
fluid.
Thus, one or more errors in the measured analysis results in the bias of the
determined analyte concentration of a biosensor system. Bias may be expressed
in
terms of "absolute bias" or "percent bias". Absolute bias may be expressed in
the
units of the measurement, such as mg/dL, while percent bias may be expressed
as a
percentage of the absolute bias value over the reference value. Accepted
reference
values may be obtained with a reference instrument, such as the YSI 2300 STAT
PLUSTM available from YSI Inc., Yellow Springs, Ohio.
[0013] Biosensor systems may provide an output signal during the analysis of
the
biological fluid that includes one or multiple errors. These errors may be
reflected
in an abnormal output signal, such as when one or more portions or the entire
output signal is non-responsive or improperly responsive to the analyte
concentration of the sample. These errors may be from one or more
contributors,
such as the physical characteristics of the sample, the environmental aspects
of the
sample, the operating conditions of the system, interfering substances, and
the like.
Physical characteristics of the sample include hematocrit (red blood cell)
concentration and the like. Environmental aspects of the sample include
temperature and the like. Operating conditions of the system include underfill
conditions when the sample size is not large enough, slow-filling of the
sample,
intermittent electrical contact between the sample and one or more electrodes
in the
sensor strip, degradation of the reagents that interact with the analyte, and
the like.
Interfering substances include ascorbic acid, uric acid, acetaminophen, and
the like.
There may be other contributors or a combination of contributors that cause
errors.
CA 02708038 2010-06-02
WO 2009/108239 PCT/US2008/085768
6
[0014] Many biosensor systems include one or more methods to correct errors
associated with an analysis. The concentration values obtained from an
analysis
with an error may be inaccurate. Thus, the ability to correct these inaccurate
analyses may increase the accuracy of the concentration values obtained. An
error
correction system may compensate for one or more errors, such as a sample
temperature or sample hematocrit content, which is different from a reference
temperature or reference hematocrit value. For example, conventional biosensor
systems may be configured to report glucose concentrations presuming a 40%
(v/v)
hematocrit content for a whole blood sample, regardless of the actual
hematocrit
content of the sample. In these systems, any glucose measurement performed on
a
blood sample containing less or more than 40% hematocrit will include error
and
thus have bias attributable to the hematocrit effect.
[0015] Some biosensor systems have an error correction system that compensates
for different hematocrit concentrations in the sample. Various methods and
techniques have been proposed to reduce the bias of the hematocrit effect on
glucose measurements. Some methods use the ratio of currents from a forward
and
a reverse potential pulse to compensate for the hematocrit effect. Other
methods
have been proposed to reduce the bias of the hematocrit effect, including
using
silica particles to filter red blood cells from the electrode surface or using
wide
electrode spacing in combination with mesh layers to distribute blood
throughout
the sensor strip.
[0016] Some biosensor systems have an error correction system that compensates
for temperature. Such error compensation systems typically alter a determined
analyte concentration for a particular reference temperature in response to an
instrument or sample temperature. A number of biosensor systems compensate for
temperature by correcting the output signal prior to calculating the analyte
concentration from a correlation equation. Other biosensor systems compensate
for
temperature by correcting the analyte concentration calculated by the
correlation
CA 02708038 2010-06-02
WO 2009/108239 PCT/US2008/085768
7
equation. Generally, conventional methods of temperature compensation look at
the effect of temperature on a specific parameter, not the overall effect the
error has
on the bias of the analysis. Biosensor systems having error detection and/or
compensation systems for the sample temperature are described in U.S. Patent
Nos.
4,431,004; 4,750,496; 5,366,609; 5,395,504; 5,508,171; 6,391,645; and
6,576,117.
[0017] Some biosensor systems have an error correction system that compensates
for interferents and other contributors. Such error correction systems
typically use
an electrode lacking one or more of the working electrode reagents to allow
for the
subtraction of a background interferent signal from the working electrode
signal.
[0018] While conventional error compensation systems balance various
advantages
and disadvantages, none are ideal. Conventional systems usually are directed
to
detect and respond to a particular type of error, either temperature or
hematocrit, for
example. Such systems typically do not have the ability to compensate for
multiple
error sources. These systems generally also lack the ability to alter the
compensation for the error based on the output signal from a specific sample.
Consequently, conventional biosensor systems may provide analysis results
having
determined analyte concentration values outside a desired performance limit.
[0019] Accordingly, there is an ongoing need for improved biosensor systems,
especially those that may provide increasingly accurate and/or precise
determination
of the concentration of the analyte in the sample. The systems, devices, and
methods of the present invention overcome at least one of the disadvantages
associated with conventional biosensor systems.
CA 02708038 2010-06-02
WO 2009/108239 PCT/US2008/085768
8
SUMMARY
[0020] The present invention provides a biosensor system that adjusts a
relation for
determining analyte concentrations in a biological sample from output signals
with
one or more index functions responsive to one or more errors that could bias
the
determined analyte concentrations. The bias may be represented by slope
deviations, AS values, and normalized slope deviations obtained from one or
more
error parameters. The AS values represent slope deviations determined with one
or
more index functions from the error parameters. The index functions are
extracted
from the output signals.
[0021] In a method for determining an analyte concentration in a sample, an
output
signal value responsive to the concentration of the analyte in the sample is
generated. At least one AS value from at least one error parameter is
determined,
and the at least one output signal value is compensated with at least one
reference
correlation and at least one AS value to determine the analyte concentration
in the
sample. The at least one AS value may be determined from an index function
f(Index). The f(Index) relates at least one error parameter to AS. The
reaction may
be an electrochemical redox reaction.
[0022] In a method for determining index functions from error parameters, at
least
one error parameter responsive to the percent bias in a determined analyte
concentration in a sample is determined. The at least one error parameter is
related
to at least one AS value with at least one index function, the at least one AS
value
representing the difference in slope between the slope from a reference
correlation
and a hypothetical slope of a line for the output signal value that would
provide an
analyte concentration in the sample without bias.
[0023] A biosensor system for determining an analyte concentration in a sample
includes a measurement device and sensor strip. The measurement device has a
processor connected to a sensor interface and to a storage medium. The sensor
strip
CA 02708038 2010-06-02
WO 2009/108239 PCT/US2008/085768
9
has a sample interface adjacent to a reservoir formed by the strip. The
processor
determines an output signal value responsive to the concentration of the
analyte in
the sample from the sensor interface. The processor determines at least one AS
value from an error parameter and compensates the output signal value with the
at
least one AS value and at least one reference correlation present in the
storage
medium.
[0024] A biosensor system adjusts a correlation between analyte concentrations
and
output signals with at least one AS value in response to error parameters. The
processor determines an analyte concentration from the slope-adjusted
correlation in
response to an output signal from the sample interface.
[0025] In another method for determining an analyte concentration in a sample,
one
or more output signals are generated from a sample. One or more index
functions
are determined. Where the index functions are responsive to at least one error
parameter. The analyte concentration in the sample is determined from the
output
signals in response to the index functions.
[0026] A further method for determining an analyte concentration in a sample,
one
or more potential sequences are applied to the sample. One or more output
signals
are recorded from the sample. One or more index functions are determined. The
analyte concentration in the sample is determined from the output signals in
response to the one index functions.
[0027] Other systems, methods, features, and advantages of the invention will
be, or
will become, apparent to one with skill in the art upon examination of the
following
figures and detailed description. It is intended that all such additional
systems,
methods, features and advantages be included within this description, be
within the
scope of the invention, and be protected by the claims that follow
CA 02708038 2010-06-02
WO 2009/108239 PCT/US2008/085768
BRIEF DESCRIPTION OF THE DRAWINGS
[0028] The invention may be better understood with reference to the following
drawings and description. The components in the figures are not necessarily to
scale, emphasis instead being placed upon illustrating the principles of the
invention.
[0029] FIG. 1 depicts the correlation between %-bias and an index function
based
on a ratio parameter.
[0030] FIG. 2 depicts the correlation between %-bias and a combination of
index
functions.
[0031] FIG. 3 represents a method for determining an analyte concentration in
a
sample.
[0032] FIG. 4 is a graph illustrating the output signals in relation to the
input signals
for an electrochemical system using gated amperometry.
[0033] FIG. 5 depicts the relationship between Scat, Shyp, AS, Acorr, Acai,
and A.
[0034] FIG. 6 depicts a linear index function f(Index) relating AS to error
parameters.
[0035] FIG. 7A plots output signal values recorded at multiple temperatures
against
AS values.
[0036] FIG. 7B depicts an improvement in percent bias values from slope-based
compensation.
[0037] FIG. 7C depicts linear and 2nd order polynomial equations as
f(Index)Temp
relating temperature to S.
[0038] FIG. 7D represents the temperature sensitivity of AS vs. temperature
for
another sensor type.
CA 02708038 2010-06-02
WO 2009/108239 PCT/US2008/085768
11
[0039] FIG. 8A depicts a gated pulse sequence where the input signal includes
multiple excitations and relaxations.
[0040] FIG. 8B depicts the output signal currents from the input signals.
[0041] FIG. 8C depicts another gated pulse sequence where the input signal
includes multiple excitations and relaxations using gated amperometry.
[0042] FIG. 8D depicts the correlation between the AStotai and AS-40% against
a
common index R6/5 with respect to the current labels in FIG. 8C.
[0043] FIG. 8E plots the bias/%-bias before and after compensation.
[0044] FIGS. 9A-9D depict the correlations between AS and the error parameters
of
R2/R3, R4/3, Index-I, and Index-II, respectively, for a biosensor system.
[0045] FIGS. 10A-10C depict the correlations between AS and the error
parameters
of R4/3, R5/4, and R6/5, respectively, for a biosensor system using different
reagents
to react with the analyte in the sample.
[0046] FIG. 11 A depicts the correlation between AS and the error parameter
R4/3.
[0047] FIG. 11 B depicts the distribution spread and percent of compensated
and
uncompensated concentration values falling within a 10% bias limit.
[0048] FIG. 11 C depicts the improvement in the mean and standard deviation
values for uncompensated and R4/3 error parameter compensated glucose
concentration values.
[0049] FIG. 12A depicts the correlation between Si Oand the error parameter
Index-I.
[0050] FIG. 12B depicts the correlation between AS2 and the error parameter
R4.
CA 02708038 2010-06-02
WO 2009/108239 PCT/US2008/085768
12
[0051] FIG. 1 3A depicts the correlation of AS with an index function
responsive to
the ratio R5/4.
[0052] FIG. 1 3B depicts the correlation of OS/Scai with an index function
responsive
to the ratio R5/4.
[0053] FIG. 14 depicts the correlation of SNML with an index function
responsive to
the ratio R5/4.
[0054] FIG. 15 depicts a schematic representation of a biosensor system that
determines an analyte concentration in a sample of a biological fluid.
[0055] FIG. 16 represents another method for determining an analyte
concentration
in a sample of a biological fluid.
DETAILED DESCRIPTION
[0056] A biosensor system adjusts a correlation for determining analyte
concentrations in a biological sample from output signals with index functions
extracted from intermediate signals of the output signals. The analyte may
generate
the output signals in response to a light-identifiable species or a redox
reaction. The
intermediate signals may be one or more portions of the output signals or the
like.
Index functions compensate the correlation for determining analyte
concentrations
from the output signals for one or more errors in the analyses that could
result in
bias of the determined analyte concentrations.
[0057] Index functions correspond to the %-bias in the correlation between the
analyte concentrations and the output signals due to one or more errors in the
analysis. The %-bias in the correlation may be represented by one or more OS
values obtained from one or more error parameters. The AS values represent
slope
deviations of the correlation between analyte concentrations and output
signals
determined from one or more error parameters. Index functions corresponding to
CA 02708038 2010-06-02
WO 2009/108239 PCT/US2008/085768
13
the slope or change in slope may be normalized to reduce the statistical
effect of
changes in the output signals, improve the differentiation in variations of
the output
signals, standardize the measurements of the output signals, a combination
thereof,
or the like. Other index functions may be used. The adjusted correlation may
be
used to determine analyte concentrations in biological samples from the output
signals and may have improved accuracy and/or precision in comparison to
conventional biosensors. While the compensation system provides substantial
benefits when analyzing complex biological samples, the compensation system
may
be used to improve the accuracy and/or precision of other types of analysis.
[0058] FIGS. 1 and 2 depict correlations between the %-bias and indices or
index
functions extracted from output signals of an analyte concentration analysis.
In this
example, the analyte generates output signals in response to the pulse
sequence of a
gated amperometry electrochemical analysis. Other electrochemical and optical
analyses may be used.
[0059] FIG. 1 depicts the correlation between %-bias and an index function
based
on a ratio parameter (R5/4). The ratio parameter, R5/4, represents the
relationship
between the currents generated by the analyte in response to the 4th and 5th
pulses of
a gated amperometry pulse sequence of FIG. 8C. Other ratio parameters and
index
functions may be used. Thus, the %-bias of a measured analyte concentration in
a
biological fluid, such as glucose in whole blood, may be determined from or
correlated with the output signals of the analysis, such as the intermediate
currents
generated by the analyte in response to a gated amperometry sequence.
[0060] FIG. 2 depicts the correlation between %-bias and a combination of
index
functions. The correlation between %-bias and the index function in FIG. 1 may
be
improved by the linear combination of multiple parameters as shown in FIG. 2.
The
regression analysis in FIG. 2 has an R2 of 0.8377, which is higher than the R2
of
0.6987 in FIG. 1, thus indicating an improved correlation using multiple
parameters
(FIG. 2) in comparison to a single parameter (FIG. 1). In FIG. 2, there are
two
CA 02708038 2010-06-02
WO 2009/108239 PCT/US2008/085768
14
boundaries of 7 percent and 10 percent on the %-bias axis, which are
projected
onto the Index axis. If index values calculated from the intermediate currents
are
within these boundaries, compensation of the correlations between the measured
analyte concentration and the output signals may not be necessary. The
boundaries
may be determined experimentally, selected based on the one or more parameters
used, or chosen using other criteria. Thus, index functions may be used to
compensate for part or all of the correlation between the measured analyte
concentration and the output signals.
[0061] The relationship between %-bias and an index function may be
represented
as follows:
%-bias = f(index) (Equation 1),
where %-bias equals (AA/Aref) * 100% and f(index) equals a,*Index +ao. AA is
the
difference between the measured or calculated analyte concentration, Acai, and
a
reference analyte concentration, Aref (a known analyte concentration in a
biological
sample). Thus, substituting terms for Equation 1 results in the following
relationship
between %-bias and an index function:
(AA/Aref) *100% = a, *Index +ao (Equation 2).
[0062] Rearranging the terms of Equation 2 results in the following
relationship:
[0063] AA = Aref*(al*Index + ao)/100 (Equation 3).
[0064] A compensation may be expressed as follows:
[0065] Acorr = Ao + AA (Equation 4).
[0066] Where Acorr is a corrected or compensation analyte compensation and Ao
is
an initial analyte value from the analysis. While AA may be obtained from
Equation
CA 02708038 2010-06-02
WO 2009/108239 PCT/US2008/085768
3, Aref in Equation 3 may not be available during the analysis of a biological
sample.
However, the initial analyte value, Ao, may be used from the analysis in place
of Aref.
Thus, Equation 3 may approximated by the following relationship:
[0067] AA = Ao*(a,*Index + ao)/100 (Equation 5).
[0068] Finally, substituting Equation 5 into Equation 4 results in the
following
relationship:
[0069] Acorr= Ao+Ao*(a,*Index+ao)/100 = Ao*[1 + (a,*Index+ao)/100] (Equation
6).
[0070] From Equation 6, the difference between the measured analyte
concentration and a reference analyte concentration, AA, is based on an
initial
analyte value, Ao, which may be biased due to one or more errors in the
analysis.
Thus, there is no reference point or value upon which to base the compensation
of
the measured analyte concentration.
[0071] The %-bias in the correlation of analyte concentrations with output
signals
also may be represented by one or more slope deviations, AS, obtained from one
or
more error parameters. Error containing portions of output signals are
reflected in
the deviation between the hypothetical slope of the output signals and the
slope of a
reference correlation. By determining one or more AS values reflecting this
deviation in slope from one or more error parameters, the accuracy and/or
precision
of an analysis may be increased. One or more AS values for an analysis may be
determined from one or more error parameters. The relationship between AS
values
and the value of one or more error parameters may be described by an index
function. Index functions in addition to reference correlation equations may
be pre-
determined and stored in the biosensor system. Error parameter values may be
determined before, during, or after the analysis. Slope-based correction
methods
may provide a biosensor system the ability to maintain over 95% of the
analyses
within a 20% bias limit, more preferably within a 10% bias limit.
CA 02708038 2010-06-02
WO 2009/108239 PCT/US2008/085768
16
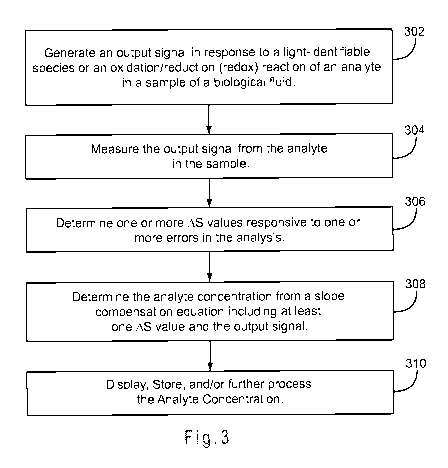
[0072] FIG. 3 represents a method for determining an analyte concentration in
a
sample of a biological fluid. In 302, the biosensor system generates an output
signal
in response to either a light-identifiable species or an oxidation/reduction
(redox)
reaction of an analyte in a sample of a biological fluid. In 304, the
biosensor system
measures the output signal. In 306, one or more AS values responsive to one or
more errors in the analysis are determined. In 308, the analyte concentration
is
determined from a slope compensation equation including at least one AS value
and
the output signal. In 310, the analyte concentration may be displayed, stored
for
future reference, and/or used for additional calculations.
[0073] In 302 of FIG. 3, the biosensor system generates an output signal in
response
to a light-identifiable species or an oxidation/reduction (redox) reaction of
an analyte
in a sample of a biological fluid. The output signal may be generated using an
optical sensor system, an electrochemical sensor system, or the like.
[0074] FIG. 4 is a graph illustrating the output signals in relation to the
input signals
for an electrochemical system using gated amperometry. The biosensor system
applies a first pulse having a potential of about 400 mV for about 1 sec to
the
working and counter electrodes. The first pulse is followed by a 0.5 sec
relaxation,
which may be an essentially open circuit or the like. The output signal or
current
within the first pulse is measured and may be stored in a memory device. The
system may apply a second pulse to the working and counter electrodes at about
200 mV for about 1 sec. The output signal or current within the second pulse
is
measured and also may be stored in a memory device. The biosensor system
continues to apply pulses from the input signal to the working and counter
electrodes for the desired time period. The system may measure and store the
output signal or current within each pulse. Other input and output signals and
other
electrochemical systems may be used.
[0075] Input signals may be electrical signals, such as current or potential,
that pulse
or turn on and off in a set sequence. Thus, the input signal is a sequence of
CA 02708038 2010-06-02
WO 2009/108239 PCT/US2008/085768
17
excitation pulses separated by relaxations. During a pulse, the electrical
signal is
present. In gated amperometry, the potential is held relatively constant
during a
pulse, while in gated voltammetry, the potential varies during a pulse. During
a
relaxation, the input signal is off. Off includes time periods when an
electrical
signal is not present and preferably does not include time periods when an
electrical
signal is present but has essentially no amplitude. The electrical signal may
switch
between on and off by closing and opening an electrical circuit, respectively.
The
electrical circuit may be opened and closed mechanically, electrically, or the
like.
[0076] Input signals may have one or more pulse intervals. A pulse interval is
the
sum of a pulse and a relaxation. Each pulse has an amplitude and a width. The
amplitude indicates the intensity of the potential, the current, or the like
of the
electrical signal. The amplitude may vary or be substantially constant, such
as
during amperometry, during the pulse. The pulse width is the time duration of
the
pulse. The pulse widths in an input signal may vary or be essentially the
same.
Each relaxation has a relaxation width, which is the time duration of the
relaxation.
The relaxation widths in an input signal may vary or be substantially the
same.
[0077] Output signals are currents or potentials generated from the sample
that are
responsive to the input signal. In amperometric electrochemical systems, the
sample may generate the output signal from the redox reaction of the analyte
in
response to the input signal. Output signals may include those that decline
initially,
those that increase and then decline, those that reach a steady-state, and
those that
are transient. For example, the output signal of the first pulse in FIG. 4
increases
from the first to the last current value, while the current values from the
second
through the fifth pulses decrease or decay from the first to last current
value. Other
types of output signals may be generated.
[0078] In 304 of FIG. 3, the biosensor system measures the output signal
generated
by the analyte in response to the input signal applied to the sample, such as
from a
redox reaction of the analyte. The system may measure the output signal
CA 02708038 2010-06-02
WO 2009/108239 PCT/US2008/085768
18
continuously or intermittently. For example, the biosensor system measured the
output signal intermittently during each pulse in FIG. 4, resulting in eight
current
values during each pulse. The system may show the output signal on a display
and/or may store the output signal or portions of the output signal in a
memory
device.
[0079] In 306 of FIG. 3, one or more AS values are determined that are
responsive
to one or more errors. AS values may be determined for temperature,
hematocrit,
and other contributors.
[0080] In 308 of FIG. 3, the analyte concentration of the sample is determined
from
a slope compensation equation including at least one AS value and the output
signal. The slope compensation equation uses output signal values to provide
an
analyte concentration. The slope compensation equation compensates for error
by
adjusting a reference correlation between output signals and the analyte
concentrations to provide a compensated or corrected analyte concentration.
The
slope compensation equation may be represented as follows:
[0081] A = i - Int (Equation 7)
COPY
S"1 + AS
[0082] where Acorr is the corrected analyte concentration, i is a value of the
output
signal from a biosensor system, Int is the intercept from a reference
correlation
equation, Scai is the slope from the reference correlation equation, and AS
represents
the deviation in slope between Scai and a hypothetical slope of a line (Shyp)
for the
output signal value that provides an analyte concentration of the sample
without
error. The Int and Scai values for the reference correlation equation may be
implemented as a program number assignment (PNA) table, another look-up table,
or the like in the biosensor system. Other slope compensation equations
including
at least one AS value and the output signal may be used.
CA 02708038 2010-06-02
WO 2009/108239 PCT/US2008/085768
19
[0083] In Equation 7, an index function, f(index), may be substituted for OS.
While
the index function, f(index), has a general form of b,*Index+bo, other index
functions may be used. Thus, Equation 7 may be rewritten as follows:
i-Int i - Int i-Int
[0084] Awry = _ _ (Equation 8).
Scar + AS Scar + f (Index) Scar + b, * Index + bo
[0085] A comparison of Equation 8 with Equations 5 and 6 shows the improvement
from using the slope deviation to represent the %-bias. The compensation of
the
analyte concentration in Equations 5 and 6 is based on a predetermined analyte
concentration Ao. In contrast, the compensation of the analyte concentration
in
Equation 8 is responsive to adjusting the correlation slope through the terms
in the
denominator. Additionally, there is no reference value or reference point
incorporated with the compensation of the analyte concentration from Equations
5
and 6. Aref is approximated by Ao. In Equation 8, the slope S.i is
incorporated with
the compensation of the analyte concentration and may be stored in a device
implementing the compensation system. There is no approximation of Scat during
the calculation of the analyte concentration. Thus, the compensation of
analyte
concentration from Equation 8 may be more accurate than the compensation of
analyte concentration from Equations 5 and 6.
[0086] Equation 7 is a representation of the corrected analyte concentration
determined using the slope deviation AS, where AS is essentially the total
slope
deviation related to essentially the total error associated with the analyte
analysis.
The total slope deviation may be caused by one or more error sources. Equation
7
may be used with any signal having a substantially linear response to analyte
concentration. Thus, the output signal preferably has a linear relationship
with the
analyte concentration in the sample and may originate from a redox reaction,
light-
identifiable species, or other process. The reference correlation equation
describes
a function relating the output signals from a biosensor system to analyte
concentration values determined from a reference instrument. For example, the
CA 02708038 2010-06-02
WO 2009/108239 PCT/US2008/085768
output signal from a biosensor system for a specific sample may be related to
the
analyte concentration values determined from a YSI reference instrument for
the
same sample. Equation 7 may be used with other signals, such as signals that
are
near or partially linear.
[0087] AS is responsive to one or more errors in the output signal i and
represents
the error containing portions of the output signal not responsive to the
analyte
concentration of the sample. Thus, Shyp = Scat + AS. One or more values for
Int and
Scat may be stored in the biosensor system for comparison with the output
signal i to
determine Acorr for the sample. One or more AS values are determined during
the
analysis from one or more index or like functions.
[0088] FIG. 5 shows the relationship between Scat, Shyp, AS, Acorr, Acat, and
AA. Line
A represents a reference correlation having a slope Scat and relating an
output signal
in the form of current values from a biosensor system to analyte concentration
values obtained from a YSI or other reference instrument for the samples. When
used during the analysis of a sample by a biosensor system, the reference
correlation
of Line A may include one or more errors that may provide an inaccurate and/or
imprecise analyte concentration value. Line B represents an error-compensated
correlation having a slope Shyp and relating current values obtained from the
system
with the sample analyte concentration values as obtained from the reference
instrument. The error-compensated correlation has been adjusted or modified to
reduce or substantially eliminate the one or more errors. AS is the difference
in
slope between these correlation lines. AA is the difference between the
uncompensated or uncorrected (Acct) and error compensated or corrected (Acorr)
determined analyte concentration values.
[0089] Without compensation or correction, a specific output signal value will
provide a different sample analyte concentration from the Scat reference
correlation
line than from the Shyp error-compensated line. The Acorr value obtained from
the Shyp
error-compensated line provides a more accurate value of the analyte
concentration
CA 02708038 2010-06-02
WO 2009/108239 PCT/US2008/085768
21
in the sample. Thus, Equation 1 translates a current value, Scat, and Int into
the
compensated analyte concentration value Acorr using AS. In this way, the
percent
bias may be linked through AS into Equation 7. The percent bias values may be
pulled toward the center of a bias distribution through the linkage of AS to
the
percent bias. As AS is responsive to bias, changing AS affects the amount of
bias
remaining in the compensated analyte concentration of the sample.
[0090] In 310 of FIG. 3, the analyte concentration value may be displayed,
stored
for future reference, and/or used for additional calculations.
[0091] The responsiveness of AS to one or more errors may be represented by an
index function. To determine one or more index functions, the deviation in the
slope of the correlation equation in response to the one or more errors
(AScat) may
be determined from experimental data, such as during factory calibration, as
follows:
[0092] AS al - i - Int -S"1 (Equation 9)
Aref
[0093] where i is a value of the output signal from a biosensor system, Int is
the
intercept from a reference correlation equation, Aref is the reference analyte
concentration of the sample, such as obtained from a reference instrument, and
Scat
is the slope from a reference correlation equation, such as i = Scat*Aref +
Int. One
or more AScat values may be determined from different system output signals at
each
reference analyte concentration. In this manner, for multiple known analyte
concentrations, an output signal value may be obtained from the biosensor
system
and a corresponding AScat value determined. An initial index function may be
determined by taking the AScat values from Equation 9 and correlating them to
an
error parameter.
[0094] Index functions compensate the measured analyte concentration for one
or
more errors in the analyte concentration analysis. One or more index functions
may
CA 02708038 2010-06-02
WO 2009/108239 PCT/US2008/085768
22
be used. An index function that correlates with the total slope deviation AS
would
provide an ultimate total error compensation of the analyte concentration
since this
index function could be used to compensate for the total error in the analysis
without having to know the exact cause of the slope deviation AS and thus the
bias
of the measured analyte concentration. An index function may be responsive to
an
error parameter, such as temperature, which is measurable by another means. An
index function may be a calculated number that correlates with an error
parameter
such as hematocrit and represents the influence of this error parameter on the
slope
deviation AS. Thus, error parameters may be any value responsive to one or
more
errors in the output signal and may be measured, calculated, or determined
through
other means. Index functions may be experimentally determined as a regression
equation of the plot between AScai and an error parameter.
[0095] Other methods may be correlated with error parameters, such as the
%-hematocrit level of whole blood samples. For example, US Patent No.
7,338,639
describes using AC phase angle measurements to determine the hematocrit level
and temperature errors associated with whole blood samples. EP 1,742,045 Al
describes the determination of the hematocrit by an independent electrode and
the
correlation of the hematocrit level with output currents. Thus, the output
signals of
these methods may be used to compose the index functions. However, these
methods may be more complex to implement than using the correlation with the
slope deviation AS as discussed. The correlation with the slope deviation may
be
implemented using the intermediate DC signals of gated amperometry, which does
not require more than two electrodes to generate the output signals for
determining
the hematocrit compensation. In addition, the intermediate DC signals of gated
amperometry do not require any complicated AC circuitry to excite and generate
the
output signals to determine the hematocrit compensation. The use of gated
amperometry translates into equipment and thus cost savings of electronic
device
used to implement the analyte compensation system.
CA 02708038 2010-06-02
WO 2009/108239 PCT/US2008/085768
23
[0096] FIG. 6 shows a linear index function f(Index) relating AS to error
parameters.
Error parameters are the causes of errors in the analyte concentration
analysis. Error
parameters include temperature, hematocrit level, and the like as discussed.
Index
functions compensate the measured analyte concentration for one or more error
parameters or errors in the analysis as discussed. Index functions may be
calculated
using part or all of output signals such as currents, AC phase angle signals,
and the
like. Thus, the error parameters and the AScai values determined from Equation
9
may be used to determine one or more index function f(Index). As AS represents
the
difference between the Shyp for the analyte concentration in a sample
determined
from the output signal and the Scat obtained from a reference correlation
equation for
a specific output signal, the f(Index) function represents a relationship
between AS
and one or more error parameters. Index functions may be determined for any
factor describing a portion of the output signal attributed to error.
[0097] A linear index function may be determined as follows:
[0098] f(Index) = a * Error Parameter + b (Equation 10)
[0099] where a and b are pre-determined values for the slope and intercept,
respectively, of the index function and one or more Error Parameter is
determined
from the analysis of a sample by the biosensor system. For a linear index
function,
the values of a and b may be taken from any line correlating the AS.i values
with
the error parameters. The index function f(Index) also may be described with a
near
linear or polynomial equation. Linear and second order polynomial equations
may
be used to describe index functions. Index functions may be pre-determined for
multiple error parameters and stored in the biosensor system. For example, the
a
and b values of a linear index function may be implemented as a program number
assignment (PNA) table, another look-up table, or the like in the biosensor
system.
Other index functions may be used.
CA 02708038 2010-06-02
WO 2009/108239 PCT/US2008/085768
24
[00100] Temperature may be considered an error parameter for the analysis
because an error in concentration values may arise from performing an analysis
at a
temperature other than that at which the reference correlation was determined.
For
example, temperature affects the oxidation and diffusion of glucose in a
sample of
whole blood and the diffusion of optically active molecules. The temperature
for
the analysis may be determined from any source, such as a thermocouple,
calculated estimates, and the like.
[00101] FIG. 7A plots AS,ai values determined from output signal values
recorded as a function of temperature with Equation 9 at 10, 15, 20, 25, 30,
and
40 C. The resulting line showed a R2=0.8444 correlation and provided an index
function for temperature compensation, f(Index)Temp. In this instance,
f(Index)Temp
relates temperature to the deviation in slope between the reference
correlation slope
determined at a reference temperature and the hypothetical slope of the line
that
would provide the temperature affected analyte concentration at the
temperature at
which the analysis was performed. The index function for temperature
f(Index)Temp
may be stored in the biosensor system with the reference correlation equation.
[00102] FIG. 7B shows the improvement in percent bias values from the
method of FIG. 3 using the f(Index)Temp index function derived from FIG. 7A
and a
conventional method using the concurrent alteration of slope and intercept
values.
The method of FIG. 3 reduced temperature bias in relation to the conventional
method, as shown by the slope correlation decrease from 0.1543 to -0.005,
where
larger numerical slope values signify an increased relationship between
temperature
and percent bias. In addition to linear index functions, such as from FIG. 7A,
polynomial equations may be used to describe the relationship between error
parameters and AScai values. FIG. 7C shows linear and 2nd order polynomial
equations as f(Index)Temp relating AScai S to temperature. In this instance
the R2
correlation showed a slight improvement for the polynomial equation; however,
index functions relating other error parameters to AScai may show larger
differences
CA 02708038 2010-06-02
WO 2009/108239 PCT/US2008/085768
between linear and polynomial equations. FIG. 7D represents the temperature
sensitivity of AS vs. temperature for another sensor type. The data generated
from
40% hematocrit whole blood samples fits a second order polynomial. Thus,
temperature is an error parameter, which caused the slope deviation AS.
[00103] In addition to a single f(Index) function, AS may be represented by a
combination of f(Index) functions, where AS is conceptually represented as
follows:
[00104] AS = f(Index), + f(Index)2 + f(Index)3 + ... (Equation 11)
[00105] where each f(Index)n describes a different portion of the slope
deviation AS arising from different errors present in the output signal.
Depending
on the analysis, it may be preferred to describe AS with multiple index
functions
describing different error parameters. Preferably, when represented by
f(Index)n, the
different error parameters are independent of each other. Independent
relationships
between the different error sources as expressed in f(Index) functions may
provide
independent compensation for each error source, thus providing a more accurate
determination of the analyte concentration of the sample. For example, when
errors
arising from temperature and hematocrit are substantially unrelated when
expressed
as f(Index) functions, f(Index), may describe temperature error and f(Index)2
may
describe hematocrit error. Other error sources substantially unrelated to
temperature or hematocrit may be represented by f(Index)3 and the like. While
index functions from substantially unrelated error sources are preferred,
other index
functions may be used.
[00106] The compensation or correction of the analyte concentration value
may be started with the error parameter accounting for the largest error in
the output
signal. After compensating for the largest effect, any error remaining in AS
may be
compensated or corrected with additional error parameters independent of the
parameter responsive to the largest error, as previously described. After an
initial
index function is determined, such as f(Index)Temp, subsequent index functions
may
CA 02708038 2010-06-02
WO 2009/108239 PCT/US2008/085768
26
be determined from additional error parameters and AS2cat values determined
from
an equation as follows:
[00107] ASzca1 = Seat * Arr~i> -1 (Equation 12)
ref
[00108] where AS2cat is slope deviation remaining after the first f(Index),
compensation and represents the difference in slope between Scat and Shyp for
a
second error parameter after the first compensation, Scat is the slope from
the
reference correlation equation, Acorrr is the analyte concentration corrected
with
f(Index)l, such as temperature, and Aref is the reference analyte
concentration of the
sample, such as determined with a reference instrument. Additional index
functions
may be determined after a second Acorr(2) is determined by taking into account
the
first and second index functions. These and other index functions may be
stored in
the biosensor system as a PNA table, another look-up table, or the like. As
successive Acorr values are determined using additional index functions, the
bias in
the determined concentration values may decrease until the bias level
approaches
the random noise level of the analysis. Other equations to determine AS2cat
values
from a first index function and second error parameters may be used.
[00109] The error in concentration values arising from the hematocrit and
other
effects may be described by multiple parameters responsive to the error, such
as
output signal values other than that used to determine the analyte
concentration of
the analyte, ratios of output signal values, mathematical combinations of
output
signal values, and other values derived from the output signal and/or other
sources.
These error parameters may be internal to the intermediate values of the
output
signal or derived from the intermediate values of the output signal. To
determine
f(Index)Hct, for example, the AS2cat values determined from Equation 12 at a
specific
output signal value may be plotted on the Y-axis of FIG. 6, and error
parameter
values corresponding to the specific output signal value and responsive to
CA 02708038 2010-06-02
WO 2009/108239 PCT/US2008/085768
27
hematocrit bias may be plotted on the X-axis. The resulting correlation would
be
f(Index)Hd based on the hematocrit responsive error parameter.
[00110] When multiple index functions are used to describe AS, the corrected
analyte concentration may be calculated using an equation represented as
follows:
[00111] A...(2 = i - Int (Equation 13)
Seas + AS, + AS2
[00112] where Acorr(z) is the analyte concentration corrected with two AS
values,
i is a value of the output signal including multiple sources of error from
different
contributors, Int is the intercept from a reference correlation equation, S.i
is the
slope from the reference correlation equation, and Si Oand AS2 represent the
deviation in slope attributable to two error contributors. Other equations to
determine a corrected analyte concentration from multiple index functions may
be
used.
[00113] While many techniques may be used to determine error parameters
responsive to a bias contributor, output signal values are preferred to
describe some
types of bias contributors, such as hematocrit error. FIG. 8A depicts a gated
pulse
sequence where the input signal includes multiple excitations and relaxations,
and
excitations E2-E7 are labeled. FIG. 8B depicts the output signal currents from
the
input signals labeled as current decays D2-D7. The first number in the
subscript of
the i values denote the excitation number, while the second number in the
subscript
denotes the output signal value of the decay being described. For example,
i2,3
denotes the third current value recorded for D2.
[00114] Multiple output signal values may be combined to determine error
parameters of varying complexity. Table I below, shows multiple error
parameters
and the corresponding output signal values from FIG. 8B.
[00115]
CA 02708038 2010-06-02
WO 2009/108239 PCT/US2008/085768
28
Error Parameter Output Signal Values
R2 12,3/12,1
R3 13,3/13,1
R4 14,3/14,1
R5 i5,3/i5,1
R2/R3 (i2,3/i2, 1)/(13, 3/13,1)
R4/3 14,3/13,3
R5/4 i4,3/i4,3
R6/5 -6,3/-5,3
Index-I R4/3 - (R2/R3)
Index-II (R4/3)p - (R2/R3)q
where p and q are positive and may or may
not be equal
Table I
[00116] An example of using one-step to compensate for more than one error
parameter is provided in reference to FIGS. 8C-8D is given here. FIG. 8C
depicts
another gated pulse sequence where the input signal includes multiple
excitations
and relaxations using gated amperometry. The potential sequence is slightly
different from that illustrated in FIGS. 8A in that the first pulse in Fig. 8C
is split into
two pulses. The timing of the following pulses is the same as in Fig. 8A.
Thus, the
labeling of currents and the simple ratio indices differ by one number. For
instance,
the ratio R4/3 for FIG. 8C is equivalent to the ratio R3/2 for FIG. 8A, as
well as the
ratio R5/4 for FIG. 8C is equivalent to the ratio R4/3 for FIG. 8A, etc. A
study was
CA 02708038 2010-06-02
WO 2009/108239 PCT/US2008/085768
29
conducted with the capillary blood samples tested at room temperature and the
venous samples tested at a lower temperature of average 15.7 C from about 50
donors. In Fig. 8D, the ASt tai and AS-40% (representing adjusting temperature
offset
to AS) are plotted against the common index R6/5 with respect to the current
labels
in Fig. 8C. The open squares represent ASt tai. The open diamonds represent
the one
after adjusting the temperature offset to ASt tai. The two plots differ only
in the
regression intercept, with both having essentially the same slope. This
difference in
intercept of the AS vs. R6/5 plots represents the average temperature effect
on the
entire data population. If the regression equation from ASt tai vs. R6/5 is
substituted
into Equation 7, glucose readings are compensated for both the temperature and
hematocrit. Fig 8E shows the plots of bias/%-bias before and after
compensation.
The open diamonds represent the population of the original data, with a mean
bias
of -21 and a standard deviation (SD value) of 6.75. The open triangles
represent the
population after total error compensation, with a mean bias of -0.08 and a
standard
deviation of 4.32. The reduction in mean %-bias is the removal of temperature
effect on the data population. The reduction in SD value represents reducing
the
bias spread, thus increasing the accuracy.
[00117] FIGS. 9A-9D show the correlations between AScai and the error
parameters of R2/R3, R4/3, Index-I, and Index-II, respectively, for a
biosensor
system. About 100 samples from 50 subjects (2 samples per subject) containing
glucose as an analyte at various concentrations were used. For Index-II, the
integer
value of six was chosen for p and q. Each figure includes the regression
equation
representing the index function that could be used to determine AS values from
the
associated error parameter for use in Equation 7. The larger the R2 value for
the
correlation, the more responsive the error parameter is to the bias. Of the
error
parameters attempted, Index-II was most responsive to bias due to the greatest
R2
value. Thus, if Index-II was to be used as an index function to determine AS
for the
analysis, the f(Index) equation y=29.746x - 10.338 could be used, where x is
the
CA 02708038 2010-06-02
WO 2009/108239 PCT/US2008/085768
value of the Index-II error parameter from the analysis and y is the value
determined
for AS.
[00118] FIGS. 10A-10C show the correlations between AScai and the error
parameters of R4/3, R5/4, and R6/5, respectively, for a biosensor system using
different reagents than in FIG. 9. The glucose concentrations determined from
about
100 whole blood samples were used. Values for OScai representing total bias
error,
as could be determined from Equation 9, were used. The R2 values for R4/3,
R5/4,
and R6/5 were 0.1133, 0.4533, and 0.6982, respectively, showing that R6/5 was
most responsive to the error. As the R2 values increased from 0.1133 to
0.4533, and
finally to 0.6982, the percent of the determined analyte concentration values
within
a 10% bias limit increased from 79.6%, to 89.8%, and finally reaching 95.4%
when using the R6/5 error parameter to determine AScai. Each of the error
parameters when used to determine AS values for Equation 7 successfully
reduced
the percent bias spread of the determined analyte concentrations by pulling
the bias
toward the center of the distribution. Thus, AS values determined from error
parameters increased the number of analyte concentration values falling within
a
10% bias limit from 75.5% (uncompensated) to 95.4% (compensated with R6/5),
a 20% improvement in accuracy.
[00119] FIG. 11 A shows the correlation between AScai and the error parameter
R4/3 for a biosensor system using reagents different that those seen in FIGS.
9 or 10.
Unlike for the FIG. 9 or 10 biosensor systems, for the FIG. 11 A system, R4/3
provided a R2 value of 0.5064. Thus, the bias associated with different
biosensor
system variables, such a reagent composition, electrode structure, sensor
strip
construction, light-identifiable species, optical detection method, and the
like, may
be described by different error parameters. As shown in FIG. 11 B, of the
analyte
concentrations determined with this system, 91.7% fell within the 10% bias
limit
before compensation, while 99.1 % of the analyte concentrations fell within
the
10% bias limit after compensation with the R4/3 error parameter. FIG. 11 C
shows
CA 02708038 2010-06-02
WO 2009/108239 PCT/US2008/085768
31
the improvement in the mean and standard deviation values for uncompensated
and
R4/3 error parameter compensated glucose concentration values. As shown in the
histogram, the standard deviation fell from 5.826 to 4.057 for the compensated
concentration values, an improvement of about 30%.
[00120] FIGS. 9, 10, and 11 used a single error parameter to determine a
single
AS value for compensation. FIG. 12A shows the correlation between AS,cai and
the
error parameter Index-I (R2=0.4693), while FIG. 12B shows the correlation
between
OS2cai and the error parameter R4 (R2=0.3429). AS,cai was determined with
Equation 9, while AS2cal was determined with Equation 4. Of these two index
functions, AS, may be related to hematocrit, while AS2 may be related to other
error
contributors. When used in combination through Equation 5, the standard
deviation
of the percent bias decreased from 5.45 to 4.89 after compensation with the Si
Oindex function and to 3.99 after compensation with the AS, and AS2 index
functions.
The Si Oindex function provided an approximate 10% decrease in standard
deviation, while the AS, and AS2 index functions in combination provided an
approximate 27% decrease. Thus, slope-based compensation increased the number
of determined analyte concentrations falling within the 10% bias limit to
99.1 %,
as shown in Table II, below.
Uncorrected Corrected with ASi Corrected with
ASi and AS2
% Bias Mean 0.213 -1.64 -1.45
Std. Dev. Of % Bias 5.45 4.89 3.99
% Aro within 93.5 97.2 99.1
+ 10% bias limit
Table II
CA 02708038 2010-06-02
WO 2009/108239 PCT/US2008/085768
32
[00121] These results establish that an uncompensated analysis performed on
multiple samples results in nearly 7% of the determined analyte concentration
values falling outside of a 10% bias limit, where after compensation less
than 1 %
of the compensated values are outside of the limit. Using error parameters to
determine AS values that are then used to compensate an analysis can provide
increases in accuracy where at least 85% of the determined analyte
concentration
values preferably fall within a 10% bias limit, and more preferably at least
90% of
the determined analyte concentration values fall within a 10% bias limit. At
present, especially preferred slope-based bias correction methods can provide
analyte concentration values where at least 95% or at least 97% of the
determined
analyte concentration values fall within a 10% bias limit.
[00122] The slope deviation, AS, and/or related index functions may be
normalized to represent the %-bias in the correlation of analyte
concentrations with
output signals. In normalization, the slope deviation, index function, or
other
parameter is adjusted (multiplied, divided, or the like) by a variable to
reduce the
statistical effect of changes in the parameter, improve the differentiation in
variations
of the parameter, standardize measurements of the parameter, a combination
thereof, or the like.
[00123] The slope deviation, AS, in Equation 7 may be normalized by the slope
of the reference correlation equation, Scai, resulting in a compensation
correlation
between AS/Scai and the index function.
[00124] In Equation 7, AS is divided by Scai as follows:
i-Int - i-Int
Ac rr - S + AS S 1 + AS / S
[00125] ~a~ ~Q~( cQ1) (Equation 14).
[00126] AS/Scai is an index function, f (index), which may be represented as
follows:
CA 02708038 2010-06-02
WO 2009/108239 PCT/US2008/085768
33
[00127] AS/Scat = f(Index) =c1 *Index +co (Equation 15).
[00128] The index function, f (index), of Equation 15 may be substituted into
Equation 14 as follows:
i-Int _ i-Int
[00129] A` '~ =Scal (1 + f(Index)) Scai(1+(c1 *Index +co)) (Equation 16).
[00130] Solving for the slope deviation, AS, provides the following
relationship:
[00131] AS= Scal * f (Index) = Scal * (c1 * Index + co) (Equation 17).
[00132] The normalization of the slope deviation, AS, by Scai essentially
eliminates the potential effect from different calibrations of Scai. FIG. 1 3A
depicts the
correlation of AS with an index function responsive to the ratio R5/4. FIG. 1
3B
depicts the correlation of AS/Scai with an index function responsive to the
ratio R5/4.
[00133] The slope deviation, AS, in Equation 7 also may be normalized by
multiplication with a normalized slope function, SNML, resulting in a
compensation
correlation between SNML and the index function.
[00134] The normalized slope function SNML may be represented as follows:
[00135] SNML = S / Sew = i A Int * Sl = f(Index) = d1 *Index +d, (Equation
18).
of cal
[00136] Substituting Equation 18 into Equation 7 and replacing SNML with an
index function, f (index), results in the following relationship:
[00137] A = i-Int i - Int i - Int (Equation 19).
Scal *S NML Scal * if (Index) Scal * (d1 * Index + d0)
CA 02708038 2010-06-02
WO 2009/108239 PCT/US2008/085768
34
[00138] FIG. 14 depicts the correlation of SNML with an index function
responsive to the ratio R5/4. The correlations with the index functions in
FIGS. 1 3A,
13B, and 14 are similar since all three index functions are mathematically
related.
[00139] Similar to previous results, the normalized slope-based compensation
increased the number of determined analyte concentrations falling within the
10%
bias limit to 99.1 %, as shown in Table III, below.
Uncorrected Corrected with Corrected with
AS/ScaI SNML
% Bias Mean 0.213 -1.64 -1.64
Std. Dev. Of % Bias 5.45 4.89 4.89
% Aro within 93.5 97.2 97.2
+ 10% bias limit
Table III
[00140] FIG. 15 depicts a schematic representation of a biosensor system 1500
that determines an analyte concentration in a sample of a biological fluid.
Biosensor
system1500 includes a measurement device 1502 and a sensor strip 1504, which
may be implemented in any analytical instrument, including a bench-top device,
a
portable or hand-held device, or the like. The measurement device 1502 and the
sensor strip 1504 may be adapted to implement an electrochemical sensor
system,
an optical sensor system, a combination thereof, or the like. The biosensor
system
1500 adjusts a correlation for determining analyte concentrations from output
signals with at least one AS value. The AS adjusted correlations may improve
the
accuracy and precision of the biosensor system 1500 in determining the analyte
concentration of the sample. The biosensor system 1500 may be utilized to
determine analyte concentrations, including those of glucose, uric acid,
lactate,
cholesterol, bilirubin, and the like. While a particular configuration is
shown, the
CA 02708038 2010-06-02
WO 2009/108239 PCT/US2008/085768
biosensor system 1500 may have other configurations, including those with
additional components.
[00141] The sensor strip 1504 has a base 1506 that forms a reservoir 1508 and
a channel 1510 with an opening 1512. The reservoir 1508 and the channel 1510
may be covered by a lid with a vent. The reservoir 1508 defines a partially-
enclosed
volume. The reservoir 1508 may contain a composition that assists in retaining
a
liquid sample such as water-swellable polymers or porous polymer matrices.
Reagents may be deposited in the reservoir 1508 and/or channel 1510. The
reagents may include one or more enzymes, binders, mediators, and like
species.
The reagents may include a chemical indicator for an optical system. The
sensor
strip 1504 also may have a sample interface 1514 disposed adjacent to the
reservoir
1508. The sample interface 1514 may partially or completely surround the
reservoir
1508. The sensor strip 1504 may have other configurations.
[00142] In an optical sensor system, the sample interface 1514 has an optical
portal or aperture for viewing the sample. The optical portal may be covered
by an
essentially transparent material. The sample interface may have optical
portals on
opposite sides of the reservoir 1508.
[00143] In an electrochemical system, the sample interface 1514 has
conductors connected to a working electrode and a counter electrode. The
electrodes may be substantially in the same plane or in more than one plane.
Other
separation distances between the electrodes and the lid may be used. The
electrodes may be disposed on a surface of the base 1506 that forms the
reservoir
1508. The electrodes may extend or project into the reservoir 1508. A
dielectric
layer may partially cover the conductors and/or the electrodes. The sample
interface
1514 may have other electrodes and conductors.
[00144] The measurement device 1502 includes electrical circuitry 1516
connected to a sensor interface 1518 and a display 1520. The electrical
circuitry
CA 02708038 2010-06-02
WO 2009/108239 PCT/US2008/085768
36
1516 includes a processor 1522 connected to a signal generator 1524, an
optional
temperature sensor 1526, and a storage medium 1528.
[00145] The signal generator 1524 provides an electrical input signal to the
sensor interface 1518 in response to the processor 1522. In optical systems,
the
electrical input signal may be used to operate or control the detector and
light
source in the sensor interface 1518. In electrochemical systems, the
electrical input
signal may be transmitted by the sensor interface 1518 to the sample interface
1514
to apply the electrical input signal to the sample of the biological fluid.
The electrical input signal may be a potential or current and may be constant,
variable, or a combination thereof, such as when an AC signal is applied with
a DC
signal offset. The electrical input signal may be applied as a single pulse or
in
multiple pulses, sequences, or cycles. The signal generator 1524 also may
record
an output signal from the sensor interface as a generator-recorder.
[00146] The optional temperature sensor 1526 determines the temperature of
the sample in the reservoir of the sensor strip 1504. The temperature of the
sample
may be measured, calculated from the output signal, or assumed to be the same
or
similar to a measurement of the ambient temperature or the temperature of a
device
implementing the biosensor system. The temperature may be measured using a
thermister, thermometer, or other temperature sensing device. Other techniques
may be used to determine the sample temperature.
[00147] The storage medium 1528 may be a magnetic, optical, or
semiconductor memory, another storage device, or the like. The storage medium
1528 may be a fixed memory device, a removable memory device, such as a
memory card, remotely accessed, or the like.
[00148] The processor 1522 implements the analyte analysis and data
treatment using computer readable software code and data stored in the storage
medium 1528. The processor 1522 may start the analyte analysis in response to
the
CA 02708038 2010-06-02
WO 2009/108239 PCT/US2008/085768
37
presence of the sensor strip 1504 at the sensor interface 1518, the
application of a
sample to the sensor strip 1504, in response to user input, or the like. The
processor
1522 directs the signal generator 1524 to provide the electrical input signal
to the
sensor interface 1518. The processor 1522 receives the sample temperature from
the temperature sensor 1526. The processor 1522 receives the output signal
from
the sensor interface 1518. The output signal is generated in response to the
reaction
of the analyte in the sample. The output signal may be generated using an
optical
system, an electrochemical system, or the like. The processor 1522 determines
AS
compensated analyte concentrations from output signals using a slope-adjusted
correlation equation as previously discussed. The results of the analyte
analysis may
be output to the display 1520 and may be stored in the storage medium 1528.
[00149] The correlation equations between analyte concentrations and output
signals may be represented graphically, mathematically, a combination thereof,
or
the like. The correlation equations may be represented by a program number
(PNA)
table, another look-up table, or the like that is stored in the storage medium
1528.
Instructions regarding implementation of the analyte analysis may be provided
by
the computer readable software code stored in the storage medium 1528. The
code
may be object code or any other code describing or controlling the
functionality
described herein. The data from the analyte analysis may be subjected to one
or
more data treatments, including the determination of decay rates, K constants,
ratios,
and the like in the processor 1522.
[00150] In electrochemical systems, the sensor interface 1518 has contacts
that
connect or electrically communicate with the conductors in the sample
interface
1514 of the sensor strip 1504. The sensor interface 1518 transmits the
electrical
input signal from the signal generator 1524 through the contacts to the
connectors in
the sample interface 1514. The sensor interface 1518 also transmits the output
signal from the sample through the contacts to the processor 1522 and/or
signal
generator 1524.
CA 02708038 2010-06-02
WO 2009/108239 PCT/US2008/085768
38
[00151] In light-absorption and light-generated optical systems, the sensor
interface 1508 includes a detector that collects and measures light. The
detector
receives light from the liquid sensor through the optical portal in the sample
interface 1514. In a light-absorption optical system, the sensor interface
1508 also
includes a light source such as a laser, a light emitting diode, or the like.
The incident beam may have a wavelength selected for absorption by the
reaction
product. The sensor interface 1508 directs an incident beam from the light
source
through the optical portal in the sample interface 1514. The detector may be
positioned at an angle such as 45 to the optical portal to receive the light
reflected
back from the sample. The detector may be positioned adjacent to an optical
portal
on the other side of the sample from the light source to receive light
transmitted
through the sample. The detector may be positioned in another location to
receive
reflected and/or transmitted light.
[00152] The display 1520 may be analog or digital. The display may be an
LCD display adapted to displaying a numerical reading.
[00153] In use, a liquid sample for analysis is transferred into the reservoir
1508 by introducing the liquid to the opening 1512. The liquid sample flows
through the channel 1510, filling the reservoir 1508 while expelling the
previously
contained air. The liquid sample chemically reacts with the reagents deposited
in
the channel 1510 and/or reservoir 1508.
[00154] The sensor strip 1502 is disposed adjacent to the measurement device
1502. Adjacent includes positions where the sample interface 1514 is in
electrical
and/or optical communication with the sensor interface 1508. Electrical
communication includes the transfer of input and/or output signals between
contacts
in the sensor interface 1518 and conductors in the sample interface 1514.
Optical
communication includes the transfer of light between an optical portal in the
sample
interface 1502 and a detector in the sensor interface 1508. Optical
communication
CA 02708038 2010-06-02
WO 2009/108239 PCT/US2008/085768
39
also includes the transfer of light between an optical portal in the sample
interface
1502 and a light source in the sensor interface 1508.
[00155] The processor 1522 receives the sample temperature from the
temperature sensor 1526. The processor 1522 directs the signal generator 1524
to
provide an input signal to the sensor interface 1518. In an optical system,
the sensor
interface 1518 operates the detector and light source in response to the input
signal.
In an electrochemical system, the sensor interface 1518 provides the input
signal to
the sample through the sample interface 1514. The processor 1522 receives the
output signal generated in response to the redox reaction of the analyte in
the
sample as previously discussed.
[00156] The processor 1522 determines the analyte concentration of the
sample. The measurement device adjusts the correlation between analyte
concentrations and output signals with at least one AS value. The analyte
concentration is determined from the slope-adjusted correlation and the output
signal.
[00157] FIG. 16 represents another method for determining an analyte
concentration in a sample of a biological fluid. In 1602, a biosensor system
applies
a first potential sequence across working and counter electrodes. The first
potential
sequence may be a polling potential or like sequence. The polling potential
sequence may have an extended polling feature. In 1604, the biosensor is
filled with
a biological sample such as whole blood or the like as previously discussed.
In
1606, the biosensor determines whether there is sufficient volume of the
biological
sample present in the sensor cell for analysis. The biosensor may determine
whether currents or other output signals generated by the biological sample in
response to the first potential sequence meet one or more thresholds at one or
more
polling potentials. In 1608, the biosensor system applies a second potential
sequence. The biosensor system may apply the second potential sequence once
the
sensor cell is full. The second potential sequence may be responsive to gated
CA 02708038 2010-06-02
WO 2009/108239 PCT/US2008/085768
amperometry or another electrochemical process. In 1610, the biosensor system
records the output signals from the electrodes. In 1612, the biosensor system
determines an index function in response to the output signals. The index
function
may include one or more indicator index values. The index function may be
responsive a correlation based on %-bias, slope deviation, slope
normalization, a
combination thereof, or the like as previously discussed. The index function
may
represent a correlation between %-bias and a ratio of the output signals such
as
R5/4. In 1616, the biosensor system determines whether the system error is
outside
one or more error boundaries in response to the index function. In 1618, the
biosensor system determines the analyte concentration in response to the
output
signals and the index function. The biosensor system adjusts the analyte
correlation
equation between the output signals and the analyte concentration in response
to
the index function, and then determines the analyte concentration using the
adjusted or compensated analyte correlation equation. The biosensor system may
adjust the analyte correlation equation when the index function indicates the
system
error is outside one or more error boundaries. The analyte correlation
equation may
be the slope of the correlation between the output signals and a reference
analyte
concentration.
[00158] While various embodiments of the invention have been described, it
will be apparent to those of ordinary skill in the art that other embodiments
and
implementations are possible within the scope of the invention. Accordingly,
the
invention is not to be restricted except in light of the attached claims and
their
equivalents.