Note: Descriptions are shown in the official language in which they were submitted.
CA 02715725 2014-09-29
MONITORING OF RESERVOIR FLUID MOVING ALONG FLOW PATHWAYS IN
A PRODUCING OIL FIELD USING PASSIVE SEISMIC EMISSIONS
BACKGROUND OF THE INVENTION
Field of the Invention
[01] The present invention relates to a method of monitoring reservoir rock
containing
hydrocarbons, and in particular to a method and system for the identification
of the type of
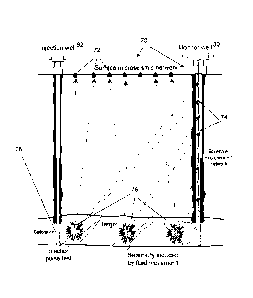
liquid moving along flow pathways of a producing field using passive seismic
emissions.
Description of Related Art
[02]
Microseisms in reservoir rock matrixes in producing oil fields are generally
the result
of pore pressure perturbation and geomechanical stress field relaxation due to
liquid
movement as reservoir fluids are produced and/or injected. The microseisms, or
micro-
earthquakes, are generated because the stress field in the reservoir, and
fluid flow, is
anisotropic. The anisotropy is generally due to heterogeneity in reservoir
rocks. Existence of
joints, bedding planes, faults, and fractures are common in sedimentary rock.
In most
reservoirs, the in-situ stress conditions due to overburden pressure keep
these features closed
to fluid flow. During the production life of a hydrocarbon reservoir,
CA 02715725 2010-08-16
WO 2009/108394
PCT/US2009/001379
changes in fluid pressures result in perturbation of the in-situ stresses.
These effects are
discussed in greater detail in Taylor et al., "Dilatant Stabilization of
Subduction
Earthquake Rupture into the Shallow Thrust
Interface,"
http ://esag.harvard . edu/taylor/Di latancy. htm I .
[04] The microseisms follow the same laws of physics for generation and
transmission
as do natural earthquakes. Microseisms result from elastic rock failure of the
reservoir
rock matrix. T he micro-earthquakes are due to shear stress release along
zones of
weakness in the rock formation. The stress release is due to perturbation
caused by
reservoir production and injection operations. Water injection generates
increased
reservoir pore pressure which causes an increase in shear stress in reservoir
rocks. This
impacts the stability along the planes of weakness present in reservoir rocks,
such as
joints, bedding planes, faults and fractures. Similarly, reservoir oil
production operations
or fluid withdrawal create a pore pressure sink which also affects the
stability along the
zones of weakness. Seismic waves from microseismic events are transmitted from
the
source location (or hypocenters) to remote sensors (or seismometers). The
hypocenters
of microseismic events correspond with locations of elastic rock failure that
form the
fluid conduits.
[05] Microseismic event generation from fluid injection was observed in
experimental
results conducted in the KTB (Kontinentales Tiefbohrprogramm der
Bundesrepublik
Deutschland) site. The results were published in "Fluid induced seismicity
guided by a
continental fault: Injection experiment of 2004/2005 at the German Deep
Drilling Site
(KTB)," by S.A. Shapiro et al., Geophysical Research Letters, vol. 33, L01309,
2006
(doi: 10.1029/2005GL024659). Flow anisotropy and non-linearity of its
hydraulic
2
CA 02715725 2010-08-16
WO 2009/108394
PCT/US2009/001379
behavior is observed. As described in the publication, microseisms are
triggered by
pressure perturbations from fluid injections. This is related to the energy
transport
process of pore pressure diffusion. Increasing fluid pressure during injection
causes a
decrease of the effective normal stress and leads to sliding along preexisting
sub-critical
cracks and fractures. The geometry of clouds of micro-earthquake hypocenters
indicates
that the pressure diffusion is a dominant mechanism of seismicity triggered by
fluid
injections. One approach for estimating the hydraulic diffusivity of rocks
using
microseismicity uses a spatio-temporal analysis of the cloud of fluid-
injection induced
events. The simplest version uses an equation describing the spatial position
r of the so-
called triggering front, i.e., the location of microseismic event induced in
the reservoir, in
an effective isotropic homogeneous poro-elastic medium with the scalar
hydraulic
diffusivity D at time t:
r = V4zDt
As the in situ stresses are perturbed by reservoir production and injection
activities, the
resulting changes in fluid pressure create elastic failure in the rocks and
cause
microseismic events. Microseisms emanating from the reservoir, with local
magnitude
levels down to a Richter value <-1 or even lower, are detected. Events below a
Richter
value of -3 are often classified as background noise. These microseisms are
detected in
multi-component seismic sensors with wide bandwidth, over distances of 1
kilometer and
greater. Conventionally, fluid flow monitoring, including the assessment of
changes in
the reservoir characteristics over the production time, is achieved with
measurements in
selected wells using downhole instrumentation at selected production time
intervals.
3
CA 02715725 2010-08-16
WO 2009/108394
PCT/US2009/001379
[06] A method for locating microseismic sources is disclosed in US Patents
6,049,508
and 6,920,083. Recorded microseismic waves consist of records of compressional
waves, known as P-waves and shear waves, known as S-waves. The first arrival
times of
recorded P-waves and S-waves, and the velocities of the rock layers, are used
to compute
source location or hypocenter microseisms where the rock failure occurred. For
each
microseismic event, it is first necessary to determine the fault plane and
slip direction
(source mechanism) before investigating for source parameters. Such source
location
technique is implemented by identifying and classifying the first arrival time
breaks and
measuring arrival times of P-waves and S-waves. The amplitudes of these P and
S-waves
are detected and the seismograms are recorded. Also, polarization analysis is
performed.
with hodograms or terminus of a moving vector for particle motion of the waves
recorded
in the three component sensors which are oriented orthogonally in the sensor
package.
The polarization analysis consists in measuring the spatial distribution of a
three
component (right-normal basis) signal over a time window using the covariance
matrix.
Most of the time, the results used are the "azimuth" and the dip inclination
of the
distribution main direction which is defined by a vector. This analysis
determines the
direction of a wave's approach to the three component sensors or detectors
that are
planted precisely with a known orientation.
[07] US Patent 7,127,353 describes a method for monitoring seismic energy
emitted
from the reservoir. Monitoring the changes in seismic energy emission in
response to
pressure changes in the active well and altering the values of the processing
parameters
permits measurement of components of the permeability tensor. Changing fluid
pressure
4
CA 02715725 2010-08-16
WO 2009/108394
PCT/US2009/001379
causes seismicity to rapidly migrate outward from the points of fluid pressure
change and
will alter the characteristics of the seismic energy emission.
[08] US Patent 5,377,104 describes an arrangement of seismic sensors to detect
passive microseismic events induced in reservoir by hydraulic fracturing. The
disclosure
provides a system and method of monitoring and verification of the geologic
containment
of hydraulically induced fractures used for the disposal of hazardous wastes ,
to avoid
cross contamination with water source.
[09] Lee, et al., Advances in Geophysics, Supp. 2, Principles and Applications
of
Microearthquake Networks, (Academic Press, 1981); and Raymer et al., "Genetic
Algorithm Design of Microseismic Injection-Monitoring Networks in the Tengiz
Field",
SEG Technical Program Expanded Abstracts, 2000, pp. 562- 565; describe that
the
travel-time for induced microseismic events from source to receiver involves
solving a
set of first-order differential equations. A network of sensors distributed
spatially on the
surface and at different levels in a borehole records a number of arrival
times n, for P-
waves and S-waves from a microseismic event with hypocenter parameters
(x,y,z,t). In
matrix notation:
AX=B
where A is the nx4 design matrix of partial differentials, X is a vector of 4
unknown
hypocenter parameters (x,y,z,t) and B represents vector differences between
the
calculated and observed travel times arrival. The design matrix determines the
efficiency
of the network. For a given matrix A and a set of observations of B, the
equation will
solve for unknown vector X. The partial differentials define how much the
hypocenter
parameters will change with respect to travel times. The uncertainty will be
large when
CA 02715725 2010-08-16
WO 2009/108394
PCT/US2009/001379
small changes in travel time cause large changes in hypocenter. This provides
a
quantitative measure for network performance in locating a microseismic event
source.
Performance of the network is evaluated by populating the reservoir volume of
interest
with trial location. On this volume, 3D seismic ray trace modeling is
performed between
the trial locations and the designated sensor positions to produce a complete
set of partial
differentials. Each partial differential would form a line of the design
matrix. The
optimal combination of sensor locations in the network is found by solving
these
equations.
[10] An improvement to these approaches is disclosed in commonly assigned PCT
Publication Number WO 2007/0562278 entitled "Continuous Reservoir Monitoring
for
Fluid Pathways Using 3D Microseismic Data." This application embodies a
technique of
mapping fluid conduits in hydrocarbon reservoirs. T his system exploits the
minute
vibrations, or micro-earthquakes that are generated in the reservoir layers
induced by
fluid movement. These micro-earthquakes are recorded on sensitive seismic
geophones
that are deployed on the ground surface and in boreholes in the test area.
These
microseisms are detected as the fluids move in the reservoir. Referring to
FIG. 3, a
permanent network 70, including cemented geophones 72 that are deployed
spatially on
the ground surface and geophones 64 that are installed in a borehole monitor
well 80, is
used to record microseisms 76. The system continuously detects and records the
passive
micro-earthquakes or microseismic events emanating from the reservoir as
fluids are
produced and injected at a location 78 from an injection well 82.
[11] Location computation of microseismic sources is a known art, and computer
software is available for such analysis. The location in (x,y,z) coordinates
for each
6
CA 02715725 2010-08-16
WO 2009/108394
PCT/US2009/001379
microseismic event that is detected by the surface and borehole sensors is
derived and its
time of occurrence T. is obtained from Global Positioning System (GPS) time
stamps
from the recording system. The plurality of sensors in a high density network
provides
the redundancy in the recorded data and improves the accuracy in the source
location of
the detected events.
[12] Monitoring of fluid pathways and delineating the reservoir fluid flow
anisotropy
is helpful in optimizing reservoir management plans and improving overall oil
recovery.
While the above described references disclose various methods and systems for
deterring
the location of one or more hypocenters, none disclose the delineation of the
type of fluid
passing through cracks and/or fractions.
[13] US Patent 7,242,637 assigned to Shell Oil Company describes a time-lapse
seismic survey process for investigating a subsurface reservoir region. The
disclosure
identifies water contact lines in the seismic representations, and also
discusses a model
that includes a sea water layer. However, these models do not detect passive
microseismic emissions based upon movement of fluids.
[14] US Patent 6,614,717 assigned to Nonlinear Seismic Imaging, Inc. also
describes a
time-lapse seismic imaging method. This reference discloses the viscosity
difference
between oil and water, and notes that hysteresis at seismic frequencies is
related to the
viscosity of the pore fluids. However, this reference relates to seismic
imaging in a
system including an active seismic source and receiver. There is no disclosure
in the
reference related to measurement or monitoring of passive microseismic
emissions.
[15] US Patent 6,498,989 and related US Patents 6,028,820 and 5,796,678, all
assigned
to Trans Seismic International Inc., describe a wave equation based on a
discrete dynamic
7
CA 02715725 2010-08-16
WO 2009/108394
PCT/US2009/001379
model that uses stress conditions as target parameters, which are used to
discover oil and
gas pools, as well as water reserves. The product data set from the equation
can be
outputted in the form of an initial isochron map, a pressure gradient map, a
corrected
isochron map, or an overlay of the relative pressure changeability map and the
corrected
isochron map, which are the basis for identifying the most probable locations
of oil, gas,
and water. The processes proposed in these references are for locating fluid
accumulations from seismic imaging of subsurface regions, and presupposes a
seismic
reflection survey. Direction of fluid flow is inferred indirectly from the
reflection
surveys. There is no disclosure of monitoring of passive microseismic
activity.
[16] Patent Publication US2008/0151691 assigned to Schlumberger Technology
Corporation discloses methods of passively monitoring microseismic events,
which can
be applied to hydrocarbon reservoirs and subterranean water-bearing layers.
However,
this disclosure relates to monitoring of hydraulic fracturing or reservoir
stimulation using
passive microseismic recordings, and does not in any way attempt to discern
the type of
liquid moving along a certain pathway in a reservoir.
[17] US Patent 6,941,227 assigned to the Regents of the University of
California
describes frequency-dependent method for processing seismic data. One aspect
of the
disclosure relates to identifying an oil-water contact. However, this
disclosure relies
upon reflection surveys, and the frequency spectrum is analyzed from the
acquired
reflection data from a fluid filled reservoir and correlated with known
accumulations.
There is no discussion in the reference related to recording or processing of
passive
seismic emission data based upon fluid dynamics in a hydrocarbon reservoir.
8
CA 02715725 2010-08-16
WO 2009/108394
PCT/US2009/001379
[18] None of the above references discloses the detection and monitoring of
passive
microseismic emissions to ascertain the type of fluid moving along a
particular region of
an oil reservoir. Accordingly, a need exists for a system for, and method of
determining
the location of a fluid front, and the type of fluid, moving through
anisotropic flow
pathways in oil reservoirs.
[19] Therefore, it is an object of the present invention to determine the type
of fluid
moving through flow pathways in oil reservoirs based on the collection and
analysis of
passive microseismic data.
[20] It is another object of the present invention to determine the location
of the
particular type of fluid moving through fluid pathways in oil reservoirs.
[21] As used herein, the term fluid means a liquid that is predominantly oil
or
predominantly water, either of which may contain minor amounts of the other
and
dissolved gas. For the purposes of describing the method and system of the
invention it
is assumed that no significant volumes of hydrocarbon gas is present and or
moving the
volume of the reservoir rock that is being analyzed for characterization of
the
microseismic events.
SUMMARY OF THE INVENTION
[22] The above objects and further advantages are provided by the system and
process
for determining whether a liquid moving in an oil-bearing reservoir rock
formation is
water or oil is provided. The oil-bearing rock formation includes at least one
production
well and at least one source of injected water during normal oil production. A
preferential fluid pathway is identified. A baseline number of passive
microseismic
9
CA 02715725 2010-08-16
WO 2009/108394
PCT/US2009/001379
events per a predetermined unit of baseline time is established. Passive
microseismic
events in the preferential fluid pathway are monitored during normal oil
production to
sense a number of microseismic events during a predetermined unit period of
monitoring
time. The sensed number of microseismic events during the predetermined unit
period of
monitoring time are compared to the baseline number of passive microseismic
events per
the predetermined unit of baseline time. The fluid causing the microseismic
events is
determined to be water if the sensed number of microseismic events during the
predetermined unit period of monitoring time approaches the baseline number of
passive
microseismic events per the predetermined unit, and if the baseline number of
passive
microseismic events per the predetermined unit baseline time is measured
during a time
period when the water injection is greater than the rate of water injection
during normal
oil production.
[23] In an additional embodiment of the system and method of the present
invention,
the fluid causing the microseismic events is determined to be oil if the
sensed number of
microseismic events during the predetermined unit period of monitoring time
approaches
the baseline number of passive microseismic events per the predetermined unit,
and if the
baseline time is measured during a time period when the water injection is
less than the
rate of water injection during normal oil production.
[24] In certain embodiments, the baseline is a quiet period, either following
a ramped
up water injection period, or following water injection at rates associated
with normal oil
production in reservoirs in periods of secondary recovery. The quiet period
can be used
to establish a baseline which is important for controlling the monitoring
operations and
interpreting the seismic data during the monitoring period.
CA 02715725 2010-08-16
WO 2009/108394
PCT/US2009/001379
[25] The present invention relates to an improved method of, and system for
reservoir
monitoring, including identification of the fluid phase (oil or water) moving
along flow
pathways of hydrocarbon drainage and water movement in a reservoir. These flow
pathways are generally along fracture swarms or other zones of weakness in
reservoir
rock. Microseismic events are detected along these zones of mechanical
weakness as the
fluids move in the reservoir rocks. Fluids are injected into, or extracted
from, a
producing reservoir with anomalous flow anisotropy. Water or brine is injected
in the
pore volumetric space of reservoir rocks to enhance oil production from the
reservoir.
[26] The method of this invention is useful for flood-front mapping in a black
oil
reservoir system consisting predominantly of oil and water (brine). It is
assumed that no
free gas is present in the system. Reservoirs containing oil and water, with a
low gas-to-
oil ratio (GOR), are abundant in giant carbonate fields. Th ese carbonate
rocks are
extremely heterogeneous and many drilled wells have encountered anomalous
fluid flow
conduits, or pathways, along narrow fracture swarms. These features contribute
to a flow
anisotropy that cannot be determined from borehole data alone. Usually, the
well spacing
in such giant oil fields is sparse. Flood-front monitoring away from and
between wells is
imperative for optimum reservoir management and for increasing overall
recovery. In a
producing reservoir, mapping hydrocarbon fluid pathways and identifying
respective
liquid phase (oil or water) moving along such flow pathways, is crucial for
improving
and increasing oil recovery.
[27] Upon application of the system and method described in commonly assigned
PCT
Publication WO 2007/0562278 to monitor reservoir fluid movement and determine
the
locations of microseismic events, it was unexpectedly determined and
differention that
11
CA 02715725 2015-07-21
Our Ref.: 85805-14
identification of the type of liquid moving along a pathway can be made in
accordance with the
system and method of the present invention. This identification provides
information useful to
reservoir engineers in planning and deploying production and/or injection
operations.
[27a] In accordance with one aspect, the present invention relates to a method
of determining
whether an unknown fluid moving in an oil-bearing reservoir rock formation is
water or oil, the
oil-bearing reservoir rock formation having at least one production well and
at least one source of
injected water which is delivered at a predetermined rate during normal oil
production. The
method comprises identifying a preferential fluid pathway in the oil-bearing
reservoir rock
formation from which microseisms associated with oil movement and with water
movement are
sensed. The method also comprises establishing at least one baseline value of
passive
microseismic events per a predetermined unit of baseline time, wherein the at
least one baseline
value is one or more of (i) the number of microseismic event which occur in
the preferential fluid
pathway during a rate of injected water which is below the predetermined
value; (ii) the magnitude
of microseismic events which occur in the preferential fluid pathway during a
rate of injected
water which is below the predetermined value; (iii) the number of microseismic
event which occur
in the preferential fluid pathway during a rate of injected water which is
above the predetermined
value; and (iv) the magnitude of microseismic events which occur in the
preferential fluid pathway
during a rate of injected water which is above the predetermined value. The
method further
comprises monitoring passive microseismic events in the preferential fluid
pathway during normal
oil production via a plurality of sensors to sense a corresponding number or
magnitude of
microseismic events during a predetermined unit period of monitoring time. The
method also
comprises comparing the sensed number or magnitude of microseismic events
during
12
CA 02715725 2015-07-21
Our Ref.: 85805-14
the predetermined unit period of monitoring time to the baseline number or
magnitude of passive
microseismic events per the predetermined unit of baseline time. The method
also comprises
determining that fluid causing the microseismic events is water if the sensed
number of
microseismic events during the predetermined unit period of monitoring time
approaches the
baseline number of passive microseismic events per the predetermined unit, and
if the baseline
number of passive microseismic events per the predetermined unit baseline time
is measured
during a time period when the water injection is greater than the rate of
water injection during
normal oil production. The method further comprises determining that fluid
causing the
microseismic events is oil if the sensed number of microseismic events during
the predetermined
unit period of monitoring time approaches the baseline number of passive
microseismic events per
the predetermined unit, and if the baseline time is measured during a time
period when the water
injection is less than the rate of water injection during normal oil
production.
BRIEF DESCRIPTION OF THE DRAWINGS
[28] The invention will be described in further detail below and with
reference to the attached
drawings in which the same or similar elements are referred to by the same
number, and where:
[29] FIGs. 1A and 1B are schematic process flow diagrams for microseismic data
analysis to
determine the type of fluid moving along a flow pathway;
1301 FIG. 2 is a schematic illustration of another embodiment of a process
flow for
microseismic data analysis to determine the type of fluid moving along a flow
pathway;
1311 FIG. 3 is a schematic illustration of the network of sensors employed in
an embodiment of
the present invention;
12a
CA 02715725 2015-07-21
Our Ref.: 85805-14
[32] FIG. 4A is a schematic illustration of data from a surface sensor in
the field;
[33] FIG. 4B is a schematic illustration of data from a down-hole sensor in
the field;
[34] FIG. 4C is a graphic representation of data of reservoir
characteristics;
[35] FIG. 4D is a schematic illustration of data processing of the x-
components and y-
components of seismic data to plot two-dimensional hodograms of the seismic
data;
[36] FIG. 5 is a plot of injection rates over a period of time according to
a process of the present
invention;
12b
CA 02715725 2010-08-16
WO 2009/108394
PCT/US2009/001379
[37] FIGs. 6-9 illustrates a mapping of sensed hypocenters during various
phases of
the process plotted in FIG. 5;
[38] FIGs. 10A-10C schematically illustrate a reservoir map including pressure
isobars, hypocenters of passive microseismic events superimposed on the
reservoir map
including pressure isobars, and an extrapolated fluid pathway determined from
the pattern
of hypocenters, respectively; and
[39] FIG. 11 is a schematic illustration of the components of a data
processing
computer used in the present invention.
DETAILED DESCRIPTION OF THE INVENTION
[40] This invention is particularly useful in. a producing reservoir to
continuously
define the map of preferential fluid movement directions (pathways) and also
to identify
the type of fluid moving along these preferential pathways. The flow pathways
and the
fluid phase moving along these pathways between wells cannot be measured
easily using
conventional measurements in drilled wells. The method and system of the
present
invention provides the orientation and distribution of preferential fluid
pathways and
identifies the fluid phase, differentiating between oil or water moving along
the
pathways. The mapping of fluid pathways and the identification of the type of
fluid is
useful to optimize fluid injection and production operations and improving
overall oil
recovery. During
monitoring, the detected passive seismic emissions, in certain
embodiments recorded and analyzed in real time, can define fluid flow pathways
between
the wells in a producing field. The water flood-front movement is often more
complex,
non-uniform and unpredictable. Fluid flow simulation provides stochastic
models for the
13
CA 02715725 2010-08-16
WO 2009/108394
PCT/US2009/001379
flood-front using data only at well control points. When oil is produced by
water
injection, the hydraulic parameters inferred from fluid-induced microseismic
data can be
used as fluid monitoring information. This data is used for optimizing
reservoir
management and exploitation.
[41] The mobility of water through these reservoir conduits in an oil
reservoir is much
higher than oil. This is primarily because oil has higher viscosity than
water. In on oil-
bearing reservoir rock formation, the mobility ratio can be obtained with
proper special
core analysis, commonly known to those skilled in the art as "SCAL". For
instance, oil
originating from the Jurassic carbonate formations has a viscosity that is
about three (3)
times higher than that of water. In a reservoir that is at an intermediate
stage of water
flood recovery, the relative permeability of water and oil are approximately
equal. This
means that the mobility of water is about three (3) times that of oil in this
reservoir.
Therefore, the water is expected to travel faster than oil, especially in high
permeability
pathways such as fracture swarms.
[42] The fluid flow potential through porous rocks in oil reservoirs is
measured by
permeability. The characteristics of flow through porous media is generally
defined by
Darcy's equation:
K = k r , ph = A { AP
Q ph -
P ph A X
where Qph is the rate (volume/time) at which phase ph, e.g. oil, or water,
having viscosity
liph and relative permeability kr,ph flows across an area A within a reservoir
having rock
absolute-permeability K, when pressure drop AP is exerted on the phase ph over
a
14
CA 02715725 2010-08-16
WO 2009/108394
PCT/US2009/001379
distance AXi perpendicular to the area A. Darcy's equation equates the flow
rate Qph to
the pressure gradient AP/6X multiplied by the transmissibility (K. kr,p0A I
Ilph. The factor
(Kkr,ph) is the effective permeability of the reservoir rock relative to the
phase ph. The
factor (Kkr,ph) / pph is the mobility of the phase ph (oil or water) in the
reservoir rock.
The factor Kkr,ph is the effective-permeability of phase ph in the reservoir
rock, and may
be abbreviated as kph-
143] Fluids with lower viscosities have greater mobility through the higher
permeability areas in heterogeneous rocks. Trace patterns of microseismic
events along
these high permeability areas, such as through connected joints system or
along fracture
swarms, are more rapid. In general, the mobility of water, or hydraulic
conductivity, Mw
in unit length per unit time can be expressed as:
Mw = (Kkr,w) /114
where K is the absolute permeability of water in units of area, kõ, is the
relative
permeability of water (unitless), and 1.1,w is the viscosity of water in units
of
(force)(time)/(area) or in (pressure) (time). Similarly, the mobility of oil
is expressed as
Mo = Kkr,0 / Po
where K is the absolute permeability of oil, kro is the relative permeability
of oil and i.to is
the viscosity of oil.
1441 In a preferential flow pathway having high absolute permeability K, M, is
greater
than Mo. In other words, water moves much faster than oil in a high-
permeability
conduit, leading in many cases to premature water breakthrough in certain
production
wells. Fast water movement in preferential reservoir pathways, e.g. fracture
swarms,
CA 02715725 2010-08-16
WO 2009/108394
PCT/US2009/001379
conduits, and channels, will be associated with shear elastic failures, i.e.,
microseismic
events, that are detectable in a specific time period At of interest to
monitor the reservoir.
[45] When an oil reservoir is at a primary recovery stage, that is, oil is
flowing
naturally under reservoir pressure drive, there is no water injection and the
oil has higher
saturation and relative permeability than water. In contrast, when the oil
reservoir is at
secondary recovery stage, i.e., oil is pushed by injected water to induce flow
and
production, there is water injection in the reservoir to move the oil towards
oil producers,
i.e., wells, thereby water and oil have relatively equal saturations and
relative
permabilities. When, the reservoir is at tertiary recovery stage, where
injected water
cannot push or drive the remaining oil to the producers, water injection
continues from
injectors to producers with minimal, or null, oil production at the producing
wells,
thereby water has higher relative permeability than oil.
[46] Additionally, microseisms associated with water movement, Mw, will have
higher
magnitude than those associated with oil, M., moving in such reservoir
pathways. This
attribute can also be employed in an alternative embodiment described in
greater detail
below.
[47] Therefore, it the frequency of microseismic events, (N
\-- microseisms)W / At, associated
with injection water movement in a reservoir pathway, can be characterized.
Similarly, it
is possible to characterize the frequency of microseismic events, ("N
\-- -microseisms)0 / At,
associated with oil movement in a reservoir pathway.
[48] Accordingly, if Nw a (Nmicroseisms)õ / At and N.E---- (Nmicroseisms)o /
At, than:
Nw > N.
in reservoirs having higher water mobility than oil mobility. Thus,
microseismic events
16
CA 02715725 2010-08-16
WO 2009/108394
PCT/US2009/001379
associated with water movement along a reservoir pathway will be at a higher
frequency,
i.e., number of microseisms per time-period, as compared to microseisms
associated with
oil movements in the same reservoir pathway.
[49] These criteria are applied in diagnosing the fluid phase flowing along a
reservoir
pathway by using the frequency and relative magnitude of microseisms detected
along
the same reservoir pathway.
[50] FIGs. 1A and 1B schematically illustrate a process flow of a method of
identifying whether a liquid moving in a reservoir rock is water and/or oil.
During
steady-state activities in an oil-bearing reservoir rock formation, passive
microseismic
events are generally not attributable to movement of water or oil through
anisotropic fluid
pathways in the reservoir rock. In order to set a baseline for comparative
purposes to
effectively monitor a fluid pathway in a reservoir rock region, steps 30
through 40 are
carried out to determine and map the number of passive microseismic events
attributable
to water flow during a rate of water injection that is less than a water
injection rate during
steady-state oil production, and to determine and map the number of passive
microseismic events attributable to water flow during a rate of water
injection that is
greater than a water injection rate during normal periods of oil production.
The
microseismic event data transmitted from the sensors are received and recorded
in a
seismic server for processing and for storage, for example, in a data or disk
storage
device, or alternatively stored locally at each sensor and transmitted at a
predetermined
time to a seismic server for processing.
= [51] In particular, at step 30, when water injection 22 is reduced, or
ramped down 26,
data is inputted 30 related to sensed passive microseismic events in the oil-
bearing
17
CA 02715725 2010-08-16
WO 2009/108394
PCT/US2009/001379
reservoir rock region from sensors 20. The ratio No of the number of
microseismic
events during a predetermined unit period of time is identified 32, and these
events are
mapped 34 to illustrate a preferential flow pathway. When water injection 22
is
increased, ramped up 28, data is inputted 36 related to sensed passive
microseismic
events in the oil-bearing reservoir rock region from sensors 20. The ratio
1\1,,, of the
number of microseismic events during a predetermined unit period of time is
identified
38, and these events are mapped 40. One or both of these ratios Nw and No can
be used as
baseline values for comparison to the number of events per predetermined unit
of time
during continuous monitoring as further described below.
[52] During water injection 22, while normal oil production operation 24 is in
progress, data is inputted 42 from sensors 20 related to the sensed
microseismic events.
The ratio Nm of the number of microseismic events during a predetermined unit
period of
time is identified 44. The predetermined unit period of time can be on the
order of one or
more hours or one or more days, and may be the same or different for the
ratios Nm, Nw
and No. The ratio Nn, is compared 46 to the ratios Nw and No. During steady-
state
production and injection, no microseismic events attributable to the flow of
oil or water
in the fluid pathway should occur. However, during an anomalous event, for
instance,
while the injection rates are associated with normal production activities,
and the system
is no longer in steady-state, microseismic events will occur. If it is
determined 48 that the
ratio Nm is closer to the ratio No than to the ratio Nw, the microseismic
events can be
identified 50 as being attributable to oil movement along the preferential
flow pathway.
Conversely, if it is determined 52 that the ratio Nm is closer to the ratio Nw
than to the
18
CA 02715725 2010-08-16
WO 2009/108394
PCT/US2009/001379
ratio No, the microseismic events can be identified 54 as being attributable
to water
movement along the preferential flow pathway.
[53] In an alternative embodiment, and referring to steps 55, 56 and 58 and
the
connector block C shown in dashed lines in FIGs. 1A and 1B, and also referring
to FIG.
2, the relative magnitudes of the sensed microseismic events can be used to
provide
further confidence in the determinations of the identities of the fluid moving
along the
flow pathway. In particular, during ramped down 26 water injection 22, the
magnitude
level Ro is determined 55 and mapped 34. During ramped up 28 water injection
22, the
magnitude level Rõõ is determined 56 and mapped 40. During water injection 22
while
normal oil production operation 24 is in progress, the magnitude level Rm is
determined
58.
[54] The magnitude level Rm is compared 60 to the magnitude levels Rw and Ro.
If it
is determined 62 that the magnitude level Rm is closer to the magnitude level
Ro than to
the magnitude level R, the microseismic events can be identified 64 as being
attributable
to oil movement along the preferential flow pathway. Conversely, if it is
determined 66
that the magnitude level Ro, is closer to the magnitude level Rw than to the
magnitude
level Ro, the microseismic events can be identified 68 as being attributable
to water
movement along the preferential flow pathway. Note that these determinations
62, 66 are
be used to supplement the determinations 48, 52 made in the process flow as
shown in
FIGs. lA and 1B.
[55] The location of the microseismic events is preferably determined with a
plurality
of microseismic sensors located on the surface, within a borehole, or both on
the surface
and in a borehole. For instance, the system and method described in commonly
assigned
19
CA 02715725 2010-08-16
WO 2009/108394
PCT/US2009/001379
PCT Publication WO 2007/0562278 can be advantageously employed to monitor
reservoir fluid movement and determine the locations of microseismic events.
In
additional embodiments, methods for locating microseismic sources as disclosed
in US
Patents 6,049,508, 6,920,083, 7,127,353, and in the publications by Lee et al.
and
Raymer et al. can be used to determine the sources, provided that the methods
include the
determination of magnitudes and frequencies of microseismic events.
[56] In one preferred embodiment, the system of, and method for sensing
microseismic
events and mapping fluid conduits in hydrocarbon reservoirs, described in
commonly
assigned PCT Publication WO 2007/0562278, is used. As shown in FIG. 3, a
network 70
included a grid of equally spaced seismic sensors 72 permanently cemented and
deployed
spatially on the ground surface and additional sensors 74 cemented in one or
more
borehole or monitor wells 80, as described in commonly assigned PCT
Publication WO
2007/0562278, which is hereby incorporated by reference. In such a system,
passive
micro-earthquakes, or microseismic events 76, are continuously detected and
recorded
from the reservoir as fluids are produced and injected downhole at location
78, e.g., via
an injection well 82. These microseismic tremors 76 are from the result of
stress changes
induced by the injection pulses 88 in the reservoir and/or from oil production
activities.
[57] The system exploits the minute vibrations, or micro-earthquakes 76 that
are
generated in the reservoir layers due to shear slippage in rocks induced by
fluid
movement. These micro-earthquakes are recorded on the seismic sensors 72, 74,
or
geophones, that are deployed at the earth's surface and in boreholes in the
test area.
These microseisms 76 are detected as the fluids move in the reservoir. The
system
continuously detects and records the passive microseismic events 76 emanated
from the
CA 02715725 2010-08-16
WO 2009/108394
PCT/US2009/001379
reservoir as fluids are produced and injected 78. Accordingly, three-
dimensional
continuously and real-time reservoir monitoring is provided as the fluids are
produced
from and injected into the reservoir. The distributed network of permanent
surface
sensors 72 and permanent multi-level sensors 74 in a borehole are used to
acquire
synchronized GPS time-stamped microseismic data. Universal time or GMT is
obtained
from GPS satellite receivers that are connected to the recorder. The data is
collected at
each sensor and recorded in a central recording system. Each sensor in the
network is
surveyed for its location, e.g., in the Cartesian coordinate system as x,y,z
values, and in a
spherical coordinate system as r, 0, for
radial distance, zenith, and azimuth,
respectively. The sensors are precisely orientated in the same configuration
before
cementing in place. The orientation of the borehole sensors is determined
after the
installation is complete by generating a controlled seismic source at measured
azimuth
directions around the well. The detected first arrival from the known seismic
azimuth
source at each sensor is analyzed in order to precisely determine its
orientation.
[58] From the 3-component borehole sensors, estimates of microseismic source
or
hypocenter location are made by selecting the first arrival times of P-waves
and S-waves
events (or first breaks) from the recorded seismograms. Hodogram analysis, as
shown in
FIG. 4D, provides the polarization direction of the waves, and the velocity of
the
reservoir rock obtained from other measurements in the area are used for
tomographic
inversion of the picked travel times to obtain the range for the source point
of the
microseismic event, or the hypocenter.
[59] The high-density microseismic network employs triaxial or 3-component
geophones capable of measuring artifact-free response over a frequency range
of 10-
21
CA 02715725 2010-08-16
WO 2009/108394
PCT/US2009/001379
500Hz. The sensor elements are oriented mutually orthogonal to each other to
ensure the
detection of microseismic waves with particle motion in all orientations. The
sensors
detect microseismic source events that radiate from the rock-failure surface
and emanate
from within the reservoir.
[60] Microseismic analysis techniques, which are well known to those of
ordinary skill
in the art, are adapted to integrate the high-density measurements at the
surface with
those made in the borehole for the purpose of determining the microseismic
events
radiated from the source location. For each microseismic event, it is first
necessary to
determine the slip direction or source mechanism before analyzing for source
parameters.
[61] The network of sensors can be calibrated by stimulating the reservoir in
order to
induce microseismic events. In certain methods, calibration is achieved by
performing an
injector pulse test, in which water injected in nearby injection wells is
pulsed at
predefined intervals. Explosive charges can be detonated in a nearby well at
predefined
depth levels in the reservoir. The resulting shock waves are detected at the
surface and
borehole sensors as seismic events with a delay time corresponding to the
distance of the
sensor from the source location.
[62] Referring now to Figures 10A-10C, as injected water displaces reservoir
oil, the
zones of weakness in the reservoir rocks, such as joints and faults, are
perturbed and a
local microseismic event is generated in the reservoir volume. In certain
embodiments,
the reservoir volume is idealized as a plurality of grid blocks, e.g., cubes
of equal
dimensions, which represent the reservoir matrix. These grid blocks in such a
cellular
model can either have a shear slippage, with resulting microseismic activity,
or have no
activity. When contiguous grid blocks contain microseismic events emanated
from
22
CA 02715725 2010-08-16
WO 2009/108394
PCT/US2009/001379
within, they can be due to a system of fractures that have been temporarily or
permanently displaced by the fluid flow from water injection or oil
production. The
events in contiguous cells make up a trend that can be inferred as
interconnected flow
pathways. These
grid blocks with microseismic activities would therefore be
interconnected to hydraulic flow and would constitute fluid flow pathways
along these
preferential directions. Grid blocks having no microseismic activity are the
reservoir
zones with no preferential fluid flow directions or isotropic flow.
[63] By continuously interrogating all the cells in the reservoir volume for
recorded
microseismic activities in the sensors deployed in the borehole and those
spatially
deployed on the ground surface, an estimate of the flow anisotropy and high
permeability
pathways can be made empirically. The network of microseismic events form a
conductivity network that forms input to reservoir simulation for computing
fluid flow
through such network.
[64] The microseismic emissions from the reservoir are calibrated by
correlating with
induced activity in the reservoir. The rates of fluid injection and production
in the
reservoir are varied or 'pulsed' at the well locations and their effects on
detection and
recording of microseismicity in the monitoring well and the surface sensors
are
examined. The microseismicity detected above the ambient noise threshold due
to such
controlled pulsing of reservoir provides a correlation with the reservoir
pressure and flow
rate. The processed microseismic attributes also need to be correlated with
the spatial
distribution of surface sensors and vertical antenna in the monitoring well.
[65] The processing architecture for the microseismic system consists of
signal
processing of recorded seismograms from the surface and the bore-hole sensors
and
23
CA 02715725 2010-08-16
WO 2009/108394
PCT/US2009/001379
integrating the results of the total system. The surface data is summed over
time
windows, the recorded seismic energy in the data is migrated using a velocity
model in
the area of study and epicenter locations for the microseismic events and
their recorded
time of occurrence are corrected. These epicenters of microseismic events are
related to
the hypocenters of events derived from the processing of the microseismic
recording in
the borehole sensors. The time synchronous events for the hypocenters located
at various
reservoir depths for the two sensor systems (surface and well bore sensors)
are matched
for interpretation of shear slippage in the zones of weakness in reservoir
rocks. The
assumption is that this shear slippage is due to perturbation of the reservoir
fluids by
injection and production operations. The shear slippage is along existing
zones of
weakness in the reservoir rock matrix. The change in reservoir pressure from
variations
in injection and production rates produces stress gradient in the reservoir.
The reservoir
pressure is higher near the injectors and lower at the producers.
[66] FIGs. 4A and 4B show the compressional, or P-waves, and shear, or S-
waves,
from the source measured at the surface sensors and borehole sensors,
respectively. The
difference between the arrival times of P-and S-waves provide the distance
between the
source and receiver locations. The seismic wave velocity model, from source to
the
sensors, for P- and S-waves, are used for resolving the source locations using
a
tomographic technique.
[67] FIG. 4D shows hodograms of seismic waves, as the terminus of a moving
vector
for particle motion recorded in the three component sensors. The recorded data
are
analyzed for .the hodograms to compute the azimuth and dip for the seismic
waves
arriving at the sensors. Hodograms computed from the recorded passive
microseismic
24
CA 02715725 2014-09-29
data provide the azimuth and dip for the seismic waves arriving at the sensors
and are used to
calculate the microseismic event source point or hypocenter locations. The
direction of the
microseismic source to receiver is inferred from the P-wave particle motion
hodograms. The
spectral frequency of the signal is used for estimation of the radius of rock
failure and the
polarity hodogram and relative amplitudes of the seismic signal components
indicate the
orientation of the elastic deformation surface.
1681 FIG. 5 is a plot of water injection over time, and FIGs. 6-9
illustrate data over the
period of time corresponding to the plot of FIG. 5 in a process according to
the present
invention. FIGs. 10A-10C illustrate pressure isobars before water injection,
hypocenters of
passive microseismic events after ramped up water injection superimposed on
the reservoir
map including pressure isobars, and an extrapolated fluid pathway determined
from the
pattern of hypoc enters.
1691 Microseismic data was collected in a carbonate rock reservoir. This
data was plotted
as shown in FIGs. 6-9, where the shapes of larger size indicate larger
magnitude events, and
the shading from dark to light represent decreasing depth. The data plotted in
FIGs. 6-9 was
plotted using commercially available seismic analysis software. Examples of
suitable
software include Antelope (trademark) Environment Monitoring Software
commercially
available from Kinemetrics Inc. of Pasadena, California, USA; Atlas Data
Processing
Software commercially available from Nanometrics Seismological Instruments
Inc. of
Ontario, Canada; SonoDet commercially available from the Institute for
Geophysics,
University of Stuttgart of Stuttgart, Germany; and Seisan Earthquake analysis
software
commercially available from Norwegian Seismic Array (NORSAR).
CA 02715725 2010-08-16
WO 2009/108394
PCT/US2009/001379
[70] An investigation according to the method and system described herein was
conducted in a Jurassic carbonate rock reservoir using an installed
microseismic sensor
network 70, similar to that schematically illustrated in FIG. 3, that included
225 surface
sensors 72 and 33 total downhole sensors in monitoring wells 80 (9 in a
shallow well and
24 in a deeper well). Each surface sensor and downhole sensor included x, y
and z sensor
components to determine the location and direction of shear slippage defined
by the
microseismograms. The network encompassed an area of 3 kilometers by 3
kilometers.
The region included injection wells to the west and production wells to the
east as
oriented in the figures. The injection wells were located at the flanks of the
anticline
structure.
[71] Introduction of sea water through the injection wells was suspended for
24 days
from a normal injection rate of 20,000 barrels per day in order to establish a
seismically
quiet area, as illustrated in FIG. 5. During this time, the production wells
to the east of
the injectors were producing oil at normal rates. From passive seismic data
detected by
the network 70 of surface sensors 72 and borehole sensors 74, hypocenters were
computed while the injectors were shut-off, i.e., corresponding to a ramped
down period
in the process flow shown in FIGs. 1A and 1B. These hypocenters emanating from
the
reservoir depth are oriented in a southwest to northeast (SW-NE) direction, as
illustrated
in FIG. 6. The number of events in the fluid pathway, as described further
herein, was
negligible. The events in the SW-NE direction, shown over a 6-hour period, are
attributable to production activities in a region to the west of the area
shown in FIGs. 6-9,
which continued throughout the time period plotted in FIG. 5. These events
were caused
by the disturbance of the steady-state equilibrium due to the stoppage of
water injection.
26
CA 02715725 2010-08-16
WO 2009/108394
PCT/US2009/001379
Note that these events are not shown in FIGs. 7-9 due to normalization of the
display by
the seismic analysis software to reduce the effect of noise.
[72] Referring again to FIG. 5, water injection shut-off was followed by high
water
injection rates of 115,000 barrels per day for 14 hours through the injection
wells. FIG. 7
shows that the sensor network detected a large number of events, shown over a
period of
6 hours commencing immediately after the period of high water injection. These
events
were clustered along a specific pattern through the area in a northwest to
southeast (NW-
SE) direction. It is clear that the microseismic events during water injection
revealed a
distinctly different trend from the events during injection shut-off. Since
only the water
phase was flowing around the water injectors, this enabled correlation of this
abundant
number of NW-SE microseismic events to the flow of the water phase. These
events
occurred along a narrow NW-SE pathway through which the water phase was
flowing.
As injection pulsing continued and additional water was injected at a much
higher than
normal rate, the number of events in the hypocenter swarm increased in
intensity,
generally due to the cumulative increase in water in the preferential fluid
pathway. The
orientation direction of the hypocenters continued to be in a NW-SE trend, as
shown in
FIG. 8, which represents microseismic events over a 6 hour period after 15
days of water
injection at 40,000 barrels per day. This corridor appears to be located in a
zone of a high
permeability pathway along which injected water preferentially advanced
through the
reservoir.
[73] FIG. 9 shows events computed from seismograms recorded after 20 days of
injection at the ambient injection and production rates. Note that there are
only a few
27
CA 02715725 2010-08-16
WO 2009/108394
PCT/US2009/001379
events, and the orientation is inconsistent. Closer to the injection wells
they are
somewhat oriented in a NW-SE trend that is consistent with the surge
injection.
1741 The relative magnitudes of these NE-SW events during the stoppage of
water
injection are small compared to those detected during surge injection. The
steady state
equilibrium is slightly disturbed by stopping injection. With a surge in
injection rate in
the reservoir the equilibrium condition is substantially altered. This results
in a much
larger density of NW-SE trending microseismic events. This is attributable to
the larger
mobility of the water phase relative to the oil phase in the reservoir. A
narrow pathway
along which water flow finds the least resistance is populated by swarms of
microseismic
events. This heterogeneity in the reservoir rock matrix and a zone of weakness
along this
NW-SE trend is responsible for the preferential pathway for injected water. In
a reservoir
producing oil it is important to be able to define the pathways for water
advancement and
to predict the "water break-through" in a producing well. Using the method and
system
of the present invention, this water pathways in the reservoir can be
predicted. The oil in
the reservoir is essentially continuous and will continue to produce from
wellbore until
water arrives. Water has a higher mobility in the reservoir and is thus easier
to produce.
Oil does not mix with water so it will not flow in the well once water hits.
175] FIG. 10A shows pressure isobars and direction of the pressure
transmission over
time, represented by arrows on the reservoir map. FIG. 10B shows the
hypocenters of
passive microseismic events superimposed on the reservoir map of FIG. 10A. The
reservoir pressure contours are compared to the distribution of hypocenters.
The left side
shows higher pressures close to the injectors as expected. The arrows indicate
the
28
CA 02715725 2010-08-16
WO 2009/108394
PCT/US2009/001379
pressure front advancing over time. Clearly, the hypocenters appear to be
parallel to the
pressure trend.
[76] The trend of microseismic events shown in FIG. 10C during injection
pulsing
follows the same direction as the pressure transmission in the reservoir. The
events are
along a narrow corridor through which movement of the pressure front is more
rapid.
The reservoir flood-front advances through this weak zone of reservoir rock
possibly due
to fluid conductive fractures.
[77] The results described with respect to FIGs. 5-10C confirm that the method
and
system of the invention enables identification of the fluid phase (water or
oil) flowing
along a reservoir pathway. By passively recording microseismicity, determining
and
mapping a number of microseismic events in a first time period where the water
injection
rate is below that of normal steady-state oil production, and determining and
mapping the
number of microseismic events in a second time period during which the water
injection
rate is above that of normal steady-state oil production, a preferential fluid
pathway can
be identified and a baseline number of events per unit time can be ascertained
for that
fluid pathway. Thereafter, by continuously or periodically monitoring the
previously
identified fluid pathway(s), activity associated with water flow can be
identified when the
number of events over a time period approaches the baseline number of events
per unit
time..
[78] In an alternative embodiment, several ramp-up water injection pulses can
be
performed to set the baseline for use during monitoring. For instance, a
cyclic water
injection operation can include injection of water at a high rate followed by
a shut in
period, and repeating these steps for a desired number of cycles. The number
of
29
CA 02715725 2010-08-16
WO 2009/108394
PCT/US2009/001379
microseismic events may determined and used as a baseline value, for instance,
to
compare to monitored microseismic events and to ascertain that the liquid
moving along
an identified preferential pathway is water if the number of monitored events
approaches
the number of baseline events.
[79] The microseismic data is gathered for processing by a computer 122 as
shown, for
example, in FIG. 11, which can implement a seismic server. A communication
interface
124 connects to the sensors, and the microseismic data is acquired by a
processor 126 for
storage in a memory 128. The processor 126 and memory 128 can be implemented
by
any known computing system, such as a microprocessor-based server or personal
computer. A data analysis program 130 is provided in the memory 128 and
executed by
the processor 126 for performing the operations, steps, and features of the
process flow
described in FIGs. 1A and 1B, or alternatively as shown in FIGs. 1A, 1B and 2.
For
example, the processor 126 can include, as hardware and/or software,
tomographic
analysis means 132 known in the art for generating tomograms corresponding to
the
acquired microseismic data, and performing the comparisons of the monitored
events to
the baseline events. The computer 122 can include or be connected to a GPS
system 134,
which can incorporate or be connected to a GPS system associated with the
sensors, for
managing the received microseismic data according to their time of
acquisition.
[80] The computer 122 can include and/or be connected to an output device 136
which
can include a display 138 and/or a printer 140 or other known output devices,
such as
plotters. Once the system 10 has processed the microseismic data using the
data analysis
program 130 and/or the tomographic analysis means 132, with such microseismic
data
having been received at the processor 126 via the communications interface
124, the
CA 02715725 2010-08-16
WO 2009/108394
PCT/US2009/001379
processor 126 can generate and output a graphical mapping of the detected
hypocenters
98 and determined flow pathways 102, as shown in FIGs. 6-9 and 10A-10C. The
outputted mappings can be displayed to the user on the display 138 and/or can
be printed
on a printer 140 or plotted using a plotting device. Using the computer 122 to
implement
the system and method of the present invention, estimates of microseismic
source or
hypocenter locations can be made by picking the first arrival times of P-wave
and S-wave
events, or first breaks, from the recorded seismograms. Hodogram analysis,
such as
shown in FIG. 4D, provides the polarization direction of the P-waves and S-
waves, and
the velocity characteristics of the rocks obtained from other measurements in
the area are
used for tomographic inversion of the picked travel times to obtain the range
for the
source point of the respective microseismic event or the hypocenter.
[81] While the methods and systems of the present invention are described with
respect to land-based sensors and sensor networks, it will be appreciated by
one of
ordinary skill in the art that, with appropriate adaptations, the method of
and system for
determining the type of liquid moving along a flow pathway can be practiced in
underwater oil-bearing reservoirs.
[82] The present invention advantageously provides a method of and system for
continuously detecting these passive microseismic events or micro-earthquakes
for
monitoring fluid pathways in a hydrocarbon reservoir. Anisotropic fluid flow
or uneven
directional flow rate is commonly associated with reservoir production and
injection
operations. As fluids are produced from, and injected into the reservoir,
microseismic
events are generated due to the flow anisotropy. Therefore, in accordance with
the
present invention, fluid flow anisotropy, or pathways, can be mapped, and the
reservoir
31
CA 02715725 2010-08-16
WO 2009/108394
PCT/US2009/001379
phase (oil or water) of fluids moving along such pathways in a reservoir
volume can be
identified, between and away from wells. Mapping of microseismic hypocenters
within
time windows provides the frequency of occurrence of microseismic emissions,
i.e., the
number of microseismic hypocenters per unit time. The difference in the
frequency of
occurrence is used for discriminating oil transport from water transport
through the
reservoir flow pathways. The result enhances reservoir model accuracy,
reservoir
management, and improved oil recovery.
1831 The method of, and system for identifying the type of reservoir fluid
moving
along flow pathways using passive seismic emissions advantageously allows
operators of
a producing field to optimize reservoir management and improve overall oil
recovery. In
particular, reservoir engineers can plan appropriate development of production
and/or
injection wells. For instance, when it is determined by the method and system
of the
present invention that the type of fluid moving at a certain location along a
pathway is
water, placement of production and injection wells at that location can be
avoided. If
existing wells have already been drilled in those regions, attempts at
production and/or
injection operations can be suppressed. Further, when it is determined that
the type of
fluid moving at a certain location along a pathway is oil, reservoir engineers
can plan
development of production wells in the region of that pathway, or if existing
production
wells have already been drilled in those regions, extraction operations can be
maintained
or resumed. In addition, reservoir engineers can plan the locations of
injection wells,
generally avoiding areas where either type of fluid pathways exist.
Advantageously, the
information derived using the system and method of the present invention
provides
substantial economic benefit, in terms of the efficiency of extraction.
Furthermore, by
32
CA 02715725 2010-08-16
WO 2009/108394
PCT/US2009/001379
avoidance of drilling or reopening production wells in regions where the
preferential fluid
pathway contains water, the cost of removing water is obviated. Furthermore,
in the case
of saline water, suppression of extraction provides the additional benefit of
reducing the
exposure of equipment and pipelines to the corrosive effects of saltwater.
[84] The method and system of the present invention have been described above
and in
the attached drawings; however, modifications will be apparent to those of
ordinary skill
in the art and the scope of protection for the invention is to be defined by
the claims that
follow.
33