Note: Descriptions are shown in the official language in which they were submitted.
CA 02732291 2011-01-27
WO 2009/137237 PCT/US2009/040505
METHOD FOR DETERMINING ADEQUACY OF SEISMIC DATA
COVERAGE OF A SUBSURFACE AREA BEING SURVEYED AND ITS
APPLICATION TO SELECTING SENSOR ARRAY GEOMETRY
Background of the Invention
Field of the Invention
[0001] The invention relates generally to the field of seismic surveying
of the Earth's
subsurface. More specifically, the invention relates to methods for
determining whether
seismic data have been acquired to sufficient spatial density to avoid
distortions in
generating images of the Earth's subsurface from seismic data.
Background Art
[0002] In seismic surveying, seismic energy sources are used to generate a
seismic signal
that propagates into the earth and is at least partially reflected by
subsurface seismic
reflectors. Such seismic reflectors typically are located at the interfaces
between
subterranean formations having different acoustic properties, specifically
differences in
acoustic impedance at the interfaces. The reflections are detected by seismic
receivers at
or near the surface of the earth, in an overlying body of water, or at known
depths in
boreholes. The resulting seismic data may be processed to yield information
relating to
the geologic structure and properties of the subterranean formations and their
potential
hydrocarbon content.
[0003] A purpose for various types of seismic data processing is to
extract from the data
as much information as possible regarding the subterranean formations. In
order for the
processed seismic data to accurately represent geologic subsurface properties,
the
reflection amplitudes need to be represented accurately. Non-geologic effects
can cause
the measured seismic amplitudes to deviate from the amplitude caused by the
reflection
from the geologic target. Amplitude distortions resulting from irregular
distribution of
source and receiver positions during data acquisition is a particularly
troublesome non-
1
CA 02732291 2011-01-27
WO 2009/137237 PCT/US2009/040505
geologic effect. If uncorrected, these non-geologic effects can distort the
seismic image
and obscure the geologic picture.
[0004] A seismic energy source generates an acoustic wave that reflects
from or
"illuminates" a portion of reflectors at different depths in the subsurface.
In a three-
dimensional (3D) survey, seismic signals are generated at a large number of
source
locations, detected at a large number of receiver locations and the survey
generally
illuminates large areas of the reflectors. U.S. Patent No. 7,336,560 issued to
Rekdal et al.
describes certain data density issues concerning marine seismic data.
According to the
Rekdal et al. '560 patent, processing techniques known in the art including
prestack 3D
migration algorithms can produce good images of the sub-surface horizons only
if the
surface distribution of sources and receivers is relatively uniform. In
practice, there are
typically irregularities in the distribution of sources and receivers.
Obtaining perfectly
regular acquisition geometry is typically impracticable. Consequently,
according to the
Rekdal et al. '560 patent, prestack 3D migrated seismic images often include
non-
geologic artifacts. Such artifacts can interfere with the interpretation of
the seismic
image and attribute maps.
[0005] In marine seismic surveying, one or more sensor cables called
streamers is towed
by a survey vessel near the surface of a body of water. A seismic energy
source such as
an air gun or air gun array is actuated at selected times. It is well known in
the art that in
marine seismic surveys, the streamers generally do not form straight lines
behind the
survey vessel. Typically marine currents and other factors such as propeller
wash from
the survey vessel cause the streamers to be displaced laterally, a phenomenon
called
"feathering." Changes in marine currents often cause changes in the
feathering. In such
circumstances, if the planned sail line (direction of motion) separation of
the seismic
vessel is maintained, then feathering will lead to coverage "holes" at some
offsets or
offset ranges. The term "coverage hole" as used in the Rekdal et al. '560
patent refers to
a surface area where, for a given offset (source to sensor distance) or offset
range, there
are believed to be inadequately spatially sampled data recorded. Data are
typically
defined to be "located" at the surface midpoint positions between the seismic
source
position and the seismic sensor position at the time of acquisition of a
seismic signal
2
CA 02732291 2011-01-27
WO 2009/137237 PCT/US2009/040505
recording. Such coverage holes can vary in size, irregularity, and density of
data
remaining in the hole. It is possible to have holes where no data are present.
Coverage
holes may be of several kilometers extension in the sail line (inline)
direction where
streamers have feathered in the same direction for a long continuous length of
the
intended sail line, but are generally smaller in the crossline direction
(orthogonal to the
sail line), as this width is governed by the amount of feathering of the
streamers.
[0006] In marine seismic streamer surveys, if data density criteria known
in the art are
used, portions of the subsurface may be believed to be inadequately covered
with seismic
data recordings due to streamer feathering and other causes. Thus, using such
prior art
seismic data density evaluation criteria, it may be believed that additional
passes of the
seismic vessel and steramers through the prospect survey area are required.
Additional
"sail-lines" (passes of the vessel and streamers through the survey area) were
also
thought to be needed by reason of steering the vessel to achieve acceptable
coverage.
That means that the lateral distance between streamer positions in all the
passes made by
the vessel can be on average less than in the original acquisition plan. These
additional
passes significantly increase the time and associated cost to complete a
survey. These
additional passes of the survey vessel are referred to as "infill shooting" or
just "infill."
A large portion of marine seismic data acquisition in a particular survey area
can be infill
shooting because of perceived inadequacy of data density. The infill shooting
may take
up to several weeks or even months to complete. Thus, it is not uncommon to
spend 15-
30% of total acquisition costs on infill acquisition.
[0007] According to the Rekdal et al. '560 patent, the maximum data hole
sizes that will
provide acceptable subsurface coverage are typically determined prior to
acquisition, and
are typically independent of local factors such as geology and survey
objectives. Criteria
for a seismic survey, such as acceptable subsurface coverage, are commonly
called "infill
specifications." An object of the method described in the Rekdal et al. '560
patent is to
determine whether the coverage holes are of sufficient size so as to require
infill
acquisition.
3
CA 02732291 2011-01-27
WO 2009/137237 PCT/US2009/040505
[0008] The method disclosed in the Rekdal et al. '560 patent, as one
example, makes use
of certain assumptions about the required degree of data coverage based in
part on
substantially discontinued seismic data processing procedures. Such
procedures, for
example, consisted of "binning" the acquired seismic data, summing or
"stacking"
seismic data within each bin, and then "migrating" the data after stacking.
The
requirements for migration in such processing are that each of the stacked
traces
reasonably represents the same sum of a set of offset traces at each location.
In order for
the stacked trace to have similar properties at each location associated with
a bin, it is
important that the stacked trace be the sum of a set of similar "offset"
(distance between
the seismic source and receiver) traces.
[0009] To ensure such similarity, traces are summed over a small area (a
"bin") such that
a contribution from each of the expected offset traces is present in the sum.
There are
several problems with such procedure. First, the traces are summed over an
area. Even if
normal moveout ("NMO") has been correctly performed, in the presence of
reflective
horizon "dip" (change in depth with respect to position), the reflective event
times will
not be aligned. This is often referred to as "bin smear", and results in the
loss of high
frequency data content for dipping reflective events. Second, if a trace at a
particular
offset is missing, then either new data should be acquired (infill data), or
the bin can be
expanded (overlapped into adjacent areas) to see whether a suitable trace is
available.
Such bin "flexing" obviously increases the "bin smear", but if only a small
number of
traces are used, this may not be a large problem. If an acceptable trace is
found, then it is
copied into the required bin and may therefore now contribute to more than one
stacked
trace.
[0010] Some bins may contain more than one trace of the required offset.
In order to
keep the stack trace balance similar at all bin locations, extra traces in any
such bin are
not used. There are several criteria for which trace of a plurality of traces
in a bin should
be used, but most commonly the trace that is selected is the one having a
position closest
to the position of the bin center, as this potentially reduces the bin smear.
However, such
procedure means that some of the traces that have been acquired may be
discarded from
further processing.
4
CA 02732291 2011-01-27
WO 2009/137237 PCT/US2009/040505
[0011] It is currently common in seismic data acquisition, as explained
above with
reference to the Rekdal et al. '560 patent, to make decisions on whether
infill data should
be acquired based on an evaluation of what traces fall in each bin of the
survey. A
procedure known as "flex binning" may be performed (typically in real time
during
acquisition) to infill "holes" where some offsets are missing from certain
bins. However,
it is uncommon to "flex" more than a small distance either side of the nominal
bin
location because of the bin smear that would be associated with collecting
traces from
further away, and such "flexing" is usually based on a rectangular bin
criteria.
[0012] It is known in the art to perform migration on seismic data prior
to stacking. See,
for example, U.S. Patent No. 6,826,484 issued to Martinez et al. In a prestack
migration
sequence, each trace to be processed is migrated using its actual location
(not the average
of a stack set, or a theoretical bin center). Trace locations may be output
from the
migration stage at any selected location, and such locations are generally
positioned on a
grid which is associated with bin centers. The output traces can then be
stacked. Despite
the change in processing methodology from post stack migration, the traces
selected for
processing and the methods of infill selection used in the industry have
remained
essentially the same.
[0013] The assumptions concerning data coverage as explained above have
cause the
development of marine seismic survey techniques in which is it desirable to
maintain the
geometry of the streamers as closely as possible in a straight line, parallel
pattern behind
the survey or towing vessel. There are devices known in the art for steering
seismic
streamers, and methods for using such devices have been developed that have as
an
objective the arrangement of streamers in such straight, parallel patterns
despite factors
such as propeller wash from the survey vessel and cross currents in the water
(transverse
to the direction of motion of the survey vessel). See, for example, U.S.
Patents Nos.
6,932,017, 7,080,607 and 7,162,967 issued to Hillesund et al. with reference
to streamer
steering methods and systems. An example streamer steering device is described
in U.S.
Patent No. 6,144,342 issued to Bertheas et al.
CA 02732291 2011-01-27
WO 2009/137237 PCT/US2009/040505
[0014] There continues to be a need for marine seismic acquisition
techniques that reduce
the amount of infill coverage and increase overall survey efficiency.
Summary of the Invention
[0015] A method for marine seismic surveying according to one aspect of
the invention
includes towing a plurality of seismic sensors in a body of water. The sensors
are
disposed in a plurality of laterally spaced apart streamers. A seismic energy
source in the
body of water is actuated at selected times, and seismic signals are detected
at the sensors
resulting from the actuation of the seismic energy source. A data trace is
created for each
of the detected signals. At least one Fresnel zone is determined for at least
some of the
seismic data traces. A contribution of each of the traces to each one of a
plurality of
output location bins defined in a predetermined pattern is computed, based on
the Fresnel
zone associated with each trace. Based on the computed contributions, a
maximum
lateral distance between corresponding seismic sensors is determined that will
result in a
contribution sum above a selected threshold in each bin.
[0016] In one example, the maximum distance is used to operate streamer
steering
devices so that the distance is maintained along each streamer.
[0017] Other aspects and advantages of the invention will be apparent from
the following
description and the appended claims.
Brief Description of the Drawings
[0018] FIG. 1 shows a plan view of an example of acquisition of marine
seismic data.
[0019] FIG. lA shows a set of Fresnel zones which may be computed for
different traces
in the configuration shown in FIG. 1.
[0020] FIG. 1B shows how the streamers may be positioned so as to better
accommodate
the Fresnel zones shown in FIG. lA
[0021] FIG. 2 shows a vertical section corresponding to the plan view of
FIG. 1.
6
CA 02732291 2011-01-27
WO 2009/137237 PCT/US2009/040505
[0022] FIG. 3 shows examples of trace impulse response for migration for
various flat
reflectors in the subsurface.
[0023] FIG. 4A shows an explanation of determining the size of a Fresnel
zone where a
seismic source and a seismic receiver are collocated.
[0024] FIG. 4B shows an explanation of determining a Fresnel zone where
the source
and receiver are offset from each other/
[0025] FIGS. 5A through 5E illustrate binning seismic data by individual
traces, with an
overlay of a Fresnel zone (FIG. 5A and 5C) for comparison.
[0026] FIGS. 6A and 6B illustrate binning seismic data by contribution of
multiple traces
each having a determinable Fresnel zone.
[0027] FIG. 7 shows an illustration of calculation of Fresnel zones
Detailed Description
[0028] FIG. 1 shows a typical marine seismic survey system that can be
used with
various aspect of the present invention. The seismic survey system can include
a survey
vessel 10 that moves along the surface of a body of water 11 such as a lake or
the ocean.
The survey vessel 10 may include thereon electronic equipment, shown generally
at 12
and for convenience collectively referred to as a "recording system." The
recording
system 12 typically includes devices such as a data recording unit (not shown
separately)
for making a record with respect to time of signals generated by various
sensors in the
acquisition system. The recording system 12 also typically includes navigation
equipment (not shown separately) to determine and record, at selected times,
the geodetic
position of the vessel 10, and using other devices to be explained below, each
of a
plurality of seismic sensors 22 disposed at spaced apart locations on
streamers 20 towed
by the survey vessel 10.
[0029] A device for determining the geodetic position of the survey vessel
10 such as a
global positioning satellite ("GPS") receiver, shown schematically at 12A, may
be
disposed on the survey vessel 10. Other geodetic position determination
devices are
7
CA 02732291 2011-01-27
WO 2009/137237 PCT/US2009/040505
known in the art. The foregoing elements of the recording system 12 are
familiar to those
skilled in the art, and with the exception of the geodetic position detecting
receiver 12A,
are not shown separately in the figures herein for clarity of the
illustration.
[0030] The seismic sensors 22 can be any type of seismic sensor known in
the art. Non-
limiting examples of such sensors may include particle motion-responsive
seismic
sensors such as geophones and accelerometers, pressure-responsive seismic
sensors and
pressure time gradient-responsive seismic sensors, or combinations of the
foregoing. The
seismic sensors 22 may measure, for example, seismic energy primarily
reflected from or
refracted by various structures in the Earth's subsurface below the bottom of
the water 11
in response to energy imparted into the subsurface by a seismic energy source
17 or an
array of such sources, deployed in the water 11 and towed by the survey vessel
10 or by
another vessel. The recording system 12 may also include energy source control
equipment (not shown separately) for selectively operating the seismic energy
source 17.
[0031] In the survey system shown in FIG. 1, there are four streamers 20
towed by the
survey vessel 10. The number of sensor streamers shown in FIG. 1, however, is
only for
purposes of explaining the invention and is not a limitation on the number of
streamers
that may be used in any particular seismic survey system according to the
invention. In
marine geophysical acquisition systems such as shown in FIG. 1 that include a
plurality
of laterally spaced apart streamers, the streamers 20 are typically coupled to
towing
equipment that secures the forward end of each of the streamers 20 at a
selected lateral
position with respect to adjacent streamers and with respect to the seismic
vessel 10. As
shown in FIG. 1, such towing equipment can include two paravane tow ropes 8
each
coupled to the vessel 10 at one end through a winch 19 or similar spooling
device that
enables changing the deployed length of each paravane tow rope 8. The distal
end of
each paravane tow rope 8 is functionally coupled to a paravane 14. The
paravanes 14 are
each shaped to provide a lateral component of motion to the various towing
components
deployed in the water 11 when the paravanes 14 are moved through the water 11.
"Lateral" in the present context means transverse to the direction of motion
of the survey
vessel 10 in the water 11. The lateral motion component of each paravane 14 is
opposed
to that of the other paravane 14. The combined lateral motion component of the
8
CA 02732291 2011-01-27
WO 2009/137237 PCT/US2009/040505
paravanes 14 separates the paravanes 14 from each other until they put into
tension one
or more spreader ropes or cables 24, functionally coupled end to end between
the
paravanes 14.
[0032] The sensor streamers 20 can each be coupled, at the axial end
thereof nearest the
vessel 10 (the "forward end"), to a respective lead-in cable termination 20A.
The lead-in
cable terminations 20A can be coupled to or associated with the spreader ropes
or cables
24 so as to fix the lateral positions of the streamers 20 with respect to each
other and with
respect to the centerline of the vessel 10. Electrical and/or optical
connection between
the appropriate components in the recording system 12 and, ultimately, the
geophysical
sensors 22 (and/or other circuitry) in the ones of the streamers 20 inward of
the lateral
edges of the system may be made using inner lead-in cables 18, each of which
terminates
in a respective lead-in cable termination 20A. A lead-in termination 20A is
disposed at
the forward end of each streamer 20. Corresponding electrical and/or optical
connection
between the appropriate components of the recording unit 12 and the sensors 22
in the
laterally outermost streamers 20 may be made through respective lead-in
terminations
20A, using outermost lead-in cables 16. Each of the inner lead-in cables 18
and
outermost lead-in cables 16 may be deployed by a respective winch 19 or
similar
spooling device such that the deployed length of each cable 16, 18 can be
changed. The
type of towing equipment coupled to the forward end of each streamer shown in
FIG. 1 is
only intended to illustrate a type of equipment that can tow an array of
laterally spaced
apart streamers in the water 11. Other towing structures may be used in other
examples
of geophysical acquisition system according to the invention.
[0033] The acquisition system shown in FIG. 1 can also include a plurality
of lateral
force and depth ("LFD") control devices 26 cooperatively engaged with each of
the
streamers 20 at selected positions along each streamer 20. Each LFD control
device 26
can include one or more rotatable control surfaces (not shown separately) that
when
moved to a selected rotary orientation with respect to the direction of
movement of such
surfaces through the water 11 creates a hydrodynamic lift in a selected
direction to urge
the streamer 20 in any selected direction upward or downward in the water 11
or laterally
along the water surface with respect to the direction of motion of the vessel
10. Thus,
9
CA 02732291 2011-01-27
WO 2009/137237 PCT/US2009/040505
such LFD control devices 26 can be used to maintain the streamers in a
selected
geometric arrangement. A non-limiting example of the LFD devices is described
in U.S.
Patent No. 6,144,342 issued to Bertheas et al. The particular configuration of
the LFD
devices 26, however, is not a limit on the scope of the present invention. As
previously
explained, for purposes of the present invention it is only necessary for any
devices used
as are the LFD devices 26 to be able to apply a selectable lateral force to
the associated
streamers 20 to put the streamers in a selected geometry behind the survey
vessel 10.
Depth control of the streamers 20 may be provided passively, such as by
providing the
streamers 20 with a selected overall specific gravity, or by separate depth
control devices
(not shown). Therefore, any reference to "depth" control as provided by the
LFD devices
26 is only intended to cover the present example implementation, such as using
the
device shown in the Bertheas et al. patent referred to above.
[0034] In the present example, each LFD device 26 may include an
associated relative
position determination device. In one example, the relative position
determination device
may be an acoustic range sensing device ("ARD") 26A. Such ARDs typically
include an
ultrasonic transceiver or transmitter and electronic circuitry configured to
cause the
transceiver to emit pulses of acoustic energy. Travel time of the acoustic
energy between
a transmitter and a receiver disposed at a spaced apart position such as along
the same
streamer and/or on a different streamer, is related to the distance between
the transmitter
and a receiver, and the acoustic velocity of the water. The acoustic velocity
can be
assumed substantially not to change during a survey, or it can be measured by
a device
such as a water velocity test cell. Alternatively or additionally, acoustic
range sensing
devices ("ARDs") may be disposed at selected positions along each one of the
streamers
not collocated with the LFD devices 26. Such additional ARDs are shown at 23
in FIG.
1. Each of the ARDs 26A, 23 may be in signal communication with the recording
system
12 such that at any moment in time the distance between any two ARDs 26A, 23
on any
of the streamers 20 is determinable. One or more ARDs may be placed at
selected
positions proximate the aft end of the vessel 10 so that relative distances
between the
selected positions on the vessel 10 and any of the ARDs on the streamers may
also be
determined. A non-limiting example of an ARD and system used with such ARDs is
CA 02732291 2013-03-26
described in U.S. Patent No. 7,376,045 issued to Falkenberg et al. Other
devices for
determining relative positions of the streamers are described in .U.S. Patents
Nos.
6,932,017, 7,080,607 and 7,162,967 issued to Hiilesund et al.
[0035] The
streamers 20 may additionally or alternatively include a plurality of heading
sensors 29 disposed at spaced apart positions along each streamer 20. The
heading sensors
29 may be geomagnetic direction sensors such as magnetic compass devices
affixed to the
exterior of the streamer 20. One type of compass device is described in U.S.
Patent No.
4,481,611 issued to Burrage. The heading sensors 29 provide a signal
indicative of the
geomagnetic heading (direction with respect to magnetic north) of the streamer
20 at the
axial position of the heading sensor 29 along the respective streamer 20.
Measurements of
such heading at spaced apart locations along each streamer may be used to
interpolate the
geometry (spatial distribution) of each streamer 20.
[0036] Each
streamer 20 may include at the distal end thereof a tail buoy 25. The tail
buoy 25 may include, among other sensing devices, a geodetic position signal
receiver (not
shown separately) such as a GPS receiver that can determine the geodetic
position of each
tail buoy 25. The geodetic position receiver (not shown) in each tail buoy 25
may be in
signal communication with the recording system 12.
[0037] By
determining the distance between ARDs 26A, 23, including the one or more
ARDs on the vessel 10, and/or by interpolating the spatial distribution of the
streamers
from the heading sensor 29 measurements, an estimate of the geometry of each
streamer 20
may be made. Collectively, the geometry of the streamers 20 may be referred to
as the
"array geometry." For purposes of defining the scope of the present invention,
the various
position measurement components described above, including those from the
heading
sensors 29, from the ARDs 26A, 23, and, if used, from the additional geodetic
position
receivers 25A in the tail buoys 25, may be used individually or in any
combination. It is
only necessary for purposes of the present invention to be able to reasonably
estimate the
relative position of each point along each streamer 20 with reference to the
survey vessel
10. By appropriate selection of the positions along each
11
CA 02732291 2011-01-27
WO 2009/137237 PCT/US2009/040505
streamer at which the various relative position measurement devices described
above are
disposed, it is possible to determine the array geometry without the need to
measure,
estimate or otherwise determine the absolute geodetic position at large
numbers of
positions along each streamer, such as by using a large number of GPS
receivers.
[0038] The example of seismic data acquisition shown in FIG. 1 is shown
partially in
cross section in FIG. 2 to illustrate the basis of a geometric definition used
in the
description of the present the invention. When the seismic energy source 24
(only one
shown in FIG. 2) is actuated, seismic energy propagates outwardly from the
source 24,
some of which moves downwardly through the subsurface to acoustic impedance
boundaries 26, 28 located in rock formations below the water bottom. Such
energy is
shown generally by ray paths at 30. When seismic energy is reflected from the
boundaries 26, 28, it travels upwardly until it is detected by the sensors 22.
Such
upwardly traveling energy is shown generally along ray paths 30A. At each
position at
which the source 24 is actuated, and for each corresponding seismic sensor
position, there
is a position in the subsurface, these positions shown generally at 32, which
may be
considered a reflection point. Each reflection point 32 will typically be
located at one
half the distance (offset) between the source 24 and the particular seismic
sensor 22 at the
time of source actuation and recording of the detected signals. Thus, a set of
reflection
points may be defined based on the positions of the source 24 and the sensors
22 for each
actuation of the source 24. The cross section shown in FIG. 2 includes only
one streamer
and one seismic energy source for clarity of the illustration, however the
principle is
applicable to any number of seismic energy sources and seismic sensors.
[0039] A result of the acquisition arrangement shown in FIG. 2 is that for
each actuation
of the seismic energy source, a plurality of seismic signal recordings is
generated. Each
such signal recording may include reflective events that correspond to the
series of
acoustic impedance boundaries at the midpoint between the position of the
seismic source
and the position of the sensor at the time of actuation of the seismic source.
Thus, for a
single actuation of the source, a plurality of signal recordings is generated,
with each
recording corresponding to boundaries at the midpoint between the source and
the sensor.
As will be appreciated by those skilled in the art, as the vessel moves along
the water and
12
CA 02732291 2011-01-27
WO 2009/137237 PCT/US2009/040505
the source is repeatedly actuated, successive signal recordings will be made
that
correspond to essentially the same midpoint as in prior recordings, the
difference between
successive recordings being the distance ("offset") between the seismic source
and the
sensor. In a typically seismic survey, therefore, a plurality of different
offset signal
recordings correspond to the same position in the survey area. If a system
such as the one
shown in FIG. 1 is used, such offsets may be defined both along the direction
of motion
of the survey vessel and perpendicular to the direction of motion. A set of
survey
positions may be defined based on the approximate position of the mid points
determined
as shown in FIG. 2. The survey area is usually defined by a grid of
rectangular "bins".
For each such bin, a set of data "midpoints" may defined based on offset.
[0040] As explained above in the Background section herein, in seismic
survey
acquisition techniques known in the art, it is believed that good survey
results are
obtained by operating the vessel and the streamers such that the reflection
points 26, 28
are as uniformly spaced as practicable, and that inadequate imaging or
"coverage" of
features in the subsurface may result if the spatial density of the reflection
points is
irregular or below a selected threshold. Using the above explanation of bins,
prior art
techniques provided that a selected number of data traces were required to be
assigned to
each bin associated with a particular survey position. Using prior art data
quality
evaluation techniques, it was believed that absence of sufficient numbers of
traces in
certain bins was justification for infill shooting.
[0041] Each seismic data "trace" ("trace" being the term known in the art
for a graphic or
other representation of a recorded or interpreted seismic signal) that is
input to prestack
migration techniques for seismic interpretation, however, contributes to a
plurality of
output traces from the migration procedure. In migration, the output traces
are caused to
correspond to selected survey positions such as those defined above with
reference to
FIG. 2. Because of such contribution to multiple output traces of each input
trace, it has
been determined that sufficiency of data coverage may not necessarily require
sufficient
numbers of traces corresponding to each of a plurality of predefined bins.
13
CA 02732291 2011-01-27
WO 2009/137237 PCT/US2009/040505
[0042] An explanation of methods according to the invention begins with
reference to
FIG. 3, which shows a typical 2D migration impulse response. Such response is
shown
in the form of possible reflector positions in the subsurface. Note that the
impulse
response is wider at longer travel times through the subsurface. At the base
of each
impulse response, a single trace contributes energy to several adjacent
traces, and when a
plurality of traces is summed in the output from migration an improved image
will result.
The traces which contribute to the image of a substantially flat reflective
event (i.e., the
base of the migration response) fall in an area that can be defined
mathematically as the
Fresnel zone. If the Fresnel zone is relatively large, there is little
difference between the
contribution to a migration output of a trace which is disposed exactly in the
center of the
Fresnel zone, and a trace which is slightly offset from the center. In methods
according to
the invention, the size of the Fresnel Zone can be the basis for assessment of
the
sufficiency of coverage of seismic data.
[0043] FIG. 4A shows an explanation of the expected size of the Fresnel
zone depending
on the frequency of the seismic energy detected from a particular subsurface
reflector, the
seismic velocity and the two-way travel time of the seismic energy to the
particular
reflective horizon in the subsurface. The equation shown in FIG. 4A may be
used for the
case of a seismic source and seismic receiver being collocated to estimate the
size of the
Fresnel zone for each reflective horizon in each trace acquired during a
seismic survey. It
should be emphasized that FIG 4A only illustrates the Fresnel zone for a
situation where
the source and receiver are collocated on the surface. While it is common
practice for this
to be used as a definition of the Fresnel zone, it is possible to compute
Fresnel zone
shapes and sizes for the more common situation where the source and receiver
are not
located at the same point (they are offset), and these Fresnel zones are
larger and
elliptical. It is important in practical implementations of the present
invention that offset
Fresnel zones are used. One equation that defines the shape of such Fresnel
zone is as
follows:
14
CA 02732291 2011-01-27
WO 2009/137237
PCT/US2009/040505
2
X2
Y ___________________________
______________ + =1 (1)
T2 _2 h2 / L2z2
Li z L2 1
1 L2 h 2
\ 1 I
wherein
x = radius of ellipse in the direction perpendicular to shot receiver azimuth.
y = radius of ellipse in the direction parallel to shot receiver azimuth.
h = half the receiver offset (source to receiver distance = offset/2)
z = depth to the horizon.
L1 = 0.5(2L + AT)
L = one way ray path distance (= Vh2 + z2)
AT, = half wavelength = v/ (21)
v = velocity
f = frequency
[0044] Once the Fresnel zone size has been determined, a weight function
may be
defined based on the distance from the position corresponding to the
particular recorded
data trace used. The weight function may be set to unity or other convenient
value at the
position of the data trace (the center of the Fresnel zone) and may decrease
to zero at the
outer limit of the Fresnel zone. The Fresnel zone for each input data trace
for each
reflective horizon may be overlaid on a grid of the output bin locations. A
weighted trace
amplitude value may be defined for each trace for each bin based on the
distance between
the center of each bin and the center of the Fresnel zone for each data trace.
For each bin,
the weighted trace amplitudes are summed for all traces whose bin centers are
within
Fresnel zones of each data trace for each such reflective horizon. For each
bin having a
summed weighted trace amplitude exceeding a selected threshold, such bin may
be
deemed to have sufficiently dense seismic data coverage to avoid spatial
aliasing in an
output image trace corresponding to that particular bin. It should be noted
that while a
Fresnel zone may be calculated for each of the seismic traces actually
recorded, the
method of the invention may also be used by computing Fresnel zones for only a
subset
of the seismic data traces. Fresnel zone may be interpolated for the traces
not used to
compute a Fresnel zone.
CA 02732291 2011-01-27
WO 2009/137237 PCT/US2009/040505
[0045] In some examples, the weighted trace amplitude for each bin may be
determined
during seismic acquisition operations, such as explained above with reference
to FIG. 1.
In such examples, the weighted trace amplitude values may be stored or
displayed in one
or more devices forming part of the recording system (12 in FIG. 1), so that
an evaluation
of whether and to what extent infill seismic acquisition may be required for
adequate data
coverage.
[0046] The thresholds selected for the assessment of coverage based on
Fresnel zones
will be related to the amplitude of the final image (that is, the image made
by migration)
of the seismic data at any particular image output or bin center location. The
foregoing is
not true of current methods of seismic coverage assessment where a completely
empty
bin (no traces), deemed to represent inadequate coverage, may still have a
seismic image
after migration.
[0047] FIGS. 5A through 5E show a set of migration image output bins each
associated
with a bin center at a predefined position. In techniques for determining
sufficiency of
data density known in the art prior to the present invention, as explained
above, a certain
number of input data traces (one or more, depending on bin size and other
factors) was
required to be associated with each bin in order for the seismic data to be
deemed
sufficiently dense to properly image features in the subsurface without
spatial aliasing.
FIG. 5A shows one such output bin approximately in the center of a grid of
such bins,
typically equal in size and uniformly spaced. An example Fresnel zone for a
data trace
allocable to the bin is shown by the ellipse in FIG. 5A. In FIG. 5B, a weight
for the trace
of FIG. 5A is shown as unity for the situation where the geodetic position of
the mid
point of the source and receiver positions at the time of signal recording is
located within
the indicated bin. For such situation, the bin including the mid point
position is assigned
a weight of unity or 100 percent, and other bins are assigned a weight of
zero. FIG. 5C
shows the bin weight of FIG. 5B for the example trace with an overlay of bin
weights
calculated according to an example of the invention. The bin weights in FIG.
5C
correspond to the Fresnel zone outline shown in FIG. 5A. FIGS. 5D and 5E show
bin
allocation according to methods known in the art prior to the present
invention. For bins
in which no data trace has a mid point within the geodetic area defined by the
bin, no
16
CA 02732291 2011-01-27
WO 2009/137237 PCT/US2009/040505
weight is applied, and as shown in FIG. 5D no trace is allocated to such bin.
In
determining scope of coverage using the binning shown in FIG. 5D, weight
functions
shown in FIG. 5E indicate zero weight to the bins having no allocated trace.
[0048] FIGS. 6A and 6B illustrate weight function calculation according to
an example
of the invention. For a seismic system as shown in FIG. 1, each trace may have
a Fresnel
zone calculated as explained above with reference to FIGS. 4A and 4B. Such
Fresnel
zones for an example horizon are shown in FIG. 6A superimposed on a bin grid
similar to
the one shown in FIGS. 5A through 5E. Weight functions calculated as explained
above
provide trace amplitude values as shown in FIG. 6B. As can be observed in FIG.
6B,
notwithstanding "holes" in the coverage if bin allocation is performed
according to prior
art methods, the trace amplitude sum value for essentially all bins in FIG. 6B
indicate
substantial trace amplitude sum values. Accordingly, data coverage may be
determined
to be adequate using a method according to the invention.
[0049] It is well known in the art that imaging of shallow layers or
horizons in the
subsurface uses seismic traces which have smaller offsets (distance between
source
position and receiver position), whereas longer offset seismic data is useful
for imaging
deeper layers in the subsurface. Furthermore, the seismic reflections from
shallow depths
in the subsurface occur at an earlier time in a seismic record. The size of
the Fresnel
zone is a function of both seismic travel time and offset, and is smaller at
shorter time and
smaller offset. For imaging of very shallow targets, only the shortest offset
seismic data
at very early time are useful. The Fresnel zone associated with these images
is therefore
relatively small. However, as the offset increases, the size of the Fresnel
zone increases.
[0050] As a result of the foregoing analysis of Fresnel zones, and
referring once again to
FIG. 1, it has been determined that it is possible to obtain adequate coverage
of seismic
data using a streamer array geometry that is intentionally "feathered",
preferably
symmetrically about the centerline of the survey vessel 10, that is, having
the lateral
spacing between streamers increase with respect to the distance between the
seismic
energy source 17 and each seismic sensor 22 (offset) up to a maximum lateral
distance
associated with sufficient or predetermined density of data coverage. In a
method
17
CA 02732291 2011-01-27
WO 2009/137237 PCT/US2009/040505
according to one aspect of the invention, a size of the Fresnel zone
associated with each
seismic sensor is determined as explained above. A maximum lateral distance
between
longitudinally corresponding seismic sensors on adjacent streamers is then
determined
that will result in sufficient or predetermined density seismic data coverage.
Such
sufficiency or predetermined density, as explained above may be determined
when a sum
of contributions of each trace to each output location bin exceeds a selected
threshold.
The sum corresponding to each bin may be stored in a computer readable medium
or may
be displayed on a computer display.
[0051] In one example, the recording system 12 may be configured to cause
the LFD
devices 26 to operate to laterally deflect the streamers 20 until measurements
from the
ARDs 23, 26A indicate that the streamers attain lateral distance between them
that is
determined as explained above. It will be appreciated by those skilled in the
art that
while the lateral spacing or distance between streamers may generally increase
with
respect to offset, it is within the scope of the present invention for the
relationship
between the lateral spacing and the offset to be other than monotonic. For
example, the
distance may remain constant for a selected offset range, and then increase
with respect
to offset. Such increase may be linear or non-linear, and may revert to
constant spacing
at a selected further offset distance along the streamers.
[0052] Referring to FIG. 1A, Fresnel zones for selected sensor positions
are shown at Fl,
F2, F3 and F4. As can be inferred from the explanation above, the size of the
Fresnel
zones corresponding to larger offsets will be larger at larger offset. Taken
as an
approximation of the coverage represented by a seismic data record from the
respective
sensor positions shown in FIG. 1A, the Fresnel zones corresponding to the
larger offsets
shown (F3 and F4) have considerable lateral overlap. This suggests that the
uniform
lateral spacing may provide more coverage than is required to accurately image
the
subsurface at such offsets.
[0053] In FIG. 1B, the same Fresnel zones at the same offsets are shown
wherein the
streamers are configured as explained above. That is, the streamers are
steered so that
their lateral spacing is related to offset, generally increasing as offset
increases. In such
18
CA 02732291 2011-01-27
WO 2009/137237 PCT/US2009/040505
configuration, the Fresnel zones at F3 and F4 do not overlap, suggesting
sufficient but not
more than necessary seismic data coverage of the subsurface.
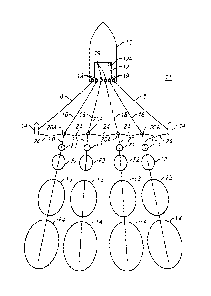
[0054] An illustration of calculation of Fresnel zones is shown in FIG. 7.
The seismic
source position is shown at S. Sensors for which the Fresnel zones are to be
calculated
are shown at R1, R2, R3 and R4. The corresponding Fresnel zones are shown at
F6, F7,
F8 and F9, respectively.
[0055] Offsets for each of the seismic sensors in the calculation shown in
FIG. 7 are 205
meters for sensor R1, 2405 meters for sensor R2, 4605 meters for sensor R3 and
6805
meters for sensor R4. The foregoing is representative of actual streamers of
6600 meter
length. The subsurface reflector (target) depth for each offset evaluated is
500 meters for
the signal detected at sensor R1, and 3100 meters, 4150 meters and 5900 meters
for the
signals at R2, R3 and R4, respectively. The foregoing represent seismic travel
times of
534 milliseconds, 1.716 sec, 2.550 sec and 3.555 sec., respectively The
Fresnel zones
have been computed based on a gradient velocity of 1700 meters per second +
0.7 meters
per second per meter. The Fresnel zones F6, F7, F8 and F9 are shown by their
limits in
the ellipses in FIG. 7. The increase in size with respect to offset is clearly
shown.
[0056] Methods according to the invention may provide more efficient
seismic survey
operations than is possible using seismic survey techniques known in the art
prior to the
present invention.
[0057] While the invention has been described with respect to a limited
number of
embodiments, those skilled in the art, having benefit of this disclosure, will
appreciate
that other embodiments can be devised which do not depart from the scope of
the
invention as disclosed herein. Accordingly, the scope of the invention should
be limited
only by the attached claims.
19