Note: Descriptions are shown in the official language in which they were submitted.
CA 02756486 2015-03-16
31013-28
PIPELINE HYDROSTATIC TESTING DEVICE
TECHNICAL FIELD
This application relates to hydrostatic pressure testing of vessels, such as
pipelines.
BACKGROUND
A hydrostatic pressure test is used to assess the integrity of a vessel, such
as a
pipe. The vessel can, for example, be a section of a pipeline that has been
cut from the
remainder of the pipeline or a pipe that is to be added to a pipeline. The
pipe is capped at both
ends and filled with liquid pressurizing media. During the test, a pump
incrementally forces
an additional volume of media into the pipe with each stroke of the pump's
piston. The pipe's
internal pressure is monitored and provides an indication of a leak or other
indication of lack
of pipe integrity.
SUMMARY
A portable test apparatus is for performing a pressure test on a vessel.
During
the test, an additional amount of liquid is forced into the vessel by each
successive stroke of a
pump. The test apparatus includes a pressure sensor configured to measure
pressure in the
vessel. A processor monitors, during the test, the strokes communicated from
the pump and
the pressure sensed by the pressure sensor. A graphical user interface
includes input fields to
receive user-entered test parameter information, and further includes a
graphical
representation of the stroke counts and measured pressure in real time during
the test.
According to one particular aspect, there is provided a portable test
apparatus
for performing a pressure test on a vessel, in which, during the test, an
additional amount of
liquid is forced into the vessel by each successive stroke of a pump, the test
apparatus
comprising: a pressure sensor configured to measure pressure in the vessel; a
data storage
medium; a processor configured to monitor and store, during the test, stroke
count of the
pump and the pressure sensed by the pressure sensor; a graphical user
interface comprising
1
CA 02756486 2015-03-16
31013-28
input fields to receive user-input of test parameter information; and a
graphical representation
of the stroke count and the pressure in real time that are collected during
the test; wherein the
processor is configured to collect successive data sets at a constant
predetermined interval of
increasing pressure, each data set including a stroke count and a pressure
value at that stroke
count, and upon collection of each successive data set to: determine a
difference between the
stroke count of the current data set and the stroke count of a previous data
set, calculated as
the stroke count of the current data set minus the stroke count of the
previous data set; and
generate a warning, indicative of a breach in the vessel, if the difference
exceeds a
predetermined threshold.
The stroke counts and pressure may be secured from modification during the
test. The user-entered test parameter information can include elevations
relative to sea level at
different locations along vessel. The test apparatus can further include a
temperature sensor
for measuring temperature, for the processor to monitor the temperature
measured by the
temperature sensor. The vessel can be a pipe. The processor saves a secure
report of data
collected in the test in a data file in an electronic data storage medium.
Another aspect provides a method for performing a pressure test on a vessel,
in
which, during the test, an additional amount of liquid is forced into the
vessel by each
successive stroke of a pump to increase the internal pressure of the vessel,
the method
comprising: inputting a user entered greater threshold; calculating a lesser
threshold from the
greater threshold; inputting an elevation of the vessel and a pressure of the
vessel at that
elevation; calculating, from the inputted elevation and pressure, pressures of
the vessel at
other elevations of the vessel; collecting successive data sets at a constant
predetermined
interval of increasing pressure, each data set including a stroke count of the
pump, the internal
pressure of the vessel, a vessel temperature and an ambient temperature; upon
collecting each
successive data set: recording the most recently collected data set; adding a
data point,
corresponding to the most recently collected data set, to a plot of vessel
temperature versus
time of day; adding a data point, corresponding to the most recently collected
data set, to a
plot of ambient temperature versus time of day; adding a data point,
corresponding to the most
recently collected data set, to a plot of vessel pressure versus time of day;
adding a data point,
2
CA 02756486 2015-03-16
31013-28
corresponding to the most recently collected data set, to a plot of vessel
pressure versus stroke
count; determining a difference between a stroke count of a most recently
collected data set
and a previously collected data set, calculated as the stroke count of the
current data set minus
the stroke count of the previous data set; and generating a first warning,
indicative of a breach
in the vessel, if the difference exceeds the lower threshold; generating a
second, different,
warning if the difference exceeds the higher threshold; wherein the steps of
the method are
performed by one or more processors of a portable testing device.
There is also provided a portable test apparatus for performing a pressure
test
on a vessel, in which, during the test, liquid is injected under pressure into
the vessel by a
pump, the test apparatus comprising: a pressure sensor configured to measure
pressure in the
vessel; a flow measuring device configured to measure the injected volume; a
data storage
medium; a processor configured to monitor and store, during the test, the
volume of the
injected liquid measured by the measuring device and the pressure sensed by
the pressure
sensor; a graphical user interface comprising input fields to receive user-
input of test
parameter information; and a graphical representation of the stroke count and
the pressure in
real time that are collected during the test.
BRIEF DESCRIPTION OF THE DRAWINGS
FIG. 1 is a perspective view of a pipe to be tested and a test apparatus for
performing the test, the test apparatus including a console and a computer.
FIG. 2 is a top view of a top panel of the console.
FIG. 3 is a schematic view of wiring within the console and wiring that
connects the console to other components of the test apparatus.
FIGS. 4-12 are screen shots of user interface display screens (windows)
provided by the computer for performing the test.
FIG. 13 is a graph that illustrates how the computer determines when to issue
warning indications.
2a
CA 02756486 2015-03-16
31013-28
FIG. 14 is a flow chart for a method of using the test apparatus.
DETAILED DESCRIPTION
The apparatus shown in the figures has parts that are examples of the elements
recited in the claims. The apparatus thus includes examples of how a person of
ordinary skill
in the art can make and use the claimed invention. They are described here to
meet the
requirements of enablement and best mode without imposing limitations that are
not recited in
the claims
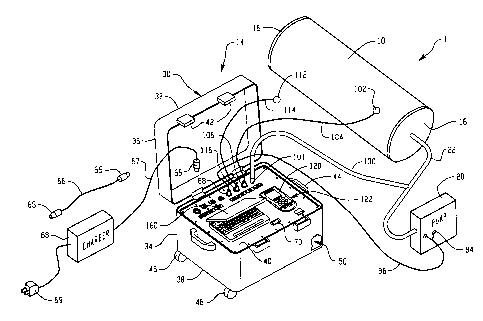
As shown in Fig. I, the apparatus 1 includes a vessel, in this case a pipe 10
that
is a pipe section isolated from, such as by being cut from, a pipeline. A test
equipment 14 is
used to perform a hydrostatic pressure test to check the pipe 10 for integrity
and breaches
(leaks). In the test, the pipe 10 is sealed with caps 16 at its opposite ends
and then filled with
a pressurization media. The media in this example is a liquid such as water. A
hydraulic
pump 20 forces additional liquid into
2b
CA 02756486 2011-10-28
the pipe 10 through a fill tube 22. Each stroke of the pump's piston injects a
uniform and known
amount of water into the pipe 10, thereby uniformly and incrementally
increasing the hydraulic
pressure within the pipe 10 during the test. Concurrently, the test equipment
14 monitors ambient
temperature and the pipe's internal pressure and temperature, and yields a
table and a graph of these
parameters against the volume of media that is injected into the pipe. This
volume is indicated in
terms of stroke count (number of pump strokes). That is because the pump
injects the same volume
of media into the pipe with each piston stroke, so the volume per stroke is
uniform throughout the
test. The graph and table are analyzed to assess the pipe's integrity. This
test can be used to assess
the integrity of pressure vessels for various applications including new
construction, repair,
replacement and reclassification (upgrade or downgrade).
The test equipment 14 includes a console 30 that has carrying-case type
housing 32. The
case 32 includes a base 34 and at top cover 36 that are attached together by a
hinge. The base 34 has
a bottom surface 38, configured to rest on a ground or table when the console
30 is being used and
operated. The base 34 further includes a top surface 40 serving as a control
panel. The case 32
further has latches 42 for latching the case closed. The case 32 further has a
telescoping handle 44
configured to be grasped for carrying the console 30 or wheeling the console
30 by wheels 46 that
are attached to the case's bottom 38. A cavity 50 of the base 32 is bounded by
base's bottom and top
surfaces 38, 40.
Referring to Figs. 2-3, the cavity 50 (Fig. 1) contains a 12-volt DC battery
52 in the cavity.
The base's top surface has a strip of terminals 60, one of which is a low-
voltage 12VDC input power
terminal 62. This low-voltage input power terminal 62 is connected to the
battery 52 via a
breaker-protected "Charger ON/OFF" switch 64 located along the terminal strip
60. The
low-voltage input power terminal 62 is an automotive (cigarette-lighter) style
electrical socket. It is
configured to receive an automotive style electrical plug 65 of either of two
power cables 66, 67 (Fig.
1). One power cable 66 has, at its opposite end, an automotive style plug 65
that can be plugged into
3
CLI-1927157v1
CA 02756486 2011-10-28
a cigarette lighter socket of a car. The other power cable 67 is the output
cable of a
120VAC-to-12VDC power adapter 68 that has a wall plug 69 configured to plugged
into a wall
socket. A digital voltage meter 70 indicates battery strength by displaying
the battery's voltage. An
audible alarm device 72 in the cavity 50 will sound when the battery voltage
drops below 10.5 VDC.
A main ON/OFF switch 80 along the terminal strip 60 controls electricity from
the battery 52
to in inverter 82 in the cavity 50. The inverter converts the 12VDC to an
120VAC output 83.
The pump 20 has a pair of dry normally-open electrical contacts 84 that are
momentarily
electrically shorted by the pump upon each piston stroke of the pump. The
contacts 84 are
connected by a two-wire cable 86 to a plug 88 that is inserted into a "stroke
count" electrical socket
terminal 90 along the terminal strip 60. A biasing device 92 within the cavity
50 (Fig. 1) applies a
5VDC bias across the stroke-count cable wires 86, so that each stroke of the
pump 20 is
accompanied by a momentary 5-volt drop, from 5V to OV, across the wires when
the pump 20 shorts
the wires 86.
A hose 100 (flexible tubing) communicates the pipe's internal pressure to a
pressure port 101
along the terminal strip 60. A pipe temperature sensor 102, in this case an
RTD (resistive
temperature device) is adhered to the pipe 10. The RTD is connected by a two-
wire cable 104 to a
plug 106 that is inserted into a "pipe temperature" electrical socket terminal
108 along the along the
terminal strip 60. An ambient temperature sensor 112, in this case an RTD, is
exposed to the
ambient air. It is connected by a two-wire cable 114 to a plug 116 that is
inserted into an "ambient
temperature" electrical terminal socket 118 along the terminal strip 60.
A multifunction meter 120 is seated in a pocket 122 of the control panel 40.
The meter 120
is powered by the 12VDC-to-120VAC inverter's output cable 83. The meter 120
has three bays into
which are removably installed a pressure sensor module 131 and first and
second temperature sensor
modules 132, 133. In the cavity 50 (Fig. 1), a hose 134 couples the pressure
port 101 to the pressure
sensor module 131. Two cables 136, 138 couple the pipe-temperature and ambient-
temperature
4
CLI-1927157v1
CA 02756486 2011-10-28
terminals 108, 118 respectively to the temperature sensor modules 132, 133.
The pressure sensor
module 131 includes a pressure sensor that provides the meter 120 with an
electrical signal whose
voltage or current is a function of the hydrostatic pressure of the liquid in
the pipe. Each
temperature sensor module 132, 133 provides an activation voltage to the
respective RTD and
provides the meter 120 with a voltage-based or current-based electrical signal
that is a function of
the respective measured temperature. The meter 120 displays the resulting
pressure and temperature
readings on its LCD-display 140. The meter 120 also communicates the pressure
and temperature
readings through a data communication port, in this case a DB-9 RS232 serial
port.
A laptop computer 160 rests on, and is secured to, the control panel 40. It is
powered by a
cable from the inverter's 120VAC output 83. The computer 160 has a processor
that executes the
software functions performed by the computer. The computer 160 also has a
display 162. It also has
one or more input devices, such as a keyboard 164 and a mouse, a mouse pad
and/or touch-screen
configuration. A communication cable 168 conveys data, including the pressure
and temperature
readings, from the meter's communication port to a USB input of the computer.
Another cable 170
couples the stroke count terminal 90 to another USB input of the computer 160.
The computer 160 includes software programming instructions, which can be
based on
LabVIEWTM platform and development environment. The software is executed by
the computer's
processor to graph the measured pipe pressure, pipe temperature and ambient
temperature against
time of day on the display 162, and to graph the measured pipe pressure
against stroke count on the
display 162, and to provide over-range notifications on the display 162. The
computer controller
starts counting the pump strokes once the "Stroke Start Pressure" 508 is
reached, and also counts and
logs the pump strokes required to generate each user-selected pressure
increment 510 (in this case 10
PSI) until the pipe's internal pressure (PTest Instrument Pressure) is
achieved.
The computer's software program provides a graphic user interface (GUI) based
on tabs.
Some tabs have different sub-tabs. And each tab or sub-tab is selected with
one of the computer's
5
CLI-1927157v1
CA 02756486 2011-10-28
input devices 164 to call up a corresponding display screen (window). A screen
shot for each
sub-tab is shown in a respective figure of Figs. 4-12. In this example,
"PIT5000" is the model name
of the console 30 and "MFT4000" is the model name of the multifunction meter
120.
As shown in Fig. 4, the first tab is "Setup" 400. Its sub-tabs are "Test
Info", "Pump Info",
"Site Info", "Test Limits", "PC Setup", and "Manual".
A data panel 402 (or side panel) is shown at the right hand side of all tabs
after Setup
information is entered and a "Start Program" soft button 404 is selected.
Certain test data is
displayed in the side panel 402. Visual alarms (warnings) are also displayed
in this area, and can be
indicated by a red flashing background for the corresponding GUI window. The
side panel 402 has
soft buttons. The buttons vary with test progress. For example, a user clicks
the "Start Program"
button in the side panel 402 to cause the computer 160 to start a live plot on
the "Strip Chart" tab
screen (Fig. 9) and to begin logging data to the computer's data storage
medium, such as a hard drive.
Once the "Start Program" button 404 is selected, the "Start Program" button
changes to a "Begin
Test" button 406 (Fig. 9). Once pressure reaches PTest Instrument Pressure
724, the test pipe is
capped off and the operator is ready to begin the test period. The "Begin
Test" button is selected to
monitor and record pressure and temperature during the test period. Pressing
an "End Test" button
408 ends the test at any time. The "End Test" button 408 ends the current test
after a user
confirmation step, and completes the data log for the session. To continue
documenting a test after
"End Test" 408 is selected and confirmed, the user may start a new program and
use a different file
name to record any remaining testing on the hard drive.
Most "Setup" sub-tabs prompt for alpha or numeric data entry to document site
information,
design parameters, test limits or notes to be integrated in a data log set.
Information is added or
edited by clicking on a desired field and typing as needed. Standard text
editing features are
supported. Alternatively, the user can click on an up arrow or down arrow to
increment or
decrement the displayed value. Drop down menu boxes are used for some data
entries. In these
6
CLI-1927157v1
CA 02756486 2011-10-28
cases, a user clicks the down arrow and then clicks on the desired menu item
to select. All Setup
sub-tabs should be completed prior to starting a test program. All edited
information under the
Setup tab is locked out by the computer once the "Start Program" button is
selected but the
information will remain viewable. The data entered by the user and the stroke
counts and pressure
being monitored and stored are secure from modification during the test.
In Fig. 4, the "Test Info" sub-tab 420 is selected to input information such
as test name 438,
operator name, site location, test media, work order number, etc. This tab 420
is also used to
customize the test with different units of measure 430, data save intervals
434 and which
temperature (ambient and/or pipe) to monitor and record. The user-entry in a
"Test Name" field 438
is included in a file name for the stored test data. For example, where "2011-
MontRelay-002" is
entered in the "Test Name" field, test data would be saved to both
C://console20/Data/2011-MontRelay-002_MMDDYYYY.csv and
C://console 20/Data/2011-MontRelay-002 MMDDYYYY.xls. The computer 160 will
automatically save the test data to a comma-delimited file every minute during
the test. The
processor thus saves a secure report of the data collected in the test in a
data file of the hard drive
type electronic data storage medium.
A "T-pipe Required" button 440 is set to ON with green background by program
default, to
require the pipe temperature (Tpipe) to be plotted and recorded during the
test. It can be toggled to
OFF, to read "Tpipe Not Required" with red background, by the user for only
the ambient
temperature (Tambient) to be plotted and recorded.
The factory default is for the computer 160 to log (record) data sets in one
minute intervals.
That is why, in Fig. 4, a "1" appears in the "Data Save Interval" field 434.
To reduce the number of
data sets provided in the final report, the "Data Save Interval" field is set,
using the up and down
arrows, to the desired value in minutes. For example, "5" in this field will
cause one data set to be
logged to the computer's hard drive data storage medium every 5 minutes.
However, data is saved
7
CLI-1927157v1
CA 02756486 2011-10-28
each minute from the time "Start Program" is selected until "Begin Test" is
selected regardless of
this setting. The Data Save Interval (field 434) determines the data both
stored and plotted after
"Begin Test" is selected. That is because Data Save Interval regulates only
the data saved after
"Begin Test" is selected.
Engineering units of measure to be used in display screens and during the test
are selected
using the drop down menus for entry fields for "Pressure" 450, "Temperature"
452 and "Length"
454. The following units can be available: For Pressure: PSI, kg/cm2, Bar,
kPa; For Temperature:
deg F, deg C; For Length: feet, meters; For Stroke Volume: gallons, liters.
The computer 160 will
use the user-selected units in recording and plotting data. The computer 160
may also communicate
these units to the meter 120 via the serial connection so that the meter 120
can use these units when
the meter displays the pressure and temperature through its own display.
As shown in Fig. 5, a "Pump Info" sub-tab screen 500 is used to input pressure
pump
information in a "Pump Model Number" field 502, a "Pump Serial Number" field
504, "Stroke
Volume" field 506 (volume per stroke, to enable the computer 160 to calculate
and display the total
liquid volume added to the pipe during the test), a "Stroke Start Pressure"
field 508 (pressure to be
reached to prompt the processor to start counting strokes) and a "Stroke Rate
Target" field 510.
Strip chart, Data, Details and Stroke Count are activated on "Start Program".
The "Test Time" (702)
commences with "Begin Test". After "Stroke Start Pressure" is achieved, the
Stroke Count tab
counts strokes every "Stroke Rate Target" value. A "Stroke-Count Required"
button is clicked for
its field 511 to display "YES" if a stroke count is to be used in the test,
and clicked again to display
"NO" if not.
A "Pump Contact Switch" box 512 is for testing the stroke counter circuit
prior to starting the
program. It reads "Pump Contact Switch Closed" with green background if the
pump contacts are
currently shorted, and reads "Pump Contact Switch Open" with red background if
the contacts are
not currently shorted.
8
CLI-1927157v1
CA 02756486 2011-10-28
In Fig. 6, a "Site Info" sub-tab screen 600 has up and down arrows 602 to
enter a variety of
test parameter data. These include a "High Point Pressure" field 610 (pressure
at highest location
along the length of the pipe), a "High Point Elevation" field 612, a "Low
Point Elevation" field 616,
an "Upstream Elevation" field 622 (feet above sea level at highest end of
pipe), a "Downstream
Elevation" field 626 (feet above sea level at lowest end of pipe), a console
sensor elevation
("PIT5000 Sensor Elevation") field 634, a pipe length field 640, a Pipe O.D.
field 642 and a pipe
Wall Thickness field 644. From the high point pressure and elevation, and from
the elevations that
are entered by the user for the other locations, the computer calculates the
pressures at the other
locations. These include a "Low Point Pressure" field 614, an "Upstream
Pressure" field 620
(pressure at highest end of pipe), and a "Downstream Pressure" field 624
(pressure at lowest end of
pipe). The computer pressure Px at any location along the pipe of elevation Ex
is calculated by the
computer from the equation Px = PHp + (0.433 x [EHp ¨ Exi), where PUP is the
high point pressure
and EHp is the high point elevation. A console pressure ("PIT5000 Pressure")
field 632 is measured
by the console.
In Fig. 7, a "Test Limits" sub-tab screen 700 is used to input "Test Time" 702
in "Hours" 704
and "Minutes" 706 using drop-down menus, to be used by the computer 160 in the
"Details" tab (Fig.
10). A "Stroke Start Pressure" field 710 is automatically forwarded by the
computer 160 from field
508 of the "Pump Info" sub-tab (Fig. 5). The user enters values in the "PTest
High Limit Set" field
712 and "PTest Low Limit Set" field 714, that are upper and lower limits for
the "PTest Instrument
Pressure". The "PTest Instrument Pressure" field 724 is automatically
forwarded from field 632 of
the "Site Info" sub-tab screen (Fig. 6). The background of the "Strip Chart"
Tab's PTest field 930
may flash red if this "PTest Instrument Pressure" exceeds the "PTest High
Limit Set" field. The user
enters, in the "PLeak Pressure" field 726, a desired preliminary leak test
pressure. A preliminary
shut in hydrostatic pressure test is observed for leaks, if the user wants to
check for system leaks
prior to going above a pressure threshold in safety standard operating
procedure. The user might
9
CLI-1927157v1
1
CA 02756486 2011-10-28
perform a 15-minute leak test here, before going to higher pressures. Up and
down arrows are used
to enter, in the "Pressure Rate Maximum" field 730 and "Pressure Rate Minimum"
field 732,
maximum and minimum system pressurization rates in PSI/minute. These rates are
only for
triggering alarms. This sets the upper and lower alarm limits for the
"Pressure Rate" field 932 in the
side panel 402 of the "Strip Chart" tab screen (Fig. 9).
Fig. 8 shows a "PC Setup" (i.e., computer setup) sub-tab screen 800. It
enables a user to
click a "Get Cal Data" button 802 to verify communication with the meter 120
and to verify
identification information of the measurement devices, including their serial
numbers. Clicking the
"Get Cal Data" button causes three "MFT" (multifunction test meter)
calibration data windows 810
to populate with identification information of the modules 131, 132, 133. This
is achieved by the
computer 160 polling the meter 120 to retrieve the serial numbers of the three
measurement modules
131, 132, 133. These serial numbers are displayed in the PC Setup screen for
pretest verification
when needed, and also in the Details screen for verification during the test.
A "Manual" sub-tab is clicked to access the user's manual for the test
apparatus 14.
In Fig. 9, a "Strip Chart" tab screen 900 displays a live plot 910 (graph) of
pipe pressure 912,
Tambient (ambient temperature) 914 and Tpipe (pipe temperature) 916 versus
time 918, in order to
document the hydrostatic test and its duration. This screen is called up by
clicking on the "Strip
Chart" tab 920. It can alternatively be called up by selecting the "Start
Program" button 404 from
any sub-tab of the "Setup" tab 400 (Fig. 4), which then converts to a "Begin
Test" button 406. The x
axis is time-of-day 918 in 24-hour format. The graph's temperature axis is the
left hand vertical axis,
and the graph's pressure axis is the right hand vertical axis. The temperature
axis is fixed to 0-150
degrees F. The pressure axis is auto-scaled throughout the test. The side
panel 402 appears on the
right hand side of the screen, providing the current "PTest" 930 (pipe
pressure), current "Pressure
Rate" 932, current "Ambient Temperature" 934, and current "Pipeline
Temperature" 936. The
"Begin Test" button 406 can be clicked when the PTest Instrument Pressure 724
is reached, and the
CLI-1927157v1
CA 02756486 2011-10-28
=
shut-in 702 test period is ready to begin. Pipe pressure corresponds to the
first display line "Si" of
the meter 120 (Fig. 2) and is plotted against time in white. Tambient
corresponds to the meter's
second display line "S2" and is plotted against time in red. Tpipeline
corresponds to the meter's
display line "S3" and is plotted against time in green. Display controls 940
are located in the lower
left corner of the Strip Chart to manipulate viewing of the graph, such as
zoom and pan. Zoom and
pan can be used after the "Autoscale Graph" 942 On/Off button is set to Off.
To use the zoom
feature, a user clicks on a magnifying glass icon, selects the zoom icon, then
moves the cursor to the
graph and then left-clicks and drags to draw a box around section of interest.
Or the user can select a
zoom-in icon or a zoom-out icon to zoom the entire plot in or out. To use the
pan feature, the user
moves the cursor onto the plot, left-clicks, and holds and drags the plot as
desired. The user can lock
the temperature and pressure scales for consistent appearance of data over
time by clicking the
"Autoscale" icon to toggle it to Off.
In Fig. 10, a "Data" tab screen 1000 displays a table 1010 of data collected.
Each line (row)
contains a single data set comprised of time-of-day 1020 in 24-hour format,
pipeline pressure 1022,
ambient temperature 1024, pipeline temperature 1026, stroke count 1028 and
notes 1030 for that
particular time-of-day. The current pressure 1040 and the upper and lower
pressure limits 1042,
1044 (imported from the "Test Limits" screen of Fig. 8) are displayed in the
side panel 402 during
the test. The background of field 1040 will flash red if the current pressure
(in field 1040) exceeds
the high limit 1042 or drops below the low limit 1044. Pressure rate is
displayed in the side panel
402 during system pressurization occurring after "Start Program" button is
selected and before
"Begin Test" button is selected, and again after the Test Time 702 is
completed. The "Add Note"
button is selected to enter text that will be included in the "Notes" field
for the most recent data set
displayed in the most recent row of data.
In Fig. 11, a "Details" tab screen 1100 displays basic information about the
current test. This
includes current time-of-day 1102, and the current test's "Start Time" 1104,
"Elapsed Time" 1106
11
CLI-1927157v1
CA 02756486 2011-10-28
and "Estimated Finish" time 1108. This screen also displays three "Calibration
Data" fields 1110
that include the manufacturer, model number, serial number and calibration
date for each of the
pressure sensor and two temperature sensors. This screen 1100 also displays
the file locations 1120,
of the computer's hard drive, where the test result files are saved. These
files provide a secure
electronic test report for the test. The serial numbers of the three
measurement modules 131, 132,
133 are retrieved by the computer 160 from the meter 120 each time the
"Details" tab is selected.
In Fig. 12, a "Stroke Count" tab screen 1200 displays a live (i.e., updated in
real time) table
1210 of stroke count data. Each row of the table 1220 includes a data set for
each added increment
of AP, where AP (in this example 10 PSI) is the user-entered value in field
510 (Fig. 5). Each row
includes, for the respective data set, time-of-day 1220 (when the data set was
collected), pressure
1222, stroke subtotal 1224 (number of strokes since previous data set) and
stroke total 1226 (total
number of strokes since beginning of test). The most-recent data set is
appended to the table in real
time at the last row of the table. 1220.
The "Stroke Count" tab screen 1200 in Fig. 12 also includes a live plot 1230
of pressure 1232
vs. total number of strokes 1234. This screen also displays has a Total Count
field 1240 that is
continuously updated with the current total count value. Also displayed are
two fields 1242, 1244
labeled "Counts A" and "Counts B". At any given time, one of them is in an
active state the other is
in a static state. The static field (1242 or 1244) shows the subtotal stroke
count of the last recorded
data set, which is displayed in the last row of the table 1240. The active
field shows a continuously-
updated running total of the counts collected since the last recorded data
set. Once the data set being
currently is recorded and added into a new row of the table, the previously
active field (1242 or 1244)
becomes static and freezes its value, and the previously static field becomes
active and starts tallying
the counts of the next data set starting from zero. A virtual toggle switch
1246 automatically points
left or right to the currently active Counts field (1242 or 1244).
12
CLI-1927157v1
CA 02756486 2011-10-28
In Fig. 12, the side panel 402 has fields that display the current pressure
1250, pressure rate
1252, ambient temperature 1254 and pipe temperature 1256. The user can enter a
threshold stroke
rate value in a "Double Stroke" field 1260. A normal count is calculated as
half the double stroke
count. Halfway between normal stroke count and the double stroke count, at a
value calculated to be
75% of the double stroke count, the background of "Pump Contact" 1270 changes
from green to
yellow. Normal stroke is determined from column 1224. At double stroke, the
light changes to red.
The user can click on the notes text entry field 1261 to type a note of up to
sixty characters and then
click the "Add Note" button 1260 again. The note will be merged into the data
file, along with its
corresponding data set, for permanent record. These notes will appear on the
Data tab screen during
the test in the most recent data set as soon as the Add Note button 1260 is
selected. After the Start
Program button is selected, the Site-Info sub-tab screen can displayed by
clicking the Site-Info tab.
But the Site-Info information will be grayed out and not editable after the
Start Program button is
selected. A "Volume" 1227 column can display total volume injected by the time
of the respective
data set, calculated as "Total" strokes 1226 times stroke volume 506.
Fig. 13 illustrates how alarm (warning) conditions are determined by the
computer. The line
1300 in Fig. 13 is a plot of pressure vs. strokes in accordance with graph
1230 shown in Fig. 12.
The x axis parameter is strokes, and the y axis parameter is pressure. That is
because strokes are a
known parameter (commonly called "independent variable") that is applied in a
controlled manner,
whereas pressure is a parameter that is a consequence and function of the
applied parameter
(commonly called "dependent variable).
The two most recently collected data points 1301, 1302 are respectively taken
at pressures P1
and P2. The difference between them is a value AP (10 psi in this case) that
the user entered in the
Stroke Rate field 510 (Fig. 5). Their respective stroke counts are Cl and C2,
which differ by AC.
Each time a new data point of the most recent data set is collected and
graphed, the computer
determines the AC value and compares it to both a lower preset threshold
stroke value and a higher
13
CLI-1927157v1
CA 02756486 2011-10-28
preset threshold stroke value. As long as AC is lower than the lower
threshold, the background of
=
"Pump Contact" 1270 is green. When AC is between the lower and higher
thresholds, the
background of "Pump Contact" 1270 is yellow. As soon as AC exceeds the higher
threshold, the
background of "Pump Contact" 1270 turns red. In this example, the higher
threshold is entered by
the user in the "Double Stroke" field 1260 of the "Stroke Count" tab screen
1200 of Fig. 12. The
computer calculates the lower threshold as 75% of the higher threshold value.
FIG. 14 is a flow diagram of a possible method of operation for the test
apparatus 14. The
computer processor receives user-entered test parameter information in step
1401. The processor
receives a user-entered higher stroke-count threshold in step 1402. In step
1403, the processor
calculates a lower stroke-count threshold based on the higher threshold. In
step 1404, the processor
collects a new data set. Each data set can include a time, a total strokes
count, a pressure, and two
temperatures. In steps 1405-1407, the processor adds a new data point to each
plot of pressure vs.
time, temperature vs. time, and pressure vs. stroke count and to a running
data table. In step 1408,
the processor calculates the difference value A. The difference value A can be
the difference, in
stroke counts, between the stroke count of the most recent (last-collected)
data point of the actual
vessel plot and the stroke count of a point on an ideal vessel plot at the
same pressure as that of the
most recent data point. In step 1409, the processor generates a first warning
indication if the
discrepancy value is between the lower and higher threshold values. In step
1410, the processor
generates a second, different, warning indication if the discrepancy value
exceeds the higher
threshold value. In step 1411, the processor returns to step 1404 to collect a
new data set.
This written description uses examples to disclose the invention, including
the best mode,
and also to enable any person skilled in the art to make and use the
invention. The patentable scope
of the invention is defined by the claims, and may include other examples that
occur to those skilled
in the art. Such other examples are intended to be within the scope of the
claims if they have
14
CLI-1927157v1
CA 02756486 2011-10-28
elements that do not differ from the literal language of the claims, or if
they include equivalent
=
structural elements with insubstantial differences from the literal language
of the claims.
For example, in the above procedure, the volume of media that is injected into
the pipe is
represented by stroke count. Alternatively, the volume injected can be
measured by a measuring
device that measures the injected liquid volume using another means. For
example, the
measurement device can include a flow rate sensor that measures flow rate in
units of volume per
time such as gallons per minute, and a processor that mathematically converts
(such as by integration
or summation) the measured flow rate to accumulated volume. Alternatively, the
measurement
device can include a meter that counts unit volumes (such as gallons) of the
liquid directly and
outputs accumulated volume, such as in gallons. In such a case, the graph 1230
(Fig. 12) of pressure
would be against injected volume instead of strokes.
In the above procedure, the higher threshold is manually entered in the
"Double Stroke" field
1260 (Fig. 12), against which the most recent AC value (i.e., the difference
between the most
recently collected consecutive data points) is compared for triggering an
alarm. Alternatively, the
threshold might be determined automatically by the computer itself based on
previously collected
data points. For example, the threshold can be a function of a nominally
"ideal" AC value. The
function can be a multiple of, for example twice, the nominally "ideal" AC
value. And the "ideal"
AC can be based on, such as equal to, the AC value between previously
collected consecutive data
points that were collected soon after the test started, when the pressure was
sufficiently low that the
pipe wall had not reached its plastic limit.
The shape of the curve (Fig. 13) might be mathematically processed by the
computer to
ascertain whether the source of the failure is due to a leak or due to pipe
deformation. Or if due to
both causes, to calculate a weighting factor for each of these causes of
failure.
cu_19271570
CA 02756486 2011-10-28
16
CLI-1927157v1