Note: Descriptions are shown in the official language in which they were submitted.
CA 02766815 2011-12-23
WO 2011/002707 PCT/US2010/040183
TITLE: I ETI=IOD ND SYSTEMS FOR MONITORING N J MACHINE AND
OPERATOR PRODUCTIVITY AND PR.OFITA.B1 LITY
CROSS REFF RENC E TO RELATED APPLICATIONS
']'his application claims priority under 5 U S C:. 11 (c) to provisional
application Serial No. 61/221,428 0led,tune 29, 2009 and U ',S. Serial No.
61/296,2282
filed January 19, 270101 each of which is herein incorporated by reference in
its entirety.
E'.IELI) OF TII.E INVENTI_ON
The Present invention relates to asaoni.t srin.g the productivity and.lor
profitability
associated with Triach.ines, machine operators, and groups of machine or
machine operator-.
l More specially-, bite not exclusively, the present invention relates to
monitoring machines
and machine operators as, operations are being performed so as to provide
feedback
regarding productivity and profitability..
BACKGROUND OIL 'I HE INVENTION
In industries such as, without limitation a4. ricatiture. forestry, and
construction.
natural resources are managed in various Nviays. Often times. machine
operations are
pertorrned on land or other natural resources by operator controlled machinery
or
equipment, "There are. numerous variables associated with performin, these
activities.
These. variables mays impact productivity of machines or their operators as
well as revenue
or profitability of a business. Unfortunately, the impact of these variables
on productivity
as well as revenue and profitability remains generally unk:no n. and
unmeasured.
What is needed are methods and systems which allow t=sar monitoring and/or
outputting information indicative of productivity and/or prohtabilit ..
BRIEF SUMINIARY OF THE INVENTION
A method for profitability .mon.iÃorin raf"equil?m equipment operations beI
a natural resource includes a computer system linked directly or indrect1y
with said piece
of equ.iprrient, singularly or collect] ely, into which costs, both fixed and
variable, along,
with revenue rates - derived from the. operation and:`or the natural resource,
actual or
theoretical, can be entered. The associated costs, as i ll a s. revenue rates
are input and
I
CA 02766815 2011-12-23
WO 2011/002707 PCT/US2010/040183
integrated into a Geographical Information System ((115) which is being run
directly oil or
in association with the aaforemenÃioned equip lent. singularly or
collectively, the system
also includes collecting operator data indicative of an operatoCs use of a
machine using an
onboard con tauter of the machine, collecting data concerning the application
of production
inputs during operations, collecting environmental daata using the onboard
computer, the
environmental data indicative of environmental conditions associated with. use
of the
machine, collecting machine data using the onboard con puter, the machine data
indicative
of operation of the machine. The onboard computer is connected to a Global
Positioning
System (GPS ) in such a fashion as to allow for the recording of 4D geospatial
data
(latitudes longitude, elevation, and time) pertinent to the location in which
said machine
operations are being performed and recording said information into a (CIS at
the time the
operation is performed. The method further includes performing an analysis- of
the
operational data),, the environmental daata, and the machine data stored in
the (CIS to assist in
profitability modeling as well as modeling of the environment iitron which the
machine is
operating. The analysis may be performed using the o.n:hoard computer or
remotely.
A system for monitoring profitability associated with a i 1aachine may
include, but
not be lit mited to, an onboard computer on the machine containing a GIS, a
GPS, a wireless
data transfer device, a display electrically connected to the onboard.
computer, at least one
environmental monitoring sensor electricaall connected to the onboard
computer, and at
least one machine operation monitoring sensor electrically connected to the
Onboard
computer.
According to one aspect, a method includes collecting operational and. input
cost
data indicative of production system's using machinery on a natural resource
using an
onboard computer of the machine, and collecting environmental data using the
onboard
computer, the environmental data indicative of environmental conditions
associated with
use of the machine. The method further includes collecting machine data usinu
the
onboard computer, the nmachine data indicative of operation of the machine.
The method
furtlie.r includes performing , an analysis of at least one of cost data or
revenue data using,
the environmental data and the machine production data, the analysis performed
using the
onboard computer or a remote computer.
According to another aspect of the present Invention, a system for monitoring
productivity associated with a machine is, provided. The systeni includes an.
onboard
CA 02766815 2011-12-23
WO 2011/002707 PCT/US2010/040183
system on the machine, a. display electrically connected to the orfboatrtl
system, at least one
e:r7 ire?rarr7e.rataal rrronitoring sensor electrically connected to the
onboa:rd system, and at least
one machine operation monitoring sensor electrically connected to the onboard
Sensor.
l 1.ie onboard system. is l rogramnfined to perform financial anal sis
functions using data
acquired from. the at least one environmental monitoring sensor and. the at
leas t one
rra:aclii.ne operartion monitoring :sensor. The 9V stems also allows tixr the
transmission of
collected data to computer systems for remote analysis either wirelessly or t
manually.
According to another aspect of the present inventio.Ã=r, a i.nethod is
provided. The
method includes collecting operator data indicative of operator use of a
machine using ,in
onboard computer of the machine, collecting environmental data wising the
onboard
co.Ãtaputer. the environmental data indicative of environmental conditions
associated with
use of the machine, collecting machine data using the onboard computer, the
machine data
indicative of operation of the machine, nand performing an analysis of the
operator data, the
environmental data., and the machine data using the data collected by the
onbo&d
co.Ãtaputer.
According to another aspect of the present invention a system for monitoring
productivity associated with a machine is provided. 'r he. system includes an
onboard
systems on the machine, a display electrically connected to the onboard
systems, at least one
operator monitoring sensor electrically connected to the onboard s4 stem, at
least one
environmental monitoring sensor electrically connected to the onboard. sysiem,
and at least
one .machine operaition n:lelraitoriri sensor electrically connected to the.
onboard system.
BRIEF I E SCRI PTION OF THE Ii IGU R ES
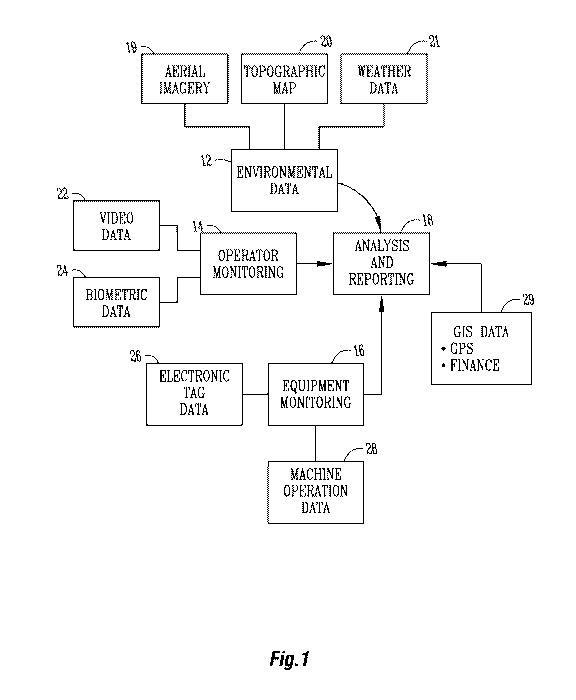
FIG. I is a flow chart showing n#brr-n. aatio flow.
-),5 FIG. 2 is a block. diagram illustrating one embodiment of a a system for
the present
invention.
FIG. 3A is an e _aartlple of a screen display show >ing a report of bulldozer
efficiency
as affected by so.il. texture and soil moisture.
FIG. >l is an example of as screen display showing bulldozer operating costs,
; (I FIG. 4A is an example: of a screen display of timber harvestiaa.t.
efficiency as
affected by percent slope.
FIG. 413 is an example of a screen display of timber harvesting revenue over
time.
R
CA 02766815 2011-12-23
WO 2011/002707 PCT/US2010/040183
FIG- 5 is a LII)AR image of productivity changes over a specified geographic
area.
PIG. 6 is an exa uple of a screen display illustrating real-tia-ne
profitability for a
bulldozer.
FIG. 7 is an example. of a screen. display i:llustraÃting, read-fii to
profitability
monitoring for agricultural operations.
FIG 8 is an esan ple: of a screen display illustrating real-tirn profitability
for
agricultural harvesting.
DETAME' 1M SCRi.P IO) 9'. OF THE PREFERRED EMBODIMENT
I Efficient, effective, and profitable use and ma-aaÃ.anaÃgemem of machines
associated
with natural resource management or management of the natural resource itself
is
desirable=. yet problenaatit. There exist numerous variables that affect the
true productivity
or profitability of individual or collective pieces of equipment in their
designed operations,
with said variables being greatly influenced by the en iro intent in which the
equipment is
operating i.n. on. For example, environmental factors may influence production
and input
costs and consequently profitability. Examples of such environmental factors
include,, but
are not limited to, geologic, hydrologic, and atmospheric factors. These
enviroaimentaal
factors also influence the overall productivity and profitability, of the
machine, its operator,
and the natural resource which is being maan.aged.
Historically, rrlonitoring anti. recording the. influence of various
environnientaÃl and
production elements ori operational coasts/revernre, and inodeling them into a
a true profit. loss
or break-even anaaly sis has been difficult if not ianpossible. Historic ally,
proft/loss
analyses have been perf-brÃrmed by means of accounting..br operational and
input costs, both
fixed and variable, and allocating them against whatever revenue is generated
or
anticipated by an operation and/or the natural resource withou fully
accounting for the
influence of the work environment in which operations are being performed.
Current systems of ntonitorin g equipment may incorporate a Global
Positioniang
System, hereafter referred to as UPS, to morn:itor the location of a machine
in terms of
travel in a linear fashion or plane with no direct correlation to dynamic
external conditions
;3(t and their ca rresptaradin impact on the operator and/or machine
productivity and
profitaabilit v Uotvever, current. equipn nt. Monitoring systems do not allow
for the
4
CA 02766815 2011-12-23
WO 2011/002707 PCT/US2010/040183
incorporation of operational costs, both fixed and variable. along vv- th
revenue rates, anal
associate them with the realwti.r?e operation of a piece of equipment on a
natural resource.
Currently, a means does not exist by which to collect and:`oi evaluate the
influence
of dynaaniic operational costirevenue vaaaiables individually or collectively
as they occur
a and/or how they are. influenced by the conditions of the operating
environment. Therefore,
the problem for entities that cs sta. operate, contract.. subcontract, or bid
work involving
powered machinery and/or equipment, as well as manage natural resources for
the
purposes to include but not be limited to profitable production and
utilization Of
commodities is determining the correlation between profitability arid
production as
influenced by, these dynamic variables at a specific location at any specified
period of time
whether past, present, or future.
Furthermore, challenges exist tip' equipment manufacturers to design, engineer
and
create equipment capable of consistently maximizing profitable mechanic.aaf
operational
ccaspaatiail to i abler
potential, Given the infinitely changing combination of these
associated with maaximt-am potential operaat:iornal profitability,.. the goal
is to quantify the
influence of the aforementioned variables as to incorporate them into
theoretical models to
predict operational f rolhtabilit ' of machine operation, and. where
applicable. the natural
resource itself, when operating cinder a given set of parameters or utilize
the collected
geospatial data alota witl operati.c~rratl airtcl inpact coasts fc~i chili
action i.ar subsequent
?0 profitability analyses and predictions. In addition to designing features
or FLIndions of a.
machine to adapt to or deal with the dynamic costs and conditions associated
with
production; equipanent manufactures or other entities have not produced a
device or system
that can monitor, record, and model the impact ofmultiple production variables
and their
associated costs as they continually interact with each other.
-),5 The impacts of a limited ability to collect and analyze the multiple
.factors that
affect a machine or a natural resource s~ operational costs in a real-time or
post process
fashion include, but are not limited to, the need to manually gather all
costs. fixed and
variarble, for analysis aal.ong with suboptimal: equipment and operator
performance,
equipment selection for operations being performed, aand'or equipment design
arid/or the
30 ield'lar<adtact: ern of a natural resource.
Examples of the negative economic impacts resulting from iaaa:d.ecltaaa:te*lc
accounting
for the influence ofenvironnment on production and input costs may include the
following:
5
CA 02766815 2011-12-23
WO 2011/002707 PCT/US2010/040183
Through an improper a.Ãccount ng of the factors influencing the potential and
actual
output and à e associated cost of operations pertaining to equipment
operations whether
singularly or collectively. and,/or a natural resource, poor business
decisions can be made
S hen. dealing with job costing and pricing, for any speeiie job which
involves the.
interaction between people, machines. the en.vironna.ent_ aÃnet/or natural
resources. Pro -fit
potential may be over or underestin ated based on asstà wed factors such as a
machine Or
natural resources` average potential or actual production capabilities when
dealing with the
variable kenv,. ironrnetttaÃl and human elements of pr=cadtzction.
Furthermore) the inability to
optimize the e:t icie.Ãic = of any or all machinery and/or natural resource
inputs, leads to
artificially or unnecessarily. high costs for goods and services that are
dependent c_ an the use
of equipment anti /or land for their acquisition, processing, or production or
an
underestimation of operational and input costs and the impact of the work
ez=zvironmcnt on
said costs.
11(. 1 is a flow chart showing information flow, In 1-1G. 1. environmental
monitoring 12 is performed. Operator monitoring, 14 and equipment monitoring
16 are
also performed.. These steps ,generate data w vhich is used for analysis and.
reporting 18.
The en 'ircynmentail nmzoonitorthg 12 may include, bttÃt is not limited to,
collecting, aerial
imagery data 19, topographical data 20, and atmospheric data 2 1. The
operation
monitoring 14 may in Jude. collecting video data 22 and operator biometrÃc
data. 24. .1 lee.
equipment monitoring 16 ma.- include collecting machine operation data 28.
and.
electronically tagged resource da W 26. The electronically t. g<-ed resource
data 26 may
include. data regarding the presence or proximity of electronic: tags
associations with
individuals or other rÃmaach.ines or equipineiat. 1'he analysis and reporting
may provide for
prodsÃcdt -,it reporting for the Maachine or operator as well as operating
coast reporting,
2 ? expense reporting, acid/o = expected revenue reporting. GIS data 29, which
may include
UPS or other location data and ttÃnaanciatl data may be input into the
analysis and reporting
16.
FIG. 2 is a block diagram illustrating one embodiment of a system for the
present
invention. In FIG. 2, an onboard computer 100 is shown. The onboard computer
is
,?t) associated with aiÃa aarticle of machinery or piece of equipment or
other.t aachine, A
geographic information system (G1S) application 1t)1 may be stored. in a.
computer readable
stoara~ge medium and executed on the on:hoard computer 100. `['.he onboard
computer 100
6
CA 02766815 2011-12-23
WO 2011/002707 PCT/US2010/040183
allows fir the input of operating and input cost, fixed and/or variable,
revenue rates.
actual or theoretical., as well w s, the collection or use of various types of
data collected from
various sources, including a UPS '116. The data collected may relate to an.
operator, an
erav i.rom.neut, a inaachine, or a natearaal. resource, In addit:iona, a
Financial analysis application.
or engine 111 may be stored in a computer readable storage medium and executed
on. the
onboard cornputer 100 or orn as remote computer 122',. The financial analysis
e a<gi.ne 111.
may be a separate software application from the GI S application 10 1 -
Alternatively the
f naanciaal analysis engine 1.1 I may include accounting functions which are
per-forrned by or
integrated into the 64S application 10 1. Examples of financial functions may
include,
without limitation, machine costs for performing a machine operation, machine
costs over
time/area or per unit tit ie./area., fuel costs for performing particular r
iaa:chine operations,
thel costs over time/area or per unit time /area, revenue associated with a
particular machine
operation., revenue over time/area or per unit time/area for performing a
machine operation,
comparisons of actual costs with optimal costs, comparisons, of actual costs
associated with
budgeted costs, and any number of other functions. Additional financlal
analyses may
pertain to, but not be limited to. costs/revenues incurred/generated by. the
natural resource
itself. In addition, a productivity Gap lication or engine l 1.3 nine be
stored in a computer
readable storaage irmedium arrnd executetd on the onhoairti comlputer 100. The
productivity-
engine 1 l 3 mmtmayhe a sepatraÃe soflware aapplicattion. from tlr.e f_1.1S
application 101.
?0 Alternatively, the productivity engine 1 1 3 may include productivity
functions which are
perforn:med b-vor irnte..rated into the t'i f S' aa.pplicaaiotn 101. ,
Examples of productive ity
functions may include, without limitation, number of particular machine
operations
performed within a period of time. comparisons because the.. number of
particular T.1-machine
operations performed within a period of time and optimal or expected or
estimated
numbers of machine operations to perform with a particular amount of time, and
any
number of other functions. Production data may pertain, but not be limited to,
yield/ output
of the natural resource itself, Prodtrctivity..funct.ions may relate to the
number of machine
operations, the work path of a machine, the size, weight, or volume of a load
associated
with a machine operation, or Others parameters including those related to the
machine
operation sensors 11.0, the environment sensors 1t)5. the w veaather data
1113, the audit /video
sensors 104, the biometric sensors 106, or the tag reader 108.
7
CA 02766815 2011-12-23
WO 2011/002707 PCT/US2010/040183
As shown in FIG. 2. rnaap data may he stored in as GIS database 102.
Siniilaarly,
r eather data Ãi .ay be stored in the (:15 database 103. Each of these sources
of data is
accessible by the onboard computer 100, In addition, environmental sensors 105
1-nay be
electrically connected to the onboard computer 100 to collect additional env-
iron rental
data.
Also, environmental sensors 105 may be electrically connected to the onboard
computer 100. The environmental sensors 105 may be used to measure geological.
hydrological, and/or aatmospheric parameters influencing the per:Ãormanee, aÃ
d thencc, the
operational and input costs of a piece of equipment operating on a. natural
resource as well
as the natural resource itself.
In addition, machine operation sensors 110 may he electrically connected to
the
onboard computer 100. The machine operation sensors may be associated with the
state of
the naaehine. A bus module 112 may electrically connect the ouboaard computer
100 to a
machine 114. The connection of the bus. module 112 allows for monitoring of
activity
associated ti th machine operations 114 which ultimately :impact the
profit/loss model of
operating a particular piece of equipment within a given w =or1 environment or
a natural
resource itself.
A financial analysis engine I I I may be stored on a computer readable storage
medium accessible by the onboard computer 100. hue financial analysis engine 1
1.1. ma
use cost/revenue inputs 125 input by a user or acquired from another computer,
software
sz: ste;rrm, or otherwise.
Other systems which may he electrically connected to the onboard computer 100
include a (IFS 116. A display 118 is electrically- connected to the onboard
computer 100.
A wireless transceiver 120 may also be electrically connected to the onboard
computer 100
to send and receive data, such as to other equipment or to a remote site.. o.r
further data
collectic rr anc1; car rnatl~ si . A mass data storage device 121 which may
include removable
storage is also electrically connected to the onboard computer 1.01.
A remote computer 1.22 with a productivity and financial analysis program(s)
1.23 is
also shown. Although the computer 100 maÃry include a productivity and
financial analysis
; 0 Programs l,. tile Present rte e.n:t: on contemplates that further analysis
t taay he performed by
the remote computer. The remote computer 122 may- he in operative
communication with
a database 121 for storing collected data and.lor the analysis of collected
data. Data may
8
CA 02766815 2011-12-23
WO 2011/002707 PCT/US2010/040183
also be transferred. to the remote computer manually through the use of a in
external data
storage device.
The present invention provides for the recording, aÃtalysis, evaluation, and
modeling ofnt-iaÃD," Or all of the factors a.fl ctin g: operational
profitability ofequipnaent and
employee production and/or output as well as evaluating the actual
productivity of a single
or collective group of rr achine.s, the operators., or the natural resource
itself. FFurthermore..
the present invention may be used to not only monitor, but also to enhance the
potential
and tactual output and/or ef'fleieney of said equipment, operators, and/or the
natural
resource. thus improving the operational cost parameters of a g.Ãven
production system
I 0 performing management activities on a natural resource.
The present invention allows a direct or indirect interface between the
internal
Operating systems associated with the functions performed by a specified piece
of
equipment in addition to monitoring production inputs while recording
corresponding
external factors which may include but not be limited to oeolooical,
hydrological. or
atmospheric conditions and perform real.-time cost analyses of the
aforementioned
production parameters against the known production and input costs, both fixed
and
variable.
The present invention niaav incorporate the ability to input and displw', all
available
geospatial and environmental information associated and contained within a
specified area.
This information t iaay includes, without limitation. geographic., hydrologic,
atmospheric
data and/or laand cover, This information may be interacted with by both. the
machine and
r r
its operator in order to enhance and document productivity and profittability
as it relates to
the dynan-mie factors influencing production and prof- is and analyzed against
all known
production and input costs to develop profit/loss or break-even models and./or
estimates.
?? The present invention allows for the sending of all recorded events and
activities in
either a manual data transfer or "real-time wireless" fashion to a remote
server or computer
for viewing and analysis. The analysis of profitability and/or productivity
may occur on
the remote computer system or as an internal function of the machine based
system.
The present invention contemplates numerous teaature.s. l xamples of such
features
may :include
On board operator & equipment. interface with all available geospatial
information
aassociated with a specified work area.
9
CA 02766815 2011-12-23
WO 2011/002707 PCT/US2010/040183
^ The input and monitoring of any or all production and input costs, both
fixed and
variable, along with known or prede.terrmnine.d environmental factors which
would
influence the operational costs such as maintenance and depreciation and
analyze
said variables against tachometer time as well as production performance data
to
develop profit/loss or break-oven models. Ãn for estirmates. The
aforementioned
analysis results being available in. real-time oz the machine. or remotely.
0 "le af-train:" documentation and mapping of actual and specific equipment
acti.vit.ies and relationship to all dynamic production.factors and analyzing
therm
against production and np t costs. both fixed and variable:.
1 tt c ' Renal time" data log, which may he used for determining the "
actuaal"
operating and input costs and protitability> of equipment with regards to the
per formaarnce of the .x act task for which said equipment was designed vs.
actual total time of operation over any pre or post determined period of
ti.rnme. Additionally the system would record all external and internal
factors
associated with the machine:, the job site and/or the operator as it reh tes
to
the profitability at any given time or event.
On screen or remote display alnd, or reporting of estimated or actual
production and
input costs and profitability liar utilization by equipment!natural resource
owners/operators in determining current profit.loss or break-oven levels.
20 * Real-time" owner/operator awareness ofprofitability goals vs. actual prof
t/lo;ss or
break-even parameters and the ability to note factors affecting aeftial
profitability Lis
they occur through on screen notes that correlate to a geographic location and
time
for not only machinery but also the natural resource being managed which
includes
but is not 1. mited to agricultural crop production arid forest products.
25 0 "Real-time" wireless and manual transfer of all available data between
all
operational aspects of natural resource management which may Ãnclude, but. not
be
limited to, equipment operations, supervisory= personnel. logistics
activities. and central land management databases `tech that each transfer
updates the impact of
each Operation on Profitability, whether it relates to .machinery, natural
resource
30 production and/or supervisory activities.
CA 02766815 2011-12-23
WO 2011/002707 PCT/US2010/040183
^ Wireless electronic reconciliation of paperwork aassociaa eel with
operational and
input costs and . processes through the, uses o : all associated natural
resource
infornaaatrcrn.
= `l. lae system will al low for the . put,'aneorporation of productiion.i!")
er atÃozn:a l costs
and/or revenue from operations associated with a particular natural resource
performed by machiner y-.not equipped with the present invention,
`l he present invention provides a fully integrated system, which may be
interfaced
with an hand aaraaaagemernnt and/or unnatural resource database being utilized
to record.
document, and store any event or activity that has or will transpire with
regards to any
specified parcel or collective parcels of land, along with their associated
natural resources,
This information may then be used to create a new level of productivity and
profitability
modeling as it pertains to the impact of the dynamic factors associated with
the production.
prcduc.ticity, and pr afitaahilaty of a specified Unit or group of units
uf`ecfuipment (such as
dozers, excavators, tractors, sprayers, harvesting equipment etc..) operators,
aand'or natural
resource which may include, but not be limited to, agricultural and forest
lands.
'I he documentation and modeling of the correlation between all production
variables and respective activities and the associated cost of operations may
be utilized for.
but not limited to the following:
0 '.'Real-time" profit/loss or break even aanaalysis of-equipment Operations
and\or
natural resource production.
0 Appropriate equipment selection or designs to increase productivity and
profitability as well as appropriate naataara l resource production management
input section .f 3.r a s: laxi.rn.izi.ng optiarriziaag productivity and
profitability.
* Developing theoretical models for profitability individually or as
collective
groups of equipment or parcels of natural resources on any given task Or input
under varying operational conditions.
The invent on may be further used to renicately monitor and manage changing
profitability levels and output of eeluipment. operators, and/or natural
resources for the
purposes of improving and making management decisions. Stated management
decisions
may be in reference to production practices on said. natural resource.,
enrployec
performance and . compensation, machine selection, performance.. and/or
replacement, job
11
CA 02766815 2011-12-23
WO 2011/002707 PCT/US2010/040183
ion and costing, and environmental impact documentation.
-elect
The present invention provides a new approach to the collecting, processing,
arid
r-taodeling of information as it pertains to the events that transpire. during
the interaction
betti, een machines, laeople, and n.ataraal. resources. The present invention
provides the
ability to easily, quickly. and fully input, collect and analyze individual or
combinations. of
f ac: ors that continually affect profitability and productivity of people,
machines, and
natural resources as. single units of production or as- a collective <group.
Furthermore, the present invention provides the ability to enhniee the
profitability
analyses concern-i g environmental management in ways previously not possible
without
significant direct human interaction through observation, documentation, and
analysis.
,Additionally.. the invention provides the ability, tto Monitor as well as
perform the stated
tasks and analyses in a " real-time ' fashion either on site for the benefit
of the machine
owner operator or remotely for manaLgement or production purposes.
Examples of benefits provided by the present invention may include, but are
not
limited to
= Improved equipment- design and rnanufrac.tiari.ng throa.tgh a. better
understanding
of all variable elements that can and do impact equipment productivity and
profitability aat my specified period of time while perforrnin any specified
task.
= Improved efficiency- and profitability through the elimiraaat
on.`redluctioÃnr Of
subsequent data collection (costs) and ,analyses used for profitability
'analysis
= Improved productivity and cost opti.m aation for optimizing production and
profitability by increasing outputs both. from machinery and the mituraal
resource
(such as a4griculturaal crop production and forest mani7gL ment) being managed
as
wwell as reducing the off art require(] to d .ternmine tap--to-date
profitability levels
FIG. 3W, ;`alb, 4A, and 413 provide examples of screen displays showing
productivity
reportflig_ of :iraforrta atiisÃ~ aassociaated with the present iÃavention.
The productivity .reporting
may be performed using an onboard computer on a machine or may be provided at
a
remote loeaaton.
FIG. 3A is an example of a screen displaww, showing a report on bulldozer
efiicienc
aas affected by, soil texture and soil moisture. Note that in FIG. 3A, there
is a demonstrated
relationship between soil moisture acid soil texture and the efficiency of a
bulls oze.r. 13y..
1m
CA 02766815 2011-12-23
WO 2011/002707 PCT/US2010/040183
capturing soil moisture and soil texture information for a work site, the
productivity of a
bulldozer operator can be better measured, monitored., and naodele:d.
FIG. 3B is an example of a screen. display showing g a chart à n bulldozer Ã
pe:Ã tin
costs as measured :in dollars per tuner. Some of the differences in the o
crating Costs may
be explained by changes in the soil and/or terrain a associated with a.
project, the manner in
which the operator operates the bulldozer, and other factors. The dotted line
it 114G. 3113
illustrates an optimal or desired cost level a Which may take into account
changes in the soil
and, or terrain associated with a project and other environmental actors such
that the
primary remaining contribution to operating, costs is operator efficiency.
Display= ng the
screen display of FiG, 38 on a display associated with the bulldozer such a
display
associated with an onboard computer a] low's the operator to monitor their own
productivity
and potentially make changes in their operation of the bulldozer to improve
productivity.
It also provides a meaningful and objective target for the bulldo er operator
and reminds
them how there use of the bulldozer impacts the operating cost, hi addition,
this
information (or .reports generated from dais nformaaticaà raaay be reviewed by
those
managing the, bulldozer operator to provide one form of objective assessment
of the
performance of the bulldo er operator.
FIG. 4A is an example of a screen display of timber harvesting efficiency as
a.lfected by percent slope. Note that where there is no slope, timber
harvesting efficiency
highest. Where. there. is a 9 percent slope, timber harvesting is least
e.ffiÃcient. By capturing,
this e..laitionship, the productivity and profitability of partictil ar timber
haivd: sting
operations may be better measured. monitored, and modeled.
FIG. 4113 is an example of a screen display of timber hairvesri.n., revenue
over time:.
in the example of 11G, 413, initially the timber har estit g may take place at
a. fat area and
then the timber harvesting continues on a sloped area. The revenue in dollars
per ton.
decreases for the sloped aareaa Displaying the screen display of FIG. 4f on a
display,
associated with timber harvesting equipment (such as a display associated with
an ortboaard
computer of timber harvesting equipment) alloys the operator to monitor the
revenue as it
related to their operation on the equipment. Having this information available
to the
3(I operator encourages them to operate in a manner which generates more
revenue and to
appreciate the effect of their work on revenue. In addition, this information
(or reports
13
CA 02766815 2011-12-23
WO 2011/002707 PCT/US2010/040183
generated from such information) may he reviewed by those managing operations
to
evaluate the operator- or other aspects of the limber harvesting operation.
ITIG. 5 is a t__I1)AR image which is indicative of productivity o -,.'era
specified
,e:ograaphic aa:rea. I:}ifterent colors may be used to i.rrdic.aaw 1 roducti
6ty. For example, blue
may indicate a low production area, yellow may indicate a. i he:r production
area.. and red
na ay itrdreaate the highest production area. Production .may he measured with
.respect to
particular machine operations, or paartiearlar operators. This information
may, he used by
managers on-site, or off -site at the time of operation or at a later time. `I
his infonaaation
may also he made available on onboard systems of equipment so that different
operators
may monitor the productivity of the geographic area in which they are
operating, have
operated in, or may operate within.
FIGY. 46 is an example of a screen display illustrating real-time
profitability
monitoring fir a btulldozer. The screen display shown in lFI G. 6 may be
provided on a
display associated with an onboard computer of a bulldozer or on a computer
remotely
connected to the bulkdo er, The information ;shown on the screen display t
aaay include a
map and corresponding GIS information. Note that in FIG. 6 information
regarding soil
texture (sash as sand. lown, or clay) is provided. In addition, a chart
indicative of doll rs
per hour for fixed. costs, variaable costs, and revenue is provided. A gage is
provided
illustrating fuel consumption in allons per hour, in add] tion. a gage
illustrating
undercarriage. wear rate is provided. Also, a gage is shown which indicates
pitch and roll
associated with the bulldozer. Also present is a prefect clock, an equipment
identifier-., and
an operator identifier. Of course additional ntorrnaation pertinent to the
operation may also
he provided on the screen display. In operation. ,an operator will have access
to
information which may be used to assist in increasing productivity. and/or
rofitability.As
previously explained, di.{Terences in soil texture may affect prodLictivity
and profitability.
When an operator has this and other information aa,vailahle to them, they will
be able to
better monitor and improve their own productivity and profitaahil.ity. Data
collected may
also be made available in the firm of reports or other analysis to those who
are evaluating
the performance of the operator.
;3(I I ICi.7 is an example of a screen display illustrating real-time
profitability,
monitoring fir agricultural operations. The infiornaation shown on the scree
ii display may-
include a map and corresponding (SUS information. Note that in I IG. 7 i.n.f
rrrnation
14
CA 02766815 2011-12-23
WO 2011/002707 PCT/US2010/040183
regarding soil texture (such as sand, loam, or clay) is provided. In addition,
a chart
indicative of dollars per acre for fixr d costs, variable costs, and input
costs is provided. A
uaaut. is provided illustrating fuel consumption in gallons per hour. A gage
illustrating
ln.eel/track slippages is also provided. Of Course other sensors for Ã
0.flitor:in g machine
operation may also be present an 1. where used and relevant to the
productivity or
prot tabil.ity being measured, gages or other displays .for these sensors m ay
also be used. A
data summary is also provided which such information as product being used,
target rates,
actual mates, applied acres, bounded acres, swath, speed, applied product, and
cost, Also
present is data indicative, of an equipment ide.nntitier, a cropt a =a arias,
an operation. and an
operator. Of course additional inÃiarmaation may also be provided on the
screen display as
is pertinent to the operation.
FKJY. 8 is an example of a screen display illustrating real-time
profitability,
monitoring for agricultural harvest. The, information shown on the screen
display may
include a map and corresponding CIS information. Nate that in FIG. 8
information
re cording soil texture (such as ,,and, loam, or clay) is provided. In
addition, a chart
indicative of dollaars per acre for fixed costs, variable costs, and input
costs is provided. A
gage is provided illustrating fuel Consumption in gallons per hour. A gage
illustrating
break-even price based on yield. A data summary is also provided w Mete such
information
as average yield, current yield, harvested acres. bounded acres. swath, speed.
and amount
has ested. Also present is data indicative of an equipment identifier a crop,
a variety, all
operation, acrd an operator, Of course additional information may also be
provided on the
screen display as is pertinent to the operations.
Although embodiments shown have focused on .natural resource manaaoci-rent
which is primarily land-based (stÃch as applications associated with forestry,
construction),
it is to be further understood that the natural resources m av include water
bodies as well,
includin<g, but not limited to streams, rivers, ponds, lakes or oceans.
Therefore, methods and systems for nionaitoring and analyzing productivity,
proftability, or revenue of a machine, its operator(s), and/or a natural
resource has been
disclosed. Although various examples are given, the present invention is not
to he limited
;3(1 to the specific types, of machine. t pes catecltripÃaac tat. or types of
analysis, or natural
resource Production, but rather the present invention contemplates numerous
variaationas,.
options, and alternatives.